



Abstract
This study reports an exploratory analysis of the acoustic characteristics of second language (L2) speech which give rise to the perception of a foreign accent. Japanese speech samples were collected from American English and Mandarin Chinese speakers (n = 16 in each group) studying Japanese. The L2 participants and native speakers (n = 10) provided speech samples modeling after six short sentences. Segmental (vowels and stops) and prosodic features (rhythm, tone, and fluency) were examined. Native Japanese listeners (n = 10) rated the samples with regard to degrees of foreign accent. The analyses predicting accent ratings based on the acoustic measurements indicated that one of the prosodic features in particular, tone (defined as high and low patterns of pitch accent and intonation in this study), plays an important role in robustly predicting accent rating in L2 Japanese across the two first language (L1) backgrounds. These results were consistent with the prediction based on phonological and phonetic comparisons between Japanese and English, as well as Japanese and Mandarin Chinese. The results also revealed L1-specific predictors of perceived accent in Japanese. The findings of this study contribute to the growing literature that examines sources of perceived foreign accent.
1 Introduction
1.1 Studies of second language (L2) speech
It has been well documented that unless we begin to learn a foreign language by the age of 6 or 7, most of us will retain a discernible accent, however fluent we might otherwise become (Oyama, 1976; Patkowski, 1994; Scovel, 1969). Understanding the nature of foreign accents is important because the perception of an accent can lead listeners to think that the speaker is not understandable, even when the message is accurately conveyed (Munro & Derwing, 1995), and also because accented speakers may be judged as less credible than non-accented speakers, even when they are conveying the same message (Lev-Ari & Keysar, 2010).
Forty years of research in the field of L2 speech learning have led us to a better understanding of foreign-accented speech (Flege, 1999; Munro & Derwing, 2011, 2015; Piske, MacKay, & Flege, 2001). A broad range of speaker characteristics has been examined, and many studies converge in demonstrating that the onset age of learning and length of residency in the community where the language is spoken exert a crucial influence on the development of a foreign accent, whereas studies are inconclusive about the influence of other factors, such as gender, formal instruction, and motivation (for a review, see Munro & Derwing, 2011; Piske, et al., 2001).
In addition to understanding the influence of speaker characteristics on L2 speech learning, it is also important to understand what acoustic components of non-native speech influence the perception of a foreign accent. Whereas the investigation of speaker characteristics (e.g., onset age of learning) may deepen our understanding of the possible cause of a foreign accent, an acoustic investigation helps us better understand what it is that we call a “foreign accent” in the first place.
A number of studies investigating intelligibility, comprehensibility and accentedness of L2 speech (Derwing & Munro, 1997; Munro & Derwing, 1999) have revealed interesting patterns. For example, Derwing and Munro (1997) found that native English listeners, while accurately identifying the content of L2 utterances (thus the L2 utterances were “intelligible” to the listeners), judged the same utterances to be “incomprehensible” and/or “foreign accented.” While comparison of these aspects of L2 speech reveals important issues of perception and judgment, the current study focuses on perceived foreign accent and its acoustic sources. We were motivated to focus our research on the question of foreign accent because native listeners’ harshest ratings of L2 speech seem related to accentedness (Derwing & Munro, 1997), and perceptions of accentedness in turn seem to be related to judgements of reduced intelligibility and truthfulness of the information conveyed (Lev-Ari & Keysar, 2010). Investigating the acoustic sources of foreign accents will have important implications for L2 speech learning and teaching. In this paper, the term “foreign accent” is used when referring to the general idea and phenomenon of foreign accents, whereas “accentedness” is used, following the prior literature, when referring to degree of a foreign accent and the state of having a foreign accent. 1
1.2 Studies of foreign (L2) accent
The findings of previous studies regarding the acoustic sources of perceived foreign (L2) accents vary considerably, likely reflecting the various research methods employed and the various native and target L2 languages investigated. Some found that a vowel feature, but not a consonant feature, among segmentals affected perceived accent (Wayland, 1997, examining L2 Thai by L1 English speakers). Others reported that not only segmentals but prosodic features too affected perceived foreign accent (Munro, 1995, examining L2 English by L1 Mandarin speakers; Trofimovich & Baker, 2006, examining L2 English by L1 Korean speakers). Yet others have suggested that perhaps prosodic features affect perceived accent more strongly than segmentals do (Wayland, 1997; Anderson-Hsieh, Johnson, & Koehler, 1992, examining L2 English by speakers of various L1s; Kang, 2010, also examining L2 English by speakers of various L1s; Trofimovich & Isaacs, 2012, examining L2 English by L1 French speakers). And some researchers have reported that segmentals influence perceived foreign accent more strongly than prosodic features do (Jilka, 2000, examining L2 German by L1 English speakers; Sereno, Lammers, & Jongman, 2016, examining L2 English by L1 Korean speakers; Winters & O’Brien, 2013, examining L2 English by L1 German speakers).
Some of these divergent findings may be due to the different methodologies employed in the studies. It is also possible that acoustic sources of learners’ accents may change in the course of learning a language. In other words, acoustic features that cause a perceived foreign accent may differ between beginning learners and fluent learners (e.g., Isaacs & Trofimovich, 2012; Saito, Trofimovich, & Isaacs, 2017). However, it is also possible that the acoustic sources of a perceived foreign accent have a differential influence depending on the target L2 and learners’ L1s, as L2 speech learning is influenced, at least initially, by the acoustic and perceptual relationship between learners’ L1 and their target L2 sound systems (Best, 1995; Flege, 1995). Accordingly, at least some of the acoustic features that may give rise to a perceived foreign accent may be predicted by comparative analyses of learners’ L1 and the target L2. Not many studies of foreign accent are based on careful phonological analyses of L1 and L2. To address this gap, this study attempts to provide a comparative analysis of the participants’ L1s and their target language (see the next section). Furthermore, the majority of studies of foreign accent have examined English as the target L2 (see reviews in Munro & Derwing, 2011; Piske et al., 2001). Examination of languages other than English may provide new insights into our understanding of L2 foreign accents, or may converge with studies on English, suggesting that foreign accentedness is essentially a cross-linguistic phenomenon. To this end, the current study focuses on Japanese as the target L2, a language that is less frequently the focus of studies on this topic, with two groups of learners, L1 Mandarin learners and L1 English learners.
1.3 Japanese as the target L2
The Japanese vowel inventory includes five distinctive vowel qualities /i, e, a, o, ɯ/ (Maddieson & Disner, 1984; Nishi, Strange, Akahane-Yamada, Kubo, & Trent-Brown 2008; Vance, 2008), with all five contrasting in quantity (e.g., short /i/ vs. long /ii/). English and Mandarin have more complex vowel systems. English is considered to have 11 nonrhotic monophthongal vowels /i, ɪ, e, ɛ, æ, u, ʊ, o, ɔ, ʌ, ɑ/ (Gay, 1970; Hillenbrand, Getty, Clark, & Wheeler, 1995). Commonly accepted analyses of the Mandarin vowel inventory include five /i, y, ə, a, u/ (Lin, 2007; Mok, 2012; Wiese 1997) or six /i, y, ə, a, ɤ, u/ monophthong phonemes (Chen, Robb, Gilbert, & Lerman, 2001; Howie, 1976; Jia, Strange, Wu, Collado, & Guan, 2006; Lin, 1989; Sun, 2006) and numerous allophonic variations for the mid-vowel /ə/, including [e, ɛ, (ɤ), ɔ, o].
Here we have a situation in which learners with large and complex L1 systems are learning an L2 that has a simpler vowel system, which may facilitate L2 vowel learning (Iverson & Evans, 2009). L2 learners are thought to use their L1 sound categories to process or produce L2 phonemes, at least at the outset (Best, 1995; Best, McRoberts, & Goodell, 2001; Flege, 1995). As applied to this study, many of the L1 American English (/i, e, ɑ, o, u/) and Mandarin vowels (/i, a, u/ and [e, o] as allophones of /ə/) may serve as initial vowel categories for the Japanese vowels. However, one notable feature often discussed in the literature is the tendency for the Japanese /ɯ/ to be produced in the central position as opposed to the back vowel /u/ (e.g., Vance, 2008).
The Japanese consonant inventory is also uncontroversial. It has the same number of sounds in stops as English and Mandarin, and has fewer numbers in fricatives, affricates, and sonorants than English and Mandarin. Like vowels, voiceless obstruents contrast in phonological length with singleton (e.g., [p]) and geminate (e.g., [pp]) obstruents. Seen in this way, Japanese consonants, like vowels, seem to present a fairly straightforward learning task for L1 English and L1 Mandarin learners. However, it has often been noted that Japanese stop voicing categories are slightly at variance with the typical short-lag versus long-lag voice onset time (VOT) distinction (Kong, Beckman, & Edwards, 2012; Riney, Takagi, Ota, & Uchida, 2007; Vance, 2008). While Japanese voiced stops /b, d, g/ have short-lag VOTs like many other languages, its voiceless counterparts have relatively shorter VOTs (e.g., 29–57 milliseconds (ms), Riney et al., 2007), substantially shorter than long-lag VOTs in English (42–70 ms, Klatt, 1975) or Mandarin (70–100 ms, Chao & Chen, 2008; Chen, Chao, & Peng, 2007; Liu, Ng, Wan, Wang, & Zhang, 2007). Here, L1 influence may result in VOT that is too long for Japanese voiceless stops, a point often noted in the Japanese pronunciation instruction literature (Tanaka & Kubozono, 1999; Toda, 2004).
In contrast, Japanese, English, and Chinese differ more markedly in terms of prosodic systems. Japanese is characterized as a mora-timed language (Homma, 1981; Port, Al-Ani, & Maeda, 1980). In contrast, English is a canonical stress-timed language, and Mandarin is characterized as syllable-timed (e.g., Grabe & Low, 2002). In addition, L1–L2 differences in syllable structure have been shown to affect L2 speech learning (Cheng & Zhang, 2015). The difference in unit structure, mora for Japanese and syllable for English and Mandarin, relates to differential durational implementation. For example, while /e.e.ga/ (“movie”) has two syllables, it has three moras, and while /to.sho.ka.N/ (“library”) has three syllables, it has four moras. Applying stress-timing (e.g., English) or syllable-timing (e.g., Mandarin) to Japanese may result in non-native-like shortening of some mora durations (i.e., a mora in a heavy syllable).
In standard Japanese, the tonal pattern is realized with each mora carrying a high tone (H) or a low tone (L), and pitch accent is realized as a sharp fall from a high tone to an immediately following low tone (Vance, 2008). 2 Pitch accent, realized solely by pitch, thus differs from the metrical structure of the stress accent (e.g., English) (Hyman, 2009), which typically correlates with duration, intensity, and pitch (Beckman & Pierrehumbert, 1986). Pitch accent is similar to the tonal system (e.g., Mandarin) in that pitch variation alone gives the tonal structure (Hyman, 2009). For L1-Mandarin learners, the tonal system in their L1 perhaps facilitates the learning of the Japanese pitch-accent system. If L1-English learners, on the other hand, rely on their L1 stress-accent in L2 Japanese production, this would result in a non-native-like use of duration and intensity in marking pitch accent.
In summary, comparison of Japanese, American English and Mandarin segmentals suggests that L1-English and L1-Mandarin learners may have an advantage in learning Japanese segmentals, as the Japanese segmental inventory is less complex than those of the learners’ L1s. Although there are some sub-phonemic differences (i.e., the vowel /ɯ/ and VOT in stops), the learners’ L1 segments map fairly straightforwardly onto L2 target segments, and could, at least initially, facilitate the perception and production of L2 Japanese sounds. English and Mandarin contrast in a more marked way with Japanese in the domain of prosody; both English and Mandarin are different from Japanese in terms of timing mechanism, and English, in addition, departs further in terms of accentuation patterns. On the basis of these comparisons, we predicted that: (1) the foreign accent in L2 Japanese production would be heavily influenced by prosodic features for L1-English and L1-Mandarin learners; and that (2) the foreign accent in L1-English speakers would be more strongly associated with Japanese tonal pattern than that of L1-Mandarin speakers.
1.4 Methodological considerations
Methodological choices adopted by studies of foreign accent have varied considerably over time, and the matter warrants some discussion here. One method of investigating the acoustic source of a foreign accent is to measure acoustic features of L2 speech and relate the acoustic measurements to the accent rating of the L2 speech provided by native listeners. This method is particularly well suited for uncovering acoustic sources of a perceived foreign accent in an exploratory approach (Anderson-Hsieh et al., 1992; Trofimovich & Baker, 2006; Wayland, 1997).
In this method, more detailed analysis of speech materials leads to stronger explanatory power. For example, conducting fine-grained acoustic analysis of consonants and vowels (e.g., vowel formants and VOT in Wayland, 1997) provides more detailed and informative results than an analysis that collapses the two domains (e.g., Anderson-Hsieh et al., 1992). As for prosody, while rating of speech materials with regards to the accuracy/inaccuracy of prosodic features has been widely used as an appropriate way to characterize prosody (e.g., Bosker, Pinget, Quené, Sanders, & De Jong, 2013), another approach may be to employ measurement-based characterization of prosodic features, which are now also available. We have seen the introduction of global linguistic rhythm measures (Dellwo, 2006; Ling, Grabe, & Nolan, 2000; Ramus, Nespor, & Mehler, 1999; White & Mattys, 2007) and a systematic framework for coding tonal patterns (e.g., Tones and Break Indices (ToBI) by Beckman & Hirshberg, 1994; Japanese ToBI (J_ToBI) by Venditti, 2005). The measures of global linguistic rhythm and tonal patterns have not yet been used extensively in the research on foreign accent.
As a method of eliminating segmental errors and allowing perception of prosodic errors without segmental influence, a number of studies have employed a technique of filtering speech samples. Low-pass filtering eliminates or degrades segmental information from speech samples while retaining prosodic information such as pitch and intonation, duration, and rhythmic properties (Munro, 1995; Trofimovich & Baker, 2006; van Els & De Bot, 1987). Such studies have shown that in the absence of segmental information, prosodic characteristics provided enough information for native listeners to distinguish native speakers’ speech from L2 speakers’ speech (Munro, 1995), and that some prosodic features, that is, pause duration and speech rate, exert a stronger influence on perceived foreign accent than others, namely pause frequency, stress timing and pitch peak error (Trofimovich & Baker, 2006). The current research has taken advantage of these methodological advances.
1.5 Aim and overview of this study
This study aims to explore potential acoustic sources of accent in L2 Japanese produced by learners of two L1s, English and Mandarin. Based on the cross-linguistic comparisons, we predict that prosodic features strongly affect the perception of foreign accent in these learners’ Japanese, and that the pitch accent may show a relatively stronger effect on English speakers than it does on Mandarin speakers.
The segmental features measured were vowel formants and stop features (please see below for more details). Stops were selected from the consonant inventory for several reasons. First, there is a notable and well-documented acoustic difference between Japanese and the two L1 languages, and it is known to affect L2 Japanese productions as discussed earlier. Second, while the measurement method and typical characteristics are well documented for Japanese stops, the same is not true for other consonants. Establishing and validating such acoustic analysis methods for the Japanese fricatives, affricates and sonorants would be beyond the focus of this study. For these reasons, we have chosen to investigate stops as one of the more likely sources of foreign accent. We recognize that this is not a comprehensive investigation of Japanese consonants. This limitation of the study is revisited in the discussion section. The prosodic features examined were global rhythm, tonal patterns, and fluency.
The acoustic features were then related to foreign accent ratings of the speech samples provided by linguistically naïve native Japanese listeners, in order to examine the relationship between the acoustic features and the accent ratings. We obtained accent ratings of the speech samples in two ways: by using a filtered version of the speech; and also by using a non-filtered version.
2 Methods
2.1 Participants
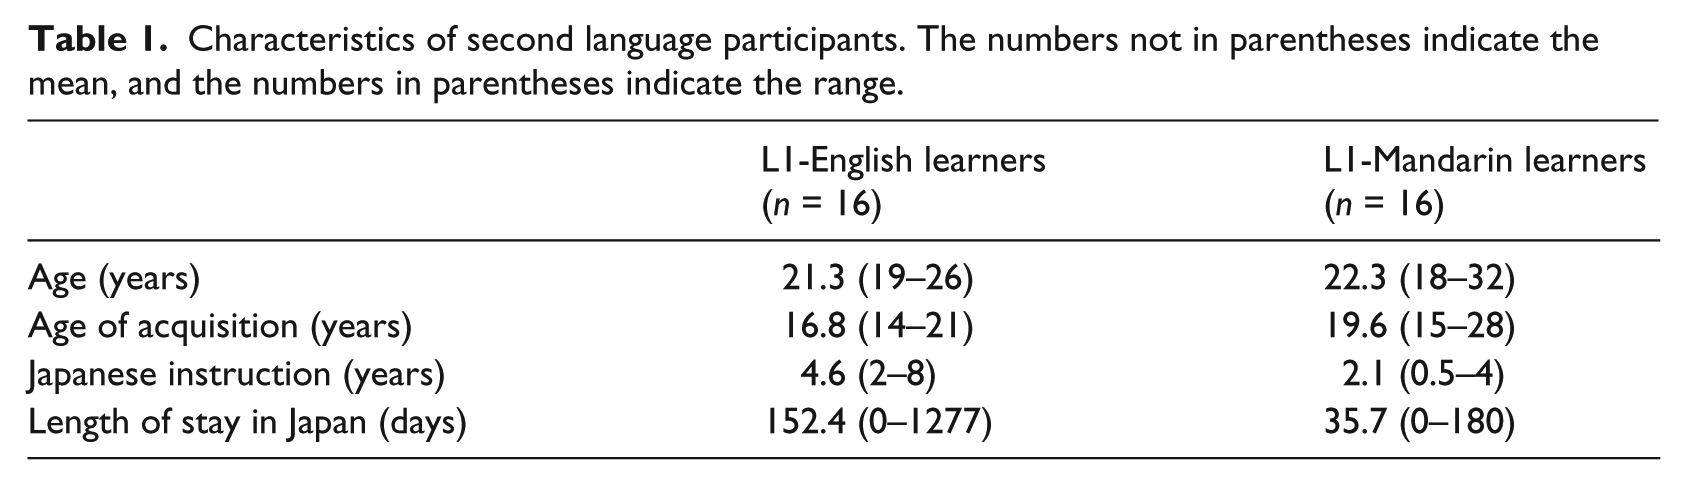
Sixteen L1-English learners (10 female and 6 male) and 16 L1-Mandarin learners (10 female and 6 male), as well as 10 native-Japanese speakers (3 female and 7 male) provided speech samples. All L1-English learners were native speakers of American English. 3 Among the 16 L1-Mandarin learners, 12 were from mainland China, and four were from Taiwan. All four Taiwanese participants reported exposure to Mandarin from birth and identified Mandarin as the most fluent language. The mean age of the L1-English learners was 21.3 (range: 19–26) and that of the L1-Mandarin learners was 22.3 (range: 18–32) (see Table 1). Seventeen of the learners (7 L1-English and 10 L1-Mandarin) were enrolled in a second-year Japanese language course at a university in the Pacific Northwest at the time of testing. Fifteen learners (9 L1-English and 6 L1-Mandarin) were either enrolled in a fourth-year Japanese language course or had completed the level at the same university at the time of testing. Learners were recruited from these levels so that the speech samples included a range of Japanese language abilities.
Characteristics of second language participants. The numbers not in parentheses indicate the mean, and the numbers in parentheses indicate the range.
All 10 native Japanese speakers who provided speech samples were from Tokyo. Their mean age was 21.1 (range: 20–22) and all were attending the above-mentioned university at the time of testing. Their average length of stay in the US was 12.8 months (range: 3 months–6 years). These Japanese speakers had no formal linguistic training or Japanese language teaching experience. All reported daily use of Japanese.
Additionally, 22 native Japanese listeners (14 female and 8 male) participated as raters in the foreign accent rating task. None of the raters provided speech samples. The raters were on average 21.8 years old (range: 18–35), attending the above-mentioned university or a nearby community college, and had been in the US no more than seven months at the time of testing. Seventeen of the raters were from Tokyo or its adjacent prefectures, where standard Japanese is spoken. The other five raters were from regions where regional dialects are spoken (e.g., Osaka). 4 Eleven raters (Rater group 1) were assigned to rate the L1-English learners’ and native Japanese speakers’ speech samples, while the other eleven raters (Rater group 2) were assigned to rate L1-Mandarin learners’ and native Japanese speakers’ samples. 5 Each group of raters showed high agreement in rating within the group, with the intra-class correlation coefficient r = 0.987 for Rater group 1, and r = 0.988 for Rater group 2.
2.2 Speech material
The test materials used to elicit speech samples comprised six short Japanese sentences (see Appendix). The sentences were chosen from a beginning level Japanese language course book (Tohsaku, 1995) for their length and comprehensibility, which were deemed appropriate for the participants, as well as for the range of segments included in them. These sentences included simple sentence structures. As often is the case for spoken Japanese, four sentences (1, 4, 5, and 6 in the Appendix) included a sentence-final particle, which may carry various intonational tones (e.g., high, rising). One sentence was a question. The lexical items in the sentences included both accented words (e.g., kurasu-wa (class-topic) HLLL) and unaccented words (e.g., nihongo-no (Japanese-possessive) LHHHH).
The L2 and native-speaker productions of the test sentences were collected using a delayed repetition task, an elicitation technique used in L2 research as a method that facilitates relatively natural production while maintaining control of the speech materials (Flege, Munro, & MacKay, 1995; Trofimovich & Baker, 2006). Two native Japanese speakers, a female (the first author) and a male, recorded six prompts for the task (see Appendix), each comprising a question–response–question sequence as in (1). In each sequence, the response is one of the six test sentences:
(1) Question (male): Nihongo no kurasu wa doo desu ka? “How is your Japanese class?”
Response (female): Tanoshii desu yo. “It is fun.”
Question (male): Nihongo no kurasu wa doo desu ka? “How is your Japanese class?”
As the example shows, the first speaker asked a question, followed by a response by the second speaker. Then, the first speaker repeated the question. The repetition of the response was not included in the prompt, so as to cue the participants to produce their own responses. This design allows elicitation of target utterances while avoiding immediate repetition of the model (Piske et al., 2001). The six prompts for the task were recorded in a sound booth using a flash digital recorder (Marantz PMD 670) and a standing microphone (Shure Beta 87) at a sampling rate of 44 kHz and 16-bit quantization. These two native speakers only recorded the task prompts and did not participate in the subsequent study.
2.3 Production task
The six recorded prompts were presented to participants auditorily, and participants were recorded producing the test sentences in response to the questions. Each participant was given two practice prompts, which were followed by the six test prompts in random order. Each prompt (question, response, and question) was presented three times consecutively. The recordings were conducted individually in a sound booth, the same setting used for recording the prompts. The experimenter (the second or the third author) was present in the sound booth during the recording to present the prompts using E-Prime experimental software (Psychology Software Tools, Inc.) and to ensure production of the target sentences. All measures reported in this paper were taken from either the second or third repetition of the target sentences. Typically, the third repetition was used, but if the third repetition included disfluency (e.g., wrong word or false start), the second repetition was selected.
2.4 Accent rating task
The selected speech samples, the second or the third repetition of L2 learner and native speaker productions of the six test sentences, were presented to native Japanese raters to examine the perceived accentedness of each production. None of the raters participated in the production task or in the creation of the production prompts. The raters rated both filtered and unfiltered speech samples.
A filtering technique was used to degrade segmental information, following earlier studies that used this technique (e.g., Anderson-Hsieh et al., 1992; Munro, 1995; Trofimovich & Baker, 2006). The speech samples collected (original speech samples) were band-path filtered at 700–1300 Hz, around the region of the second formant, and amplitude normalized to 75dB, resulting in a new set of speech samples (filtered speech samples). The application of a band-pass filter eliminated a portion of the frequency information; however, the speech was still intelligible and retained prosodic information intact. Band-pass filtering, instead of low-pass filtering, has been used to investigate speech rhythms, as the resulting signal retains the alternation of vocalic and non-vocalic intervals, critical information for the perception of speech rhythms (Cummins & Port, 1998; Tilsen & Johnson, 2008). The original speech samples were also amplitude normalized to 75dB.
The original speech samples were used to obtain accent ratings for speech that retains all acoustic information, both segmental and prosodic. The filtered speech samples were used to obtain accent ratings for speech that only retains prosodic information intact. Native speakers’ speech samples were included in the stimuli of the rating task, to serve as anchor samples in the task.
Eleven raters heard and rated a total of 310 stimuli (16 L1-English learners and 10 Japanese × 6 sentences × 2 sets (original and filtered), excluding two utterances that contained a lexical error or syntactic disfluency). Two utterances (produced by two different L2 speakers) were excluded from this experiment so that raters could remain focused on phonetic features rather than on errors arising from a wrong word or false start of a word. The same utterances were also excluded from the acoustic analysis. The other eleven raters heard and rated a total of 311 stimuli (16 L1-Mandarin learners and 10 Japanese × 6 sentences × 2 sets (original and filtered), excluding one utterance containing syntactic disfluency).
In the rating task, the native Japanese raters listened to each utterance and rated it on its degree of foreign accentedness. Prior to the task, the experimenter (one of the three authors) explained the task and verified that the participants understood what gaikokugo namari (“foreign accent”)—the term appearing on the experiment screen—meant and that it was different from regional accent. The experiment began with a practice block of four trials, two using original stimuli and two using filtered stimuli, in that order, so that participants understood the procedure prior to the test trials. The practice stimuli were different from the test stimuli. Within the test block, filtered stimuli and original stimuli were blocked, and presented in that order. Within each block, the stimuli were presented in a random order.
Each trial began with an auditory presentation of an utterance and the presentation of a visual analog scale (Urberg-Carlson, Munson, & Kaiser, 2009). Raters were then prompted to rate each utterance for degree of foreign accentedness by sliding the bar in the middle of the scale using a computer mouse. The leftmost point on the bar corresponded to the rating of “like a native speaker” and the rightmost point corresponded to “extremely strong foreign accent” as indicated in Japanese on the screen. Raters were instructed that they could drag the bar anywhere between these points according to their judgment of accentedness. An accent score between 0 and 100 was registered depending on where the bar came to rest between the two points (the leftmost point = 0, the rightmost point = 100). The raters had an option of listening to an utterance as many times as they wished by clicking the visual display. All raters completed the rating task in approximately 30 minutes.
2.5 Acoustic measurements
2.5.1 Vowel
The frequencies of the first and second formants (F1 and F2) were measured in short vowels, [i], [e], [a], [u], and [o], and in long vowels, [i:] and [e:], at the vowel mid-point, by using waveform and spectrographic displays in Praat 5.2.18 (Boersma & Weenink, 2005). The symbol [u] instead of [ɯ] is used in this section for simplicity. The vowel formants were then normalized to control for individual differences using the Lobanov method (Nearey, 1977; Thomas & Kendall, 2015), with the formula

As described in Thomas and Kendall (2015), “Fn[V]N is the normalized value for Fn[V] (i.e., for formant n of vowel V), MEANn is the mean value for formant n for the speaker in question and Sn is the standard deviation for the speaker’s formant n.”
2.5.2 Stop
The duration of closure was measured from the offset of the preceding vowel to the onset of the burst, and VOT was measured from the onset of the burst to the onset of periodicity in the following vowel. It was not possible to measure the duration of stop closure at the initial position in the sentence. In this case, only VOT was submitted for analysis. Also, it was sometimes difficult to determine if the silent interval before a VOT was a closure or a combination of closure and pause. A silent period longer than 100 ms was defined as a pause (Trofimovich & Baker, 2006), and a silent interval longer than 100 ms before a VOT was considered and coded as an interval including a stop closure and a pause. These were not submitted for analysis of stop closure duration. To normalize the closure and VOT durations against articulation rate, the ratio of closure and VOT duration to the average consonant–vowel (CV) mora was computed for each sentence and speaker. The normalized closure and VOT durations were then averaged separately for voiceless and voiced stops across six sentences for each speaker.
2.5.3 Global rhythm
The measures of global linguistic rhythm examined in this study were Varco∆V, Varco∆C, V%, and normalized pairwise variability index (nPVI) (Dellwo, 2006; Ramus, Nespor, & Mehler, 1999; White & Mattys, 2007). Varco∆V and Varco∆C are the standard deviation of vowel durations and consonant durations, respectively, in each utterance corrected for speech rate. V% is the percentage of the total duration of vowels in each utterance, and nPVI indicates the deviations of durations of vowels in adjacent syllables corrected for speech rate. These indices were measured in each test sentence and were averaged across six sentences for each speaker.
2.5.4 Tonal pattern
The J_ToBI (Venditti, 2005) was adapted to characterize the tonal patterns of the speech samples collected. Among a number of tone types and break indices described in J_ToBI, a subset of tone types sufficiently characterized the tonal patterns of the six test sentences we used in this study. Accordingly, the following tone types were coded: (1) lexical pitch accent (denoted as H*+L in J_ToBI) is an accentuation at the lexical level marked by a high tone immediately followed by a pitch fall; (2) an accentual phrase in Japanese is characterized by a rise and a fall in pitch across a phrase (e.g., daigaku-no “of the university”). The boundaries of the accentual phrase are marked by an initial low tone (%L) and a final low tone (L%); (3) pitch rises from the initial low tone to a high tone. This high tone typically occurs at the second mora in the accentual phrase (H-). If this second mora high tone coincided with the lexical pitch accent, it was marked as such; and (4) intonation boundary tones mark the end of the utterance. Three types of intonation boundary tones, rising (H%), falling (L%), and falling–rising (LH%), were observed in our speech samples and were coded. For the pitch accent and intonation measures, the patterns observed for the native Japanese samples were taken as the target patterns for each of the six sentences, including variation across the 10 native Japanese speakers. The first and the second authors, who are trained in phonetics, conducted coding of these critical tone types in 249 utterances (16 L1-English learners, 16 L1-Mandarin learners, 10 native speakers × 6 sentences, excluding three utterances that contained syntactic disfluency). When there was a disagreement, the two authors discussed the case till they reached agreement. The tone pattern of each L2 speech sample was then compared to the target patterns, and for each L2 tone that did not match the target tone(s), one error score was recorded. Again, the first and the second authors conducted the analysis separately and discussed discrepancies until they reached agreement. The pitch accent/intonation error score (“pitch error score” henceforth) was then tallied for each sentence and averaged across six sentences for each L2 speaker.
2.5.5 Fluency
Fluency characteristics may have an important role in perceived foreign accent (Munro & Derwing, 2001; Trofimovich & Baker, 2006). Three variables characterizing production fluency, that is, speaking rate, pause duration and pause frequency, were examined. Speaking rate, the rate of speech including the pauses, was computed by dividing the duration of each utterance, including the pause durations, by the number of moras of the sentence. A pause was defined as a silent period within an utterance that was longer than 100 ms (Trofimovich & Baker, 2006). Pause duration was computed for each speaker as an average of all pauses across six sentences. Pause frequency was the average number of pauses across six sentences for each speaker.
2.6 Analysis
Foreign accent ratings were z-score normalized for each rater. An accent rating score for the original and filtered speech was then obtained for each speaker (16 L1-English learners, 16 L1-Madarin learners, and 10 native Japanese speakers) as the mean normalized accent ratings averaged across six sentences and 11 raters, with a greater value denoting a greater degree of foreign accentedness. Rater group 1 and Rater group 2 rated the same set of native speaker samples. Accent scores of the native speaker samples did not differ across the two rater groups, p = 0.35 for the original samples, p = 0.61 for filtered samples. As the accent ratings of native speakers typically do not vary substantially, this is not an ideal test of similar rating patterns. Nonetheless, since both rater groups rated this subset of speech samples, we report a comparison of these ratings. These results suggest that the native Japanese raters reliably perceived some degree of foreign accent in L2 speech samples, and that the groups did not differ in the rating of native speaker samples.
We examined the question of how the acoustic characteristics of the speech samples explained the perceived foreign accent using regression analyses. More specifically, for each of the L1-English and L1-Mandarin speech samples (with each including the native speaker samples), two separate multiple regression analyses were conducted. The first analysis, prosodic analysis, examined the accent rating scores of the filtered speech samples as the dependent with prosodic features as predictors. The second analysis, full analysis, examined the accent rating scores of the original (unfiltered) speech samples as the dependent with both segmental and prosodic features as predictors.
Prior to the regression analyses, we examined the correlations between the accent ratings and each of the acoustic features to first understand the basic relationship between the dependent and predictor variables (detailed results are reported below). Only those factors that showed statistically significant correlation, at p < 0.05, were considered for the subsequent regression analyses. Also, as some predictor variables showed significant and strong correlation with the dependent, sequential regression was used to explore the effects of other predictors before the strongly correlating predictors were included in the model.
Some considerations were made to address the issue of small sample size (n = 26 in each data set) and the large number of acoustic features examined in this study. Researchers recommend that sample size be considered against the effect size (Larson-Hall, 2015 for review; Knofczynski & Mundfrom, 2008; Maxwell, 2000). Recent studies that modeled accent rating using phonetic predictors suggest a potentially large effect size for this type of modeling, R2 = 0.76 in Trofimovich and Isaacs (2012) and R2 = 0.41 in Kang (2010). According to the recommendation of Larson-Hall (2015), which is based on Cohen, Cohen, West, and Aiken (2003), 26 observations are needed for a regression equation with 10 predictors when the effect size is expected to be R2 = 0.50. In this study, the predictor variables were under 10 in each regression equation as a result of the procedure described above. In addition, a bootstrapping procedure (e.g., Larson-Hall, 2015) was used to implement a repeated sampling (1000 times) of the original data with replacement, fitting the model each time. This procedure ensures the robustness of the analysis and imparts a measure of accuracy to model estimates.
The statistical analyses were conducted using R version 3.3.1, and the WRS package (Wilcox & Shönbrodt, 2014) was used for the bootstrapping procedure. The relaimpo package (Grömping, 2006) was used to obtain the measure of relative importance of each predictor in the regression equation. Multicollinearity and redundancy of the predictor variables were considered using the variance inflation factor (VIF). The recommendations in the literature vary; however, a VIF greater than 4–10 seems to merit further investigation (O’Brien, 2007 for a review; Larson-Hall, 2015).
3 Results
As the summary of foreign accent rating scores show (Table 2), the scores of native Japanese speaker samples ranged below zero, indicating that they were all rated as being less accented than the mean. Preliminary t-tests showed that native Japanese speakers’ scores were significantly lower than the scores of L1-English learners’, p < 0.001 for both ratings of original and filtered samples (Rater group 1), and the scores of L1-Mandarin speakers, p < 0.001 for both ratings of original and filtered samples (Rater group 2). These results suggest that the native Japanese raters reliably perceived some degree of foreign accent in L2 speech samples. It is also noted that the range of accent scores for the learner group does not overlap with that of the native speaker group, either for the original samples or the filtered samples. This lack of overlap of accent scores across the learners’ and native speakers’ filtered speech samples seems to indicate that prosodic information alone could distinguish L2 accented speech and native speech, a finding also reported by Munro (1995).
Summary of foreign accent rating scores.

3.1 L1-English learners
3.1.1 Correlation analysis
A preliminary analysis examined bivariate correlation between the accent rating of the original samples and all acoustic measures, and between the accent rating of the filtered samples and prosodic measures. Table 3 reports statistically significant correlations. The pitch error score strongly correlated with the ratings, r = 0.87 for original samples and r = 0.92 for filtered samples, while other factors in Table 3 mildly correlated with the accent ratings. The high level of correlation has implications for the application of regression analysis, and this issue is addressed in the next section.
Segmental and prosodic features significantly correlating with the accent rating of the original speech samples (top), and prosodic features significantly correlating with the accent rating of the filtered speech samples (bottom). The mean values and standard deviation (in parentheses) are also provided for the L1-English learners and native speaker (NS) groups.

The L1-English learners made, on average, about one pitch and intonation error per sentence as the mean indicates (Table 3), and the learners who had a higher number of errors were rated as more heavily accented. The significant correlations between the vowel acoustics and the accent rating are illustrated in Figure 1. Front–back position, that is, F2, correlated with the accent rating for [i] and [e]: more fronted [i] and more central [e] were associated with a greater accent rating (“more heavily accented”). Vowel height, that is, F1, correlated with an accent rating of [o] and [a]: higher [o] and lower [a] correlated with a greater accent rating. These learners also tended to have shorter closure and longer VOT in voiceless stops, and these tendencies correlated with accent rating. Native Japanese speakers showed the greater mean value of Varco∆V, indicating that their vowel duration was more variable than that of learners. Smaller variation in vowel duration correlated with greater accent ratings.

The vowel formants correlating with the accent score of the Original samples plotted in the Lobanov normalized first and second formants space. L1-English learners are indicated by filled circles, L1-Mandarin learners by triangles (see the discussion on the Mandarin group in a later section), and native Japanese speakers by asterisks. The arrows indicate the direction of increased accent rating.
A number of acoustic factors also correlated with other acoustic factors. The correlation coefficient 0.70 or higher was used as the criterion of high correlation, warranting caution in this study following Larson-Hall (2015) and Tabachnick and Fidell (2007). Among the eight predictors in this analysis (see Table 3), we found strong correlation between F1 in [a] and F2 in [i], r = 0.74, and between F1 in [o] and F2 in [i], r = 0.71. VIFs of these vowel factors and others are examined in the regression analysis sections below.
3.1.2 Regression modeling—prosodic analysis
The prosodic features considered here were pitch error score and Varco∆V, the two features found to correlate with the accent rating. A very strong correlation between the accent rating and pitch error score, r = 0.92, indicated that this factor was likely to explain a large portion of the variance in the accent rating. Given this, a sequential regression analysis was conducted, entering Varco∆V in the equation first (Model 1), and then adding pitch error score to the model (Model 2) in order to examine the effect of Varco∆V before the strong factor, pitch error score, was entered into the equation.
The results showed (Table 4) that whereas the model with Varco∆V as the sole predictor (Model 1) explained 31% of the variance in the accent rating, when pitch error score was added in Model 2, the coefficient for Varco∆V was no longer statistically significant. The coefficient for pitch error score was statistically significant. The significance of the coefficients is based on the bootstrapped estimates. This model (Model 2) explained 86% of the variance in the accent rating, and the R2 increase in Model 2 over Model 1 was statistically significant, F(23,1) = 89.50, p < 0.001. Low VIF values indicate that there was little evidence of multicollinearity between the two predictors.
Regression model statistics for L1-English learners prosodic analysis.

Note: ‘Rel’ = relative importance of each coefficient; * = significant at p < 0.05, ** = p < 0.01, *** = p < 0.001 based on boot-strapped estimates.
These results indicate that when only prosodic factors were available as intact features in speech samples, control of pitch accent and intonation strongly influenced native Japanese listeners’ perception of a foreign accent in English-accented Japanese. When pitch accent and intonation was controlled for, however, the control of vowel duration (i.e., Varco∆V) was a reliable factor and explained over 30% of the variance in the dependent variable.
3.1.3 Regression modeling—full analysis
The factors listed in Table 3, excluding Varco∆V, were considered in this analysis (a total of seven predictors). As explained in the Analysis section, Varco∆V was excluded as it was found to be non-significant in the final model in the prosodic analysis. Given the strong correlation between pitch error score and the accent rating of the original samples, r = 0.87, pitch error score was likely, in this analysis too, to explain a substantial portion of the rating data. Accordingly, two models were examined, as in the last section. Model 1 included all factors except for pitch error score, and Model 2 added the highly correlating pitch error score.
Model 1 explained 60% of the variance in the accent rating (Table 5). In this model, only the coefficient for F2 in [e] (i.e., the front–back dimension) was statistically significant. There was no redundancy of effects with other predictors, as indicated by the low VIFs. This indicates that vowel predictors did not overlap in their effects on the model, although we found some intercorrelation among some of them (see the correlation analysis section above). The model estimates suggested that the more centrally produced [e] was rated as more heavily accented. None of the other vowel features or consonant features was a reliable predictor. However, when pitch error score was added to the model (Model 2), pitch error score was the only significant predictor. This model explained 87% of the variance in the dependent variable, and the increase of R2 over Model 1 was meaningful, F(18, 1) = 38.10, p < 0.0001.
Regression model statistics L1-English learners full analysis.

Note: Rel = relative importance of each coefficient, closure = voiceless stop closure, VOT = voiceless stop VOT, * = significant at p < 0.008 for Model 1 and at p < 0.007 for Model 2 based on boot-strapped estimates.
It is noteworthy that pitch error score showed strong bivariate correlation, r = 0.87, with the accent rating of the original, unfiltered speech, and was the only reliable predictor among several in the model predicting the rating, R2 = 0.87. Whereas a vowel feature, F2 in [e], showed a reliable effect in Model 1, its effect disappeared when pitch error score was added in Model 2. Previously (and in this study too), out of a concern that the strong influence of segmental features (e.g., vowels) could possibly overwhelm perception of prosodic features (e.g., pitch accent), researchers took the step of filtering speech samples to reduce or eliminate segmental information so that they could examine the effect of prosody alone on foreign accent. The current results indicate that listeners can be sensitive to prosodic features even in the presence of segmental features. And in fact, in the current study, the effect of a prosodic feature (i.e., pitch error score) seemed to overwhelm the effects of segmental features, at least in the modeling results.
The results here show that among the segmental and prosodic features examined in this study, the control of pitch accent and intonation has the most critical influence on the extent to which native English speakers’ Japanese is judged as accented. It appears that if pitch accent is controlled for, the production of the vowel [e], specifically the front–back dimension of its production, has a strong effect on accent perception.
3.2 L1-Mandarin learners
3.2.1 Correlation analyses
We found a number of segmental and prosodic features correlating with the accent ratings of the speech samples produced by L1-Mandarin learners (Table 6). Among these factors, as in L1-English learners’ data, pitch error score strongly correlated with the accent ratings of both original and filtered samples, r = 0.88 for both. Unlike L1-English learners, speaking rate strongly correlated with the accent rating of the original, r = 0.72, and filtered samples, r = 0.75. In addition, F2 in [u], r = -0.87, and closure duration of voiceless stops, r = -0.74, showed strong correlation with the original samples, while other factors mildly correlated with the accent rating.
Segmental and prosodic features significantly correlating with the accent rating of the original (top) and the filtered speech samples (bottom). The mean values and standard deviation (in parenthesis) are also provided for the L1-English learners-Mandarin and native speaker (NS) groups.

The significant correlations between the vowel acoustics and the accent rating are illustrated in Figure 1. The distance between the Chinese learners’ and native Japanese speakers’ [u] in Figure 1 is notable, and [u] in a more backward position correlated with greater accent ratings. The patterns of stop production are illustrated in Figure 2. L1-Mandarin learners had the tendency to produce voiceless stops with shorter closure and longer VOT than native speakers, as well as the tendency to produce voiced stops with longer closure duration and VOT. These non-native tendencies correlated with higher accent scores. In terms of the rhythm measures, whereas Varco∆V alone correlated with the accent rating for English-accented Japanese, both Varco∆V and Varco∆C correlated with the accent rating for Mandarin-accented Japanese. As indicated by the mean values and direction of the correlation (Table 6), L1-Mandarin learners showed smaller variation in both vowel and consonant duration, and this was associated with higher accent ratings. Among the fluency measures, longer and more frequent pauses and slower speech correlated with higher accent ratings.

The acoustics of voiceless and voiced stops correlating with the accent score. The measure on the Y-axis is the normalized duration. The dark bars represent L1-Mandarin learners and the gray bars represent native Japanese speakers. The error bars indicate 1 standard error of the mean.
An examination of correlation among these features found a few statistically significant correlations that were stronger than or close to the criterion, r ≥ 0.70. Speaking rate correlated strongly with two other factors: F2 in [u], r = -0.68; and pause frequency, r = 0.68. F2 in [u] additionally correlated near the criterion level with closure in voiceless stops, r = 0.68, and above the level with pitch error score, r = 0.74. The issue of intercorrelation of the predictors is considered in the sections below.
3.2.2 Regression modeling—prosodic analysis
The prosodic features considered here were Varco∆V, Varco∆C, pause duration, pause frequency, speaking rate, and pitch accent error. Given very strong bivariate correlations between the accent rating and two factors, pitch error score, r = 0.88, and speaking rate, r = 0.75, a sequential regression analysis was conducted. The first model examined all factors except speaking rate and pitch error score (Model 1), then adding speaking rate to the model (Model 2), and finally adding pitch error score (Model 3).
Even when the two strong predictors, pitch error score and speaking rate, were not in the equation, the model with the other factors explained 70% of the variance in the rating score (Model 1 in Table 7). In this model, the coefficients for Varco∆V and pause frequency were significant. This suggests that when pitch and speaking rate are controlled for, the control of vowel duration and speaking without pauses may be important features that affect accent perception in Mandarin speakers’ Japanese. As expected, the addition of speaking rate (Model 2) improved the model, F(20, 1) =6.03, p = 0.02. In this model, R2 = 0.77, Varco∆V remained a significant predictor. Pause frequency was no longer significant, but speaking rate was significant. The model in which all factors were included (Model 3) improved the fit of data over Model 2, F(19, 1) =27.43, p < 0.0001, explaining 91% of the variance in the rating score. In Model 3, the coefficients for Varco∆V and pitch error score alone were significant. Of these predictors, pitch error score showed a stronger influence, indicated by the relative importance metrics, 0.35 for pitch error score and 0.12 for Varco∆V. Low VIF values indicate that there was little evidence of multicollinearity among the predictors.
Regression model statistics for L1-Mandarin learners prosodic analysis.

Note: Rel = relative importance of each coefficient; Pause d = pause duration; Pause f = pause frequency; Rate = Speaking rate, * = significant at p < 0.013 for Model 1, p < 0.010 for Model 2, and p < 0.008 for Model 3 based on boot-strapped estimates.
These results show that in the domain of prosody, control of pitch accent and intonation as well as control of vowel duration are the key features influencing the foreign accent in L1-Mandarin learners’ Japanese production, with pitch accent and intonation having a stronger influence than vowel duration. When the effect of pitch error is absent, slow speech affects the accent rating. When the effects of both pitch error and slow speech are absent, frequent pauses affect the accent rating.
3.2.3 Regression modeling—full analysis
The six segmental factors listed in Table 6 and two prosodic factors, Varco∆V and pitch error score, were submitted to the analyses here. The dependent measure strongly correlated with three predictors, namely, pitch error score, r = 0.88, F2 in [u] r = -0.87, and closure duration in voiceless stops, r = -0.74. Thus, a sequential regression first examined all factors except for the three highly correlating factors (Model 1), then adding voiceless stops (Model 2), adding F2 in [u] (Model 3), and finally adding pitch error score (Model 4).
As Table 8 reports, none of the coefficients was significant in Model 1. The addition of voiceless stop closure in the next step improved the fit, Model 2, R2 = 0.79, R2 change: F(19, 1) = 21.87, p < 0.001. In this model, the coefficient for voiceless stop closure was the only statistically significant predictor among the six. Whereas the addition of F2 in [u] in Model 3 seemed to slightly improve the model, R2 = 0.88, R2 change: F(18, 1) = 12.23, p < 0.001, none of the coefficients was reliable. We ran a follow-up model that added the factor of F2 in [u] to Model 1 to examine whether the non-significant effect of F2 in [u] in Model 3 was due to the fact that it was entered after voiceless closure. Recall that F2 of [u] and voiceless stops showed correlation. The results still showed a non-significant effect of the factor, F2 in [u].
Regression model statistics for L1-Mandarin learners full analysis.

Note: Rel = relative importance of each coefficient, C = intercept, -v = voiceless, +v = voiced, closr = closure, * = significant at p < 0.010 for Model 1, p < 0.008 for Model 2, p < 0.007 for Model 3, and p < 0.006 for Model 4 based on boot-strapped estimates.
Finally, the model that included pitch error score (Model 4) indicated that the coefficient for pitch error score was the only reliable coefficient in this model. This model explained 93% of the variance in the accent rating, and the increase in R2 over Model 3 was statistically significant, F(17, 1) = 12.89, p < 0.01. It is noted that the VIF of pitch error score was higher (4.85) than other cases, although it is still within the threshold according to some criteria (O’Brien, 2007). This indicates that its effect showed some degree of overlap with those of other variables. However, the findings that none of the other variables were significant in Model 3 and that pitch error score was the only significant variable in Model 4 seem to indicate the importance of this factor in predicting the accent rating.
These results indicate that among a large number of acoustic features considered in this study, the control of pitch accent and intonation has the most crucial influence on the accent rating of Mandarin speakers’ original, unfiltered speech samples. This finding is consistent with the analysis of English speakers’ samples. It appears that if pitch accent is controlled for, the production of the voiceless stops, specifically their closure duration, has a strong effect on accent perception.
3.2.4 Summary of the findings
Pitch error score emerged as the most crucial factor explaining the degree of perceived accentedness of L1-English learners’ Japanese. In the absence of pitch error effect, a segmental feature, F2 in [e], emerged as an important factor affecting the perception of an accent. When the effects of pitch error score and segmental information were absent in the speech (i.e., prosodic analysis), a rhythm factor, Varco∆V, emerged as an important factor. In L1-Mandarin learners’ Japanese too, of all factors including segmental features, pitch error score emerged as the most predictive factor. In the absence of pitch error effect, a segmental feature, closure in voiceless stops, emerged as an important factor. When the segmental information was absent in the speech (i.e., prosodic analysis), a rhythm factor, Varco∆V, appeared as an important factor complementing the effect of pitch error score. Only when segmental information and these two strong prosodic factors were excluded, did speech rate and pause frequency influence the degree of perceived accent.
The relative importance metric of pitch error score in the final models was 0.43 for L1-English speakers and 0.27 for L1-Mandarin speakers in full models, and 0.70 for L1-English speakers and 0.35 for L1-Mandarin speakers in prosodic models. The results indicate that the relative weight of the pitch error score was higher for L1-English learners than for L1-Mandarin learners.
4 Discussion
This study explored acoustic sources of accent in L2 Japanese produced by learners of two L1s, English and Mandarin. One of our hypotheses was that prosodic features would strongly predict the degree of perceived foreign accent in both English-accented and Mandarin-accented Japanese. The current findings were partially consistent with the prediction. Not all prosodic features were strong predictors; however, among all the features examined, one prosodic feature emerged as a very robust and strong predictor. In both L1-English and L1-Mandarin learners’ Japanese speech samples, error in the tonal pattern (pitch accent and intonation) most strongly affected the degree of perceived foreign accent. Its influence was stronger than that of other prosodic features, vowel qualities, and stop features. The control of pitch accent and intonation has critical influence on perceived accent in English-speaking learners’ and Mandarin speaking learners’ L2 Japanese.
We also predicted that the tonal patterns would be more predictive of the degree of accent in L1-English learners’ Japanese than in L1-Mandarin learners’ Japanese. This prediction was supported. Pitch error score was weighted more heavily relative to other factors in the analysis of L1-English learners than in the analysis of L1-Mandarin learners. This study presents a case in which L1–L2 phonological differences/similarities can inform important acoustic sources of accent in L2.
In addition to the cross-linguistic explanation, there may also be a function-based explanation for the current findings regarding the importance of tonal patterns. Tonal structure, which includes pitch accent and intonation, not only provides information for lexical identity, but it also conveys the information regarding syntactic structure (e.g., phrases) and pragmatic meaning (e.g., mood) (Beckman & Hirshberg, 1994; Venditti, 2005). Because of this, while segmental errors may typically affect perception within the lexical domain, pitch and intonation errors may exert an influence in a broader domain, that is, at the level of phrases and utterances. This may be why errors in pitch accent and intonation are so robustly related to accent ratings.
We also found other factors that may contribute to perceived accent in English- and Mandarin-accented Japanese. For both groups, another prosodic factor, Varco∆V, was identified as one such factor. Native Japanese speakers showed a greater degree of variation in vowel duration than either learner group. The Japanese vowel duration is likely variable because of the presence of short and long vowels, as well as both a single vowel mora and a CV mora taking approximately the same duration. Lack of this durational variance apparently leads to perception of an accent.
Whereas the two L1 groups were similar with regard to the effect of prosody, namely, pitch error and Varco∆V, on their accent, we found group differences in the effect of segmental features. L1-English learners showed a potential source of accent in a vowel: the vowel [e]. L1-Mandarin learners showed a potential source of accent in a stop feature: closure duration in voiceless stops. Prior literature on cross-linguistic analysis of the stops distinction focused on VOT (e.g., Riney et al., 2007), but our findings suggest that future research needs to examine differences in closure duration as well as VOT. We also found additional prosodic features that influenced the L1-Mandarin learners’ speech: two fluency factors, speaking rate and pause frequency, had weak effects.
We have used filtered and unfiltered speech samples to obtain accent ratings due to a concern among researchers that issues with prosodic features may not be detected in speech stimuli that contain segmental errors (Munro, 1995; Trofimovich & Baker, 2006; van Els & De Bot, 1987). In spite of this concern, our findings have shown that prosodic factors, particularly pitch accent, exerted a strong influence in our study, even in speech stimuli that contained segmental deviations. It appears that listeners can be sensitive to segmental and prosodic issues simultaneously.
The current findings involving L2 Japanese are consistent with some of the prior studies that examined other target languages. In particular, Torofimovich and Isaacs (2012) found that two prosodic factors, word stress errors and vowel reduction ratio, explained 76% of the variance in the accent rating of L1 French speakers’ English by novice raters, the type of raters who participated in this study. This is similar to the current finding in that prosodic features explained 86% (American learners) and 91% (Chinese learners) of the variance in the accent ratings. These two studies involving L2 Japanese and L2 English present cases in which prosodic factor(s) influenced the perceived foreign accent more than the segment-related factors that were examined. The comparison of L1–L2 phonological systems seems to explain the outcome of the French-accented English in Torofimovich and Isaacs (2012) as well: the authors explained that English and French are markedly different in their prosodic systems, English being stress-timed, with variable lexical stress, and French being syllable-timed, with more regular stress placement. On the other hand, Winters and O’Brien (2013) found that segments influenced the perception of foreign accent more than prosody in English-accented German and German-accented English. While this outcome may appear the opposite of the results of the current study and that of Torofimovich and Isaacs (2012), the prosody of English and German are relatively similar, both being stress-timed and stress-accented. In light of this, the results are consistent with the idea that if the prosodic systems of L1 and L2 are considerably different, prosodic features are likely to be a major source of a perceived foreign accent in learners’ L2.
However, the same idea does not seem to explain the results of Sereno et al. (2016), who found that segments contributed more than prosody to the degree of perceived accent in Korean-accented English. English (stress-timed, stress-accented) does not seem to be any less different from Korean—which is syllable-timed and employs an intonation system characterized at the phrasal level rather than the lexical level—than from French. Thus, there appear to be other factors that likely influence the acoustic source of a foreign accent in this case. The proficiency level of L2 learners may be one such factor. The 32 non-native participants in this study were not fluent speakers, and the 40 in Torofimovich and Isaacs (2012) seemed to vary in proficiency. On the other hand, the two Korean speakers in Sereno et al. (2016) were very fluent in English. There is a possibility that these two individuals were particularly proficient in acquiring English prosodic features. However, if the results could be generalized to a larger group of advanced Korean learners of English, they may indicate that even when L1 and L2 vary substantially in their prosodic systems, their relative influence on perceived foreign accent decreases as the speaker’s proficiency develops. This in turn would suggest that English prosody may be earlier developing than segments for Korean learners.
Although the robust effect of pitch and intonation on perceived accent is evident in the current results, we need to interpret these findings cautiously. While our analysis of prosodic factors included a large number of measurements, our analysis of segmental features focused on singleton vowels and stops features. These segmental features were selected based on suggestions in the prior literature (Tanaka & Kubozono, 1999; Toda, 2004); however, it is possible that other features influenced accent ratings in a significant way. For example, there may be issues in the ways learners produce Japanese fricatives, such as [s], and flap [r]. In addition, the test sentences did not sample all long vowels and geminate consonants. Long vowels and geminate consonants have been discussed as potentially problematic areas (Hirata, 2004; Hirata & Whiton, 2005), and future research on Japanese foreign accent will need to examine the role of these segmental features on accent.
Furthermore, as an exploratory investigation, this study used naturally produced speech samples as stimuli to be rated by native listeners. We mean by “naturally produced” that the samples did not undergo modification of specific acoustic features to test for the effect of the selected features. As such, acoustic features naturally covaried in the speech stimuli that were rated, and it was not possible to tease apart the effects of features to identify their independent influence on accent rating. To this end, we have provided a careful examination of correlation among acoustic features and a discussion of features that influenced accent rating when the most highly correlated factors were excluded in the regression equation. In future studies, L2 speech samples, such as those analyzed in this study, can be manipulated so that pitch and intonation and certain segmental feature(s) (e.g., vowel and stop acoustics) vary independently. Alternatively, prosodic properties could be extracted from the speech samples of one group and superimposed on the speech samples of another group (e.g., de Mareüil & Vieru-Dimulescu, 2006; Jilka, 2000; Sereno et al., 2016; Winters & O’Brien, 2013). These lines of further work will contribute to the understanding of foreign accent phenomena in general, and in particular, to the debate on the relative importance of prosody and segments on perceived accent.
Another aspect of foreign accent phenomena that merits further investigation is the nature of and interplay among intelligibility, comprehensibility and accentedness in L2 speech (e.g., Munro & Derwing (1999)). Research findings are clear that these constructs are related but are not necessarily highly correlated. Because the task used in this study involved naïve native listeners simply rating “degree of foreign accent” in L2 speech samples, their ratings may have focused on any of the three dimensions: intelligibility; comprehensibility; or accentedness. It will be informative to tease apart the effects of these dimensions in the future research and investigate what distinct linguistic features are crucially related to each.
5 Conclusion
The current study has explored the acoustic sources of a perceived foreign accent in L2 Japanese speech produced by American learners and Mandarin-speaking learners of Japanese, focusing on various prosodic, vowel and stop features. Prediction models relating detailed acoustic measures and accent rating demonstrated that pitch accent and intonation is an important source of perceived foreign accent in both English-speaking learners’ and Mandarin-speaking learners’ Japanese. Additionally, control of vowel duration affects accent in both groups of learners. This study on L2 Japanese presents a case in which differences and similarities between L1 and L2 influence the acoustic sources of perceived foreign accent. This study also provides novel findings with regard to the characteristics of foreign accent in L2 Japanese and contributes to the understanding of the nature of foreign accent in general.
Footnotes
Appendix
Prompts for the delayed repetition task.
Acknowledgements
We thank two anonymous reviewers, Robert O’Brien, Bodo Winter, and Vsevolod Kapatsinski for helpful suggestions and Sara King for assistance with data collection. We also thank the late Dr. Susan Guion-Anderson for her feedback on an earlier version of this study. Portions of this work were presented at the 165th Meeting of the Acoustical Society of America, Montréal, Canada, June 2–7, 2013 and at the 18th International Congress of Phonetic Sciences, Glasgow, Scotland, August 14–15, 2015.
Funding
This research received no specific grant from any funding agency in the public, commercial, or not-for-profit sectors.