



Abstract
The COVID-19 pandemic, and the consequent nationwide lockdown in India that began on 25 March 2020, caused a major disruption in the labour market, leading to the widespread loss of livelihoods and food insecurity. The findings from a telephonic survey of a representative sample of more than 3,000 households in the National Capital Region also reveal a dramatic loss in earning capacity. The place of residence and occupation mediated the impact of the lockdown, with greater vulnerabilities witnessed amongst those engaged in informal employment, especially in urban areas. The government rolled out a series of welfare measures in response to the widespread economic distress, with the provision of free foodgrains and cash transfers aimed at rehabilitating those who were the most affected. While the use of prior social registries enabled quick disbursement, our analysis shows that few households received both foodgrains and cash transfers, particularly in urban areas. Urban residents were also eight percentage points less likely to receive cash transfers than their rural counterparts.
1. Introduction
The COVID-19 pandemic and consequently the India-wide lockdown that brought economic activity to a grinding halt on 25 March 2020 triggered a widespread humanitarian crisis as households struggled to cope with the shock to their livelihood structures and curbs on their mobility and life as they knew it during the pre-pandemic era. In this article, we examine the economic consequences of this lockdown in the context of the prevalent disparities in the labour market and pre-existing urban–rural differences in India. After India entered another phase in the pandemic early in 2022 with the surge caused by Omicron, a new and highly infectious variant of Sars-CoV-2, there was much to learn from the experience of earlier lockdowns.
The lockdown, which was the dominant policy response across countries to deal with the pandemic (Ray & Subramanian, 2020), restricted mobility, impaired market functioning and reduced earnings, leading to broad-based food insecurity. In response to the widespread economic distress, the central government implemented a series of welfare measures in the second half of March 2020. Amongst these, the provision of additional foodgrains under the Public Distribution System (PDS) and transfer of cash to the beneficiaries’ bank accounts aimed to provide immediate relief. In this article, we explore how efficient the targeting framework was, using data from the Delhi NCR Coronavirus Telephone Survey (DCVTS), a rapid telephone survey, interviewing 1,756 households between 3 and 6 April 2020 (DCVTS Round 1), and another subsequent survey of 3,466 households held between 15 and 23 June 2020 (DCVTS Round 3). These surveys drew upon a pre-existing panel of households that were first interviewed face-to-face in early 2019, allowing us to link some of the pre-pandemic characteristics with the differential impact of the lockdown.
The results presented in this article show that over 80 per cent of the respondents suffered some income loss. The results also highlight the following three challenges associated with the lockdown: (a) The lockdown played into some pre-existing differences (e.g., the poorest were 1.6 times as likely to experience income shocks as those in the top assets tertiles). (b) The place of residence and occupation moderated the impact of the lockdown on households since movement restrictions were greater in urban areas than in rural areas, and farmers found it easier to practise their trade than informal workers. Since the prevalence of the pandemic varied between urban and rural areas, and the lockdown effects depended upon the place of residence and occupation, new vulnerabilities emerged. The marginal propensity to experience income shocks was higher for urban informal sector workers than that for farmers. Informal salaried and casual wage workers were more likely to experience severe income shocks by 22 and 37 percentage points, respectively, than cultivators, while urban casual wage workers were more likely to do so than their rural counterparts by nine percentage points. (c) Since access to safety nets, particularly cash transfers, depended on pre-existing registries, a section of households most affected by the pandemic and the related lockdown was excluded, with the probability of rural residents receiving cash transfers being eight percentage points higher than that for urban residents. Our results also show that 27 per cent of the respondents reported an unmet need for foodgrains, with the probability of unmet need being higher in urban than rural areas.
This calls for a re-examination of the policy prescriptions, focusing on designing a better targeting framework and last-mile delivery of welfare programmes. Our findings indicate that the probability of receiving welfare benefits increases if better targeting mechanisms are put in place at the local level when using existing social registries. This also emphasises the importance of the local administrative units for the delivery of public services, an argument consistent with findings from previous research on large-scale public welfare programmes (Desai et al., 2015; Leite et al., 2017; Nagarajan et al., 2014). More importantly, building a robust framework of local governance units for urban areas becomes crucial.
The rest of the article is designed as follows. Section 2 views India’s lockdown through an occupational lens. Section 3 presents the data used for this study. Section 4 defines the occupational classification adopted in this article. Section 5 predicts the severity of income loss across different occupational groups. Section 6 predicts the likelihood of the beneficiaries receiving cash and food support. Section 7 discusses the issue of exclusion errors and rural–urban differences. Section 8 focuses on the conclusion and policy implications.
2. The Lockdown through an Occupational Lens
Our article contributes to the growing literature on the dramatic decline in income and loss of employment following the lockdown resulting from the COVID-19 crisis (Afridi et al., 2020; Kesar et al., 2020; Totapally et al., 2020). Moreover, we make a distinctive contribution towards examining the unequal effect of the lockdown on the basis of structural inequalities in the labour market.
When the first lockdown was announced on 25 March 2020, it was nation-wide and absolute. However, by April 2020, it was clear that the pandemic was most likely to spread in urban areas, and unless the farmers were allowed to harvest the Rabi (winter) crops, food shortages would occur. Thus, the lockdown was relaxed in rural areas. The government also announced that it expected employers to continue to pay their employees, and government employees continued to receive their salaries, though only some private employers honoured their obligations. However, the owners of small businesses and daily wage workers had no fallback options and were among those most likely to be affected by the lockdown. Informal sector workers deserve particular attention since they lack access to social security benefits or unemployment insurance and have limited healthcare access, making them the most vulnerable to the shock (Sen, 2020).
3. Survey Data
The National Data Innovation Centre at the National Council of Applied Economic Research (NDIC NCAER) began the Delhi Metropolitan Area Study (DMAS) in 2019 with its sample of over 5,200 households in 132 census villages and 139 urban blocks spread across various districts in NCR, including 3 in Delhi, 4 in Haryana, 2 in Rajasthan, and 3 in Uttar Pradesh, covering both rural and urban areas. This sample of households was randomly selected following a three-stage stratified cluster sampling process. The baseline survey was completed in June 2019.
Following the onset of the pandemic, 50 per cent of the scheduled respondents in the DMAS sample were interviewed using telephones. The telephone survey is called DCVTS to distinguish between telephone and in-person surveys. We use data from DCVTS Round 3 (DCVTS-3) (conducted between 15 and 23 June 2020). This sample of 3,466 households consists of households interviewed for DCVTS Round 1 (DCVTS-1) and an additional 1,885 households that included neighbours of the original DMAS sample respondents, whose contact information was collected during the listing phase. The latter were also interviewed for DCVTS Round 2 (DCVTS-2). The comparison of the three rounds of DCVTS samples with the DMAS sample based on an array of indicators (Table 1) signifies that the DCVTS samples are similar to DMAS, suggesting a low selection bias.
Comparison of Various Rounds of DCVTS and DMAS Sample Households

The non-contact rate for DCVTS-3, which used the combination sample of DCVTS, was 26.3 per cent. Among those whose phone numbers were active and who were contacted, the response rate was 89.6 per cent. DCVTS-3 was carried out between 15 and 23 June 2020, with a total of 3,466 households interviewed over the telephone. This was right after the phase of lifting of the lockdown initiated on 1 June 2020.
4. Occupational Classification
Although 83.5 per cent of the Indian workforce comprises informal workers (NSSO, 2019), the informal workforce is heterogeneous, with components within both the informal and the formal labour markets in India, and can be seen in the form of either self-employment, operating with or without the contributing household helpers or wage employment (ILO, 2003; Kanbur, 2017; Natarajan et al., 2020; Sinha & Kanbur, 2012).
For our analysis, using data from the DCVTS-3 sample, we categorise work status into the following categories based on the primary source of household income: (a) cultivator, (b) business, (c) salaried, (d) casual wage (agricultural and non-agricultural), and (e) rent, remittances, pension, others (see Figure 1).

We consider two types of businesses: household enterprises that employ only household labour and those that hire external workers. For salaried work, we consider three additional categories: (a) employment in a government or public sector undertaking, (b) private organised sector employment, with the firm size of at least 10 workers—this can include both formal and informal workers, and (c) private unorganised sector employment, with the firm size being fewer than 10 workers, including private employers hiring for domestic work (NCEUS, 2007). This break-up of salaried and wage work allows us to further examine how the level of economic distress is related to the nature of wage and salaried work and how this differs across formal and informal employment. It is important to note that we do not distinguish between formal and informal employment within the organised sector. Figure 1 also delineates the distribution of workers in each of these categories and shows the dominance of informal employment. Given the pervasiveness of informality in the Indian labour market, and the vicious cycle of low education, low wages and lack of well-structured institutional and social protection benefits, it is imperative to determine how households coped with the economic shock triggered by the lockdown.
5. Livelihood Distress
We use the perception of income loss to measure the level of economic distress faced by households during the lockdown period. Income loss is reported by the households on a scale of 1–3, as follows: ‘Very much’ (1), ‘Somewhat’ (2), and ‘Not at all’ (3). Figure 2 shows the loss in income that families across various occupational groups endured across these two rounds. The data indicate that income loss was most acutely felt by households with members engaged in casual wage work (73 per cent). This was followed by business (70 per cent) and salaried (48 per cent) households, while cultivating households (32 per cent) were relatively better off.

5.1 Predicting Income Loss
In order to analyse the characteristics of households that suffered income loss, we estimate the following equation using ordinal logit regression, with three ordinal levels for the dependent variable Yi, measuring the severity of income loss. The ordinal logit model, estimating the log-odds of being at or below the jth category, can be written as follows:

where αj are the intercepts or cut-points, β represents the logit coefficient and Xi is a (k × 1) vector of the correlates containing values of observation i spanning the set of k explanatory variables. Our primary correlates of interest are different occupational categories defined by primary sources of household income. We also control for asset tertiles, household size and area of residence (rural versus urban), along with state dummies to capture unobserved heterogeneity across states. Additionally, we take into account the gender of the respondent and his/her educational attainment to allow for differences in responses based on the characteristics of the respondent. All the standard errors are clustered at the level of the primary sampling unit (PSU).
We also link DCVTS-3 to the 2019 baseline data from the DMAS survey, for a subset of our analysis. The linked data allow for additional controls, such as the highest level of education within the household, access to institutional social security benefits, such as Employee Provident Fund (EPF), or access to social protection schemes and public assistance.
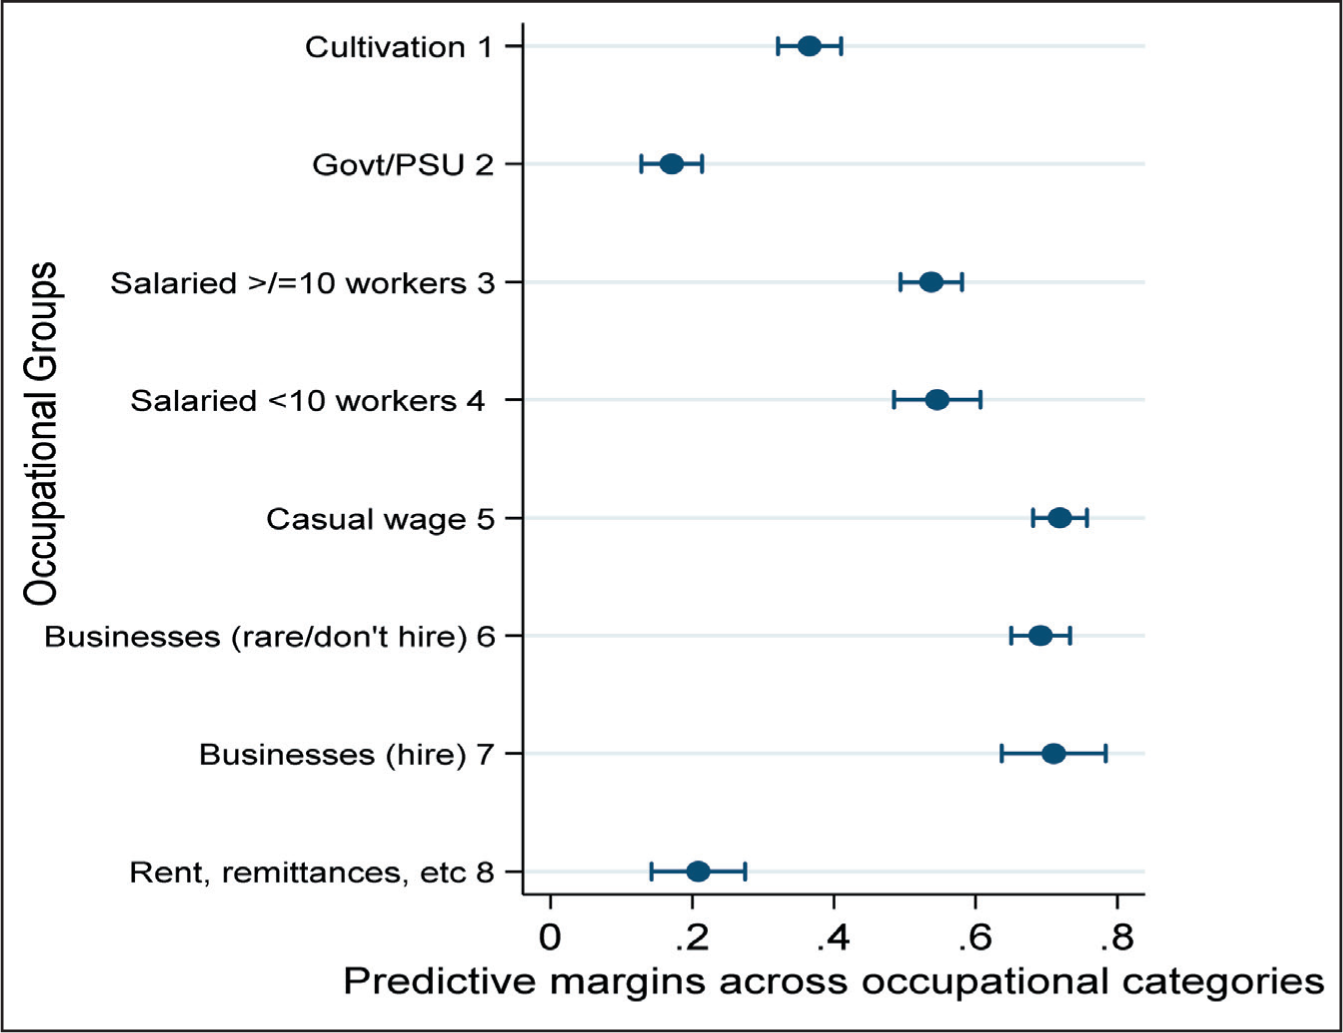
The odds ratio and marginal effects (see Tables A1 and A2 in the online appendix), reflecting changes in predicted probabilities as compared to the reference category of cultivators, indicate that household reporting businesses were more likely to have suffered, with the extended lockdown likely to have affected the sales generated from such businesses (Column 1, Table A1). The increase in predicted probability, reflecting a higher likelihood of facing severe income loss, for businesses that hire, is at 0.326 (p < 0.01), while that for self-employment is at 0.345 (p < 0.01). Non-labour income, such as rental income, and remittances were only somewhat more likely to experience income shocks than agricultural households (0.157, p < 0.01).
Households reporting casual wage work suffered the most as compared to cultivators (0.353, p < 0.01). In terms of educational attainment, casual wage labourers tend to report lower levels of education, which constrains their economic mobility, preventing workers from tapping into jobs offering a regular stream of income and social security benefits that can act as an insurance against exogenous shocks. The marginal effects also show that the education level of the respondent is negatively associated with income loss (–0.04, p < 0.1), suggesting that higher education provides some level of resilience and equips households with better resources to deal with an external income shock.
The results further indicate that in terms of salaried work, households reporting government jobs were better off, while those reporting private sector salaried work were more likely to report income loss. Figure 3A presents the predicted probabilities for income loss across these occupational categories.
Data from the DCVTS-3 suggest that only 5.56 per cent of those working for the public sector reported non-receipt of salaries during April and May 2020. The corresponding numbers for private sector workers in the organised and the unorganised sectors are 40.8 per cent and 48.5 per cent, respectively, clearly pointing to a wedge between the public sector and the private sector. The situation was even more precarious for households reporting casual wage work –68.2 per cent reported not finding any work during the period, with another 28.9 per cent saying that they were able to find work only on some days.
5.1.1 Rural versus Urban
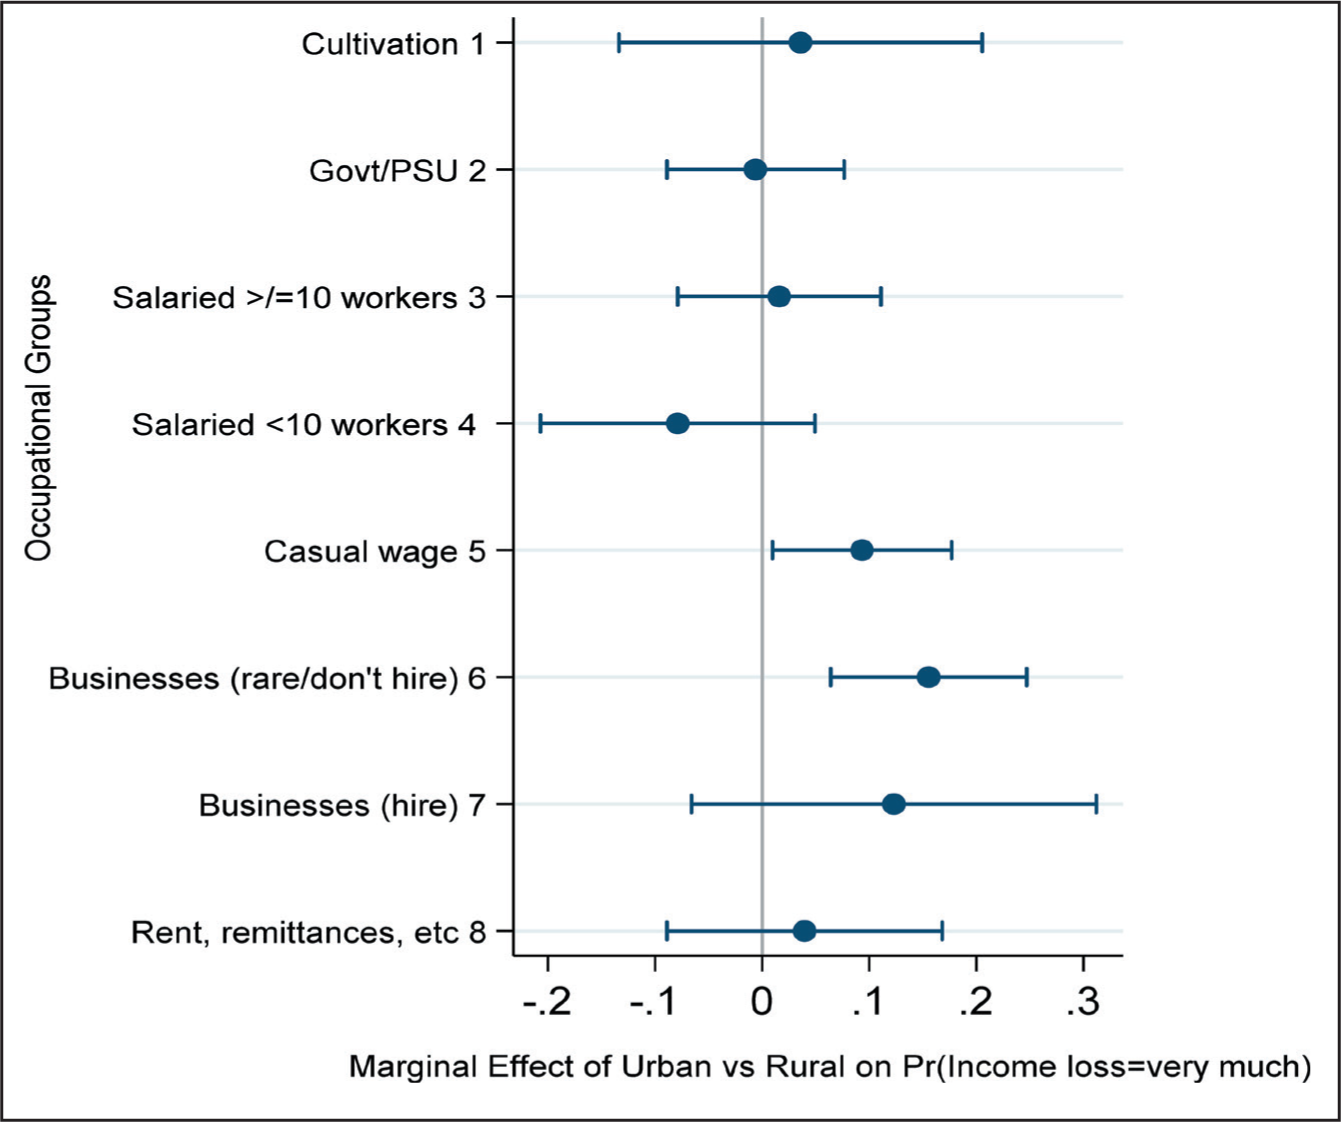
Households in urban areas experienced more income loss, with a 0.05 percentage point increase in the predicted probability of suffering severe income loss as compared to rural households. In order to examine location-based heterogeneity, we interact the urban–rural variable with the eight occupational categories. Our results suggest that the probability of a casual worker suffering economic distress when residing in an urban area is greater by 9 percentage points than that for one residing in a rural area (p < 0.05), while that for urban self-employed persons is greater by 15.5 percentage points (p < 0.05) (see Figure 3B, corresponding coefficient estimates provided in Column 3 of Table A2).
5.1.2 Formal Employment
We further consider the subset of the DCVTS-3 sample that can be linked to the 2019 baseline DMAS survey—this allows us to construct a binary variable measuring access to EPF, which is available only to workers engaged in formal employment. Of the households with salaried workers included in the baseline DMAS sample, only 19 per cent reported having formal employment, with access to EPF, and only 5 per cent received other social security benefits such as gratuity and pension, among other things. The estimates show that households with at least one member having access to EPF contributions are less likely to report income loss, with a decrease in predicted probability by 0.095(p < 0.01). These results assume significance in view of the relief package announced by the central government linked to formal employment. This had the effect of partially reducing the wage and compensation cost for the firms, with the possibility that some of these firms were less likely to lay off their formal workers. In addition, the government also allowed employees to withdraw a portion of their provident fund to tide over the COVID-19 shock (Government of India, 2020a, 2020b).
While welfare measures for workers engaged in formal employment are easier to target because of payroll and income tax data, the following question needs to be addressed: How did workers in informal employment cope? We examine this next in the context of social protection measures that were launched as part of the COVID-19 relief package.
6. State Social Protection
On 26 March 2020, the Central Government announced a ₹ 1 1.70 trillion welfare package under the Pradhan Mantri Garib Kalyan Yojana (PMGKY) (Government of India, 2020b) to alleviate economic hardship and food insecurity. Some of the key elements of the package that we examine in this article are discussed in detail below.
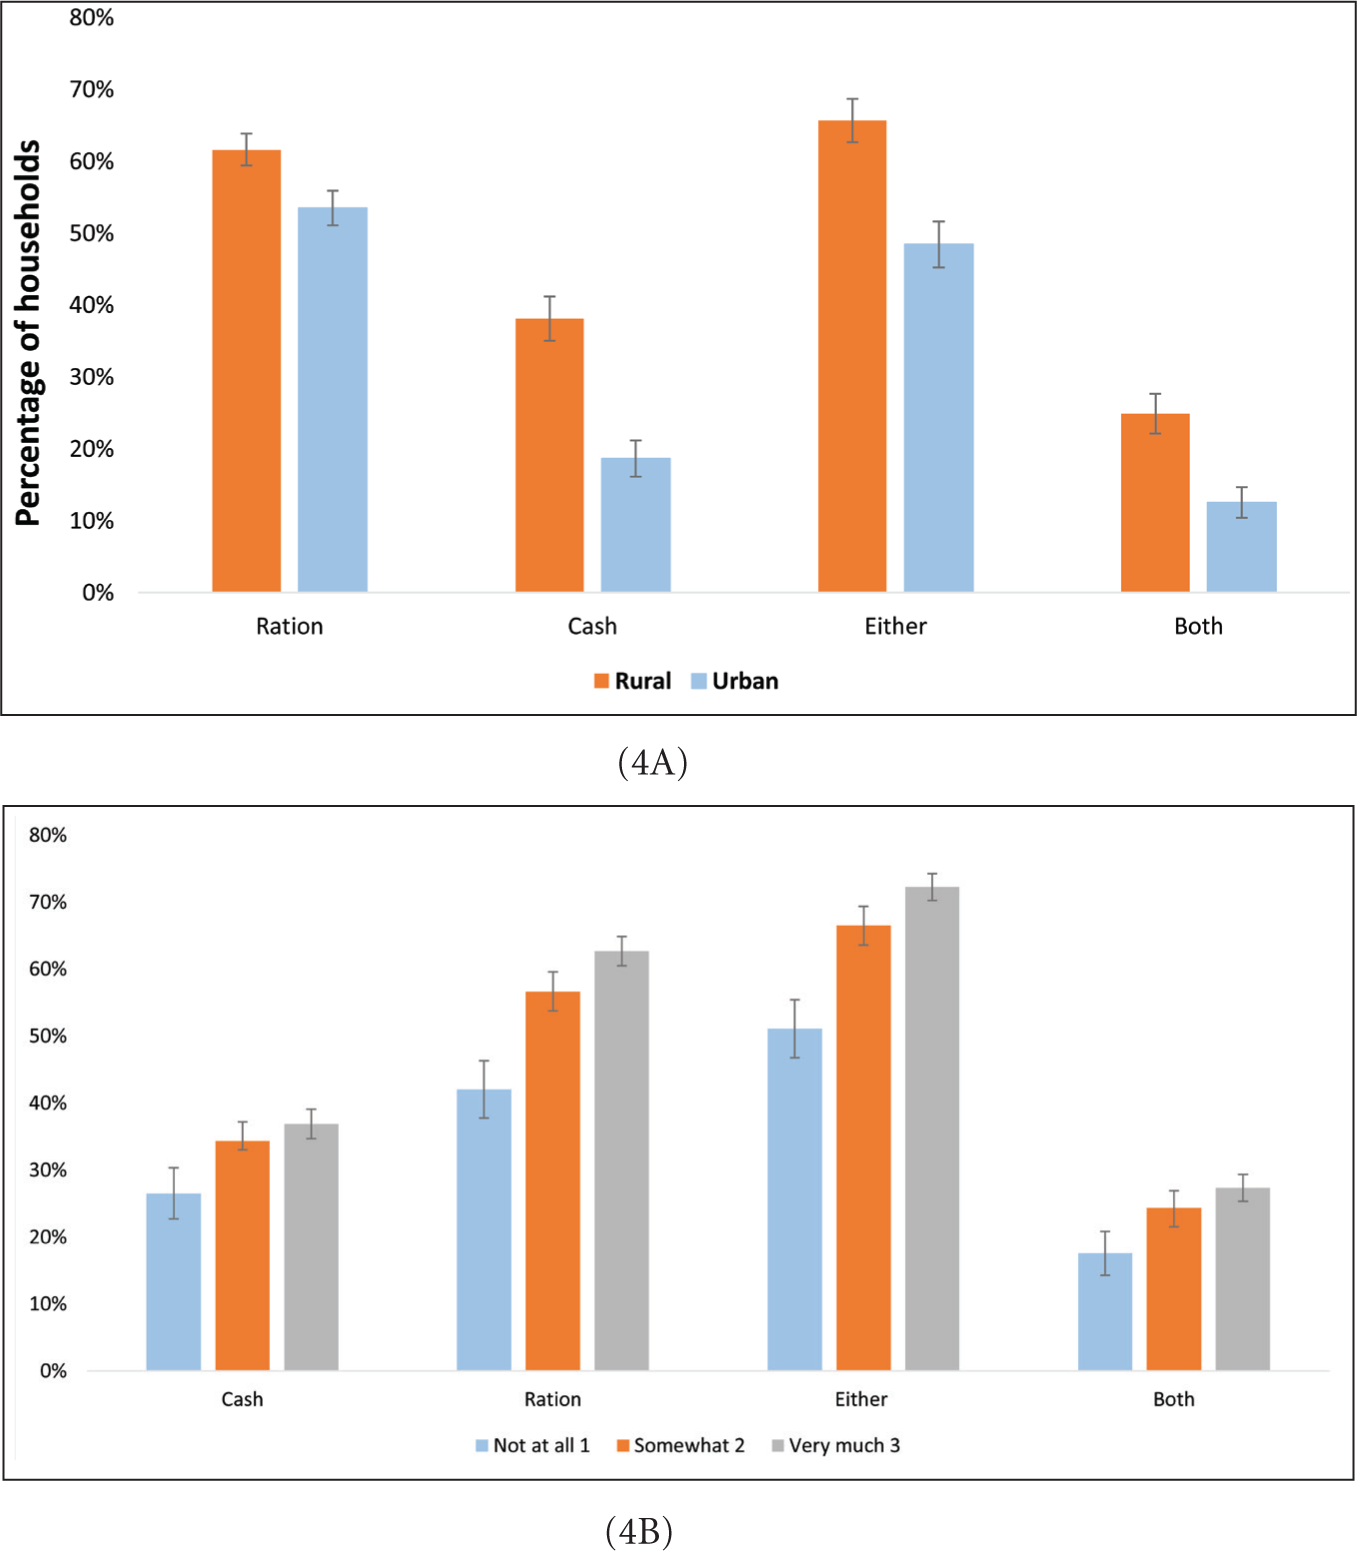
We explore which households received these benefits during the months of April and May 2020 and which were excluded. Data from DCVTS-3 suggest the existence of a rural–urban divide (see Figure 4A), with a higher proportion of respondents in rural areas receiving these welfare benefits. We also observe that a higher proportion of households that experienced severe income loss received these welfare benefits, but very few benefited from both, with fewer such households in urban areas (see Figure 4B). In order to examine the characteristics of beneficiaries, we run two separate regressions linked to our variables of interest that are as follows:
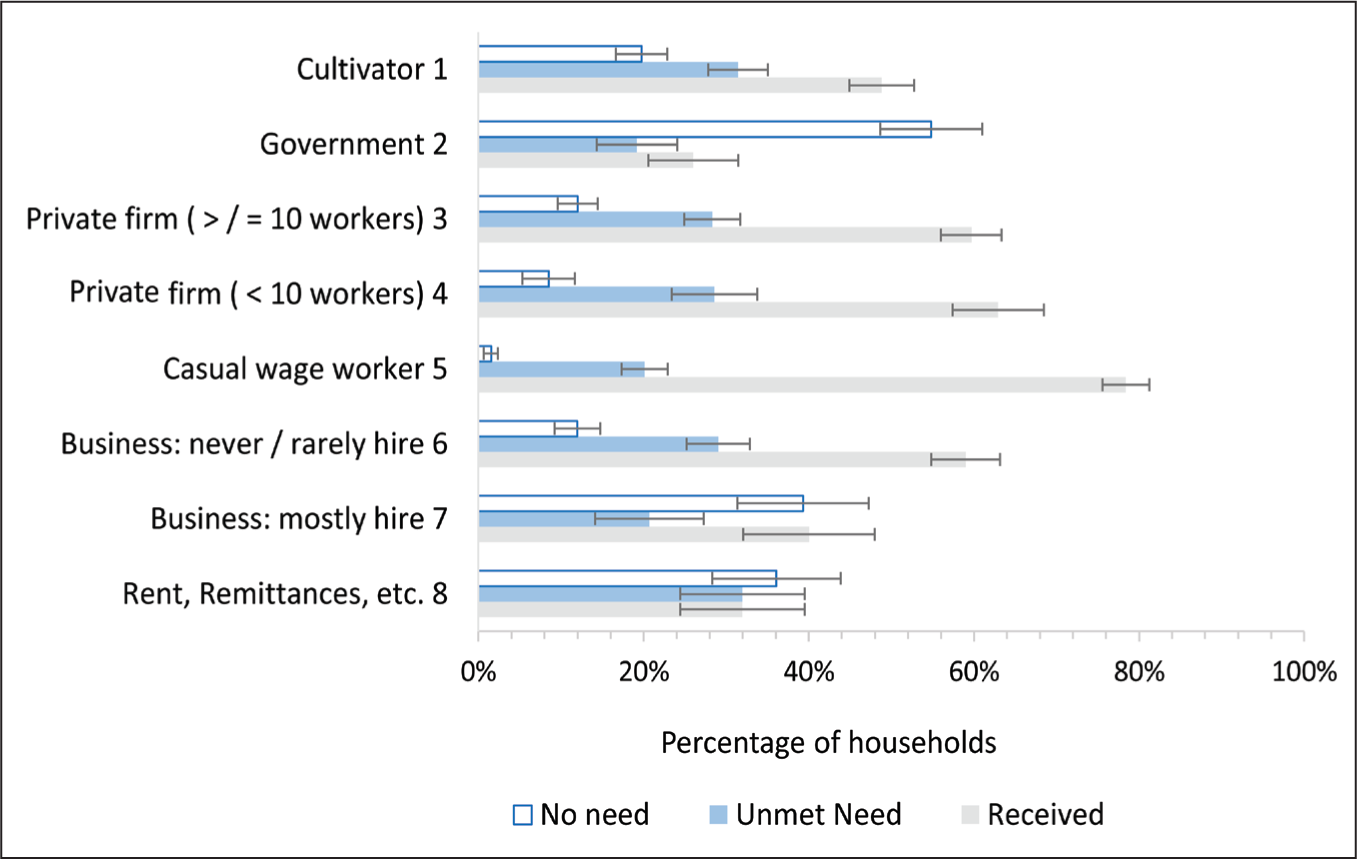
where βmk are the regression coefficients, αm represents the constant term, X denotes the (k × 1) vector of explanatory variables for each observation i. Standard errors are clustered at the PSU level. In addition to occupational categories, we also control for the gender and educational attainment of the respondent, household size and asset tertile rank, household location (rural or urban area) and the state of residence. Overall, 57.74 per cent of the households received food support, 15.23 per cent of the households had no need and did not avail of the benefit, and 27 per cent noted that they needed but did not receive any food support (unmet need). Figure 4C shows a wide variation across occupational categories for those who received food support versus those with an unmet need. where Yi denotes the amount of cash received by the ith household and Xi is the vector of explanatory variables for the ith household. The dependent variable Yi in Equation (3) is observed when Wi = 1, where Wi reflects whether the ith household receives cash transfers as part of the COVID-19 welfare package. The participation equation is defined as follows:
Where



The data suggest that 34.56 per cent of the households received some form of cash support, with a significant variation between rural (45.24 per cent) and urban regions (22.86 per cent). Furthermore, Figure 4D shows that a substantial proportion of those in informal employment were excluded from the welfare programme. In the next step, we examine the predicted amount of cash received across different occupational groups, conditional on the receipt of such benefit. We control for the respondent, household and region-level determinants similar to the regression for food support.

6.1 Identification Strategy for Cash Support
The switching regression, defined by Equation (4), predicts the household’s probability of receiving cash support. This is identified by the instrument PSU-SAFETYNET that captures the PSU-level incidence of household registration/participation under various existing government welfare schemes—this is derived from the 2019 baseline data from the DMAS survey, involving 5,255 households. Details of instrument creation are available in Appendix B.
6.1.1 Receipt of Additional Foodgrains
The marginal effects from the multinomial suggest that casual wage workers, salaried workers working in the private sector and households reporting self-employment were more likely to have received rations than cultivators. However, estimates for those with an unmet need also indicate that not all those who wanted foodgrains received the additional allocation. The predicted probability for an unmet need (see Figure 5A) is 23 per cent (p < 0.00) for casual wage workers, 25.7 per cent (p < 0.00) for informal salaried workers in the private sector, and 28 per cent for the self-employed (p < 0.00). The full set of coefficients is available in Tables A.2.1 and A.2.2 in the online appendix.
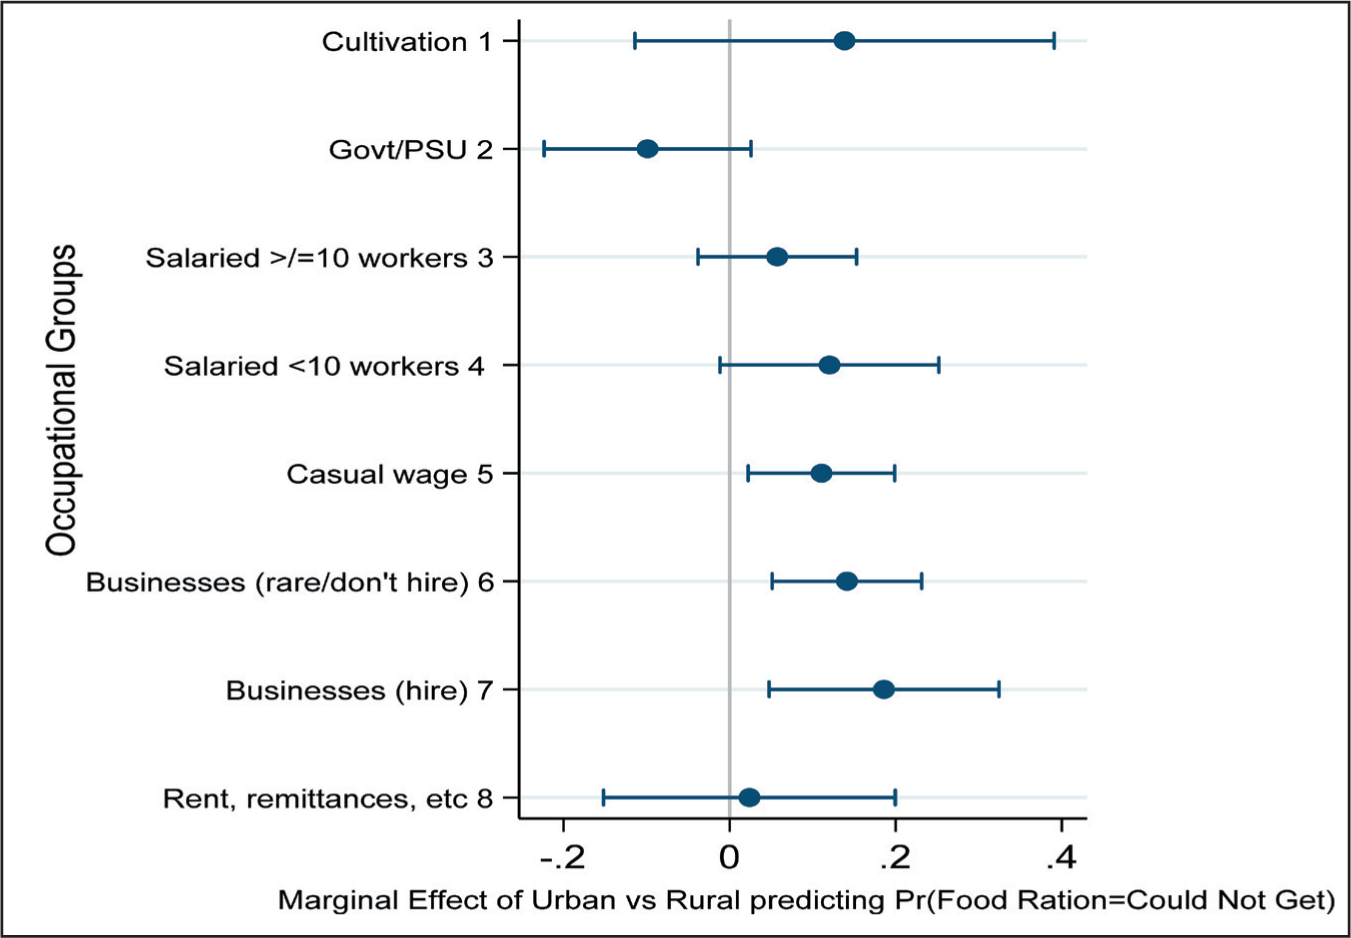
In an alternate specification, we interact the occupational categories with the urban/rural variable, to examine whether the effectiveness of foodgrain outreach differed across rural and urban areas. The results show that the probability of the unmet need for food grain (see Figure 5B) increases amongst casual wage workers (11 percentage points, p < 0.05), households reporting self-employment (14 percentage points, p < 0.01) and businesses that hire (18 percentage points, p < 0.01) if they reside in urban areas, indicating a greater possibility of being excluded in urban regions (see Figures 5A and 5B, with the corresponding coefficient estimates provided in Table A4).

Data from DCVTS-3 indicate that among those with an unmet need, 2.7 per cent did not go to the Fair Price Shop outlet because of fear of the virus, while 14 per cent faced various other difficulties. Furthermore, 43 per cent of the households with an unmet need did not have ration cards; amongst those that did own a ration card, 29.7 per cent did not have the required documentation for receiving additional foodgrains. Interestingly, the results also demonstrate that respondents with less than secondary-level education were less likely to report an unmet need, though the effect is very small (0.004, p < 0.01).
6.1.2 Receipt of Cash Transfers
In this section, we discuss the results from the Heckman-type selection model, predicting the amount of cash received, conditional on receipt of the cash support. Table A5 presents the probit coefficients from this analysis. The results show that the Wald test for independence of equations is rejected at a chi-squared value of 9.83 (p < 0.01). The likelihood ratio test statistic from the first-stage regression, distributed as chi-squared, with 17 degrees of freedom, is 341.33 (p < 0.01).
Figure 6A shows the corresponding predictive probabilities from the first-stage probit regression for the instrumental variable, PSU-SAFETYNET, and the occupational categories. Panel A in Figure 6A presents the predicted probability of receiving cash if the household belongs to a PSU in the 25th, 50th and 75th percentiles of PSU-SAFETYNET. For a household belonging to the median PSU, with four households 3 having access to government welfare benefits during the year preceding the survey date for the baseline DMAS survey, the probability of receiving cash is 33.6 percentage points. The corresponding predicted probabilities are 30 and 38.6 percentage points, respectively, for a household belonging to a PSU at the 25th and 75th percentiles. Thus, residence in PSUs with a larger number of households that have received government benefits over the preceding year increases the probability of receiving cash support during the lockdown. This emphasises the importance of pre-existing social registries for emergency service delivery of social welfare goods.
The first-stage results also indicate that as compared to the reference group of cultivators, the probability of receiving cash support for those employed as casual labourers or working for firms in the unorganised sector is at 0.40 percentage points, five percentage points higher than that of cultivators. The differences in predictive probabilities, with cultivators as the reference group, are jointly significant with a chi-squared value of 39.83, with seven degrees of freedom. The levels of predicted probabilities for all occupational groups are presented in Figure 6A, Panel B (predicted probabilities also presented in Table A6).
Estimates from the second-stage regression reveal that in comparison to cultivators, other occupational groups are likely to receive lower cash support. The estimates for changes in predicted values are jointly significant for all eight categories with a chi-squared value of 14.9, with seven degrees of freedom. The results for casual workers, those employed in the unorganised sector, and for the self-employed (p < 0.05) assume special significance, given that they unambiguously represent informal employment with sporadic earnings and those who lack any employment-linked social safety nets.
Figure 6B shows the predicted levels of total cash support received across different occupational groups. The results suggest that cultivators are the biggest beneficiaries, receiving a predicted mean value of ₹2,460.7, followed by ₹2,347 for those working in the public sector. In comparison, households reporting casual work, employment in firms in the unorganised sector and self-employment are likely to receive approximately ₹400 less at ₹2,063.80, ₹2,042.70 and ₹2,062.40, respectively. This can be attributed to large distribution under the PM-Kisan Yojana.

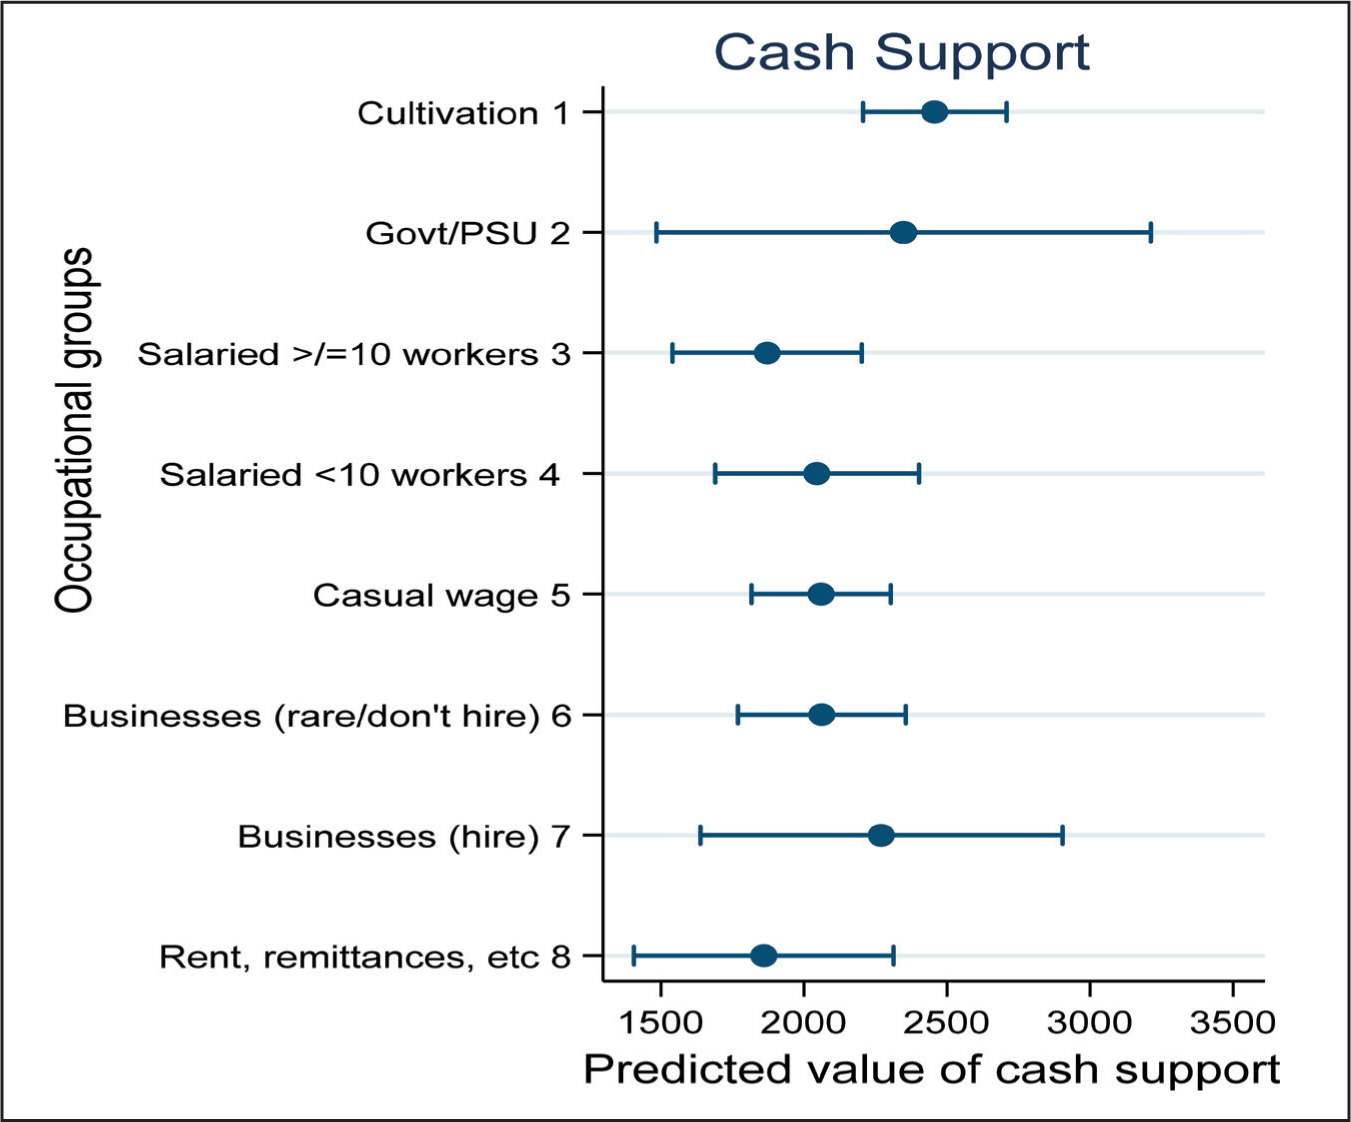
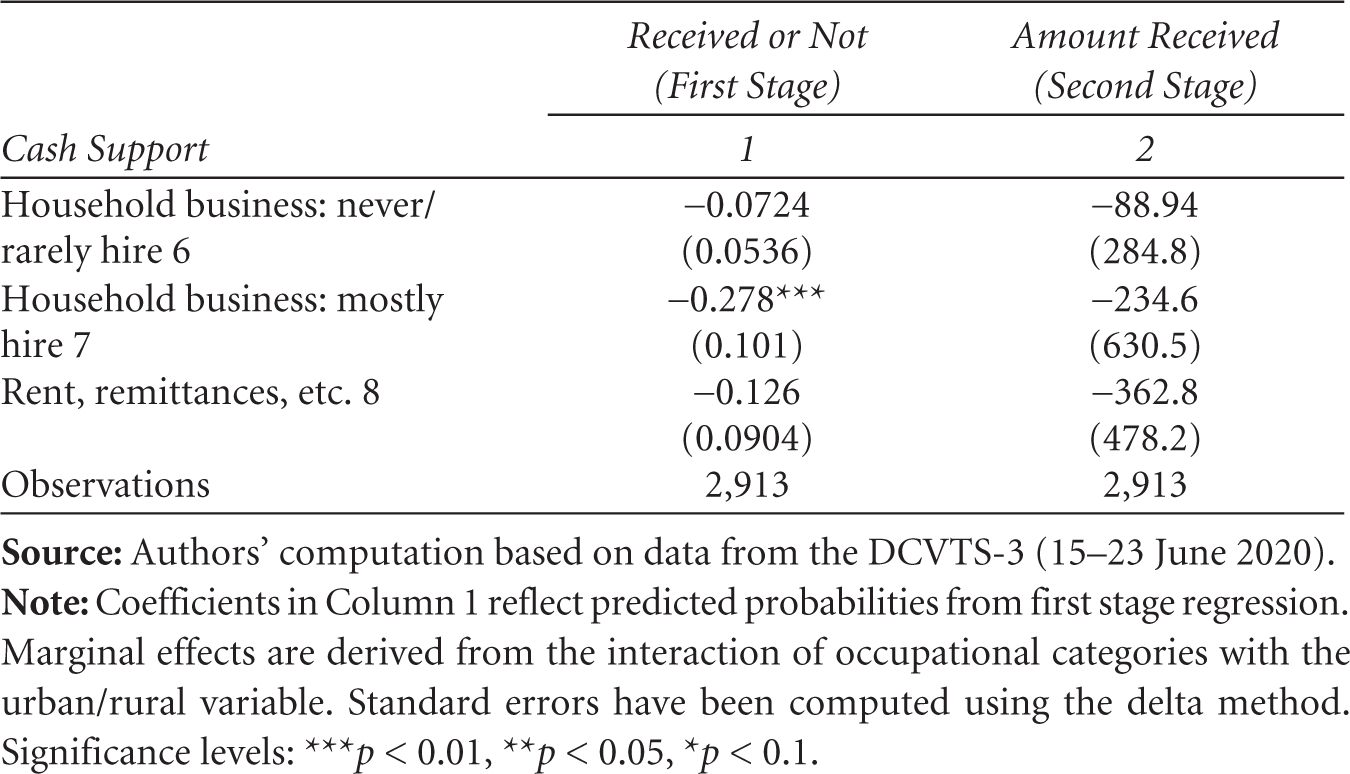
The coefficient estimates also reveal that households in urban areas are likely to receive reduced cash support, less by approximately ₹530, on an average. In an alternate regression, we interact the rural/urban variable with the eight occupational categories—this is done for both the selection and the outcome equations (see Table A7). The results indicate that households reporting salaried work, whether working for an organised or unorganised sector, or reporting businesses that hire labourers, are less likely to receive cash support than cultivators. The probability goes down by 10.6, 21.2 and 28.3 percentage points, respectively, if such households are located in urban areas. Conditional on receiving cash support, households in urban areas across all occupational categories are likely to receive less cash support (see Figure 6C). An urban household, reporting engagement in the unorganised sector, is likely to get ₹1,263 less (p < 0.01), whereas one engaged in casual works is likely to get ₹568 less (p < 0.01).

7. Informality and Exclusion Errors
7.1 Food Insecurity
The somewhat limited outreach of the welfare programme, especially considering India’s pervasive informal sector, is worrisome. While 57.74 per cent of the households surveyed availed of food support, as many as 27 per cent reported an unmet need for foodgrains, with urban informal sector workers being more affected than others.
This presents a precarious urban challenge, where informal workers also find themselves excluded from State-sponsored social protection schemes in the form of food support, posing a serious threat to food security. Data from DCVTS-3 suggest that 23.7, 18 and 15.7 per cent of the households reporting casual wage work, unorganised sector work and businesses, respectively, suffered from the occasional unavailability of food. Not surprisingly, 67 and 50 per cent of the households with casual wage and unorganised sector workers, respectively, reported that they had to borrow in order to manage their daily expenses/consumption.
For the DCVTS-3 sample, while 15.3 per cent of the households without a ration card received food support, about 56.6 per cent of the non-ration card holders (comprising 20.5 per cent of the sample) reported an unmet need, suggesting the need for the adoption of a more universal approach to PDS during times of extreme crisis. Linking the subset of DCVTS-3 that can be matched with the DMAS baseline data, 4 we observe that 19.2 per cent of those with an unmet need fell within the band of 100–200 per cent of the Tendulkar poverty line in the pre-pandemic period (adjusted for 2019 prices), with another 11 per cent BPL. These estimates suggest the possibility of prevalence of food insecurity, even amongst those who were marginally above the poverty threshold. Interestingly, while 43 per cent of the households in the top asset tertile received food support, 26.6 per cent from the bottom asset tertile did not.
7.2 Cash Support
Apart from food, the COVID-19 relief package also offered cash support, targeting beneficiaries through an array of social welfare schemes. The use of prior registries resulted in cash reaching beneficiary bank accounts in record time, but with both inclusion and exclusion errors. Estimates from Section 6.1.2 suggest that for casual wage workers, informal salaried workers and the self-employed, who received these benefits, the mean predicted estimates of cash support are modest, at approximately ₹2,000 over two months, ₹400 less than cultivators. The figures also point towards a significant disadvantage for urban households. For an urban household reporting informal salaried work, the mean predicted value of cash support is equivalent to ₹696.5 per month, or ₹23 per day for a representative family of five members. 5 This is well below the official poverty line estimates of ₹49 per day per person in an urban area as per the lower threshold defined by the Tendulkar poverty line, 6 at current prices. This shows the perils of living in urban areas for those in informal employment, with households battling simultaneously from livelihood loss, food insecurity and meagre cash support.
A scheme-level breakdown sheds more light on the gaps in targeting. The government had announced a transfer of ₹500, in three equal monthly payments, to women account holders of the Pradhan Mantri Jan Dhan Yojana (PMJDY) account, as part of the COVID-19 relief package. PMJDY is a flagship financial inclusion drive, launched in August 2014, with the objective of bridging the last mile gap in banking facilities to the unbanked poor. Data from the DCVTS-3 indicate that 23.3 per cent of all the sample households received transfers on account of PMJDY. For the subset of the DCVTS-3 sample interviewed for the DMAS baseline data, recipients of the PMJDY transfer can be found across both BPL and non-BPL households. These estimates are consistent with findings from other studies (Pande et al., 2020; Somanchi, 2020), which suggest that less than half of the households were likely to receive cash support, given the low prevalence of female Jan Dan account holders.
We observe such inclusion and exclusion errors also with respect to other welfare schemes, such as the PM-Kisan Yojana, introduced in 2018, which guarantees basic income support for landed farmers. The government announced front-loading of ₹2,000 of the ₹6,000 per year between April and June 2020. However, of the 18 per cent farmer households in the DCVTS-3 sample, only 21 per cent received such transfers, 42 per cent of such households belonged to the wealthiest assets tertile of the sample, while another 28.5 per cent belonged to the middle tertile. Further, the PM-Kisan scheme applies to landowners, thereby excluding agricultural labourers or share-croppers, though not all landed farmers received the benefits.
8. Conclusion
In view of the repeated surges of COVID-19 infections that have raged across India since 2020, combined with the possibility of further surges occurring at a later date, the results presented in this article have important lessons for recognising the economic vulnerabilities of occupational groups located in densely populated urban areas.
With a vast majority of the workforce engaged in informal employment, the precipitous economic outcome of the lockdown translated into widespread food insecurity and a dramatic loss in earnings. Lack of access to social security benefits and the absence of any structured unemployment insurance left such households in the lurch, without any alternative recourse. The findings from this article show that such precarity was further exacerbated in urban areas.
While the government extended welfare measures aimed at providing immediate economic relief, we find evidence of several pockets of exclusion, especially amongst informal workers. Further, amongst those who received cash transfers, not only was the amount modest but the predicted amount of cash receipt was less for households located in urban areas, particularly for households reporting informal workers.
The prevalence of exclusion amongst the informal workforce, such as daily wage workers, the self-employed or salaried workers in the unorganised sector, particularly in urban areas, brings to the fore the discussions on targeting and selectivity versus universalism in relation to social policy in India. Targeting of the poor is often based on complex selection criteria to determine the eligibility for entitlement under various government programmes (Jhabvala & Standing, 2010). Evidence suggests that this is often riddled with exclusion errors, irrespective of the methodology employed (Alkire & Seth, 2013; Jhabvala & Standing, 2010; Standing, 2014). These exclusion errors get further amplified when economic insecurity is more widespread, triggered by a large-scale shock and an uncertain economic recovery path.
It is important to maintain a social registry containing information about individuals and their bank accounts for ensuring that cash is transferred expeditiously. However, registries based on specific deprivations may not identify individuals who are most vulnerable in the event of a crisis. Using data from the India Human Development Survey, Thorat et al. (2017) find evidence that factors alleviating poverty may differ from the ones that push people into it. This poses a challenge for policymakers in targeting welfare beneficiaries in response to shocks. About 40 per cent of the poor in 2012 were pushed into poverty by special circumstances and would not have been classified as being poor based on their 2005 conditions (Thorat et al., 2017).
This calls for the adoption of a more universal approach to designing relief packages for alleviating economic distress resulting from such a dramatic shock, focusing on geographical areas that are most affected by the crisis rather than targeting individuals based on specific characteristics. Such an approach also becomes important for providing food aid in addition to cash support. Furthermore, considering that the immediate effect of the pandemic was more acutely felt in urban areas, the targeting framework also needs to take into consideration the rural/urban divide, and the need for putting in place a more robust institutional framework of local governance that can help create social registries in urban areas. Additionally, instituting an urban public works programme, particularly for informal sector workers, is vital, especially in scenarios wherein urban informal workers are more adversely affected than their rural counterparts.
Footnotes
Declaration of Conflicting Interests
The authors declared no potential conflicts of interest with respect to the research, authorship and/or publication of this article.
Funding
Analyses presented in this article have been supported by grants from National Institutes of Health (R01HD041455) and Bill & Melinda Gates Foundation INV-009903 and INV-010337.
Appendix A
Marginal Effects for Cash Support: Urban (1) versus Rural (0)

| Cash Support | Received or Not (First Stage) |
Amount Received (Second Stage) |
| 1 | 2 | |
| Cultivator 1 | -0.0272 | -909.2 |
| (0.108) | (589.4) | |
| Employed with government firm/PSU 2 | -0.0197 (0.0578) |
-415.2 |
| (849.4) | ||
| Employed with private firm (firm size ³ 10 workers) 3 | -0.0969** | -473.6 |
| (0.0480) | (320.9) | |
| Employed with private firm (firm size < 10 workers) 4 | -0.201*** | -1,248*** |
| (0.0705) | (370.5) | |
| Casual wage worker 5 | -0.0522 | -547.8*** |
| (0.0486) | (203.3) | |
| Household business: never/ rarely hire 6 | -0.0724 | -88.94 |
| (0.0536) | (284.8) | |
| Household business: mostly hire 7 | -0.278*** | -234.6 |
| (0.101) | (630.5) | |
| Rent, remittances, etc. 8 | -0.126 | -362.8 |
| (0.0904) | (478.2) | |
| Observations | 2,913 | 2,913 |
Instrument: PSU-Safetynet
The first step in creating the instrument entails constructing a dichotomous variable for welfare registration, coding one if the household participated in any scheme related to crop insurance, building sanitary latrines/toilets, Kisan Credit Card, Pradhan Mantri Awas Yojana (housing scheme) and PMUY (LPG scheme). We code the value of zero if the household did not participate in any of these schemes. In the next step, we summed up all households within the PSU that have availed of any of these benefits.
The excluded instrument, PSU-SAFETYNET, draws from the literature on identification of welfare beneficiaries. Several of these schemes involve self-targeting based on a set of eligibility criteria, commonly encountered for large headcount linked public works programme (Alatas et al., 2016a; Desai et al., 2015;). Other approaches follow community-led targeting organised by community/village leaders (Alatas et al., 2016b) or district-level or the lowest-level governance units (Desai et al., 2015; Nagarajan et al., 2014) which also play a crucial role in the last-mile delivery of such public welfare programmes. Past literature also finds evidence of using existing social registries (Leite et al., 2017) for identifying beneficiaries for new social schemes.
A larger number of households within a particular PSU registering for availing of social welfare benefits can signify more efficient targeting of beneficiaries and administrative efficiency in the delivery of public services at the local level. We argue that even though the schemes used for constructing PSU-SAFETYNET are mostly different from the ones used for granting welfare benefits during the pandemic, a higher count of beneficiary households within a PSU has the potential to increase the likelihood of households in the PSU receiving economic relief during a pandemic. We further argue that this is unlikely to determine the total amount of cash received by a household, as the amount of relief received was determined on the basis of the schemes chosen by the Government (Centre or State), with the selection criteria decided at the level of the concerned Government, and which can hence be treated as an excluded instrument.
As noted earlier, nearly half (43.4 per cent) of the DCVTS-3 sample comprises sample households from the baseline DMAS survey. The rest, also interviewed for DCVTS-2, were randomly drawn from the same set of the DMAS villages and urban blocks. Data from Table 1 further show that the DCVTS-2 sample households are very similar to the full DMAS sample across a range of indicators, which indicates that the PSU-level constructed instrument, drawn from the DMAS sample, can be treated as being representative of the DCVTS-3 sample.
Acknowledgements
The authors are thankful to the anonymous reviewers and journal editors for their extremely helpful suggestions and comments that helped in improving the findings of this article.