
Abstract
Forensic pathologists use post-mortem phenomena to estimate the post-mortem interval (PMI). We have reported on the usefulness of post-mortem lividity spectrophotometric values to estimate PMIs. Here, we focused on blood colour, looking for associations between blood colour, age and PMI. We generated predictive equations for blood-colour values and the PMI. We included data from a total of 129 cadavers (84 males and 45 females). We measured the colour of 124 left ventricular blood (L*l, a*l, b*l), 123 right ventricular blood (L*r, a*r, b*r) and 57 femoral blood (L*f, a*f, b*f) samples. We found no significant associations between blood colour and age or between blood colour and the PMI, but the values of a*l, b*l, a*r and b*r were significantly increased with increased age, and those of L*f, a*f and b*f were significantly decreased with increased PMI. We created equations to estimate blood colour. The equations for femoral blood colour had higher adjusted R2 values and lower root mean square error values than those for left and right ventricular blood colours. We generated equations to estimate PMIs using blood-colour values and autopsy findings. Our estimated PMIs up to 67 hours had accuracies within 8.84 hours, without measuring post-mortem lividity colour or considering the age of the deceased. This is the first study to estimate PMIs based on blood-colour spectrophotometric values.
Introduction
Post-mortem lividity is one of the phenomena that occurs in the early post-mortem period, and is used to estimate the post-mortem interval (PMI), in addition to helping to identify the cause of death. 1 Since colour examinations are subjective, some forensic pathologists have begun using a spectrophotometer to evaluate the post-mortem lividity colour more objectively.2–9 We have published a study on the usefulness of post-mortem lividity spectrophotometric values to estimate PMIs. 9 Here, we focused on blood colour (as a factor influencing the post-mortem lividity colour), looking for associations between blood colour, age and PMI, and generated predictive equations for blood colour and the PMI.
Materials and methods
Subjects
We measured the blood colour in cadavers from forensic autopsy cases at the Department of Forensic Pathology and Sciences, Graduate School of Medical Sciences, Kyushu University, between March 2008 and April 2012. The causes of death and PMIs were determined after full autopsy examinations and complete police investigations. We excluded cases with ambiguous PMIs.
We included samples from 129 cadavers (84 males and 45 females). We measured the colours of 124 left ventricular blood (L*l, a*l, b*l), 123 right ventricular blood (L*r, a*r, b*r) and 57 femoral blood (L*f, a*f, b*f) samples. We also recorded the following information on the deceased: age, sex, carbon monoxide (CO) exposure, cold exposure, circumstances surrounding the death (cold exposure after death), heart blood clots (clots, chicken fat clot), massive haemorrhage, the PMI since declaration of death and resuscitation attempts (cardiac massage).
We handled data according to the privacy policy (2006) of the Japanese Society of Legal Medicine. The Kyushu University Institutional Review Board for Clinical Research approved this study (no. 29-360).
Measurement procedures
We measured blood colours using a spectrophotometer (CM-2600d; Konica Minolta, Tokyo, Japan), as published previously. 9 Briefly, the blood colour was measured by putting the blood sample in a plastic cell (CM-A130; Konica Minolta). We used the L*a*b* system, as reported previously. 9
Statistical difference between male and female cadavers
We used the chi-square test to compare the ratio of males to females, and we determined the differences between the two groups using the Welch t-test. A p-value of <0.05 was considered statistically significant.
Associations between blood colour and age or PMI
We performed linear regression analyses to determine the associations between blood-colour values and age or the PMI. p-Values of <0.05 were considered statistically significant.
Predictive equation for blood colour
We conducted a stepwise regression analysis (forward and backward, p = 0.25) to establish the predictive equation to ascertain the left ventricular blood (L*l, a*l, b*l), right ventricular blood (L*r, a*r, b*r) and femoral blood (L*f, a*f, b*f) values by selected autopsy finding factors (sex, age, PMI, carbon monoxide exposure, cold exposure, cold exposure after death, heart blood clots, massive haemorrhage and resuscitation attempts). To avoid multi-collinearity, we checked variance inflation factors (VIFs), and excluded VIF values that were >10.
Predictive PMI equation
We performed a stepwise regression analysis (forward and backward, p = 0.25) to establish the predictive equations to ascertain the PMI by selected factors of the blood-colour values of left ventricular, right ventricular and femoral blood, and other autopsy finding factors. In addition, we established a predictive PMI equation using all blood-colour values and autopsy finding factors. To avoid multi-collinearity, we checked VIFs, and excluded values that were >10. We performed all statistical analyses using JMP® v12.2, Japanese Edition (SAS Institute, Cary, NC).
Results
Statistical difference between male and female cadavers
We calculated descriptive statistics and expressed all values as means ± standard deviations (Table 1). The ages of the cadavers ranged from 11 months to 95 years, and the PMIs spanned 8–75 hours. We found no significant differences in age, PMI or blood colours between male and female cadavers. However, the numbers of male and female cadavers were significantly different. Table 2 shows the summarised autopsy findings.
Descriptive statistics.
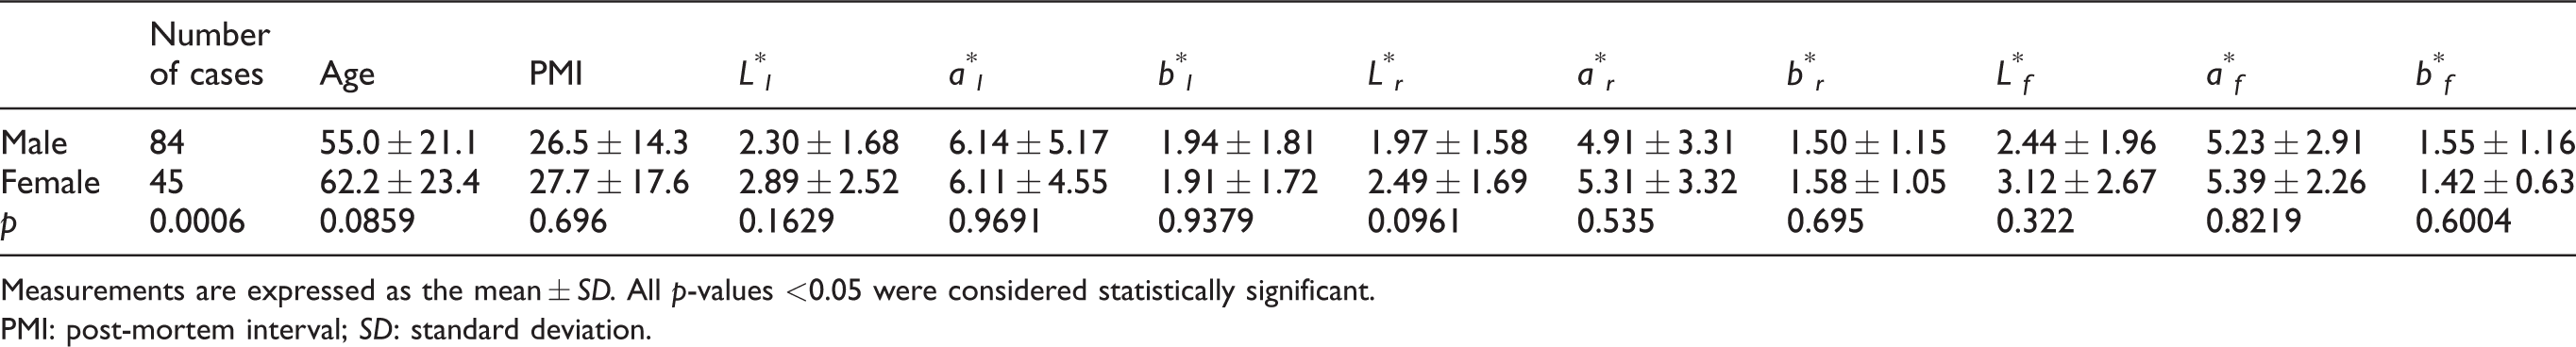
Measurements are expressed as the mean ± SD. All p-values <0.05 were considered statistically significant.
PMI: post-mortem interval; SD: standard deviation.
Autopsy findings.

CO: carbon monoxide.
Associations between blood colour and age or PMI
The values of a*l, b*l, a*r and b*r were significantly increased as age increased, but the r2 values were low (0.0315–0.0444). The L*f, a*f and b*f values were significantly decreased as PMI increased, but the r2 values were low (0.0708–0.1607).
Predictive equations for blood colour
The equations to estimate blood colour are summarised in Table 3. The predictive equation for a*r is:

Autopsy finding factors to predict blood colour.
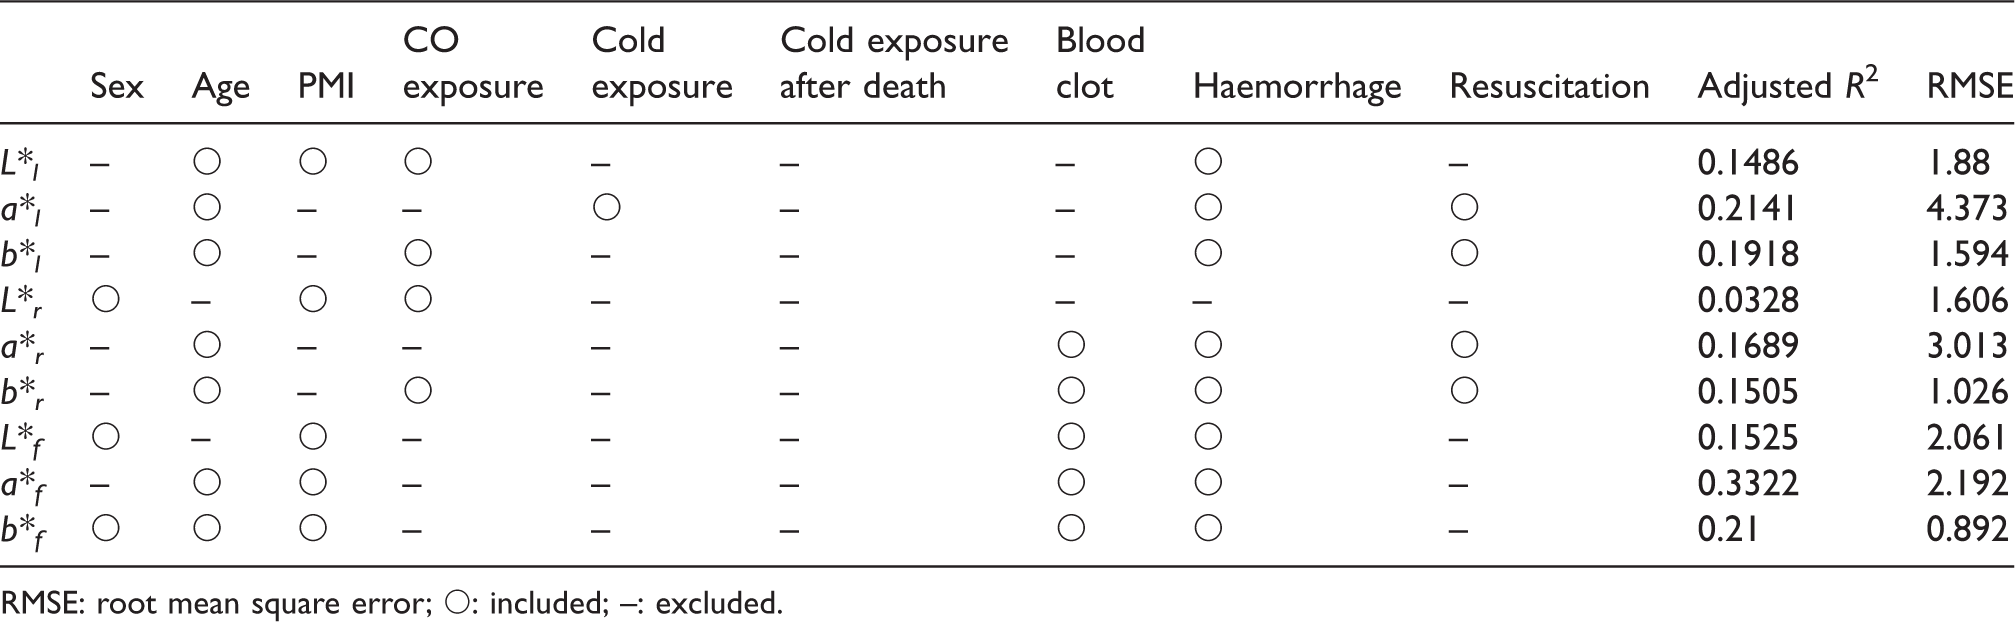
RMSE: root mean square error; ○: included; –: excluded.
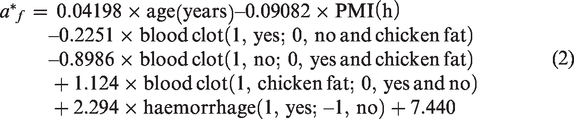
The predictive equation for a*f is:
Predictive PMI equations
The equation for the PMI using femoral blood-colour values had higher adjusted R2 (0.4235) and lower root mean square error (RMSE; 10.24) values than the equations using left or right ventricular blood-colour values. The equation is (Table 4 and Figure 1):
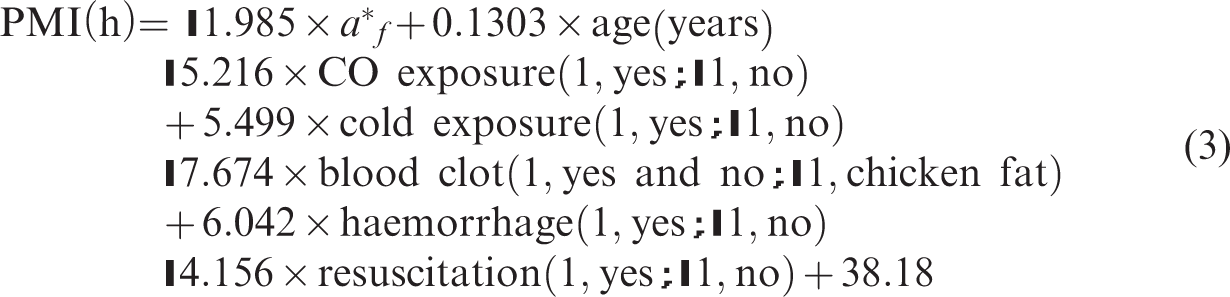
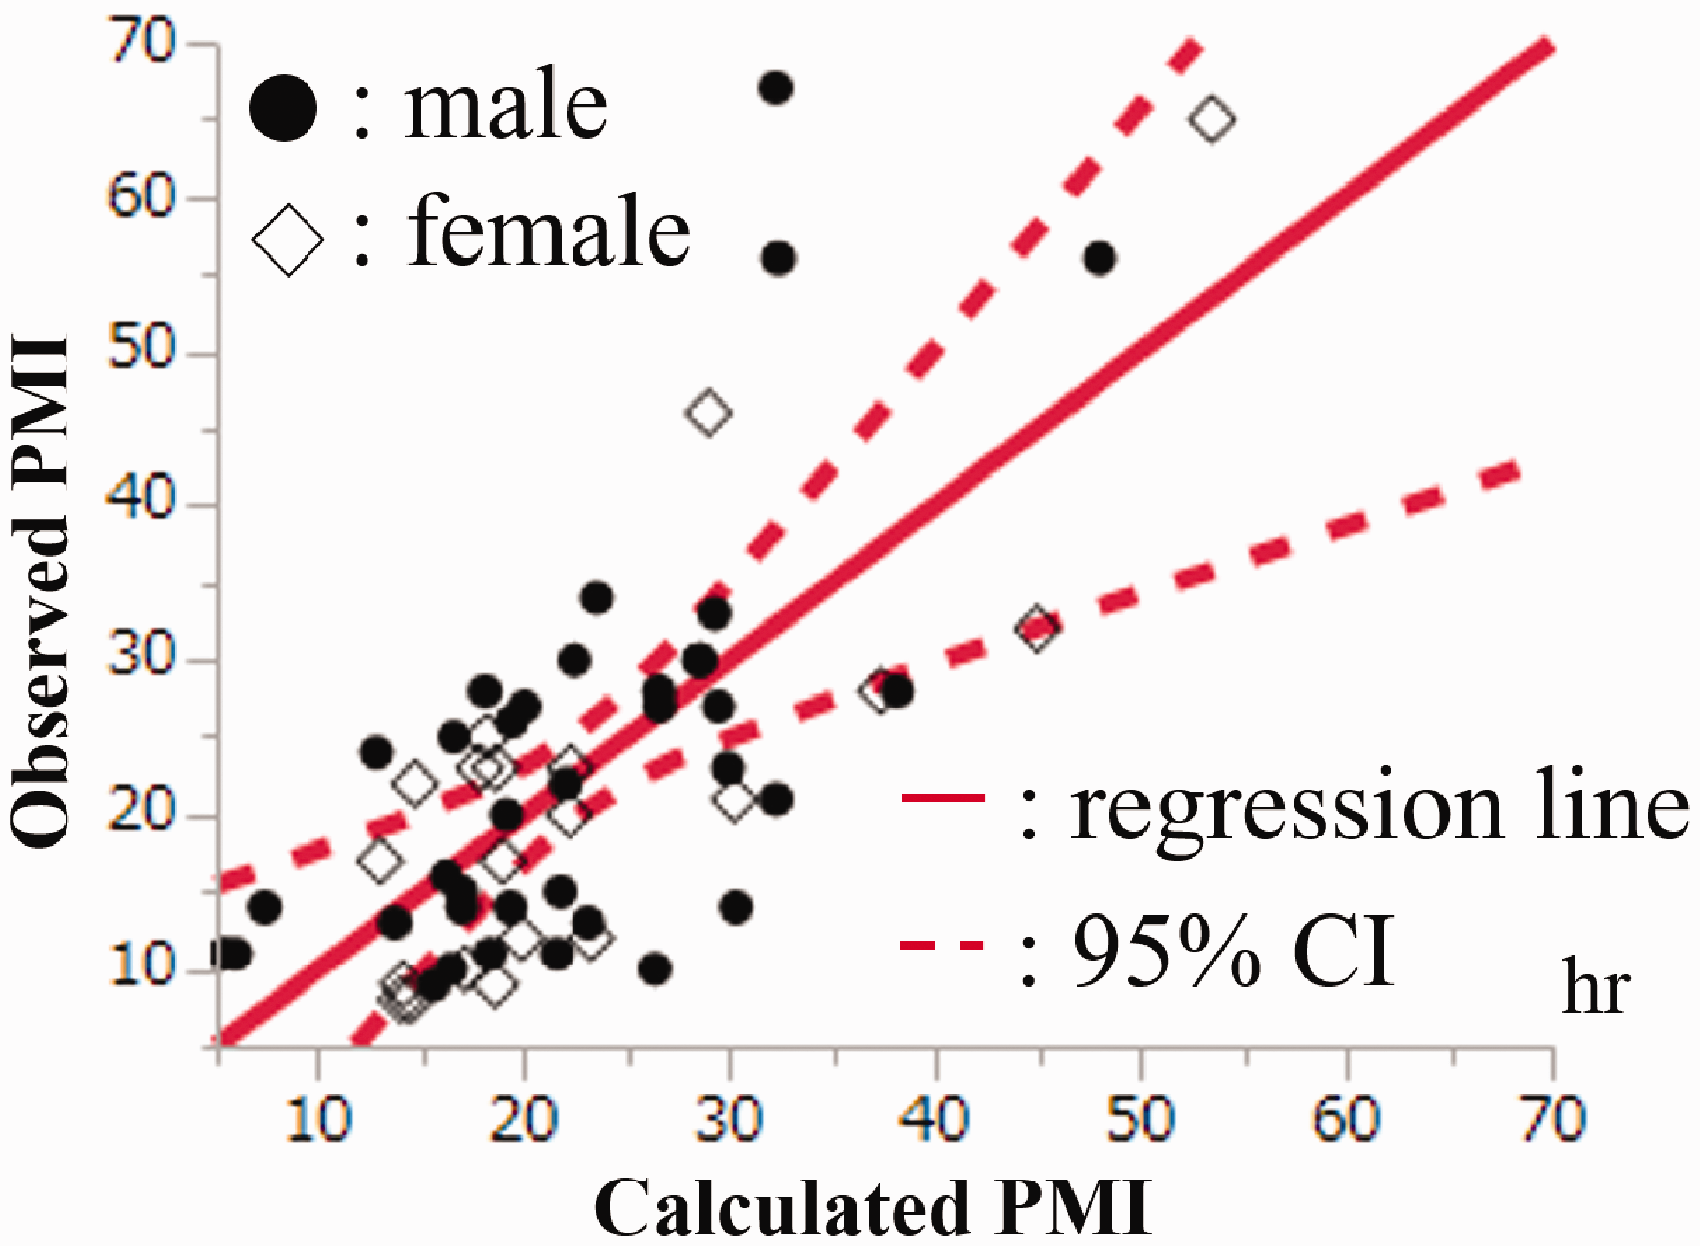
Calculated versus observed post-mortem interval (PMI) values using femoral blood-colour values. CI: confidence interval; black circle: male; white diamond: female; red solid line: regression line derived using multiple regression analysis; red dashed line: 95% CI line derived using regression analysis.
Coefficients of equation to estimate PMI using femoral blood-colour values.
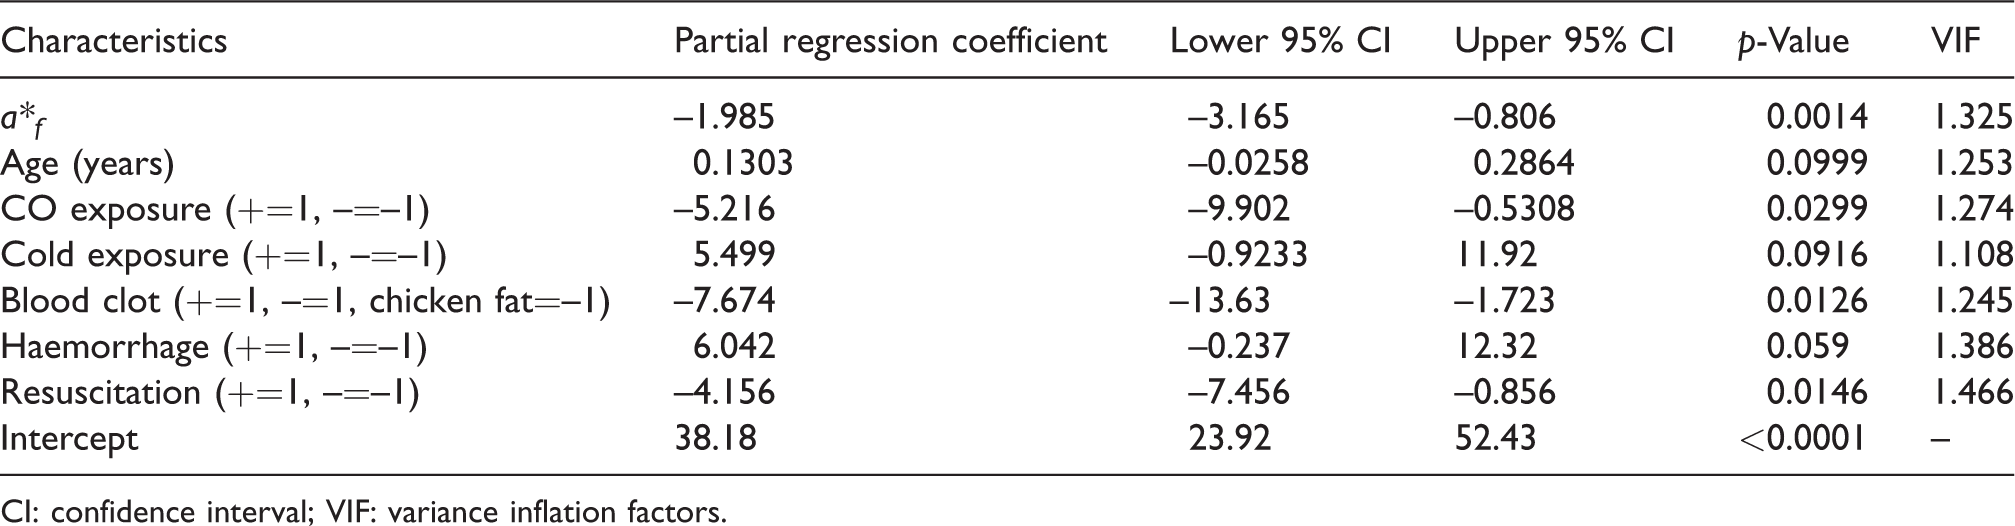
CI: confidence interval; VIF: variance inflation factors.
The equation for the PMI using all blood-colour values is (n = 54; Table 5 and Figure 2):

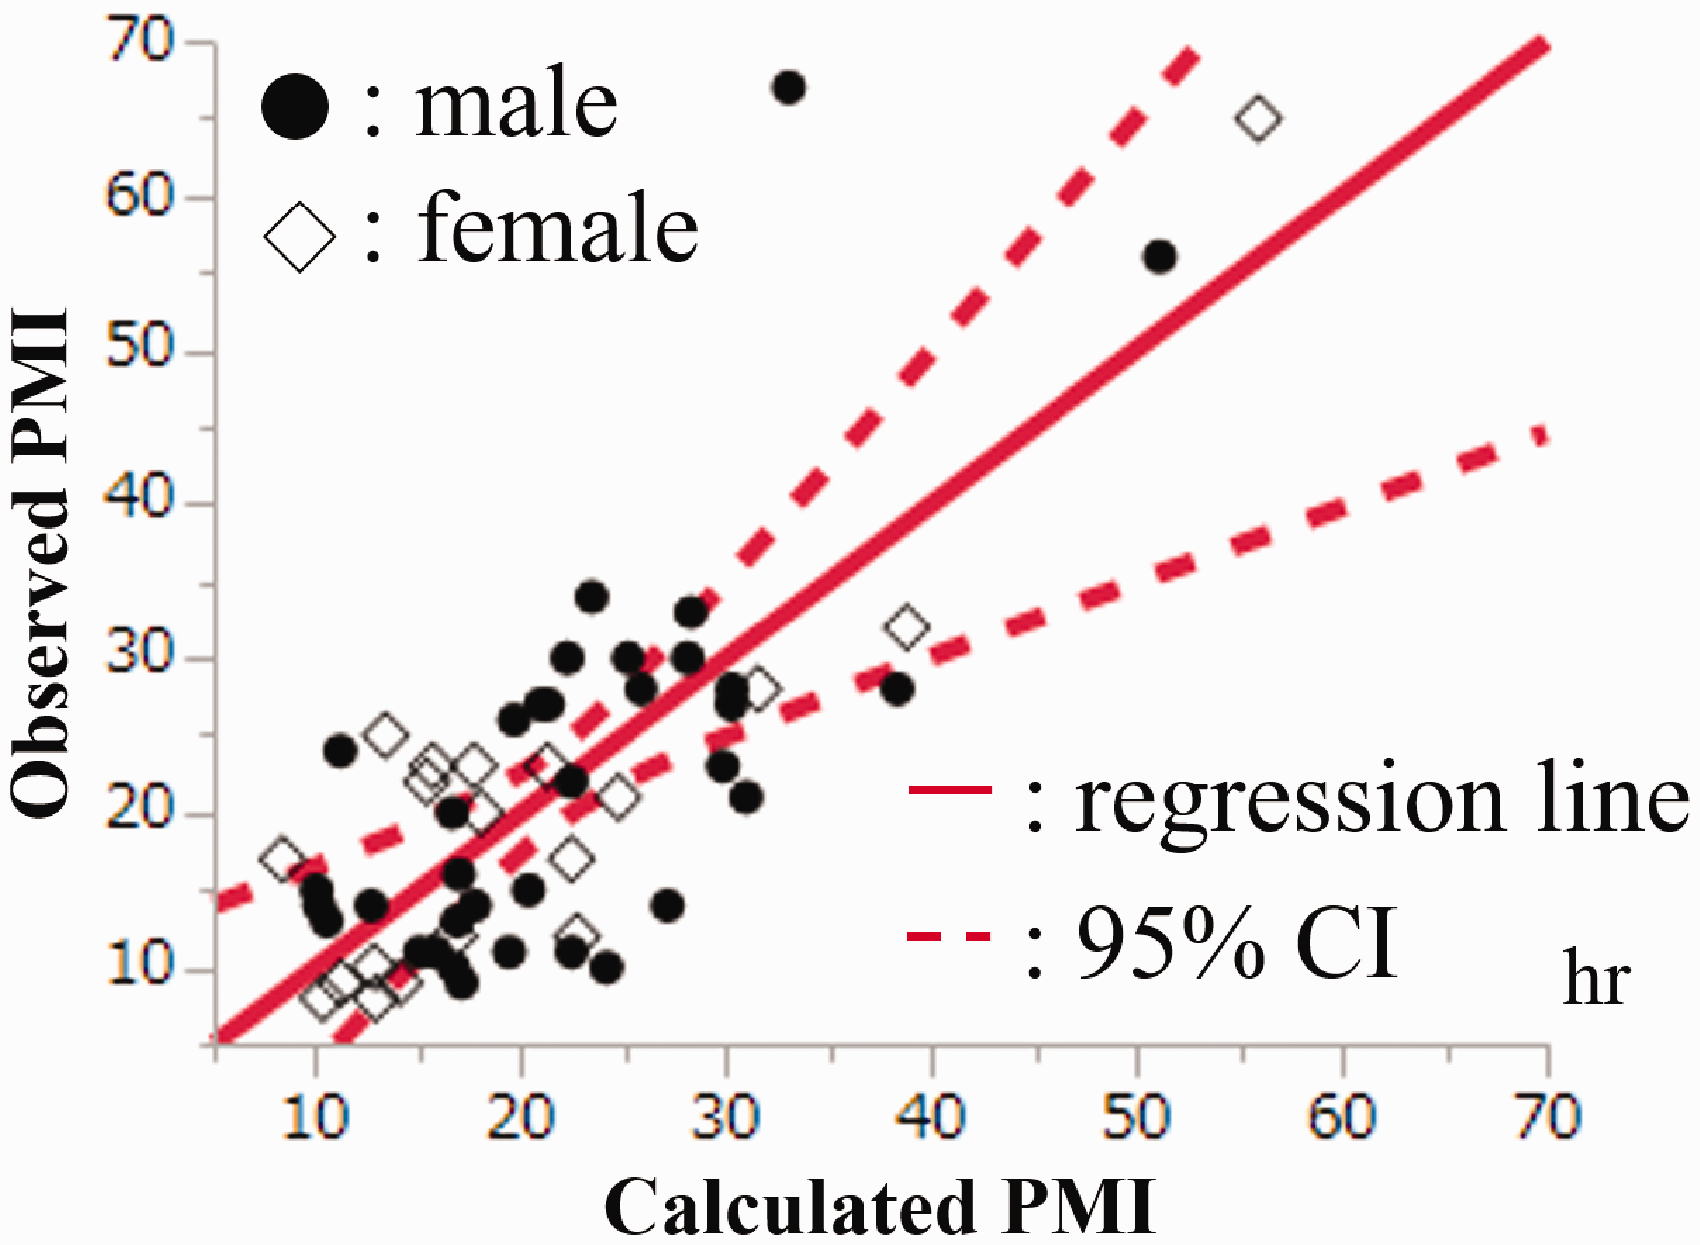
Calculated versus observed PMI values using all blood-colour values. Black circle: male; white diamond: female; red solid line: regression line derived using multiple regression analysis; red dashed line: 95% CI line derived using regression analysis.
Coefficients of equation to estimate PMI using femoral blood-colour values.
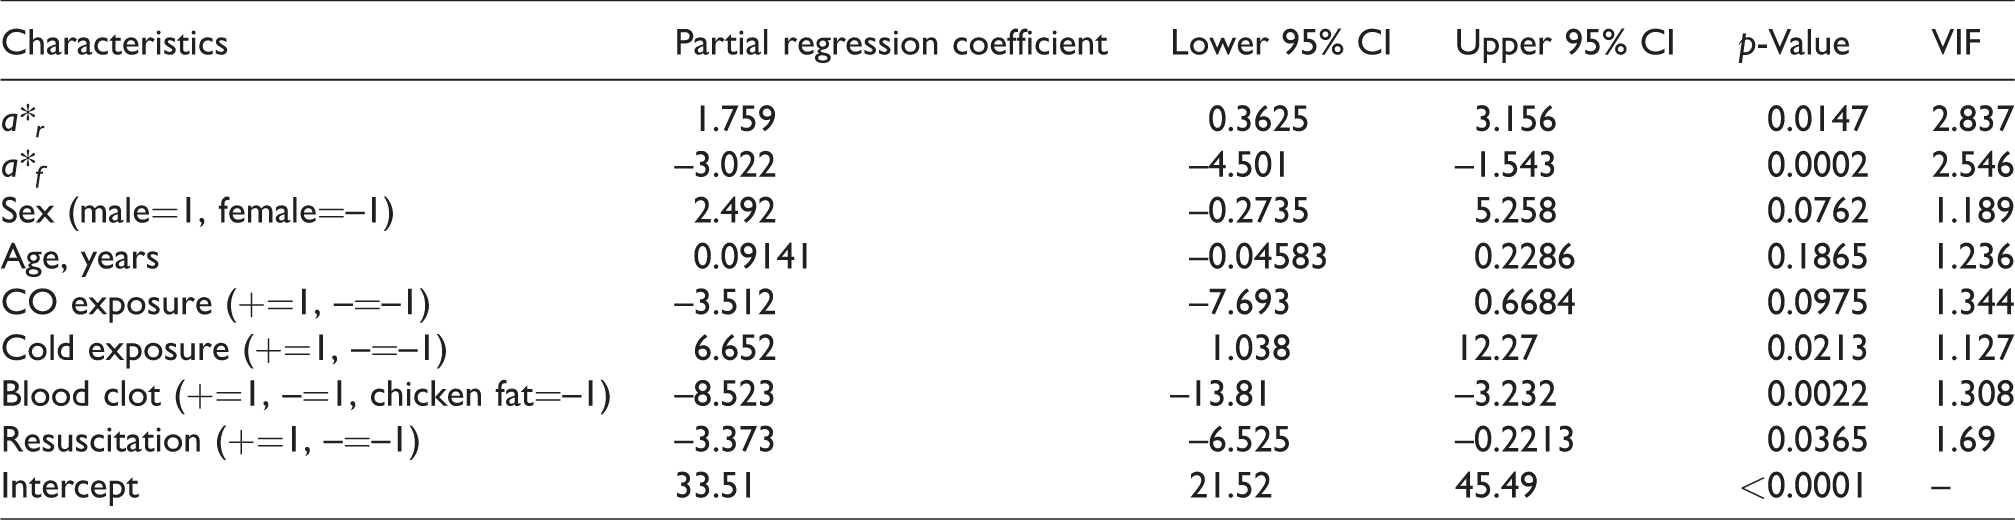
The adjusted R2 was 0.5103, and the RMSE was 8.84 hours.
Discussion
Studies on the blood colour of deceased people have focused on the cause of death, but none have studied blood colour in relation to the PMI.10,11 We focused on the relationship between blood colour and the PMI, and generated the first equations for the PMI using blood colour. We measured the spectrophotometric values of some post-mortem lividity sites and calculated the average value to estimate the PMI using post-mortem lividity colour value. 9 However, compared to this method, measuring blood colour is easy and requires fewer measurements.
The numbers of male and female cases in this study were significantly different (Table 1). Although not statistically significant, the differences in age, L*l, L*r and L*f tended to be higher in female than in male cadaver samples. This suggests that the L* values of a female cadaver’s blood may be higher than those of male cadavers. However, the average female cadaver’s age was higher than that of male cadavers in this study (seven years). We considered the influence of age on L* values. However, we did not find a clear positive association between age and L* values. Thus, L* values may be higher in female cadavers than in male cadavers regardless of age.
In this study, the r2 values between blood colour and age and PMI were low; blood colour and age and PMI were not linearly correlated. So, we generated a predictive equation for blood colour using the various factors that may affect blood colour, including carbon monoxide exposure, cold exposure, age and PMI, in order to identify statistically factors affecting blood colour.10,12
The predictive equations for femoral blood colour tended to have higher adjusted R2 values and lower RMSE values than the equations for left and right ventricular blood colours (Table 3). The reason for this may be that femoral blood is more susceptible to external influences than left and right ventricular blood. In addition, the small number of femoral blood samples compared to the numbers of left and right ventricular blood samples might have affected our results. As shown in Table 3, the factor ‘cold exposure after death’ was not included in any of the equations. This may be the reason why the colour of the post-mortem lividity of bodies kept in the refrigerator was reddish, but the colour of the blood was not reddish. The difference in blood colours due to the sampling site will be the subject of a future study.
We generated predictive equations to estimate the PMI using blood-colour values and autopsy findings. The equation using the spectrophotometric values of femoral blood had higher accuracy than the equations using the values of the left and right ventricular blood samples. This may be due to the above-mentioned sampling site differences. When we interpreted the adopted factors of equations (3) and (4), we ensured that no adopted factors were directly related to the PMI. For example, the factor ‘age’ had no direct association with the PMI because age and PMI were not significantly correlated (r = 0.0338, p = 0.7041). On the other hand, the equations that estimated a*r and a*f included the factor ‘age’ (equations (1) and (2)), and the equations that estimated the PMI (equations (3) and (4)) included ‘age’. We included other factors, such as sex and resuscitation, for the same reason and/or to adjust for selection bias. PMIs were longer in cases where physicians decided not to attempt resuscitation than in cases with resuscitation attempts, which may have caused a selection bias. Also, PMIs tend to be shorter in cases of carbon monoxide exposure than in those without it because carbon monoxide exposure cases were mostly fire cases that were discovered quickly. More studies on blood colour are needed to clarify the association between these factors and PMIs.
In this study, we presented the possibility of estimating PMIs using blood-colour spectrophotometric values. In our previous study, we excluded cases <20 years old, charred bodies and those with bilateral post-mortem lividity in order to estimate PMI using spectrophotometric values of post-mortem lividity. 9 Using the equations created in this study, we could estimate PMIs up to 67 hours, with an accuracy of ± 8.84 hours, without having to measure the colour of post-mortem lividity and without considering the age of the deceased.
Footnotes
Acknowledgements
Declaration of conflicting interests
The authors declared no potential conflicts of interest with respect to the research, authorship and/or publication of this article.
Funding
The authors received no financial support for the research, authorship and/or publication of this article.