



Abstract
In human beings, sexual dimorphism can be well distinguished in almost every bone of the skeleton. Establishing a reliable biological profile is the foremost step in identifying human skeletal remains. Sex determination along with the estimation of age, stature and ancestry comprise the important parameters in establishing a biological profile. The pelvis and skull are considered the most reliable bones in sexing human remains. In the absence of the pelvis and skull, forensic scientists must rely upon other parts of the skeleton for sex assessment. Determination of sex from long bones based on morphological traits can be a challenging task, as there are a few morphological differences between the sexes for long bones. However, metric variations can prove to be helpful, as they are reproducible and more reliable. Metric analysis also has the added benefit of being less biased than nonmetric analysis. This study aimed to establish sex determination standards from tibiae using discriminant function analysis. A total of 17 measurements were taken on 162 dry tibiae (116 males and 46 females) of known sex and in the age range 20–60 years. Discriminant function analysis was performed to derive models for sexing of the tibiae. The breadth of the medial articular surface was observed to be the best parameter for sex prediction from metric measurements of the tibia. In stepwise analysis, only seven parameters – namely, the breadth of the medial articular surface, the condylo-malleolar length, the circumference at the nutrient foramen, the breadth of the lateral articular surface, the maximum length, the transverse diameter in the middle of the bone and the transverse diameter at the level of the nutrient foramen – were entered into the discriminant functions. Overall, the accuracy of sexing was observed to be 93.8% and 95% with the direct method and the stepwise method, respectively. This study provides a database and standards for sex estimation from tibiae based on discriminant function models. This investigation further concludes that tibiae can be used for sex determination in forensic examinations.
Keywords
Introduction
Forensic anthropology is a multidisciplinary field dealing with a spectrum of issues extending from osteology to human physiognomy. 1 The identification of skeletal remains is an important task for a physical anthropologist and comprises a major assignment in archaeological and forensic recovery of human remains. 2 The ‘big four’ – age, sex, race and stature, as referred to by W.M. Krogman – are crucial to all skeletal assessments. Each characteristic narrows down the pool of possible matches considerably. Sex assessment alone restricts the search by half after determining whether the remains belong to a male or female. Thus, the determination of sex forms an essential parameter of biological profiling in forensic anthropology casework and needs primary and notable consideration in the documentation of skeletal remains. 3 Methods of sex estimation are greatly influenced by the population differences apparent in the skeletal framework. Metric analysis is considered highly reliable in sex prediction, specifically for long bones, as they bear apparent and marked size variations compared to sexually dimorphic traits for visual assessment. 4 This research was undertaken to study the sexual dimorphism apparent from the metric observations of tibiae pertaining to a Central Indian population.
The tibia is the second-longest long bone in the human body after the femur, which shows substantial sex differences. 5 Sexual dimorphism in the tibia is the result of general growth, musculoskeletal activity and the genetic structure of the population. 6 The size of the articular surface of long bones is a characteristic of sex. 7 The distal ends of tibiae bear heavy stress, which ultimately is associated with sexual differences. 8 Breadth shows better results than length due to greater muscular development in males. The tibia is an ideal bone for sex determination, as it can resist erosive forces and retains its shape for longer, even after burial and various taphonomic situations. The condylo-malleolar length (CML) of tibiae, maximum breadth of distal epiphysis and sagittal diameter of proximal epiphysis show sexual differences which are the result of early growth cessation in females compared to males. The CML of the tibia is sexually dimorphic because it is more relevant to female growth cessation than growth spurt, which is a well-known characteristic of vertical variables. 9
A number of researchers have worked on sex assessment utilising proximal epiphyseal breadth of the tibia10–13 in different populations. High sexual dimorphism in the areas of the head and distal epiphyses can be attributed to the variable carrying angles exerted by the articular surfaces of long bones. 14 These differences can be seen visually in order to help determine sex. Sex estimation based on a single parameter is not reliable, and a combination of parameters is preferred. In their study on South African black people, Iscan and Miller-Shaivitz 15 found circumference and breadth to be better sex indicators compared to length. In another study, they reported that the femur and tibia show equally dimorphic characteristics in American white people, with the tibia preferred over the femur. Keiser et al. 16 first developed standards for the proximal tibia in the South African Black people for sex assessment and reported an accuracy rate of 96% in males and 92% in females, supporting the study of Holland, 8 who reported the proximal tibia to be a useful sex indicator. Iscan et al. 10 applied discriminant function analysis on seven tibial measurements to study the apparent effect of temporal changes on the skeleton and to develop appropriate standards for sex determination from the tibia accordingly. Proximal and distal breadths were the most discriminating parameters, showing concordance with the present study.
As regards the sexual dimorphism of tibiae, the literature on Indian populations is limited, and that available is on a small sample size. Srivastava et al. 17 studied 58 tibiae (40 males and 18 females) ranging in age from 25 to 58 years collected in the Department of Forensic Medicine, Banaras Hindu University (Varanasi, UP, India). The results showed an accuracy of 82.8% (87.5% for males and 72.2% for females). Seema and Mahajan 18 used the technique of demarking points on 96 tibiae (62 males and 34 females) obtained from the northern region of Punjab for sex prediction, and the tibiae were identified with 100% certainty.
Due to the dearth of sex determination standards from skeletal remains in the Indian population, the present study was undertaken on tibial parameters. The main objective of the present investigation was to assess the sex from various metric parameters of the tibia in a Central Indian population. Further, the accuracy of sex determination was calculated using both the direct and stepwise methods of discriminant function analysis.
Materials and methods
Sample
The study was conducted in the Department of Anthropology, Panjab University (Chandigarh, Northern India) and the Department of Forensic Medicine, Pt. Jawahar Lal Nehru Medical College (Raipur, Central India). The sample for the present study was taken from the Department of Forensic Medicine, Pt. Jawahar Lal Nehru Medical College. The data were based on a total of 162 (116 males and 46 females) dry tibiae of known sex and ranging in age from 20 to 60 years. All the skeletal remains were the part of medico-legal cases submitted by the law-enforcement agencies and police departments to the Department of Forensic Medicine for forensic examination. The present study is part of a larger PhD research project 19 submitted to Panjab University by one of the authors.
Ethical clearance
Before the commencement of the study, ethical clearance was obtained from the Institutional Ethical Committees of the Panjab University, as well as Pt. Jawahar Lal Nehru Medical College.
Osteometric examination of tibiae
Left tibiae were included in the analysis, and those exhibiting signs of trauma, post-mortem damage and/or pathological alterations and samples with noticeable deformity were excluded. A total of 17 measurements – maximum length (ML), length of upper medial articular surface (LMAS), breadth of upper medial articular surface (BMAS), length of upper lateral articular surface (LLAS), breadth of upper lateral articular surface (BLAS), sagittal diameter at nutrient foramen (SDNF), transverse diameter at nutrient foramen (TDNF), circumference at the nutrient foramen (CNF), circumference of mid-shaft (CMS), minimum girth of shaft (MGS), maximum anteroposterior (sagittal) diameter at level of tuberosity (MASDLT), minimum transverse diameter at the level of tuberosity (MITDLT), sagittal (anteroposterior) diameter in middle of bone (SDMB), transverse diameter in middle of the bone (TDMB), maximum proximal epiphyseal breadth (MPEB), maximum distal epiphyseal breadth (MDEB), CML or total length – were taken directly on each tibia.
All the measurements were taken directly on the bones in a well-illuminated room by one examiner (P.M.C.). Each measurement was taken twice (when two measurements did not match, a third measurement was taken, and the average value was considered). Standard anthropometric instruments (osteometric board, sliding calliper and measuring tape) were used for taking measurements in centimetres to the nearest millimetre. The instruments were regularly checked for reliability and accuracy.
Statistical analysis
SPSS v16.0 (SPSS, Inc., Chicago, IL) was used to analyse the data on the above-mentioned parameters of tibiae. The significance of sex and size differences was assessed using Student’s t-test. Discriminant function equations were derived for sex determination using direct and stepwise discriminant function analyses. A predictive model for group membership based on observed characteristics of each case was constructed using discriminant function analysis. A discriminant function or a set of discriminant functions in case of more than two groups that is based on linear combinations of predictive traits was developed, which gave the best discrimination among the groups. It also facilitated selection of the optimal combination of traits in developing discriminant formulae to classify sex. These functions were developed from a known sample. The functions so obtained were then applied to cases with available data but unknown group membership. The data were analysed, and two functions were developed pertaining to both the direct and the stepwise method of discriminant function analysis separately.
Results
Statistically significant sex differences (p < .001) were observed for all the osteometric variables of tibiae included in the study. All the parameters were larger in males than in females, except length of the medial articular surface and breadth of the lateral articular surface. The univariate F-ratio scores were lowest in transverse diameter at the nutrient foramen, breadth of the lateral articular surface, length of the medial articular surface and CML, and the scores were highest in the circumference at the nutrient foramen and the minimum girth of shaft (Table 1).
Descriptive statistics of the measurements taken on the tibia in a Central Indian population for both the sexes.
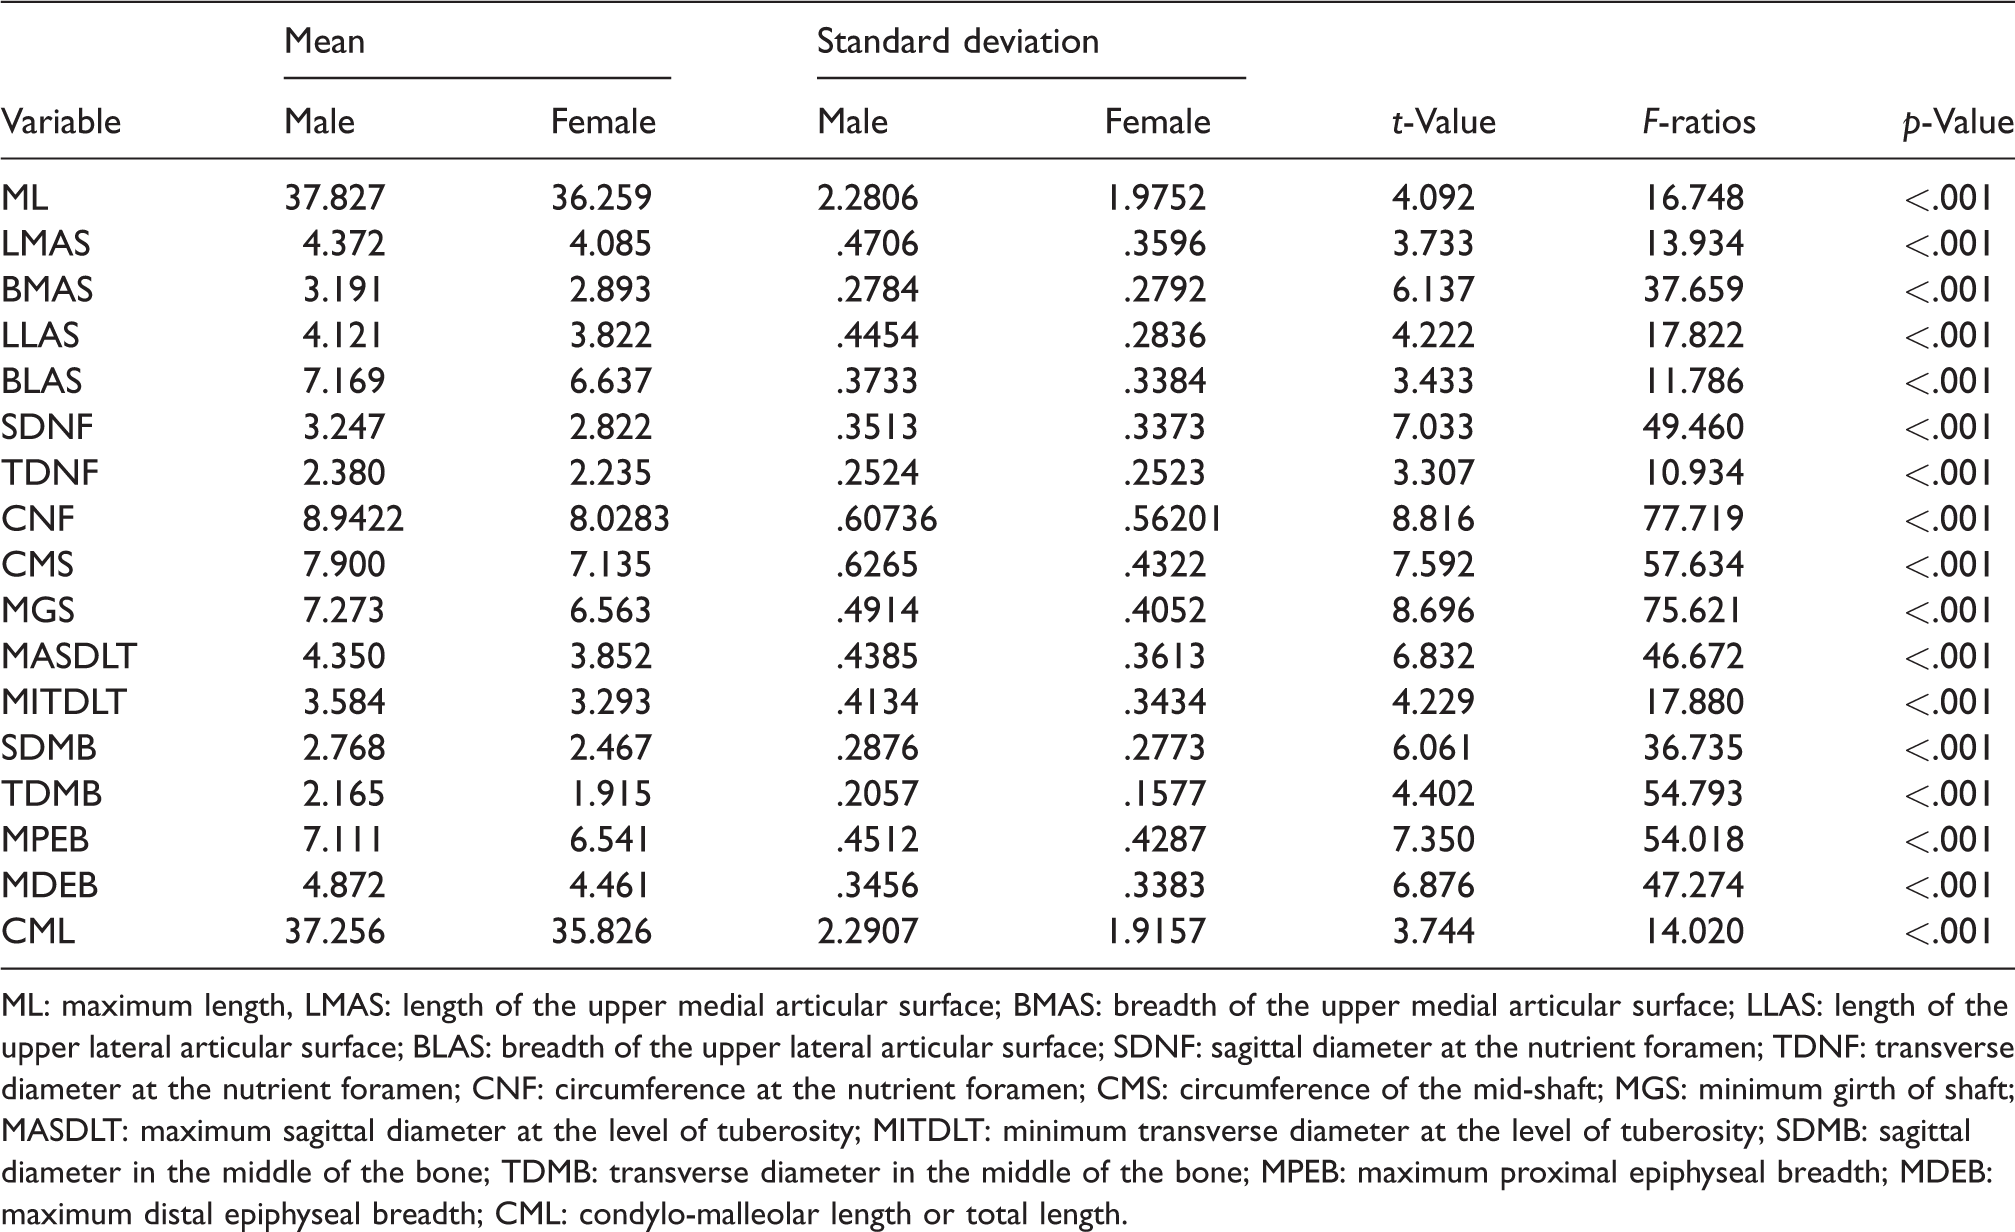
ML: maximum length, LMAS: length of the upper medial articular surface; BMAS: breadth of the upper medial articular surface; LLAS: length of the upper lateral articular surface; BLAS: breadth of the upper lateral articular surface; SDNF: sagittal diameter at the nutrient foramen; TDNF: transverse diameter at the nutrient foramen; CNF: circumference at the nutrient foramen; CMS: circumference of the mid-shaft; MGS: minimum girth of shaft; MASDLT: maximum sagittal diameter at the level of tuberosity; MITDLT: minimum transverse diameter at the level of tuberosity; SDMB: sagittal diameter in the middle of the bone; TDMB: transverse diameter in the middle of the bone; MPEB: maximum proximal epiphyseal breadth; MDEB: maximum distal epiphyseal breadth; CML: condylo-malleolar length or total length.
Direct discriminant function analysis
Canonical discriminant coefficients produced by the direct method, including all the 17 measurements taken from the tibia, are shown in Table 2. The unstandardised coefficient, also called raw coefficient, was used to calculate the discriminant function formulae. The standardised coefficient gives information about the contribution of a variable to the overall classification. Wilks’ lambda helped to test the significance of the derived discriminant functions.
20
The discriminant formula so obtained can be depicted as follows:

Discriminant function analysis for the tibial measurements (direct method).
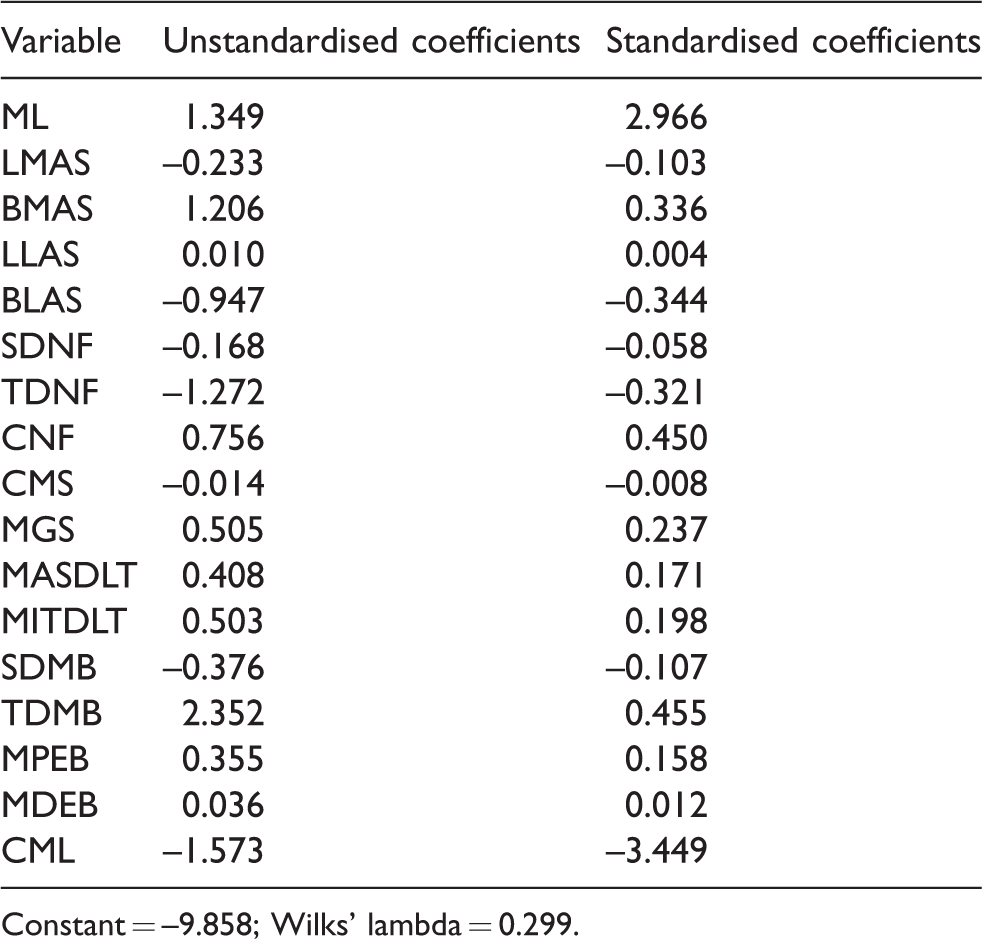
Constant = –9.858; Wilks’ lambda = 0.299.
The group centroid (Table 3) depicts the average discriminant scores for each sex, along with the sectioning point. The sectioning point (–0.73) was calculated as the average value of the group centroids for males and females together. If the discriminant score calculated using the above-mentioned discriminant function formula was greater than the value of the sectioning point (i.e. –0.73 in this case), it was classified as male, and a lower value compared to the sectioning point was classified as female. It should be always taken into consideration that the farther the discriminant score is from the sectioning point, the more certain is the evaluation of sex.
Sectioning point of sex determination based on functions at group centroids using the direct method.
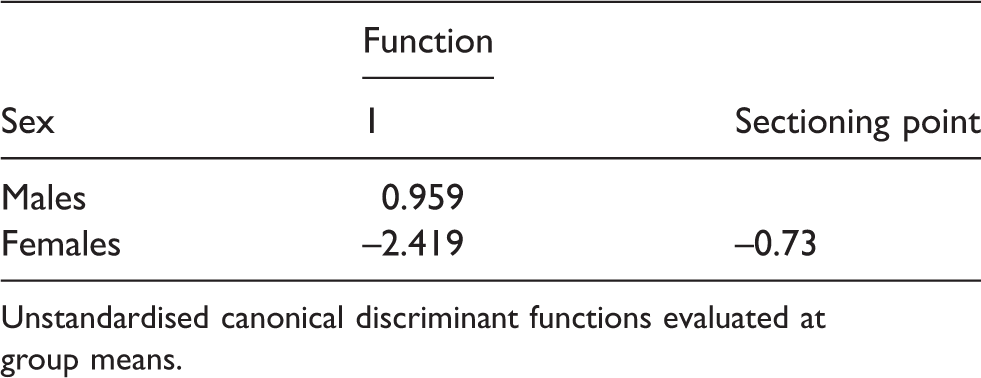
Unstandardised canonical discriminant functions evaluated at group means.
Table 4 shows the classification accuracy of the functions. In total, 95.7% (111/116) males and 89.1% (41/46) females were accurately classified. Misclassification was reported to be higher in females (10.9%) compared to males (4.3%). This variation may be attributed to the higher number of male samples compared to females. An overall accuracy of 93.8% was reported with the direct method.
Percentage classification of sex determination from the tibia derived from discriminant functions using the direct method.

93.8% of original grouped cases were classified correctly.
Stepwise discriminant function analysis
Table 5 shows the variables entered into the discriminant equation. These parameters were selected according to their contribution to the overall accuracy of sex determination, which was based on the value of their Wilks’ lambda.
Wilks’ lambda showing the significance of each derived discriminant functions.

At each step, the variable that minimises the overall Wilks’ lambda is entered.
Table 6 shows the parameters that contributed to the stepwise discriminant function analysis and the order of their selection based on the values of Wilks’ lambda. It can be observed that only seven parameters entered into the discriminant function: breadth of the medial articular surface, CML, circumference at the nutrient foramen, breadth of the lateral articular surface, maximum length, transverse diameter in the middle of the bone and transverse diameter at the nutrient foramen. These variables showed the highest univariate F-ratios and hence showed the highest metric differentiation among the sexes.
Discriminant function analysis for tibial parameters (stepwise method).
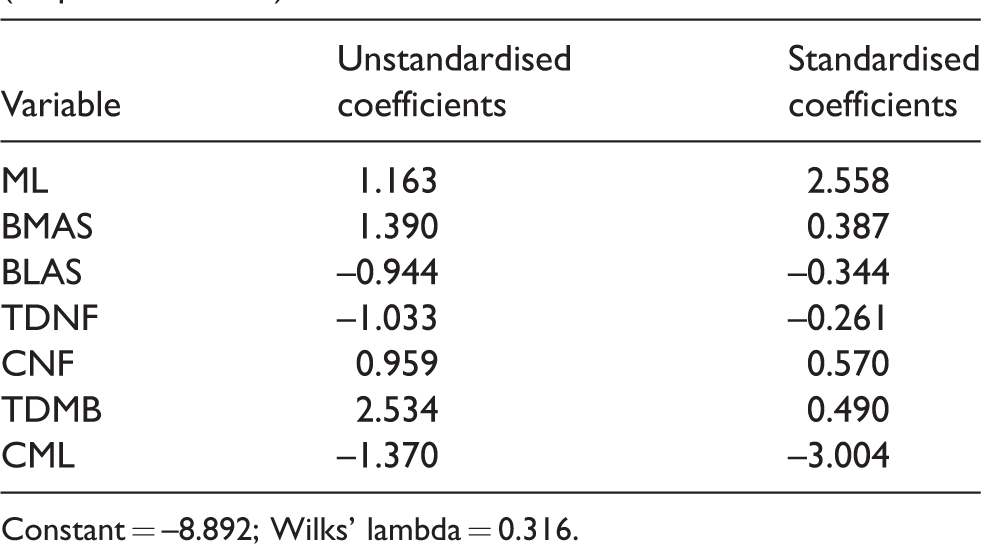
Constant = –8.892; Wilks’ lambda = 0.316.
Canonical discriminant coefficients produced by the stepwise method of analysis are shown in Table 6. An additional column enlists the seven best parameters that contributed to the stepwise discriminant analysis for sex estimation. The discriminant formula so obtained can be depicted as follows:
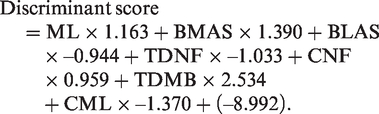
The result obtained was then compared to the sectioning point (i.e. the average of the functions at group centroids (male and female)). The sectioning point was calculated to be equal to –0.70 (Table 7). The classification of accuracy of the functions is depicted in Table 8; 96.6% (112/116) of males and 91.3% (42/46) of females were accurately classified. An overall accuracy of 95.1% was reported with the stepwise method. Breadth of the medial articular surface was observed to be the best parameter for sex prediction from metric measurements of tibiae. A comparison of the percentages of classification accuracy using direct and stepwise discriminant function analyses is depicted in Figure 1.
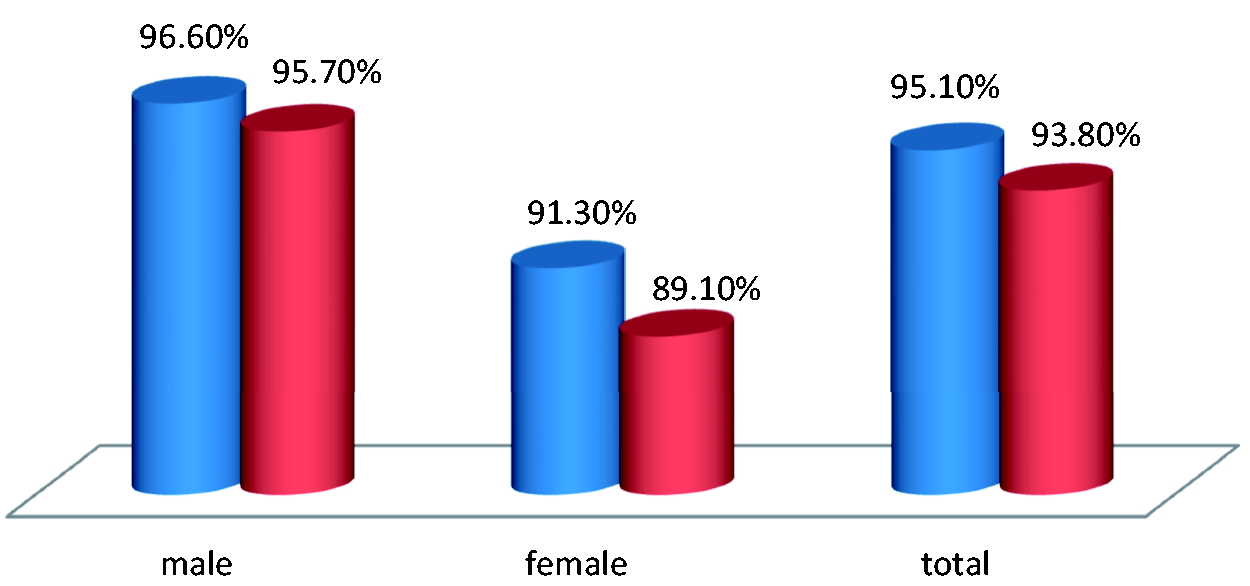
Comparison between percentages of classification accuracy in tibial measurements using direct (red) and stepwise (blue) discriminant function analyses.
Sectioning point of sex determination based on functions at group centroids using the stepwise method.
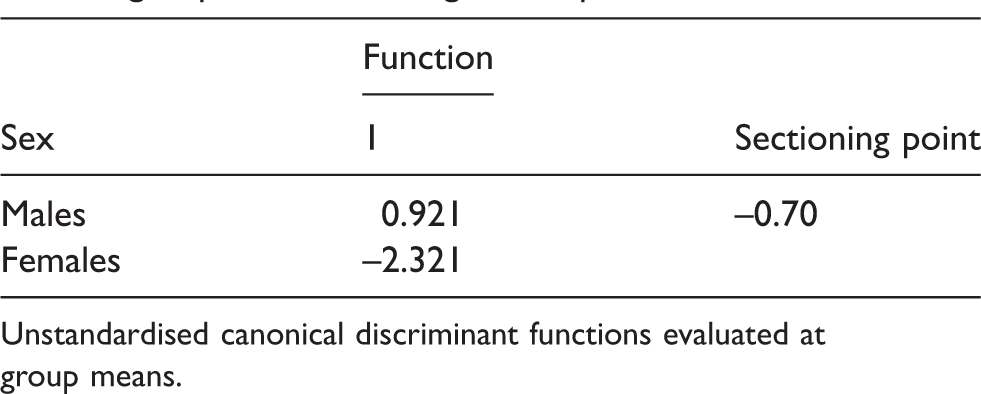
Unstandardised canonical discriminant functions evaluated at group means.
Percentage classification of sex determination from the tibia derived from discriminant functions using the stepwise method.

95.1% of original grouped cases were classified correctly.
Discussion
Among the three commonly used methods for sex estimation (DNA analysis, morphological analysis and anthropometric analysis) from skeletal remains, DNA is considered the most reliable method. However, it is a very expensive and time-consuming process. Besides, in archaeological samples, DNA is likely to be highly degraded, making analysis difficult. Morphological methods lose their reliability in cases pertaining to fragmentation and when areas of bone exhibiting the strongest sexual dimorphism are lacking. They may also be limited by a lack of expertise compared to that required for accurate sex determination. All these shortcomings can be dealt with using anthropometric methods. Application of discriminant function analysis has thus become the most efficient method for sex estimation in archaeological and contemporary populations, as well as forensic cases. 20 Numerous studies have shown strong significance of this method in sex estimation from the tibia. 21 The results of the present study establish that males are more accurately distinguished using metric parameters of the tibia. There is a constant need to update the existing standards in order to account for secular and temporal differences in the community. Standards from one population cannot be applied to another population group. 22
The tibia has been generally studied to assess population specificity. 23 However, the tibia shows a higher degree of sexual dimorphism when compared to other long bones, as it is the body’s weight-bearing bone. Apart from providing support to the body, its proximal end is subjected to continuous and greater stress than any other part of the skeleton. 17 Table 9 presents the best parameters for sex determination from the tibia as reported in different world populations and in the present study. Various studies have revealed that the circumference of the shaft is more sexually dimorphic in long bones compared to the overall length measurements.11,24,25 The proximal end of the tibia, specifically the epiphyseal breadth and the breadth of medial and lateral condyles, have been quantified to predict sex with significantly high degrees of accuracy. 10
Best parameters (predictors) in sex determination from the tibia as reported in different populations and the present study.

Until now, no large study has been conducted to determination sex using tibial parameters for the population of the Chhattisgarh region of Central India. Some individual studies have been reported from other Central Indian regions which lie in Madhya Pradesh State. Hence, the present research focussed on whether sex can be estimated using metric characteristics of the tibia in the Chhattisgarh population of Central India, whenever an unidentified, isolated or fragmentary bone was brought for forensic examination. The research was conducted to develop discriminant function formulae for the tibia specifically for the study population. The present study depicts the parameters contributing to sex determination from the obtained data. The study also provides the discriminant function formulae which, when applied to a tibia from an unidentified skeleton, will help assign sex with more precision and accuracy. However, it must always be remembered that these discriminant formulae are population specific and should not be applied to the skeletal remains of other population groups.
When tibial dimensions of ancient human remains are observed, the results recorded in other series are again similar to those observed in this study. Gonzales-Reimers et al. 11 obtained accuracies from 95% to 98% in a pre-Hispanic population from the Canary Islands. Šlaus and Tomicic 21 achieved accuracy ranging between 81.7% and 92.2% in fragmentary and complete tibiae from medieval Croatian sites. Again, almost identical values were observed by numerous scholars studying tibial dimensions in contemporary populations.10,16 The present study is in agreement with the phenomenon already recorded by other researchers11,23,24 that width and circumference dimensions provide better separation between the sexes compared to length measurements. Several authors11,20 suggest that epiphyseal measurements and mid-shaft circumference are more reliable sex indicators because the functional demands of weight and musculature concentrate on these parts of the bone.
Contrary to other studies,10,15,22 the distal epiphyseal breadth parameter gave poor results as a sex indicator, while proximal epiphyseal breadth showing marked sexual dimorphism was in accordance with other studies.10,15 Breadth measurements showed better sexual dimorphism than length dimensions due to greater muscular development in males. In their study, Šlaus and Tomicic 21 reported accuracy in a composite medieval sample from Croatia to be in the range 82–92%. The results of the present investigation coincide with other studies,10,11,24 showing breadth dimensions to be better than length dimensions for sex assessment. This may be also be attributed to differential bone remodelling, leading to higher cortical bone development in males during adolescence which affects breadth and circumference measurements more than length measurements. 15
López-Costas et al. 26 observed linear growth behaviour among all five measureable variables of the tibia. The CML of the tibia, maximum breadth of the distal epiphysis and sagittal diameter of the proximal epiphysis showed sexual differences that are the result of early growth cessation in females compared to males. This may be attributed to early maturation in females than males 27 and consequently higher cortical bone development in males during adolescence.28,29
Proximal epiphyseal breadth was reported as the best indicator of sex among the seven parameters considered in the study by Janamala et al., 7 This is also in agreement with other studies.11,24 Distal epiphyseal breadth in males was broader than in females but was comparatively less significant than proximal epiphyseal breadth. This observation was in agreement with the results of Gonzalez-Reimers et al. 11 in which distal epiphyseal breadth was inferior in accuracy to proximal epiphyseal breadth.
In a study conducted by Janamala et al., 7 71 unknown human adults were analysed by discriminant function analysis for sex determination of the tibia. Different parameters showed variable accuracies when subjected to binary logistic multivariate discriminant analysis. The length of the tibia showed somewhat similar values as reported by Iscan and Miller-Shaivitz 24 in South African blacks. Average accuracy rates of 72% (males) and 57% (females) were achieved.
According to Iscan and Miller-Shaivitz, 24 the tibia showed higher sexual dimorphism than the femur in American whites. Keiser et al. 16 reported 96% accuracy in males and 92% in females in a South African population. Japanese tibiae accuracy rates ranged from 80% to 89%, 10 while American whites gave an accuracy rate of 87% using the tibia. Gonzales-Reimers et al. 11 reported proximal epiphyseal breadth to be the best assessor, with an accuracy rate of 94.9%. Still higher accuracy was observed in females (98.3–100%). Šlaus et al. 30 reported the highest accuracy (91.1%) with all the variables except tibial length. The lowest accuracy (84.4%) was reported when only one variable was used.
Iscan et al. 10 reported an average accuracy of 80–89% with proximal epiphyseal breadth to be the best assessor. Higher classification accuracy was observed in males (96%) than in females (79%). In their study on South African blacks, Iscan and Miller–Shaivitz 24 reported higher accuracy (90%) than for whites (87.3%) with proximal epiphyseal breadth.
In a study by Brzobohatá et al., 31 a 3D morphometric evaluation of sexual dimorphism in the tibia was done based on digital depiction of the entire bone. Geometric morphometric methods and colour-coded surface divergence maps were used to detect size and shape variations among males and females. The authors found this surface-based approach to be a successful tool for complex long-bone geometric analysis.
In a study carried out by Kranioti and Apostol, 23 the tibia of different populations in Southern Europe – namely, Greece, Italy and Spain – were analysed in order to develop standards for sex estimation. An accuracy range of 88% using all three variables was reported using discriminant functions of the pooled sample for Southern Europeans.
Nagoaka and Hirata 32 reported 80% accuracy with univariate discriminant functions and 90% with multiple variables of long-bone circumferences. Srivastava et al. 17 reported 82% overall accuracy in their study on 58 tibiae, with 87.5% accuracy in males and 72.2% in females.
To check the level of reliability or misclassification, pre-published discriminant functions of the tibia developed for Portuguese, Southern European and North American populations were applied to dimensions of the Czech population by Kotěrová et al. 33 The study showed higher degree of overestimation and misclassification in females from the Czech population. A significant decrease in the overall accuracy of sex assessment (53.6–69.7%) was reported, which may be attributed to the secular trends and large body-size unpredictability.
Breadth of the medial and lateral articular surfaces gave the best results in the present study, which is in accordance with other authors10,24 who advocate that the proximal measurements in the tibia show the highest sexual dimorphism. The variation in the percentage accuracy of the present study with other studies, as well as among male and female samples within the study, may be attributed to the difference in the sample size among the two groups. As the male group is larger than the female group, this may have an impact on the percentage accuracy and hence on the sex-determination process. Thus, the findings of the present study further reinforce the need of similar studies in different population groups of India, as well as the other parts of the world. The present study also emphasises the development of discriminant functions based on skeletal collections representative of geographical and chronological diverse populations.
Conclusion
Fewer morphological differences between the sexes for long bones4,14,31,34,35 and a lack of standards for sex determination from skeletal remains in the Indian population prompted us to undertake this metric study on the tibia. The main aim of the study was to develop discriminant function models for sex determination from the tibia. The study observations provide conclusive information for identification purposes and in developing a biological profile in the case of unknown skeletal remains. Fragmentary and incomplete skeletal remains are frequently encountered in forensic casework. Thus, separate discriminant functions should be established for variables associated with different parts of the skeleton. In the present study, overall, sex determination accuracy of the tibia with both the direct method and the stepwise method was 93.8% and 95%, respectively. Males were more accurately distinguished than females. The study will assist in forensic and archaeological examinations, as the tibia can resist erosive forces and retains its shape for longer, even after burial. Furthermore, the ability to attain a high degree of accuracy is necessary for highly burdened forensic laboratories.
The present study is one of the very few studies conducted on dry bones in India. Considering the lack of forensic standards for sex determination on documented skeletal collections in India, the present study emerges to be a major contributor to the forensic and anthropological literature.
Footnotes
Acknowledgements
The authors wish to acknowledge the Department of Anthropology (UGC Centre of Advanced Study in Anthropology); Panjab University, Chandigarh, India; and the Department of Forensic Medicine, Pt. JLNM Medical College, Raipur, Chhattisgarh, India, for providing the platform to write such an exhaustive work in forensic anthropology. Kewal Krishan is supported by a DST PURSE GRANT and the UGC Centre of Advanced Study (CAS II) awarded to the Department of Anthropology, Panjab University, Chandigarh, India. Thanks are also due to the University Grants Commission, New Delhi, for awarding a research fellowship to the principal author (PMC) for pursuing a PhD.
Declaration of conflicting interests
The authors declared no potential conflicts of interest with respect to the research, authorship and/or publication of this article.
Funding
The authors received the following financial support for the research, authorship and /or publication of this article: This work was supported by a University Grants Commission research fellowship, New Delhi, India; a DST Purse Grant, Panjab University, Chandigarh, India; and the UGC Centre of Advanced Study (CAS II) awarded to the Department of Anthropology, Panjab University, Chandigarh, India.