
Abstract
Extant histomorphometric aging methods based on the analysis of the femoral cortex generally report small samples (N<100) and highly variable standard error of the estimate (SEE) values (±1.51‒16.98 years). The present paper reviews the published literature on femoral histomorphometry for age-at-death estimation in order to examine the relationship between sample size and SEE values, and makes recommendations for minimum reporting requirements for age-at-death studies based on statistical data. The SEE from a total of 33 studies are analysed. Sample size and confidence intervals are explored using Hennig and Cooper’s simulation modelling. Analysis of effect size through a fixed-effect model is performed on 5/33 studies to examine the relationship between sample size and effect size. The pooled sex formulae from Nor et al., Martrille et al. and Thompson and the two sex-specific formulae of Pfeiffer are examined, as they report mean and standard deviation values for both chronological and estimated ages. The results of these analyses support sampling theory, specifically wide variation in SEE when N<100, narrowing as the sample size increases, and lower effect sizes in the larger of the five studies examined. The findings provide some support for a minimum threshold of 100‒150 individuals for histomorphometric age-at-death estimation. Analysis of effect size is suggested for future investigation in meta-analyses of forensic anthropological age-estimation studies. To ensure increased precision and meaningful comparison, large samples should be used for histomorphometry, and authors should report SEE and discrete statistics (e.g. n, mean, standard deviation) for both chronological age and estimated age.
Introduction
Given its inherent morphological robustness associated with high survivability post-mortem, 1 histological analysis of the femur has been widely investigated for potential applications in forensic and archaeological age estimation. 2 Histological age-estimation techniques can be broadly categorised as one or more of the following: (a) histomorphometric, involving quantification of histological features such as osteons, through counts or metric measurements 2 ; (b) biomechanical, quantifying biomechanical properties of bone, such as resistance to stress and strain, and microhardness 3 ; and (c) biochemical, examining and measuring the organic and inorganic components that make up bone, such as collagen and calcium. 4 In the present study, only histomorphometric age-at-death methods are examined. Such age estimations are based on an understanding of bone remodelling. During life, bone is continually remodelled, with new osteons developing over the top of older osteons, which are then resorbed and become visible only as fragments of interstitial lamellae. 5 Thus, the ratio of intact to fragmentary osteons (known as the osteon population density (OPD)) can be used to estimate age at death. 6 Eventually, the osteon asymptote will be reached. This is the point where the OPD reaches a plateau. There is also a recorded inverse relationship between OPD and osteon geometry. As the OPD increases, the size of the osteons decreases, constrained by the available area. 7 The measurement of osteon geometry can be applied to quantify that relationship, with various age-estimation methods measuring osteon and Haversian canal area, perimeter, diameter and circularity.6,8,9 The relationship between histomorphometric variables and recorded chronological age is examined through regression modelling, which is also used to produce age-at-death estimation formulae. It is important to note that variation in the process of ageing, in addition to other factors that influence bone remodelling (e.g. biomechanics and pathology) can vary between and within individuals, which can introduce a source of inaccuracy in age estimation.10,11
Unfortunately, predictive equations that cover a broad age range (e.g. the entire adult lifespan) are typically produced from small samples (<100 individuals). This is largely because of constraints relative to destructive sampling and/or the availability of cadaveric samples. As a result, the associated standard error of the estimate (SEE) values for histomorphometric age-at-death estimation is large and highly variable when the study sample is small. 12 SEE is a measure of prediction accuracy quantifying the summed differences between a known and estimated factor, which in the framework of the present study is age in years. Accurate methods with narrow SEE values are important in forensic contexts, where they may identify or exclude an individual on the basis of their age. 2 In archaeological studies, broader age ranges (from larger SEE values) may be acceptable, depending on the context of the study. For example, estimating if an individual is a young (18–34 years), middle-aged (35–49) or older adult (50+ years) may be sufficient.
The need for larger samples in histomorphometric studies has been previously considered in the literature,13–15 with some consensus that larger samples are more statistically robust and result in SEE rates that are less sensitive to the effect of individual outliers. Hennig and Cooper 12 analysed 40 histomorphometric age-estimation studies that used various skeletal elements, including the femur, humerus, tibia, mandible, rib, metacarpal and clavicle, and simulation modelling to determine that the minimum sample size needed to represent the variation accurately in a broader population was 150 individuals. Thus, if the model is correct, studies with sample sizes over this threshold will have SEE rates that are more reliable and thus more representative of the broader population that they are supposed to represent. Furthermore, this threshold, if correct, can inform which techniques should be applied and which require validation on larger samples. The present study aimed to explore the relationship between sample size and SEE further in published histomorphometric age-at-death studies of the femur based on a review of the literature, a comparison to Hennig and Cooper’s simulation model and a statistical comparison of studies that report discrete statistics for both the sample and the estimates produced. The overall objective of the study was to propose recommendations for minimum reporting requirements for age-at-death studies based on statistical data.
Methods
Literature review
As a general rule in histomorphometric studies, the selection of variables is based on those that produce the most accurate results, or according to whether an existing formula is being assessed (e.g. Lagacé et al. 16 validated Goliath et al. 8 ). Non-digital studies (e.g. pre-1990s) frequently did not apply software for imaging or measurement, relying instead on counts and estimations of percentage remodelling performed ‘down the microscope’. While the latter may introduce a potential source of error, such studies tend to report lower standard error rates.
Accordingly, a search of the published literature was performed for femoral histomorphometric aging techniques that report both sample size (N) and the SEE (in years) of individuals of known chronological age. The specific process is illustrated in Figure 1. Each of the studies examined in the present study has an associated reported standard that one must assume incorporates both human and method error. Aside from the potential effect of sample size, we assume population specificity and ontogenetic variability may also account for the differences in SEE for validation studies, but not for population specific studies where the most accurate variables were chosen to produce a prediction formula from the study sample.
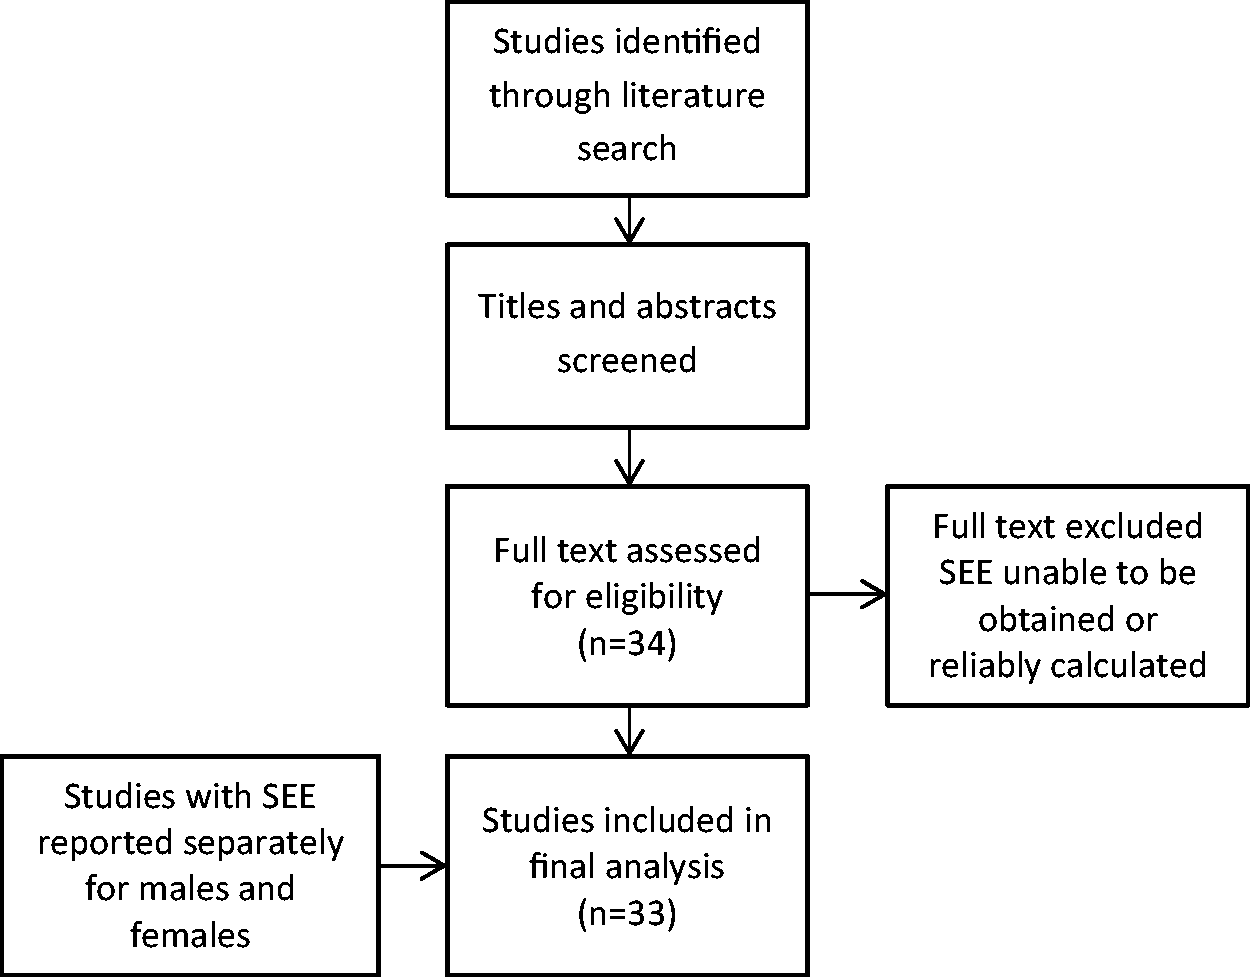
Flow chart of the literature review process.
Inclusion criteria
Studies that involved purely automated methods for assessment or measurement of histological features were excluded. Only manual methods were included. Studies that utilised a combination of histological aging techniques and biomechanical or biochemical methods were also excluded, as they are not directly comparable, and they may be unsuitable when the skeletal material has been physically compromised or exposed to harsh environmental conditions, 17 which is not uncommon in an archaeological or forensic context. Studies published in languages other than English were also excluded unless also summarised in another English language study (e.g. Zhu 18 is summarised in Kimura 19 and in Hennig and Cooper 12 ). Published articles, theses/dissertations and abstracts were included provided they met the above criteria. Studies where SEE was not provided were only included if the SEE was able to be reliably calculated by the author using the available raw data (e.g. through contact with the corresponding author) or if it had previously been calculated and included in Hennig and Cooper. 12 All studies that met these criteria (N = 33) were compiled into a master spreadsheet after assessment of the full text. A summary of those studies is provided in Table 1.
Sample descriptions and reported standard error of the estimates for femoral histomorphometric aging techniques.
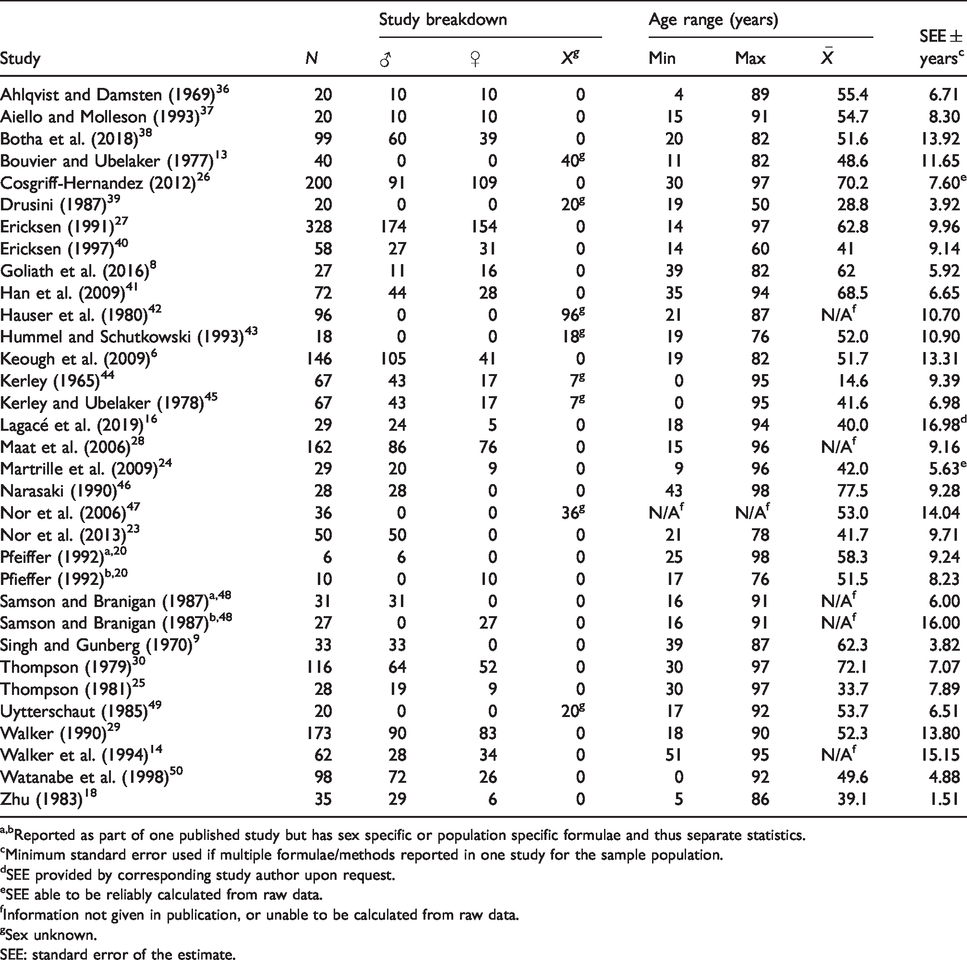
a,bReported as part of one published study but has sex specific or population specific formulae and thus separate statistics.
cMinimum standard error used if multiple formulae/methods reported in one study for the sample population.
dSEE provided by corresponding study author upon request.
eSEE able to be reliably calculated from raw data.
fInformation not given in publication, or unable to be calculated from raw data.
gSex unknown.
SEE: standard error of the estimate.
Sampling protocol for studies with multiple SEE values
Following Hennig and Cooper,
12
the following protocols were applied: (a) the lowest reported SEE values were included in the case of multiple equations; (b) studies were reported as separate cases for sex-specific equations when a pooled-sex standard was not included (e.g. Pfeiffer
20
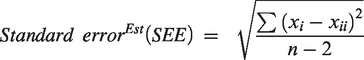
); and (c) if the SEE was provided for pooled sex, it was selected instead of the separate sex-specific SEE values, as identifying sex is not always possible, and thus this is more representative of the expected precision of applying these standards. The formula used to calculate SEE is as follows:
Standard error, sample size and sampling theory
Sampling theory states that sample variance is a less accurate reflection of the true variance in the broader population when the sample size is small (N<100). 21 Using simulation modelling, Hennig and Cooper 12 demonstrated this relationship, showing that as sample size increased in the simulation, the standard error values converged upon a narrower range (approximately 10 years) that represented the ‘true’ standard error of the broader population. Graphically, this relationship produces a funnel plot: large variances in standard error values when the samples are smaller (<100), narrowing to a smaller range in variance values as the sample increased. Based on this modelling, Hennig and Cooper 12 concluded that after a minimum threshold of 150 individuals, standard error rates more reliably reflected the variance expected within a broader population. That relationship is also supported by Oosterhuis et al., 21 who state that for regression modelling (the statistical basis of most histomorphometric age estimation studies) samples between 100 and 500 individuals sufficiently represent the norm of the variance in a population.
In the present study, to explore sampling theory between standard error and sample size, the standard error values of the 33 included studies are plotted against their respective sample size, with the 95% confidence intervals from Hennig and Cooper 12 overlaid for comparison.
Statistical analyses
Descriptive statistics (mean, min, max, standard deviation) for the included studies were calculated using IBM SPSS Statistics for Windows v25 (IBM Corp., Armonk, NY). Linear regression was performed to assess linear correlations between variables. Effect size is a statistical tool for comparing two groups within and across multiple studies. In this instance the two groups compared are chronological and estimated age. Cooper and Hedges 22 recommend a fixed-effect model if the number of studies incorporated is small (defined as n≤5), with a Hedges' g statistic recommended when N<20. For Hedges’ g-values between ±0 and 0.49, the effect is considered small. Between ±0.5 and 0.79, the effect size is considered moderate. For g-values ≥±0.8, the effect size is considered high. In the present study, the analysis of effect for each published study was calculated using an open-source Microsoft Excel worksheet (Centre for Evaluation and Monitoring) and Comprehensive Meta-Analysis Software v3 (Biostat, Englewood, NJ). The worksheet was used to calculate the effect size for the difference between two groups (chronological and estimated age) by comparing the mean, sample size and standard deviation for each group in each study. The meta-analysis software was used to confirm the accuracy of the results obtained from the worksheet and to apply a fixed-effect model for multiple study comparison. Only 5/33 studies provided detailed raw data, or reported the mean and standard deviation values for both chronological and estimated age to facilitate their inclusion in the analysis (see Table 2).
Sample size, mean and standard deviation for chronological and estimated age by study.
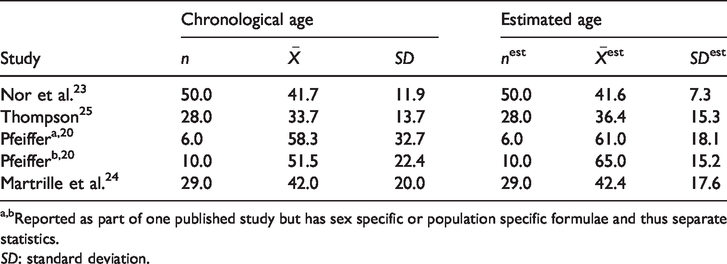
a,bReported as part of one published study but has sex specific or population specific formulae and thus separate statistics.
SD: standard deviation.
A forest plot was also performed to illustrate the effect size of each study on the fixed-effect model. This is a standard output of the Comprehensive Meta-Analysis Software which visually represents effect size. The effect size is quantified through the size of the marker, with the associated line representing the confidence interval for each study. A skew towards –1 represents more differences in the chronological age group, whereas a skew towards +1 represents more differences in the estimated age group. Ideally, there should be minimal difference between chronological and estimated age, with the point estimate on or close to the line of no effect (represented by the value 0) and a narrow confidence interval.
A chi-square test of heterogeneity was performed to determine if the studies were homogenous (p<0.05, I2>50%) or heterogeneous (p>0.05, I2>50%). If heterogeneity was high, then the studies were deemed not to be directly comparable.
Results
Sample size and standard error
The plot of the identified studies comparing sample size and standard error is presented in Figure 2, with the 95% confidence intervals from Hennig and Cooper’s 12 simulation modelling overlaid. It is evident that there is high variability in the reported SEE values, which range from ±1.51 to 16.98 years. Of the 33 studies plotted, 27 had sample sizes of fewer than 100 individuals, two had 100‒150 individuals and only four reported more than 150 individuals. While the plot does not follow Hennig and Cooper’s confidence intervals exactly, there is a visible narrowing of standard error values as samples increase.
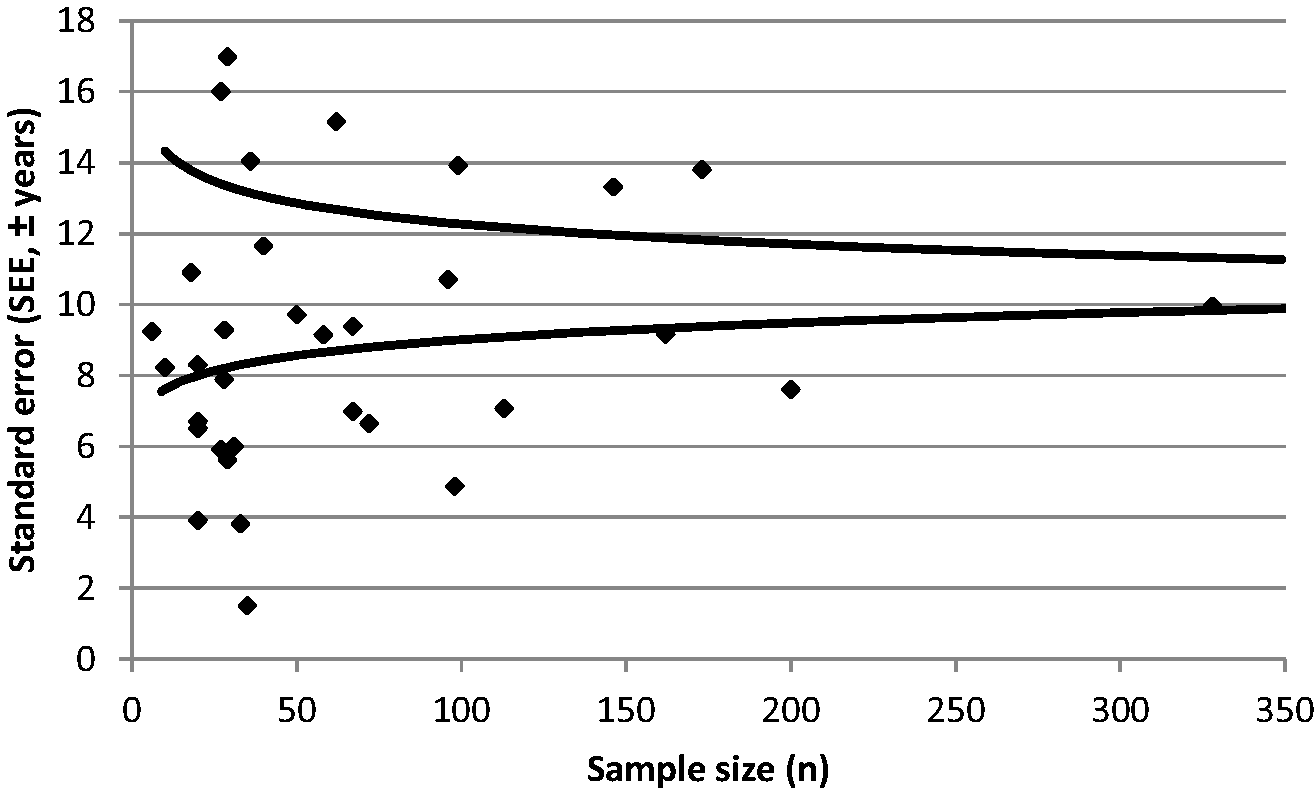
Scatter plot of 33 femoral histological age
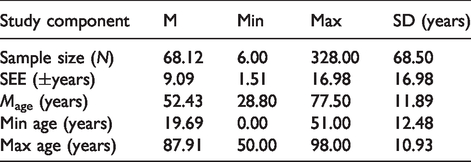
Descriptive statistics and correlation
Descriptive statistics of the study sample are presented in Table 3. There was no significant correlation between the age ranges of the included studies and their respective SEE values (adj. R 2 = –0.037, p = 0.421). There was also no significant correlation between sample size and SEE (adj. R2 = –0.006, p = 0.189).
Descriptive statistics of the 33 femoral histological age
Effect size
The results of the effect-size analyses comparing the descriptive statistics for chronological and estimated age groups for the five studies are presented in Figure 3. The Hedges’ g-value for Pfeiffer 20 is greater than ±0.5 and therefore shows a moderate effect. The overall fixed model, however, demonstrates a small effect of –0.104. The p-values for each study and the fixed model were not significant (p<0.05). Nor et al. 23 had the narrowest confidence interval with a more central position on the forest plot, followed by Martrille et al. 24 and Thompson. 25 Those studies also had the largest samples (N = 50, N = 29 and N = 28, respectively). The chi-square test for heterogeneity indicated that the groups were homogenous (χ2 = 2.210, df = 4; p<0.001; I2<0.001.
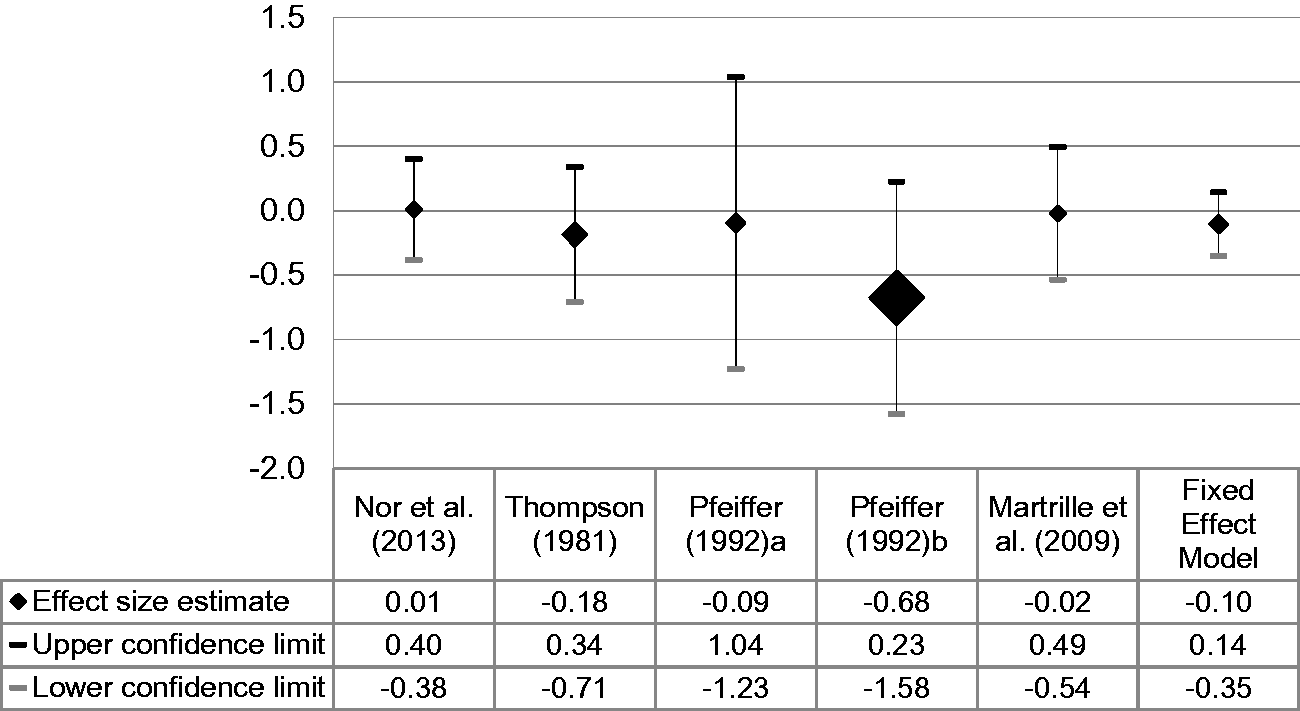
Forest plot of the effect size estimate (Hedges’ g) and 95% CI for each study and the fixed-effect model in the effect-size analysis.
Discussion
Histomorphometric analysis of femoral microstructure has demonstrated potential utility for forensic age-at-death estimation when gross morphology cannot be used and in the absence of DNA identification of the deceased. 2 It is evident from the literature that the reported sample and standard error values for histomorphometric age-at-death estimation are highly variable, as shown in Table 1. Only 4/33 included studies reported samples of more than 150 individuals, these being Cosgriff-Hernandez, 26 Ericksen, 27 Maat et al. 28 and Walker. 29 A further 2/33 studies reported population sizes of 100‒150 individuals: Thompson 30 and Keough et al. 6 However, age-at-death estimation formulae have been produced from samples as small as six individuals, despite regression analyses requiring a minimum of 100 individuals to represent the population norm accurately according to Oosterhuis et al. 21 Based on simulation modelling, Hennig and Cooper 12 established a minimum threshold of at least 150 individuals for histomorphometric age-at-death estimation. This is especially problematic, given the age-at-death formulae are designed to represent the entire adult lifespan but may also have been derived from individuals representing only the upper part of that lifespan, with a general skew towards older individuals in collections comprising donated cadavers. This can lead to decreased accuracy when these formulae are applied to individuals in a population who are younger than the minimum age represented in the original reference sample. 31 The main reasons for the lack of larger samples are in part due to ethical and practical concerns regarding histological sampling being destructive, 32 in addition to teaching-cadaver collections or documented anthropological skeletal collections being limited in number and size, 33 with shortages of donated cadavers. 34 Virtual collections (such as databases of computed tomography scans and three-dimensional virtual dissections) and associated alternative methods are increasingly used for teaching and research as a proxy for physical specimens, particularly in geographic areas without large documented skeletal repositories. 35
The scatter plot of the standard error against sample size for each of the femoral histomorphometric studies examined (Figure 2) supports the premise of sampling theory and the conclusions of Hennig and Cooper 12 : (a) high variability in SEE when the sample size is low, and (b) the range of SEE values narrowing in around the 10-year mark as the sample size increases. The plot is roughly funnel shaped, but does not exactly fit within the confidence intervals from the simulation modelling of Hennig and Cooper. 12 It is important to note that there is a paucity of published femoral histomorphometric studies where N>150. Thus, the variance in SEE values for larger studies is underrepresented on the graph.
Analysis of effect size demonstrated that studies with the least effect difference and narrowest confidence intervals between the chronological and estimated age groups were those with the largest samples of the five studies examined: Nor et al. 23 (N = 50, Hedges’ g = 0.01), Martrille et al. 24 (N = 29, Hedges’ g = –0.02) and Thompson 25 (N = 28, Hedges’ g = –0.18). As shown in Figure 3, those three studies had narrower confidence intervals and a more central position on the forest plot around the central line of no effect. The other two studies are the sex-specific equations from Pfeiffer. 20 Both are derived from fewer than 10 individuals. Thus, the large confidence-interval range is to be expected, although one (a) is centrally located on the plot, which could occur from equal over- and under-estimations, or from random chance that these individuals were accurately estimated. There appears to be a relationship between sample size and effect size, with larger samples having a smaller least-effect difference, and the fixed-effect model comparing across studies also demonstrating a narrow confidence interval and small effect size. Unfortunately, the number of studies included in this effect-size analysis is small (N = 5), as few studies met the reporting requirements for further analysis (i.e. mean, min, max and standard deviation for actual and estimated age), and thus no definitive interpretation on sample size versus effect can be made from this alone, as the relationship needs testing on a larger number of studies to provide more robust and reliable statistical data. Effect size is a promising tool for the meta-analysis of forensic anthropological age-estimation studies, which needs further investigation.
The lack of studies that reported sufficient statistical data for comparison highlights a further important point for consideration: the necessity for standardised reporting requirements for histomorphometric studies. There is no standard protocol for reporting results of age-estimation studies, which makes critical analysis and comparison between such studies difficult. If at minimum, studies reported population size (N), mean and standard deviation for both the study sample and the estimates produced, along with calculated standard error of the estimate (SEE), a more robust comparison would be possible. Given there is also a paucity of validation studies performed for existing histomorphometric age-estimation formulae, the inclusion of descriptive statistics for both the sample and the estimates would also be beneficial for future validation, which could then be used to perform more comprehensive comparisons between populations when the same formula/method has been used.
Conclusion
This study examined the relationship between sample size and standard error in published histomorphometric age-at-death studies of the femur. Smaller samples (N<150) had variable standard error rates, which may not accurately represent the variation in the broader population examined. Larger samples (n≥150) had a narrower range of standard error values, presumably closer to the actual variation in the population. The results of this study provide further empirical support to Hennig and Cooper’s simulation modelling and their associated recommended threshold of 150 individuals for histomorphometric age-at-death estimation. The examination of effect size raised an important issue for age-at-death estimation studies in general. There should be a standardised requirement to report sample size, mean, standard deviation for both chronological age and estimated age as well as standard error (SEE). Providing the latter will result in more robust analyses, with more comprehensive validation, comparison and meta-analysis of methods being possible.
Supplemental Material
sj-pdf-1-msl-10.1177_0025802420945939 - Supplemental material for Femoral histomorphometric age-at-death studies: The issue of sample size and standard error
Supplemental material, sj-pdf-1-msl-10.1177_0025802420945939 for Femoral histomorphometric age-at-death studies: The issue of sample size and standard error by Ariane Maggio and Daniel Franklin in Medicine, Science and the Law
Supplemental Material
sj-pdf-2-msl-10.1177_0025802420945939 - Supplemental material for Femoral histomorphometric age-at-death studies: The issue of sample size and standard error
Supplemental material, sj-pdf-2-msl-10.1177_0025802420945939 for Femoral histomorphometric age-at-death studies: The issue of sample size and standard error by Ariane Maggio and Daniel Franklin in Medicine, Science and the Law
Footnotes
Acknowledgements
The authors would like to thank the reviewers for their constructive comments.
Declaration of conflicting interests
The authors declared no potential conflicts of interest with respect to the research, authorship and/or publication of this article.
Funding
The authors disclosed receipt of the following financial support for the research, authorship and/or publication of this article: A.M. is supported by an Australian Government Research Training Program (RTP) Scholarship.
References
Supplementary Material
Please find the following supplemental material available below.
For Open Access articles published under a Creative Commons License, all supplemental material carries the same license as the article it is associated with.
For non-Open Access articles published, all supplemental material carries a non-exclusive license, and permission requests for re-use of supplemental material or any part of supplemental material shall be sent directly to the copyright owner as specified in the copyright notice associated with the article.