
Abstract
This paper uses plant-level estimates of total factor productivity covering 40 years to examine what role, if any, productivity has played in the decline of output share and employment in British manufacturing. The results show that TFP growth in British manufacturing was negative between 1973 and 1982, marginally positive between 1982 and 1994 and strongly positive between 1994 and 2012. Poor TFP performance therefore does not appear to be the main cause of the decline of UK manufacturing. Productivity growth decompositions show that, in the latter period, the largest contributions to TFP growth come from foreign-owned plants, industries that are heavily involved in trade, and industries with high levels of intangible assets.
1. Introduction
Manufacturing in many developed countries has been in continued and steady decline, both in terms of share of GDP and employment, over the past four decades. 1 However, the decline in both measures has been particularly steep in the UK (Moffat, 2013; Government Office for Science, 2013). Nevertheless, manufacturing still makes a disproportionate contribution to the UK economy: a recent report on manufacturing in the UK (Government Office for Science, 2013) notes its relatively high productivity, its accounting for half of UK exports in 2010 (despite only contributing 10 per cent to gross value added), its greater propensity to undertake R&D and introduce innovations, the strength of its inter-industry linkages and its use of highly-skilled labour. The importance of manufacturing is not new (see Kaldor, 1966; Harris, 1987), but recognition of it now underpins a commitment by the UK Government to halt its long-run decline (BIS 2010, 2012b). 2
The aim of this paper is to consider whether the productivity performance of manufacturing has played a role in its long-run (relative) decline. Since productivity (and especially the productivity of both labour and capital inputs into the production process, i.e. total factor productivity, or TFP) is widely recognised as the key driver of long-run economic growth (e.g., Krugman, 1997; Baumol, 1984; O'Mahony and Timmer, 2009; Van Reenen, 2013), it is important to understand the progress of TFP in all sectors of the economy. But since part of the decline in manufacturing has historically been linked to its poor productivity performance (e.g., O'Mahony, 1998; O'Mahony and de Boer, 2002), such an understanding is of particular relevance here. Therefore, in this paper, we use plant-level data from the Annual Business Survey (ABS), conducted by the UK Office for National Statistics (ONS), to provide a detailed review of the productivity performance of British manufacturing from 1973 to 2012.
The next section describes the relative decline in UK manufacturing compared to other major economies and presents TFP estimates calculated using growth accounting methods applied to industry-level data. Section 3 discusses our preferred approach for estimating TFP for each manufacturing plant in the ABS. In section 4, these estimates are used to decompose productivity growth to show whether productivity growth/decline over 1973–2012 was the result of within-plant increases in productivity or reallocations of output shares across plants. Section 5 attempts to explain trends in TFP in 1994–2012 by showing which groups of plants have contributed most to productivity growth. Groups are defined by ownership, levels of industry outsourcing, ‘openness’ to trade, labour force composition, and intangible assets. The paper concludes with a summary and brief discussion of policy options.
2. Manufacturing performance
De-industrialisation in the UK (i.e., the decline of manufacturing's share of total economy GDP) has occurred faster than in other major economies; figure 1 shows that, in 1970, the sector accounted for the second largest share of GDP among the countries considered, but by 2014 it had experienced the largest relative decline (a 20 percentage points fall). However, figure 2 suggests that this was not due to poor TFP performance (based on the growth accounting approach) since TFP in UK manufacturing saw a steady rise over the 1973–2007 period (with a major setback following the Great Recession). Moreover, UK TFP performance was comparable to that in France and Germany and much better than Italy's, although not as strong as in the USA. By contrast, British TFP growth in non-manufacturing was at best lacklustre. 3
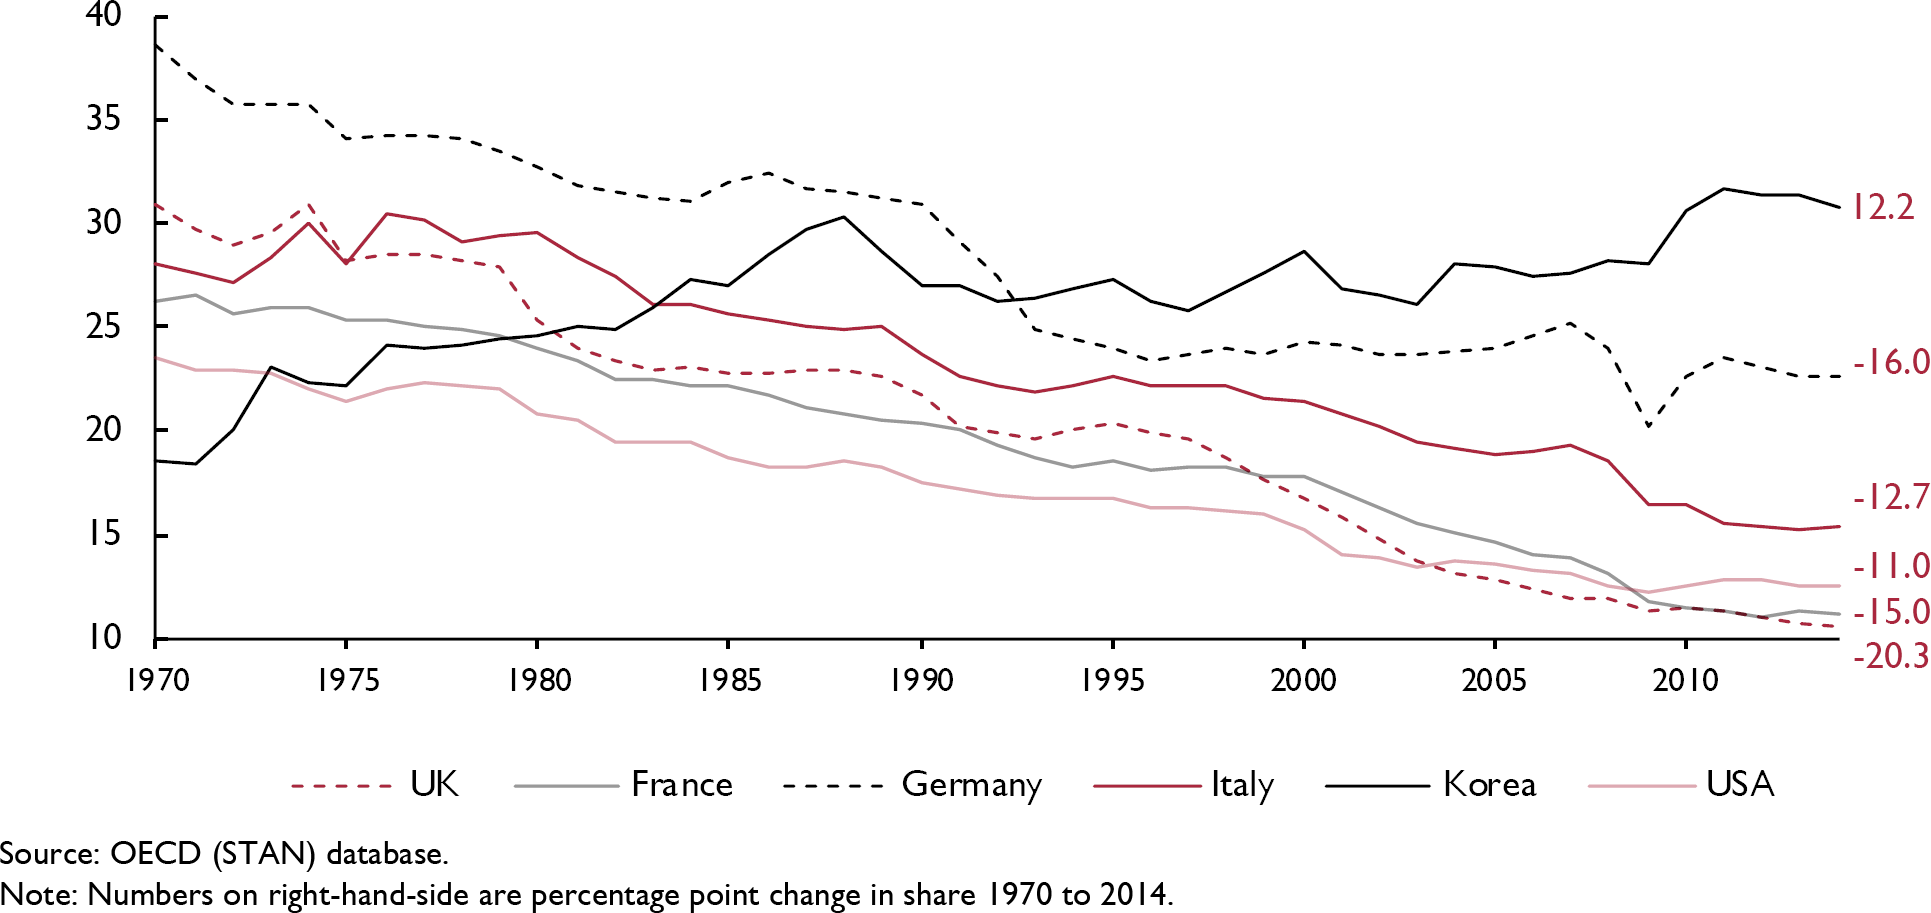
Manufacturing percentage share of GDP, 1970–2014
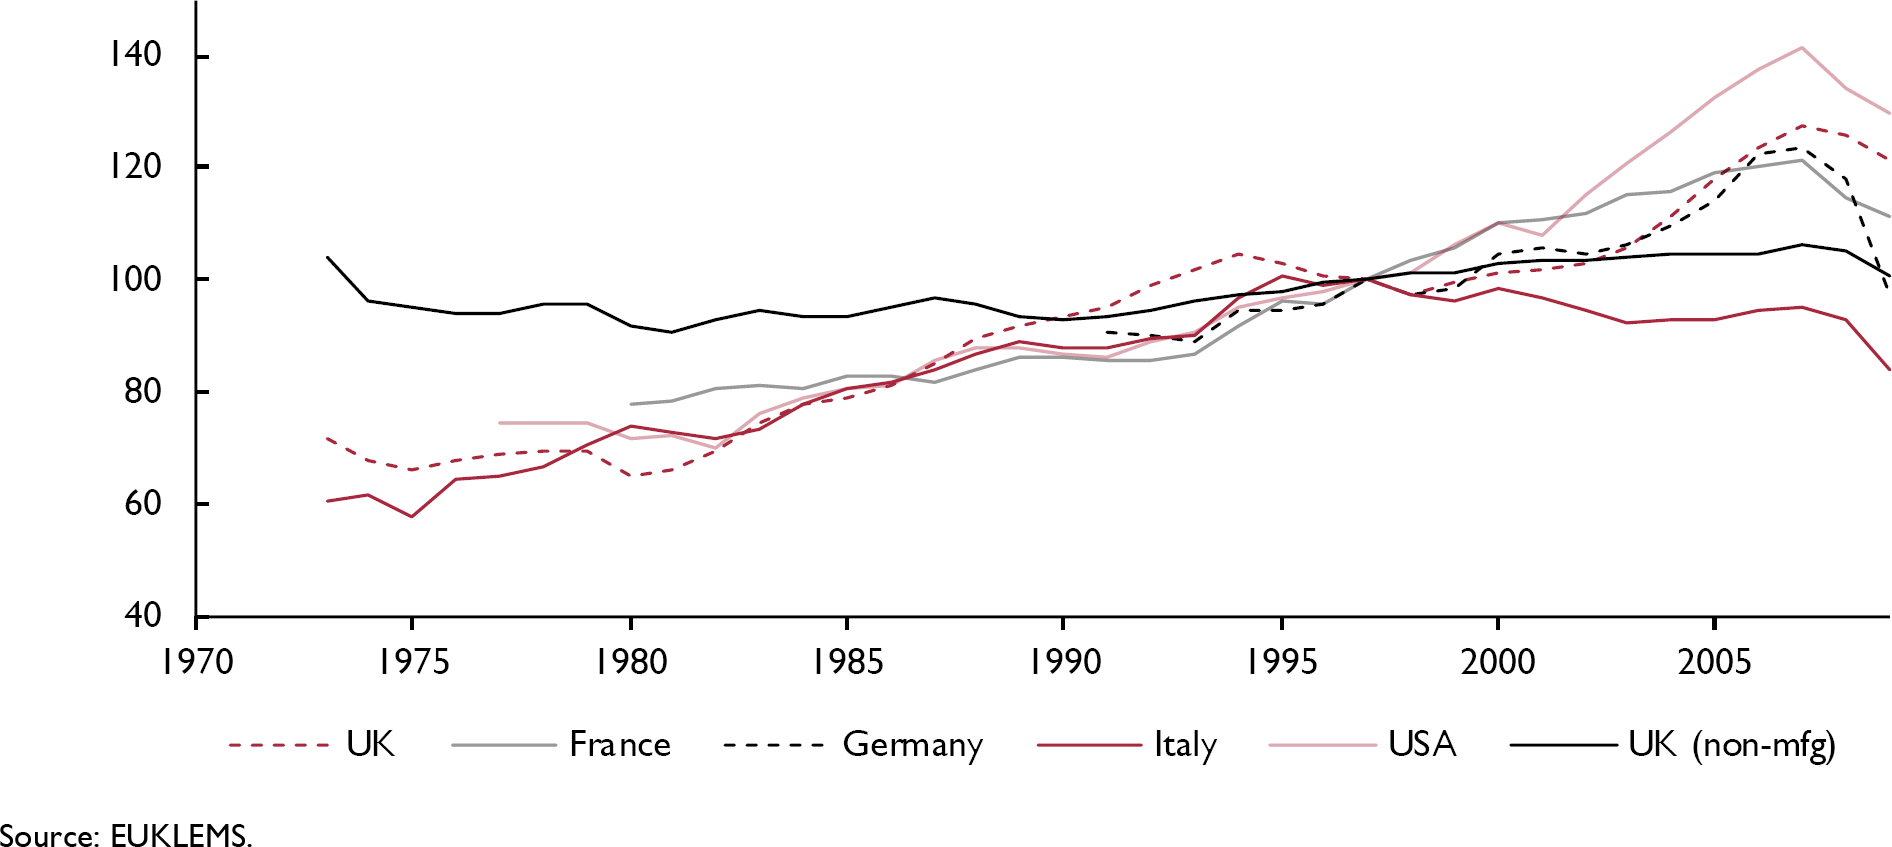
Manufacturing TFP index (growth accounting approach), 1973–2009 (1997=100)
The above TFP results based on the growth accounting approach are useful but limited since there are problems both with the methods used to construct TFP and the use of industry-level data (cf. Caves, 1998; Restuccia and Rogerson, 2008). Some of the methodological issues with the standard growth accounting approach are: the typical use of gross value-added rather than gross output measures of production (see Gandhi et al., 2012, for a discussion of the limitations of the GVA approach); 4 the imposition of constant returns-to-scale; the assumption of perfect competition in factor and output markets (necessary since output elasticities are equated to factor input cost shares in total revenue); and the treatment of TFP as an unexplained residual. 5 The use of aggregate data is problematic as, for example, micro-level empirical evidence consistently indicates that plants/firms are heterogeneous with respect to productivity and industry-level data typically over-estimate measures of the capital stock, since the capital of plants that cease production usually remains in the industry-level measure of the stock. 6 Moreover, the use of aggregate data precludes an analysis of whether reallocations of output shares explain the evolution of aggregate TFP. It is therefore not possible to state whether the above trends are the result of the closure of low TFP plants (i.e. a selection effect), within-plant increases in TFP, or a more efficient allocation of output shares among surviving plants. Such an analysis is provided in the next section.
3. Plant-level estimates of TFP
In this study, we use plant-level panel data for manufacturing covering 1973–2012. The basic approach is described in the earlier analysis of Harris and Moffat (2015a), that estimates TFP for market-sector plants operating in Great Britain in 1997–2008, although certain variables, such as R&D spending and whether a UK-owned plant belonged to a multinational enterprise, are only available since 1997 and are therefore omitted here. Harris and Moffat (op. cit.) describe in detail the rationale for inclusion of the variables in the model, the data (and especially the use of plants rather than firms as the unit of analysis) and the econometric methodology, and the reader is referred to the earlier article for detailed information. Below, only the core elements of the approach used are set out. 7
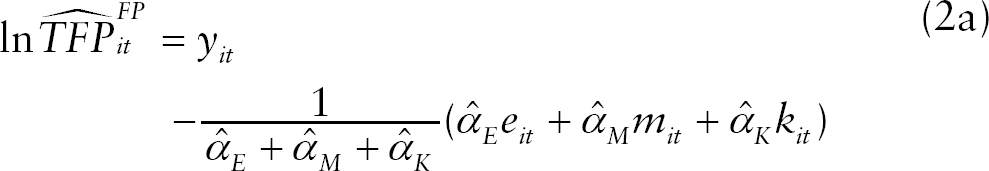
TFP is estimated by plant (i.e., local unit) for each year covering 1973–2012 for manufacturing sectors as defined using the 1980 Standard Industrial Classification (SIC). The first step was estimation of Cobb-Douglas log-linear production functions for each 2-digit industry (with certain industries sub-divided into 3-digit groupings – see the online appendix for details) using a system-GMM approach to address the issues of endogeneity inherent to production function estimation:
8


However, equation (2) is not a proper TFP index, because the measure of input growth

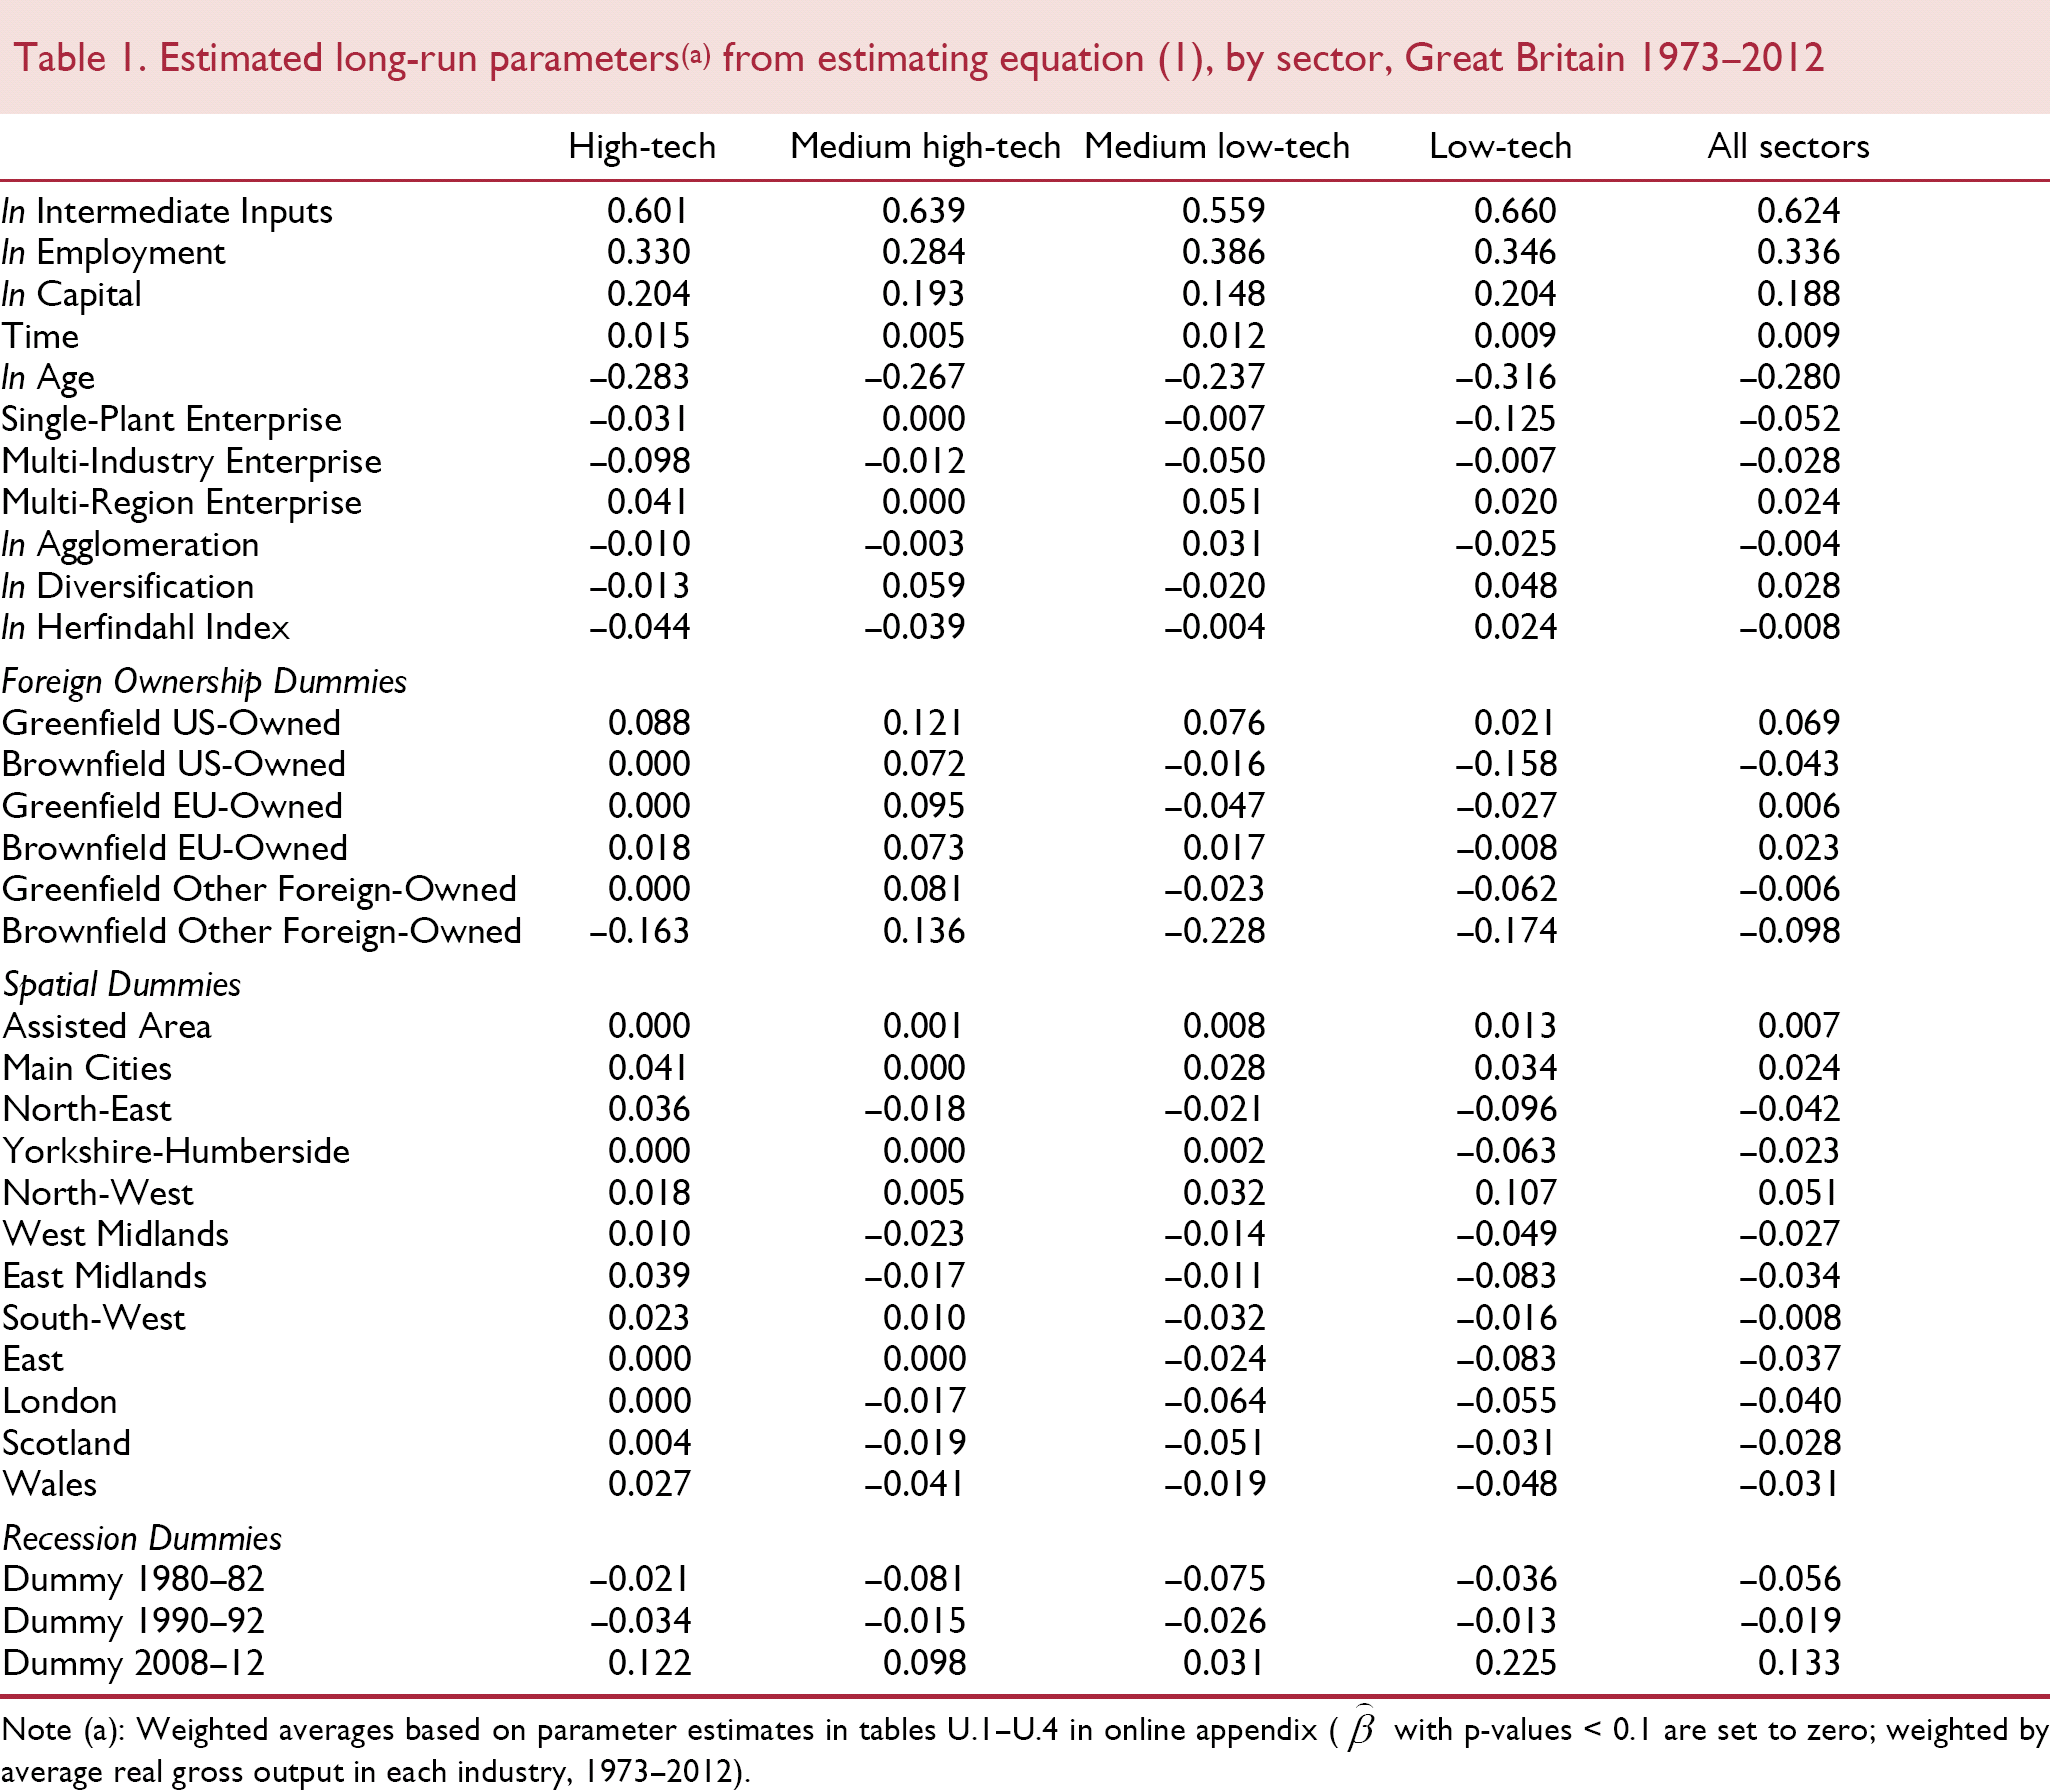
Average estimates for the output elasticities used to predict TFP are provided in table 1 (the actual values are available in the online appendix, tables U.1–U.4, which shows that the estimates for all 25 models estimated are economically sensible – overall returns-to-scale across manufacturing equal 1.15 12 – and the models pass tests of the validity of the instruments 13 and of autocorrelation). While the parameter estimates associated with Xit in equation (1) are not the major focus of this paper, a brief commentary on the results obtained is warranted. Foreign-owned plants generally have higher TFP in high- and medium high-tech manufacturing but lower TFP in medium low- and low-tech manufacturing. Technical change was highest in high- and medium-low tech manufacturing.
Estimated long-run parameters(a) from estimating equation (1), by sector, Great Britain 1973–2012
Weighted averages based on parameter estimates in tables U.1–U.4 in online appendix (
In terms of spatial variables, the results suggest agglomeration (diversification) is associated with lower (higher) TFP, but there is significant variation across the different sub-groups. The results for being located in an assisted area are mostly not significant. In contrast, the effect of being located in a city is positive in all sectors apart from medium high-tech manufacturing, which is consistent with the literature on the effects of urbanisation (see Harris and Moffat, 2012, for a discussion of this literature and further evidence on city and region effects). No negative regional effects are obtained against the South-East benchmark in high-tech manufacturing whereas, with the exception of the North-West, regional effects are mostly negative in other sectors, suggesting that high-tech plants differ from other plants in that they are not disadvantaged by location in more peripheral regions. 14
Older plants are uniformly less productive. Single-plant enterprises, and plants belonging to multi-industry enterprises, tend to have lower TFP and those belonging to enterprises operating in more than one region have higher productivity. Table 2 also includes the parameter estimates for three ‘recession’ dummy variables. Generally, TFP experienced a large, negative shock during the 1980–82 recession, a smaller negative effect in 1990–92, but a large positive shock post-2007 (especially in low-tech manufacturing).
Foster et al. (2001) productivity growth decomposition, 1973–2012, by sub-period

Note: The second and third terms on the right-hand-side of the equal sign in equation (5) are combined.
Figure 3 plots aggregate labour productivity and TFP obtained using equation (2a) in manufacturing for 1973–2012. Comparison of figures 2 and 3 15 shows that the growth accounting measure of TFP is less cyclically sensitive (to the early recessions), has sustained growth in TFP between 1981 and 1994, and shows a major dip post-2007. The finding that manufacturing productivity did not experience a large fall in the latter period is consistent with recent evidence from micro-data (Field and Franklin, 2013; Harris and Moffat, 2016) 16 showing that falls in the level of aggregate TFP since the Great Recession were mainly driven by services. However, table 3 also confirms that TFP growth in manufacturing stalled between 2008 and 2012 after rapid increases in the preceding period. Manufacturing therefore conforms to the pattern that productivity growth has tended to decline significantly in sectors that experienced rapid growth prior to the financial crisis (Riley et al., 2018). Overall, the correlation between the TFP series in figures 2 and 3 is 0.96, indicating that both follow similar time-paths. This again suggests that TFP performance did not play a major role in the relative decline of UK manufacturing.
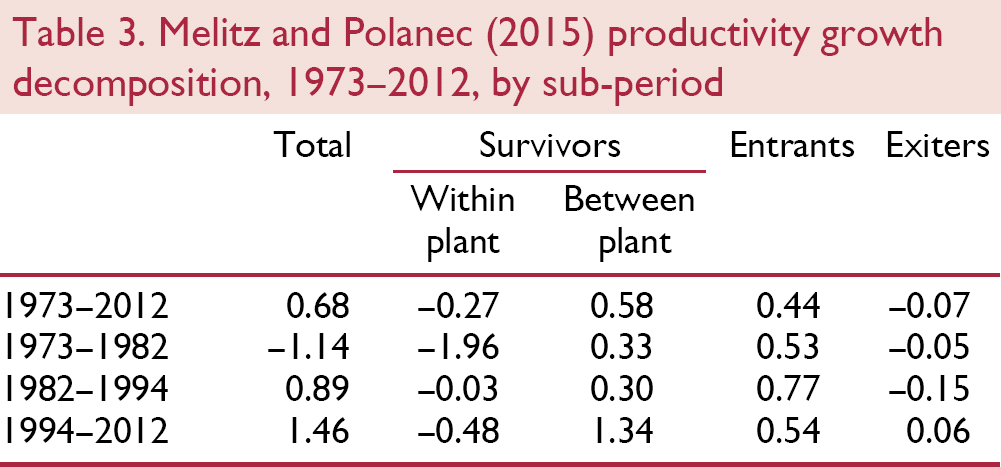
Melitz and Polanec (2015) productivity growth decomposition, 1973–2012, by sub-period

Manufacturing TFP, labour productivity, real gross output and employment indices, 1973–2012 (1973=1)
Three sub-periods for TFP are suggested by figure 3 covering decline between 1973 and 1982, recovery from 1982 until 1994, and substantial improvement post-1994. In contrast, labour productivity increased throughout the period, reflecting in part the continued substitution of capital and intermediate inputs for labour at a time when manufacturing output was largely unchanged. 17
4. Productivity growth decompositions
Having obtained an index of TFP at the plant-level, this section considers the sources of productivity growth over the three sub-periods identified in figure 3. Then in Section V we focus on 1994–2012, and consider the contribution of different sub-groups of plants in an attempt to explain the rapid productivity growth in this period. Individual plant-level TFP is aggregated as follows:

Following Foster et al. (2001), TFP can be decomposed into five components as follows:
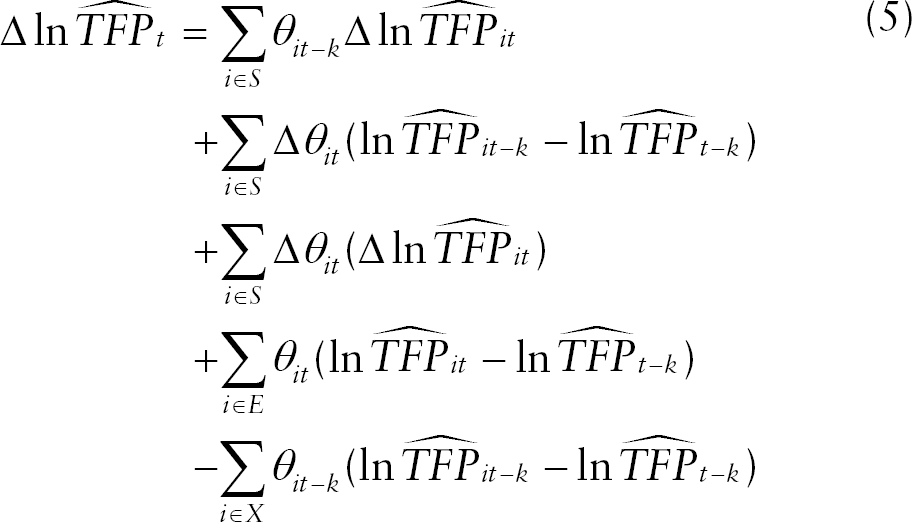
The first component shows the contribution from improvements in TFP within plants that survived from t–k to t (denoted by S), the second term shows the contribution from reallocations of output shares between plants that were open in t–k and t and the third term shows the contribution from the coincidence of increases in productivity and increases in output shares in plants open in t–k to t. The final two terms capture the contribution from plants that entered between t–k and t (denoted E) and plants that exited between t–k and t (denoted by X). If the observed growth in TFP is the result of the closure of low productivity plants, this term should be positive.
As discussed by Melitz and Polanec (2015), a weakness of this approach is that the contribution of entrants will be overstated (and the contribution of survivors understated) if there is productivity growth between t–k and t among survivors because the contribution of entrants is calculated relative to the productivity of all plants at t–k. A plant that opens at t (or any time after t–k), that has lower productivity than surviving plants at time t, need only have higher productivity than the weighted average of productivity at time t–k in order to contribute positively to the entrants’ term.
They therefore suggest an alternative decomposition method, based on the static decomposition of Olley and Pakes (1996), that does not have this feature:

Tables 2 and 3 show that over 1973–2012 aggregate TFP increased by 0.68 per cent per annum and that this was almost entirely due to the contribution of plants that entered. In the first sub-period, 1973–82, TFP declined by 1.1 per cent per annum on average. This was largely the result of a negative contribution from falls in TFP within plants, offset to some extent by reallocations of output share in surviving plants towards more productive plants. TFP recovered between 1982 and 1994, increasing by 0.9 per cent per annum. The larger contribution of entrants was mainly responsible for this better performance, which was sufficient to offset the negative contribution from within plant deteriorations in productivity and the closure of relatively productive plants.
In contrast, TFP increased by 1.5 per cent per annum on average between 1994 and 2012. The primary source of this increase differs according to the decomposition method used: the Foster et al. (2001) approach attributes 1.1 per cent per annum to entrants and 0.5 per cent per annum to reallocations of output shares across surviving plants. By contrast, the Melitz and Polanec (2015) approach attributes 1.3 per cent per annum to a higher covariance between output shares and productivity among surviving plants and only 0.5 per cent to entrants. As discussed above, this is the pattern that would be expected since there was productivity growth among survivors in 1994–2012.
Table 2 also shows that in 1973–82 and 1982–94, TFP growth was lowered by the negative contribution of the closure of more productive plants. In 1994–2012, regardless of the decomposition method used, exiting plants made a positive but small contribution to productivity growth. The finding that TFP in manufacturing has increased over the past forty years is therefore not primarily due to the closure of low productivity plants.
5. Sources of productivity growth post-1994
Studies that have analysed the evolution of UK manufacturing productivity until the end of the 1980s (for example, Cameron, 2003) tended to concentrate on the structural changes that were taking place during this period. According to Cameron (2003, p. 122), “In the 1970s … institutional rigidities, strong trade unions, lax competition policies, corporatist government interventions and a slowdown in technological advance led to a growth slowdown…. Growth rose in the 1980s because of the weakening of trade union power, withdrawal of state subsidies, the shedding of below average labour and capital, increasing subcontracting, the widespread adoption of ‘microchip’ technologies.”18,19
In order to explain high productivity growth in 1994–2012, we consider the role of globalisation, the composition of the workforce and intangible assets. In relation to the former, the continued opening up of the UK economy is likely to have played a role in raising manufacturing TFP in 1994–2012. As Griffith et al. (2005) note: “deregulation and the opening of markets to international trade and investment has been widely recognised as a major driver of growth. (The) main effects of liberalisation. (are) the replacement of low productivity plants with high productivity entrants. increased competition or entry (inducing) incumbent firms to organise work more effectively, (while) the contribution of. multinationals to domestic productivity growth (advances) the U.K.'s technological frontier” (Griffith et al., op. cit., pp. 2–3).
We consider three dimensions of globalisation: trade, foreign direct investment and offshoring. There is evidence for the UK that foreign-owned firms have higher productivity (Girma et al., 2001; Harris and Robinson, 2003; Harris and Moffat, 2015a). Similarly, many studies have found that involvement in trade increases productivity (see Wagner, 2012, for a review of the recent evidence and Harris and Moffat, 2015b for a recent study on the UK). Alongside the opening of markets has been increased material and service outsourcing, and especially offshoring, in manufacturing worldwide, which a number of studies have found increases productivity (e.g. Amiti and Wei, 2009). The latter can arise for a number of reasons: static efficiency gains as firms focus on core competencies and offshore less productive activities; interaction with foreign suppliers, which can enhance learning externalities; the higher quality or better fit of imported input varieties; and general equilibrium effects if productivity gains spill over to other firms or induce tougher competition (cf. Criscuolo and Leaver, 2005; Schwörer, 2013; Fariñas et al., 2011).
Since the UK workforce became better qualified during this period (Mason et al., 2018), a second major source of productivity gains since 1994 is likely to have been an up-skilling of the workforce employed in manufacturing. Raising the quality of labour input has a direct effect on productivity, which has been demonstrated in a large number of studies (e.g. Sianesi and Van Reenen, 2003; Bosworth et al., 2008; Oesch and Menés, 2011; Madsen, 2013). Using a decomposition approach, Rincon-Aznar et al. (2015) estimate that up-skilling contributed 0.47 and 0.54 percentage points to aggregate UK labour productivity growth in 2002–7 and 2008–13 respectively. If higher human capital causes innovation, this will strengthen the impact of human capital on TFP (e.g. Gennaioli et al., 2013). In recent decades the evidence for affluent countries is that high skill occupations have been expanding at the expense of low skilled ones, and this is especially true in Britain (Felstead et al., 2007). This can be explained by growth in manufacturing imports from newly industrialising economies, skill-biased technical change associated with a growth in ICT and the demise of collective-bargaining for unskilled workers (Peng and Kang, 2013). 20 Empirical evidence from Gregory et al. (2001) shows that over the period 1979–90 in the UK, technological change had a major influence on the relative demand for skills, while the effect of trade was relatively small.
Lastly, intangible assets (which can be defined as complimentary knowledge embodied in intellectual assets and thus comprise more than just formal R&D) 21 are widely recognised as a key driver of enterprise performance and thus productivity (e.g., Corrado et al., 2006, 2012; Van Ark et al., 2009; Dal Borgo et al., 2013) especially by proponents of a ‘resource-based’ perspective of the firm (e.g., Penrose, 1959; Barney, 1991; Kogut and Zander, 1996; Teece and Pisano, 1998; Harris and Moffat, 2013b). Their increased usage may also have played a role in increasing TFP growth.
Figure 4 presents the available information for UK manufacturing on changes in the (real) ‘openness’ of the sector, the composition of employment, trade union density and the relative importance of intangible (to tangible) investment for 1973–2007. ‘Openness’ (the ratio of exports and imports to GVA) was increasing in the 1970s, accelerated after the 1980–82 recession, and continued to grow post-1994. A similar pattern is shown for labour composition, with the largest increase occurring post-1994. As discussed in footnote 18, unionisation in manufacturing had seen the largest decline in the 1980s, followed by continued decline after 1992. Lastly, figure 4 indicates the very rapid growth in intangible asset building that occurred after 1997 (information is not available before this date). Thus plants have been grouped into categories reflecting high-to-low levels of change in openness, offshoring, labour composition, and total innovation spending (the latter proxying for investments in intangible assets) in order to show whether the industries most involved in these activities did indeed contribute more to productivity growth. 22

Factors affecting productivity 1973–2007 in UK manufacturing (1997=1)
Table 4 presents the results from decomposing TFP growth using the Melitz and Polanec (2015) approach for 1994–2012 by ownership sub-groups and by industries with differing levels of trade, offshoring, labour force composition and intangible assets. The ownership classification is done at the plant-level since the ABS contains the necessary information at the plant-level on ownership status. However, the other classifications are done at the industry level, as the ABS does not include the required variables measuring exporting/importing, offshoring, labour composition or intangible assets at the plant level. Plants are therefore allocated using their SIC code to industries with high, medium-high, medium-low and low levels of the relevant activity, with the classification of industries based on data from outside sources (see the online appendix for details). This therefore creates the likelihood that some plants are misclassified (for example, a plant that does no exporting or importing will be included in the high level of openness group if all other plants in its industry are heavily involved in trade) but, in our view, this represents the best possible approach with the data at our disposal.
Melitz and Polanec (2015) productivity growth decomposition, 1994–2012, by other factors
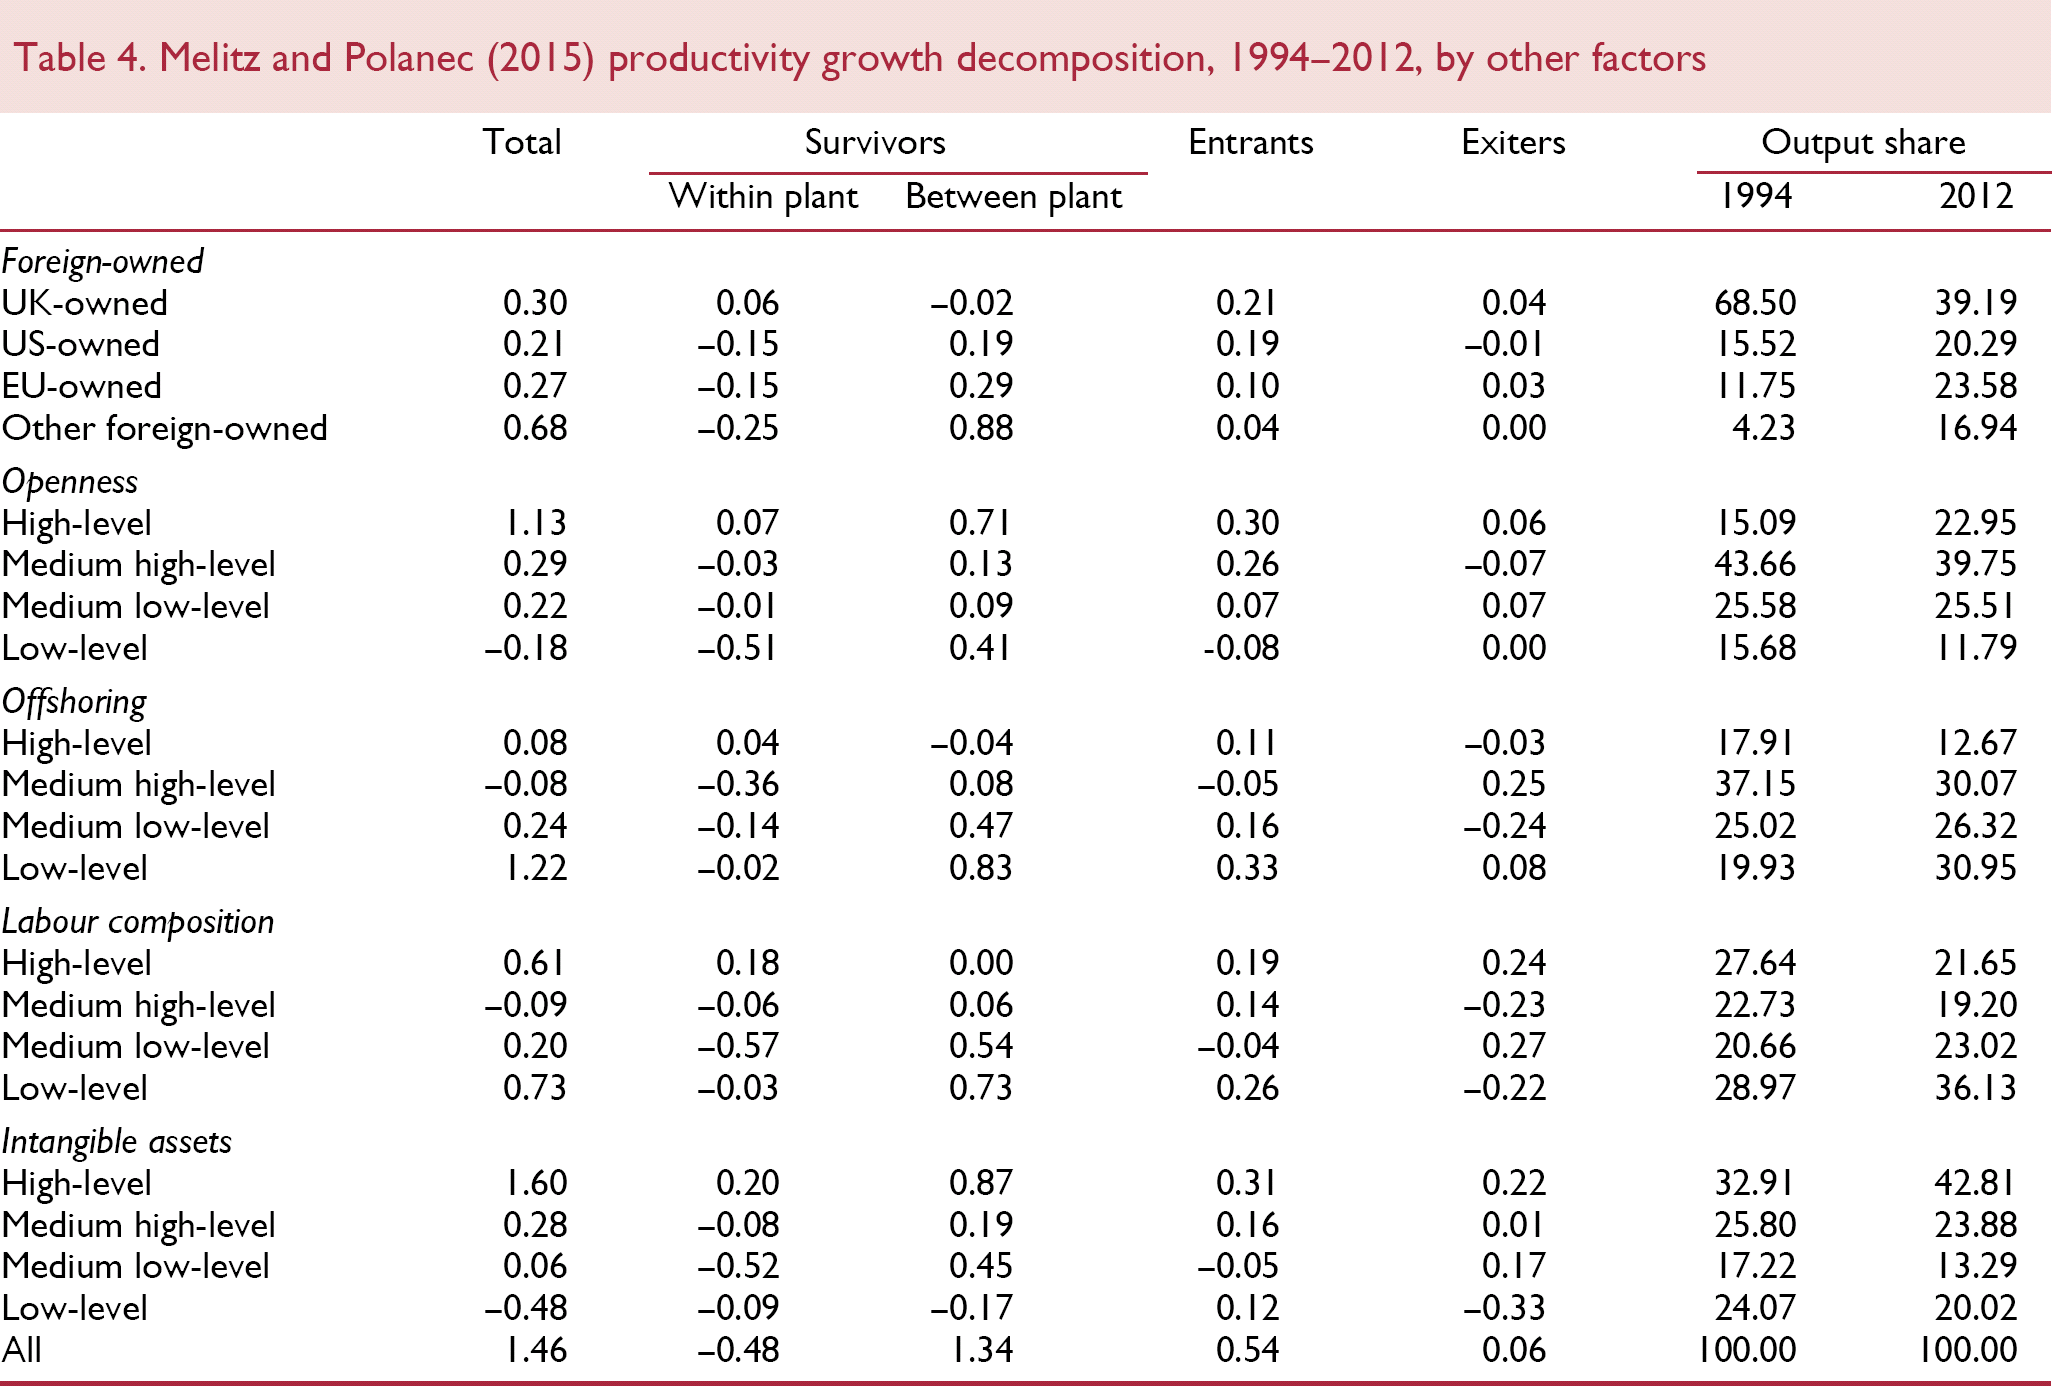
The first three decompositions are intended to measure different dimensions of globalisation. In relation to ownership, disproportionately large contributions came from the foreign-owned sub-groups, largely due to reallocations of output shares towards relatively productive plants. Foreign-owned plants have therefore played an important role in productivity growth in 1994–2012. The industries most ‘open’ to international trade contributed the most to TFP growth, largely due to reallocations of output shares towards more productive surviving plants. While the first two panels suggest increased globalisation has had an important role in driving productivity growth in 1994–2012, industries involved in offshoring have tended to contribute less to aggregate TFP growth, vis-à-vis those with low levels of offshoring. Interestingly, one of the reasons for the relatively poor performance of the industries most involved in offshoring was a tendency to close relatively productive plants. This shows that, while offshoring may have reduced costs and boosted profits, the plants that closed were not necessarily unproductive.
Industries with more highly paid labour forces made a significant contribution to aggregate productivity growth (0.6 per cent per annum), mostly due to the entry of relatively productive plants and exit of less productive plants. However, industries belonging to the low-level sub-group provided the largest contribution, indicating the relationship between highly skilled labour forces and TFP growth is not as clear-cut as that between openness and TFP growth. The final panel of figure 3 shows that, as expected, industries with the highest level of intangible assets had the fastest TFP growth in 1994–2012, again because of reallocations of output share to more productive plants.
6. Conclusion
As is acknowledged by the UK government, the manufacturing sector makes a far larger contribution to the UK economy (to exports, innovation, other sectors through inter-industry linkages and the employment of highly skilled labour) than would be expected given its output share. This paper has calculated estimates of TFP for all manufacturing plants in the ABS between 1973 and 2012 to see what role, if any, TFP may have played in manufacturing's continuing relative decline. These show that TFP fell between 1973 and 1982 but had recovered by 1994. Since this date, TFP has increased rapidly. Only a small proportion of the growth since 1994 can be explained by a selection effect, whereby low productivity plants exited the market. The continued relative decline of UK manufacturing cannot therefore be attributed to poor TFP performance. Aggregate TFP growth was then decomposed to show the contribution of different sectors. This showed that much of the growth in this latter period comes from foreign-owned plants, industries that are involved in trade and industries with high levels of intangible assets.
Since the UK government is committed to increasing the role of manufacturing in the economy, it is useful to discuss the policy implications of our results. First, the results support efforts to encourage activities that allow firms to build up intangible assets. R&D tax credits, which have operated in the UK since 2000, are an example of such a policy although a recent meta-analysis finds these have been less effective in manufacturing than services (Castellacci and Lie, 2015). Similarly, the results support assistance such as that offered by UK Trade and Investment to increase exporting, particularly since previous research using micro-data has found that such policies can be effective (Gorg et al., 2008; Van Biesebrock et al., 2016). We also find that the industries that are most involved in offshoring contribute positively to productivity growth but to a relatively small extent due to the closure of productive plants. This suggests that these firms are moving capacity in order to lower costs, rather than to increase productivity. Whether slowing the rate of offshoring is feasible, given the UK's high wage costs, is debatable but recent reductions in the main rate of UK corporation tax (from 28 per cent to 20 per cent between 2008 and 2015, declining to 19 per cent in 2017) may help at the margin. Such a policy may also attract foreign-owned plants that were also shown to have contributed positively to productivity growth.
More broadly, we confirm the results of earlier papers (Disney et al., 2003; Harris and Moffat, 2013a) which emphasise the importance of reallocations of output shares both among surviving plants and most especially the opening of new plants as a source of productivity growth. Policy measures to increase competition and thus facilitate the transfer of resources between firms would therefore improve aggregate productivity. By contrast, the government should resist pressures to support unproductive plants in areas where resources are likely to be re-employed quickly, since this will impede the process of ‘creative destruction’ necessary to generate productivity growth.
Footnotes
1
As will be shown later, manufacturing output in 2012 was 97% of the level achieved in 1973, and 16 percentage points lower than its peak in 2001. In terms of employment, only some 36% of the 7.3 million employed in 1973 were employed in the sector in 2012 (peak post-war employment in manufacturing was close to 9 million in 1966).
2
In 2011, the Chancellor of the Exchequer called for a ‘march of the makers’ (Osborne, 2011) and this theme remained recurrent in post-2011 Budgets. The most recent initiative has been the creation of the Industrial Strategy Council by BEIS to help improve low productivity.
3
The peak level of non-manufacturing TFP was only slightly higher in 2007 when compared to 1973, whereas in manufacturing it was 55 percentage points higher. Put another way, average TFP growth p.a. in non-manufacturing 1973–2007 was less than 0.1% compared to 2.3% in manufacturing.
4
See also Sudit and Finger (1981, p. 15) who discuss gross output versus value-added measures of the production function, referring particularly to the work of Diewert (1978) and ![]() , both of whom were early proponents of a gross output approach. Diewert (op. cit., p.42) went as far as saying: “one is … led to wonder about how much of the ‘unexplained residual’ in growth studies … is due to the unjustified use of a real value-added framework”.
, both of whom were early proponents of a gross output approach. Diewert (op. cit., p.42) went as far as saying: “one is … led to wonder about how much of the ‘unexplained residual’ in growth studies … is due to the unjustified use of a real value-added framework”.
5
That is, factors that shift plants towards the ‘best-practice’ current technological frontier, together with those that influence technological progress, are not explicitly included or modelled in the growth accounting approach. This leads to bias in the output-elasticities relating factor inputs to output, given there are ‘omitted variables’ in the growth-accounting equation.
6
Note, the growth accounting approach has its own merits – it is a strong descriptive method and so is most useful when the objective is to measure the relative contributions of input growth and ‘other influences’ on output growth. It typically only requires data on real output, capital and labour, total revenue and the total cost of labour; no econometric estimation is needed; it is easy to construct and interpret; and the aggregate data sources used mean that factor inputs can often be adjusted for ‘quality’ (see O'Mahony and Timmer, 2009, for a discussion).
7
Further details about the variables included and the data are provided in an online appendix.
8
Estimators (such as Olley and Pakes, 1996; Levinsohn and Petrin, 2003) that purport to overcome these endogeneity issues are based on assumptions we believe are more restrictive than those implied by system-GMM (Ackerberg et al., 2015). In particular, these estimators do not allow for fixed effects, which are important as empirical evidence shows that the distribution of productivity has both a large variance and is persistent over time (see, for instance, Bartelsman and Dhrymes, 1998; Martin, 2008). Note, like the Olley-Pakes approach, system-GMM is used to overcome the bias that would arise from OLS estimation if firms make decisions on factor inputs based on the value of the TFP shock (error term), which is unobservable to the researcher.
9
Intermediate inputs cover materials, fuels, semi- and finished-goods and (especially business) services used in the production of new goods and services. We are not estimating a gross valued-added function because we do not want to impose weak separability (capital and labour are separable from intermediate inputs in production) and thus homogeneity with respect to αM – see ![]() for a discussion.
for a discussion.
10
TFP here comprises those factors contained in X that influence efficiency and technological progress. It also comprises an error term
11
![]() characterises a TFP index as ‘proper’ if it can be written as the ratio of a proper output quantity index to a proper input quantity index. To be a proper input quantity index, the proportionality axiom requires that if a plant increases its use of all inputs by a factor of λ, its input quantity index should also increase by a factor of λ. Without constant returns to scale, the use of the estimated coefficients on the inputs to create the input quantity index (as is done in equation 2) leads to a violation of this axiom since increasing all inputs by a factor of λ leads to a less (more) than proportionate increase in the input quantity index in the presence of decreasing (increasing) returns to scale.
characterises a TFP index as ‘proper’ if it can be written as the ratio of a proper output quantity index to a proper input quantity index. To be a proper input quantity index, the proportionality axiom requires that if a plant increases its use of all inputs by a factor of λ, its input quantity index should also increase by a factor of λ. Without constant returns to scale, the use of the estimated coefficients on the inputs to create the input quantity index (as is done in equation 2) leads to a violation of this axiom since increasing all inputs by a factor of λ leads to a less (more) than proportionate increase in the input quantity index in the presence of decreasing (increasing) returns to scale.
13
Factor inputs (e, m and k) and brownfield foreign-ownership are treated as endogenous. In all cases endogenous variables are instrumented by their lagged values (in first differences for the levels equation and levels for the first differenced equation). The validity of the instruments is assessed using the Hansen test of over-identification. In all 25 industries, the null of valid instruments is not rejected at the 10% level.
14
This suggests that the development of high-tech manufacturing would be a good target for regional policy. However, the difficulty of identifying the precise source of these productivity differences limits our ability to make such recommendations.
15
Figure U.1 in the online appendix jointly plots the TFP indices reported in Figures 2 and ![]() , to allow comparison.
, to allow comparison.
16
Like others, Harris and Moffat (op. cit.) show that labour productivity fell sharply in manufacturing post-2008, but this was not due to a fall in TFP (rather changes to factor mix).
17
18
Cameron himself explained the higher productivity growth of the 1980s as being due to large and significant returns to business R&D, to decreasing unionisation, and to an increase in white-collar employment vis-a-vis manual employment.
19
While it is generally accepted that unions in the 1970s were a drag on productivity (Metcalf, 2003), leading to productivity gains in the 1980s (Cameron, 2003; Bryson et al., 2005), Van Reenen (2013) argues that it “seems improbable that antiunion laws would have a permanent effect on productivity growth. Unions would have to have had a seriously negative effect on innovation and there is no compelling evidence of this” (p. 127). Doucouliagos and Laroche (2003) conclude “that if all the available evidence is pooled together, measures of central tendency indicate a near zero association between unions and productivity … (although) a negative association appears for the United Kingdom and Japan” (p. 682). Figure 4 below shows that in manufacturing most of the decline in unionisation had occurred by 1990, such that unionism per se had a negligible impact on productivity by the late 1990s (Pencavel, 2003; Bryson and Forth, 2010; Wright and Brown, 2014). Further falls after this period were against a backdrop of much lower unionisation, with trade union density below 19% in 2012.
20
Peng and Kang (op. cit.) are arguing that collective bargaining power is a decisive factor in accounting for disparities in skill premiums; given the way labour composition is measured, weighting employment in occupational groups by the associated wage for that group, this will have an impact.
21
In concrete terms, intangible assets have been classified by some “. into economic competencies (i.e., invest in skills, advertising and branding and organizational structure), scientific and creative property (i.e., R&D and ‘innovation’ more generally) and Information and Communications Technology” (BIS, 2012a; emphasis in original).
22
Details are provided in the online appendix (tables U.5 – U.9) on how industries were categorised into sub-groups experiencing high-to-low levels of change.
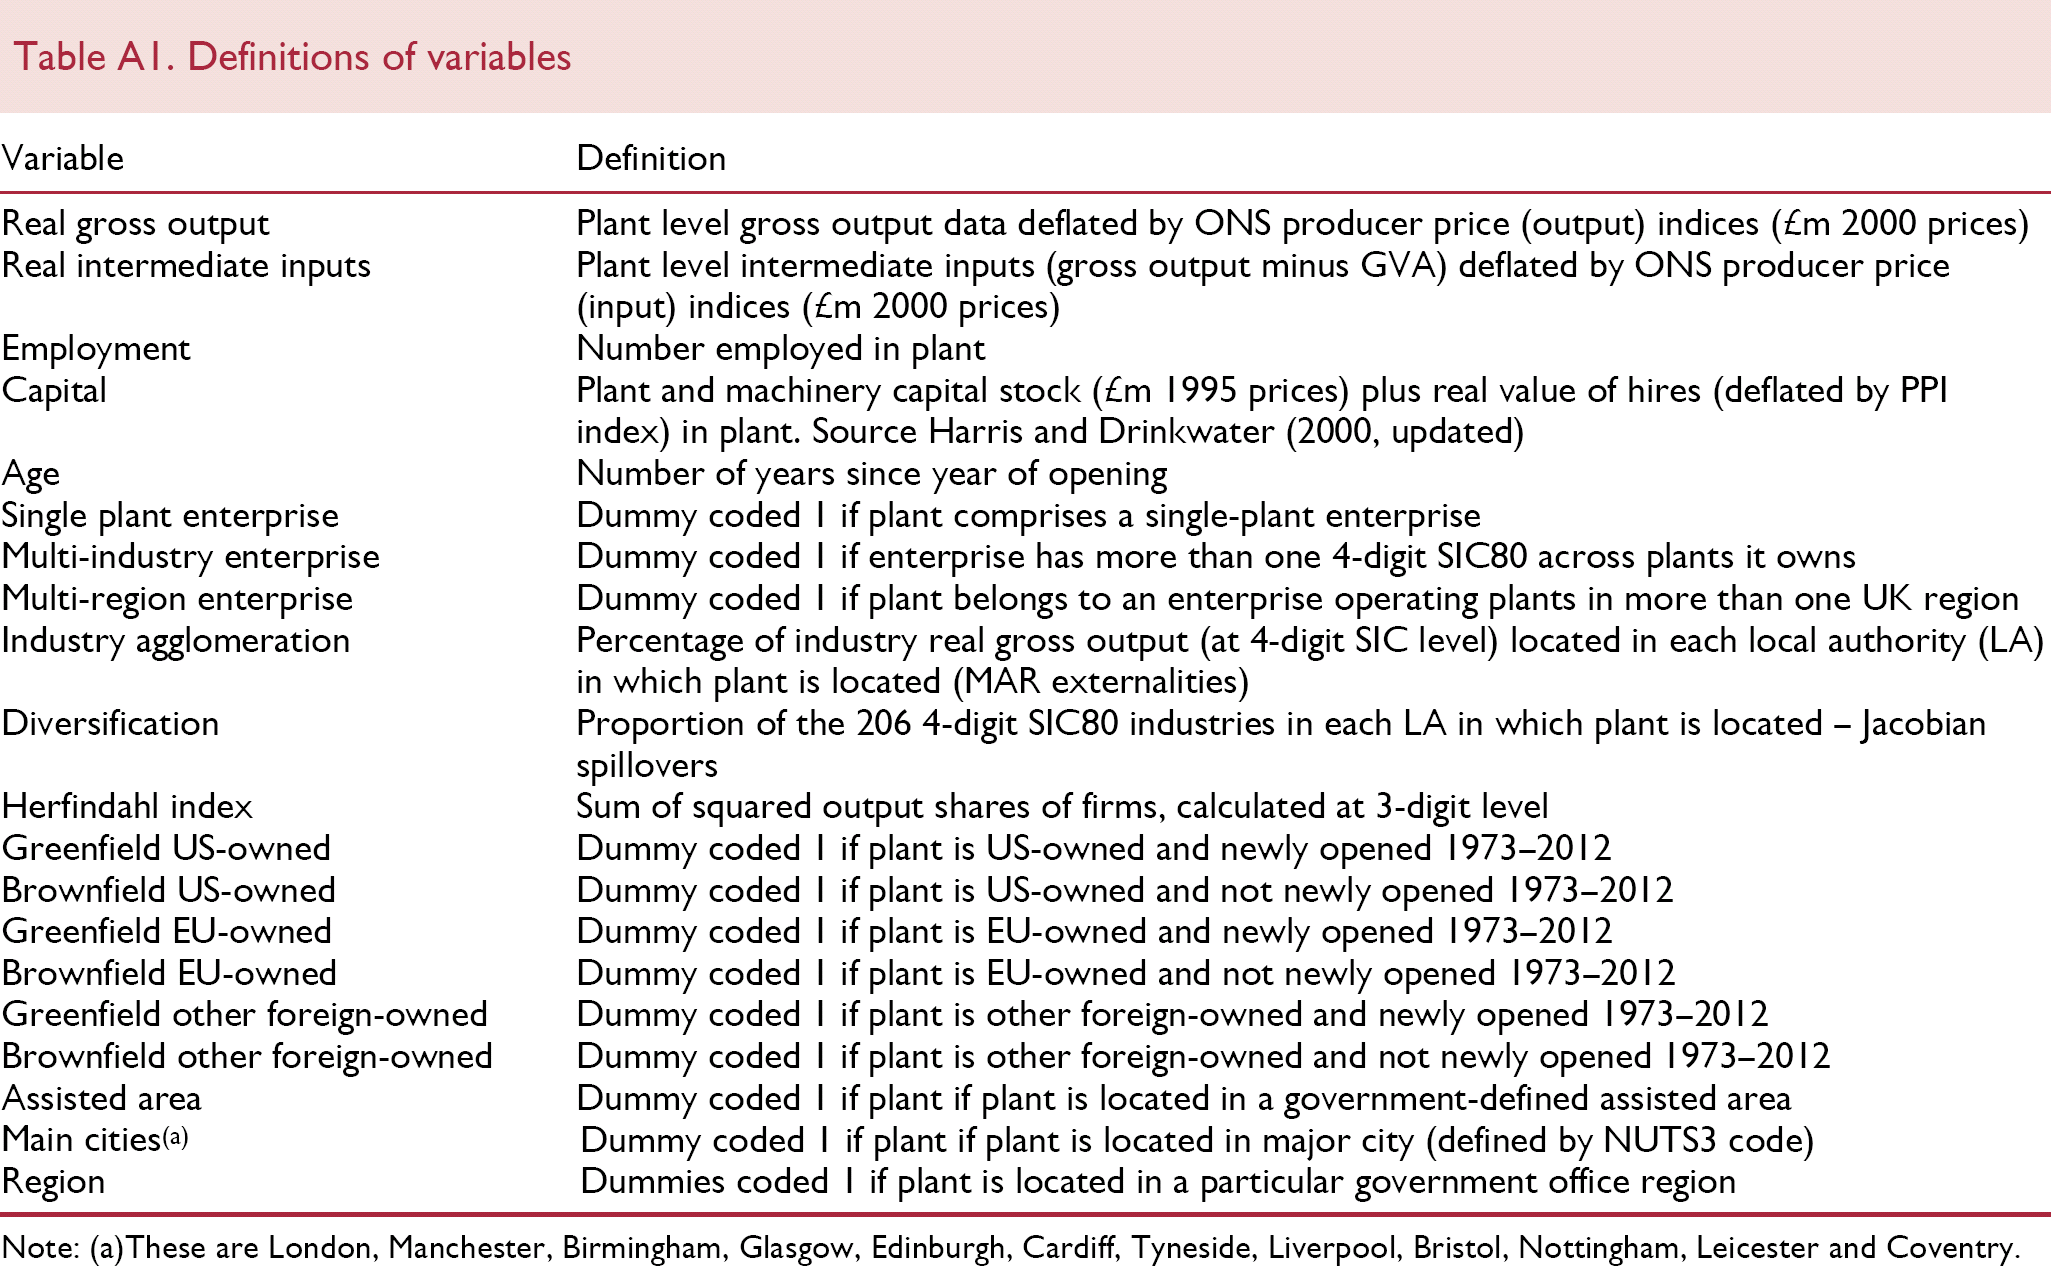
APPENDIX A
Definitions of variables
| Variable | Definition |
|---|---|
| Real gross output | Plant level gross output data deflated by ONS producer price (output) indices (£m 2000 prices) |
| Real intermediate inputs | Plant level intermediate inputs (gross output minus GVA) deflated by ONS producer price (input) indices (£m 2000 prices) |
| Employment | Number employed in plant |
| Capital | Plant and machinery capital stock (£m 1995 prices) plus real value of hires (deflated by PPI index) in plant. Source Harris and Drinkwater (2000, updated) |
| Age | Number of years since year of opening |
| Single plant enterprise | Dummy coded 1 if plant comprises a single-plant enterprise |
| Multi-industry enterprise | Dummy coded 1 if enterprise has more than one 4-digit SIC80 across plants it owns |
| Multi-region enterprise | Dummy coded 1 if plant belongs to an enterprise operating plants in more than one UK region |
| Industry agglomeration | Percentage of industry real gross output (at 4-digit SIC level) located in each local authority (LA) in which plant is located (MAR externalities) |
| Diversification | Proportion of the 206 4-digit SIC80 industries in each LA in which plant is located – Jacobian spillovers |
| Herfindahl index | Sum of squared output shares of firms, calculated at 3-digit level |
| Greenfield US-owned | Dummy coded 1 if plant is US-owned and newly opened 1973–2012 |
| Brownfield US-owned | Dummy coded 1 if plant is US-owned and not newly opened 1973–2012 |
| Greenfield EU-owned | Dummy coded 1 if plant is EU-owned and newly opened 1973–2012 |
| Brownfield EU-owned | Dummy coded 1 if plant is EU-owned and not newly opened 1973–2012 |
| Greenfield other foreign-owned | Dummy coded 1 if plant is other foreign-owned and newly opened 1973–2012 |
| Brownfield other foreign-owned | Dummy coded 1 if plant is other foreign-owned and not newly opened 1973–2012 |
| Assisted area | Dummy coded 1 if plant if plant is located in a government-defined assisted area |
| Main cities(a) | Dummy coded 1 if plant if plant is located in major city (defined by NUTS3 code) |
| Region | Dummies coded 1 if plant is located in a particular government office region |
Note: (a)These are London, Manchester, Birmingham, Glasgow, Edinburgh, Cardiff, Tyneside, Liverpool, Bristol, Nottingham, Leicester and Coventry.
References
Supplementary Material
Please find the following supplemental material available below.
For Open Access articles published under a Creative Commons License, all supplemental material carries the same license as the article it is associated with.
For non-Open Access articles published, all supplemental material carries a non-exclusive license, and permission requests for re-use of supplemental material or any part of supplemental material shall be sent directly to the copyright owner as specified in the copyright notice associated with the article.