
Abstract
This study is an exposition of class-caste based differences in mortality experience based on an indicator called household prevalence of death. It involves 75,432 death cases collected in National Family Health Survey-4, analysed using Relative Deprivation Index (RDI). We found, the prevalence of death found to be 11.8% in India, which varies across states and social and economic groups. The RDI values depict that the poorer households along with social group identities like schedule tribe and schedule caste households displayed a uniform disadvantage as regarding mortality across many states. The analysis offers evidence on differential experience of mortality across socio-economic identities. The evidence suggests poorer states having a marked disadvantage along with social and economic classes.
Introduction
There is a growing consensus that every demographic indicators needs to be monitored in aggregate terms without overlooking its distributional features. However, it lacks for the survival indicators including under five year mortality, infant mortality and maternal mortality etc in Indian context. In fact, these mortality indicators are very hard to be disaggregated by characteristic features beyond gender and residence given the improvement in mortality and need for over-sized samples to obtain reliable estimates. In India, studies showing such distributional features are limited to early age mortality and gender based differentials (Bora & Saikia, 2018; Guilmoto et al., 2018; U. Ram et al., 2015; Saikia et al., 2011). However, the Sustainable development Goals (SDGs), adopted by the United Nations in 2015, have a key ethos of “leaving no one behind”. So, with the compliance with SDG targets the mortality indicators need inspection in terms of its group disaggregation beyond age and gender.
Though the extent of health outcomes varies across the country among these groups, the common inference pertains to the poor health status among the marginalised as compared to the benchmark populations. Such evidences is not limited to mortality, but also includes the accessibility, affordability and utilization of health care, and a whole host of health outcome indicators across the life-course (Kawachi et al., 2005; Leivas & dos Santos, 2018; Mesenburg et al., 2018; Murray & Lopez, 1996; Olshansky et al., 2012). Many reviews have observed the socio-economic, class and caste/race disparities in society (Evandrou et al., 2016; Hu et al., 2016; Kawachi et al., 2005; Wellons et al., 2012). Variations in morbidity and mortality have been associated with varying of socio-economic status, which is classified by car ownership, housing, and occupation . It was also observed that populations in higher economic strata experience considerably low risk of mortality in their early ages (Chetty et al., 2016; Judge, 1995).
Economic literature confirms the pervasive vertical (within individual) as well as horizontal (within the group) inequality in India (Jayaraj & Subramanian, 2006; Vanneman & Dubey, 2013). At the same time, the economic gradient of these indicators confirms the advantage for the rich as compared to the poor (Pathak et al., 2010). Moreover, India’s caste system is traditionally marked by limited economic and social mobility and its associated vulnerability. The caste gradient in well- being outcomes correlate with the identification of an individual as a member of a lower caste or SC/STs in particular exhibiting a vulnerability owing to their lack of capability endowments like education and income/resource. Further to this their social identity is always associated with practices that generate prejudice against them. Indian experience of the horizontal inequality and ethnic diversity is explained in term of heath care utilization, health system responsiveness and health outputs (Baru et al., 2010; Borooah, 2018; Childers & Chiou, 2016; B. Ram et al., 2017; Ranjan et al., 2018; Zacharias & Vakulabharanam, 2011). The health system responsiveness although claimed to be egalitarian, the public/private divide in provisioning accompanied by the unregulated health care market generates its differential in outcomes among those who can/can’t buy them. Evidences highlighted the prevalence of the worst health outcomes among the Adivasi, Dalits and socially oppressed (Borooah, 2018). It was also observed that 28% Adivasi and 15.6% Dalit have no access to doctors and clinic and 42% of Adivasi children have no access to health facilities or immunization (Guha, 2007). Overall, this evidence serves to explain the prevailing class and caste based difference in health outcomes in India.
There are evidences of survivorship gain, explained by a shift in life expectancy from 49.7 years in 1973 to 68.7 years in 2014 (Registrar General of India, 2019). This gain in life expectancy is due to decline of early age mortality, adult mortality and improvement in health care system. However, while the overall attainment of increased longevity in India during the last four decades is substantial, the gains may not be equal and proportionate. Understanding the differential advantages in mortality across various identity groups is often difficult with the kind of disaggregated information available. Therefore, the purpose of this study is to identify differences and disparity in mortality among class/caste groups with consideration of an indicator called household “prevalence of death” based on reporting of any event of death in households within a specific reference period.
Methods
Data
Analysis for this study was based on the cross-sectional, “nationally representative” National Family Health Survey-4 (NFHS-4) data for the reference period 2015-2016. This survey covers 29 states and 7 union territories in India based on a multistage sampling design with due representation of urban and rural households. The 2011 census of India served as sampling frame for selection of Primary Sampling Units (PSUs). Rural coverage was based on villages and the urban representation was made based on Census Enumeration Blocks (CEBs). These villages and CEBs were selected based on probability proportional to size (PPS). The survey covered a total of 601509 households with a response rate of 98% (International Institute of Population Sciences & ICF International, 2017).
This is one of the available micro-data sets with potential to analyse information on heath and mortality, fertility and family planning, and “socio economic” features of the household up to the district level. The data also includes event of a death in the household during last two year period of reference with details of the deceased individual. These details could be associated with household attributes like religion, caste, and standard of living. In NFHS-4, the information was provides for the 75,735 deceased person form 70,462 households across India. Based on this information, an indicator of the household death prevalence was conceived and read in association with household characteristic/attributes. Household death prevalence was computed as a ratio of household experiencing an event of mortality to the total surveyed households. It serves as an alternative and nuanced mortality indicator at the household level details of the deceased in terms of age and sex serve towards understanding the mortality pattern within the households. The surveyed households could be grouped in four categories based on the census classification. Such groups based on caste include schedule caste (SC), schedule tribe (ST), other backward class (OBC) and others. Here, the others category is considered best in hierarchy and our analysis excludes the category of caste not stated. At the same time, the economic status of the households is comprehended based on the availability of the assets information in a household and further indexed using the principal component analysis separated by the rural and urban areas. The generated wealth index score was further grouped into poorest, poorer, middle, richer, and richest with equal interval in wealth score.
Statistical Analysis
Relative disadvantage index (RDI) was used to understand the adversity of one category over other, based on representation principle. According to this principle, share of a specific characteristic category in an outcome variable is contrasted against the share of the same category in the population. This was primarily motivated from the state of equality assumption which states that the distribution of any outcome across characteristic groups should be same as their share in the population. This argument was made in case of income equality “Equality of income distribution is found when income receiving unit receives its proportional share of the total income” (Schutz, 1951). Based on the Schultz principle, RDI formulation, suggested by Jayraj and Subramanian (2002), measured the disadvantage of the particular population and subgroup (Jayaraj & Subramanian, 2002; Shukla & Mishra, 2014), when measure employed in an ideal situation demands that the share of subgroups in population should be equal. These group can be classified based on the religion, caste, social status, occupation etc. The RDI follows the popular notion of deprivation in relative terms and defines the situation of equity (either advantage or disadvantage). If contribution in total adversity is higher than the share population of that particular group, then it is considered relatively disadvantaged and when the contribution is less than its population share, then there is a relative advantage. The RDI is computed by using equation (1)
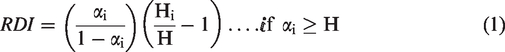
Where i indicates the number of groups in the household like caste, class, religion (ranging from 1, 2, 3…. n) and
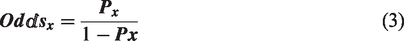
Univariate Odds Calculation
In order to understand the relative likelihood of a particular state’s advantage and disadvantage in terms of outcome variable, we have calculated conditional odds ratio for each states. The COR for particular states is calculated as follows.
The odds ratio of the state

Similarly, the odds ratio of india

And following conditional odds ratio …

Results
Mortality Differentials Between the States of India
The inter-state variation in the household prevalence of death in India was assessed using COR and presented in Figure 1. The household prevalence of death was found to be 11.8% which varies across the states of India. However, with the variation in household prevalence of death ranged between 8.8% in Kerala and 14.2% in Uttar Pradesh. It is apparent that some major states, namely Bihar, Uttar Pradesh, Odisha, Madhya Pradesh and Jharkhand had a greater household prevalence of death as compared to the national estimates and in relation to other states which had fewer death occurrence.
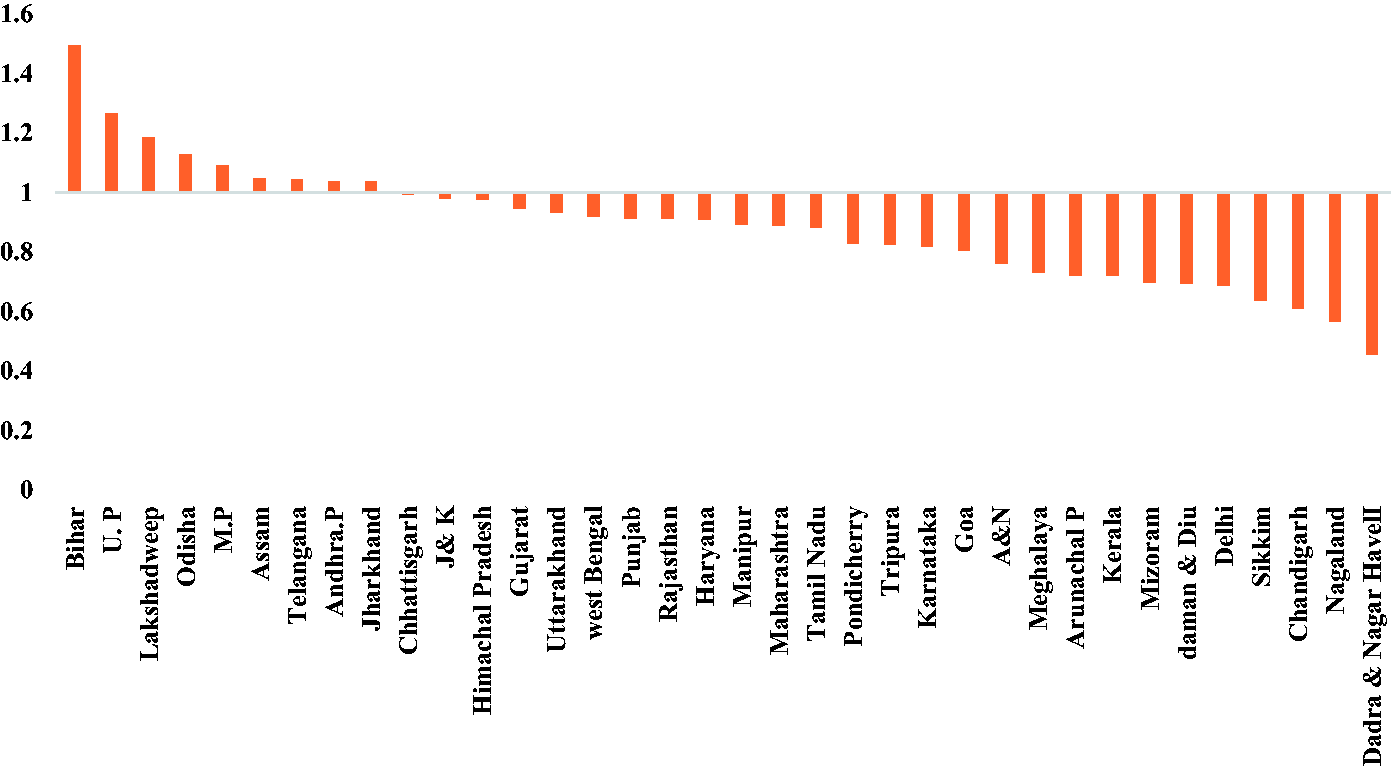
Odds of Household Prevalence of Death Across States Against the National Level Household Prevalence of Death in NFHS, 2015–2016.
Mortality Differentials Between the Social-Groups
Apart from regional differences, the household prevalence of death was examined across social groups. This exhibits the extent of caste-based disadvantage in mortality across varying levels of household prevalence of death (Table 1). The extent of household prevalence of death among the SC, ST and OBC households was found to be 12.3%, 11.6% and 12.0% respectively. Furthermore, such disparity across caste-based identities were assessed with the help of RDI There are representational differences between caste groups in the count of households and the count of experiences of household death . The RDI value across the SC and OBC category is found positive which presents the disadvantage amongthese group. The scheduled caste disadvantage was uniform across all states, except Gujarat and Madhya Pradesh. With many states having positive RDI values, Punjab lead the list with the greatest disadvantage for SCs, followed by Tamil Nadu and Kerala. Most of the states displayed an advantage in mortality for other caste groups, with a few exceptions. Across the states STs are showing advantages, except in some states. These states includes Madhya Pradesh, Maharashtra, Chhattisgarh and Jharkhand. However, there is a need to understand that these states have the higher proportion of schedule tribe households as compared to others.
Household Death Prevalence and Its Relative Disadvantage Index in Selected State Across Social Groups in States of India.
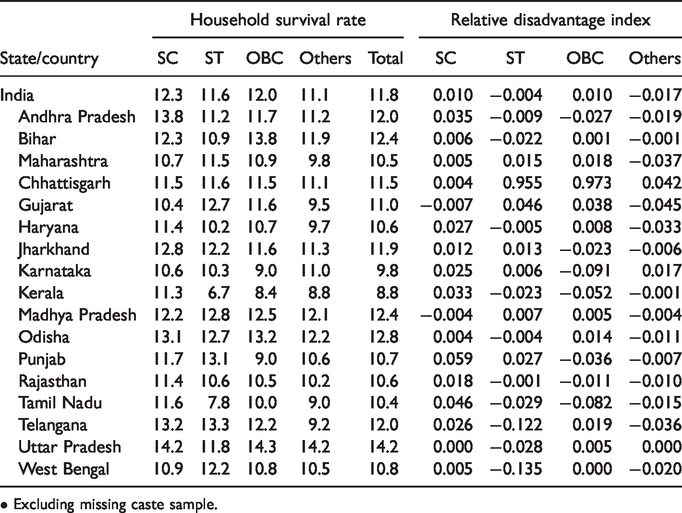
• Excluding missing caste sample.
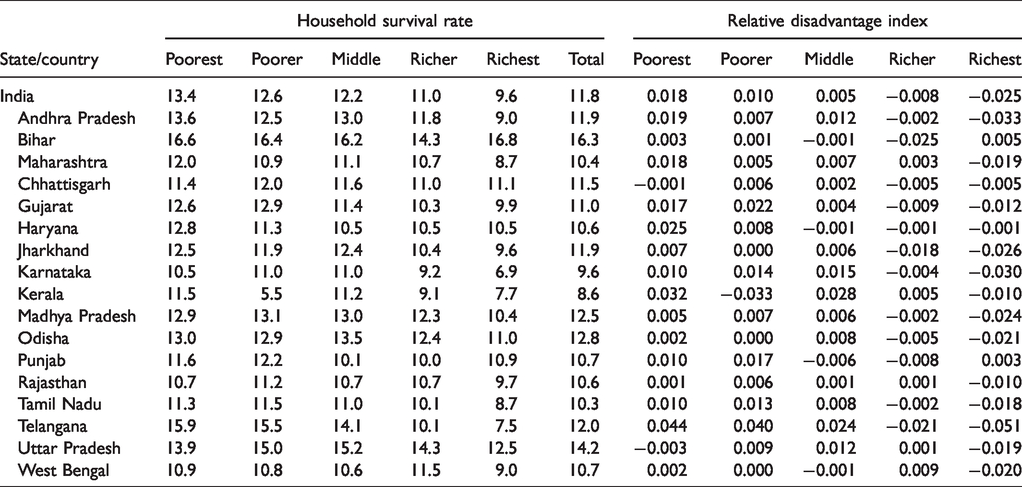
Mortality Differentials Between Economic Classes
When it comes to comparison of mortality across economic class, there seems to be very few differences at the national level, excepting a minor advantage for the richer and richest household quintiles. There was a similar pattern across states and, based on the RDI values, it was clear that the richest household quintile had advantages of different degrees
In contrast, the poorest household quintiles displayed disadvantages with positiveRDI values among whom relatively greater disadvantages was seen in Kerala, followed by Gujarat. Reading of this RDI values across the axis of wealth quintiles confirmed the role of affluence in reaping mortality gains (Table 2).
Household Death Prevalence and Relative Disadvantage Index by Wealth Index Category in States of India, 2015–2016.
Rural vs Urban Mortality by Social Caste and Class
All regions in India have different rate of urbanization. Further, the rural regions often experience a disadvantage in terms of poverty and social class discrimination when compared with urban areas. Therefore, we assessed this disadvantage in mortality across the axis of rural/urban residence. The RDI index indicated that the caste-based inequality was rather greater in urban space than the rural scene. Table 3 represents the household-based prevalence of death in selected states along with the RDI index values that describe the advantages and disadvantages in mortality across social groups. Bihar and Uttar Pradesh had a clear disadvantage in mortality, compared to the national level which is slightly intense in rural areas. Such regional differences when examined across social groups, indicate the SC households had a greater disadvantage in some regions and particularly in urban areas.
Disparity in Household Death Prevalence by Social Group Distribution by Rural and Urban in States of India.
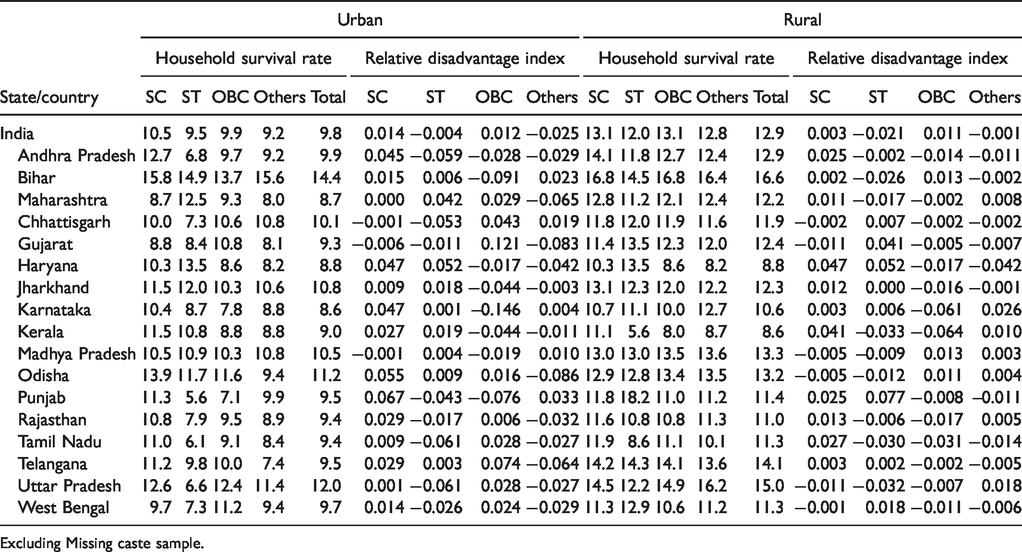
Excluding Missing caste sample.
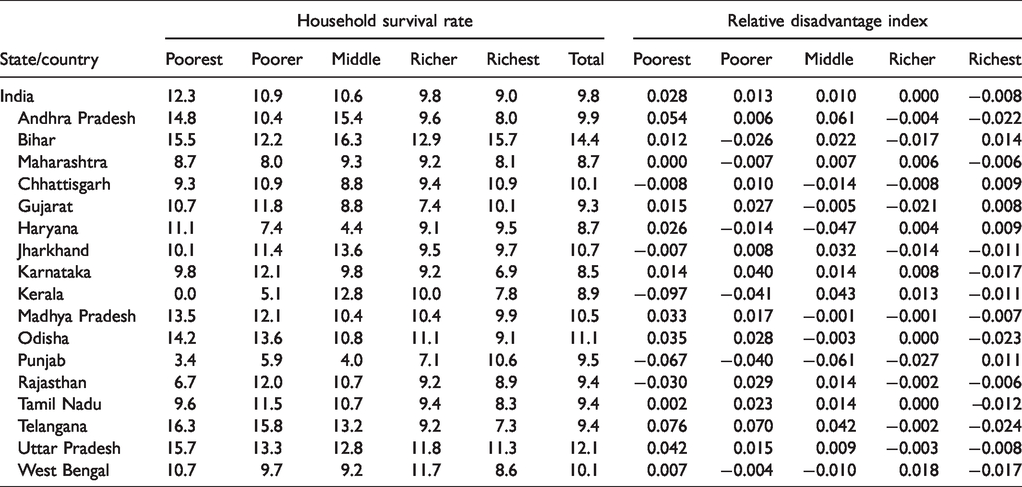
Economic Class Disparity in Mortality by Residence
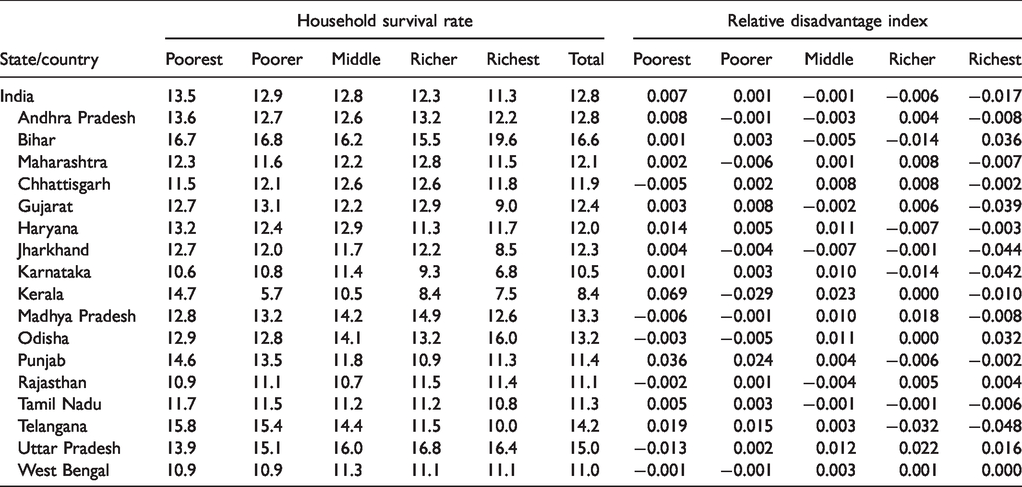
In order to examine the economic class based disparity in mortality, we present the household prevalence of death across wealth quintiles between rural and urban areas of Indian states (Tables 4 and 5). With the mortality advantage in urban areas, the poor versus rich divide seemed greater when compared the rural areas. While the overall household death prevalence was 9.8%, the same among the poorest household quintile was 12.3% with a systematic improvement through the axis of wealth quintile. Such improvement was visible in rural areas but not entirely systematic through the improvement in wealth quintiles. The observed disparity between the richest and the poorest were rather small. For instance the overall death prevalence was 13.5% as against the poorest quintile having the same at 12.8%. This feature holds true across all states, indicating the limited bearing of economic class on mortality advantage in rural India. The systematic gain in advantage in mortality is depicted by the movement of RDI values from being positive to negative with improvement in wealth quintiles.
Urban Household Death Prevalence and Relative Disadvantage Index Selected State by Wealth Index in States of India.
Rura
Discussion and Conclusion
The death of a person in a household is a single event, but it assumes significance because of its two-way relationship with household characteristics. However, studies in India had ignored the role of households attribute in explain the mortality, as it is considered as an individual indicator. This study is an attempt to generate evidence as regard disparity in mortality (based on an indicator like household death prevalence) against class/caste identity of Indian households. The potential finding of the study are outlined as follows.
Ethnic and socioeconomic inequality are among the most perceptible and tenacious features of Indian society. Examining mortality based on household prevalence of death confirmed an expected pattern of rural disadvantage and caste-based vulnerabilities. The results were in agreement with findings in other studies, providing evidence of the differential in length of life among upper and lower caste population (Asaria et al., 2019; Singh et al., 2017). The exposition of relative disadvantage in mortality based on the death prevalence across caste groups is a grim reminder of the fact that despite the overall mortality gain celebrated in India, there is a persistent disadvantage for schedule caste households. Similarly, the disadvantage in schedule tribe households was observed in many majors states. This can be reasoned with poverty, lack of education and health care accessibility etc. This examination unfolds a few specific realties, i.e. caste-based differences were more prominent when analysed against differences in economic class. There had been significant progress on mortality all over India and its regions with class and caste-based disparities sustained, as per the NFHS-4 survey. Moreover, It is common that the richest quintile depicts negative RDI values, conveying advantage, and positive values being frequent in poorer quintiles, conveying disadvantage.
This dynamic of disadvantage in mortality, when examined in terms of RDI, places disadvantage for SC households in urban space to be greater than in the rural areas. States such as Bihar, Uttar Pradesh and Odisha displayed stark disadvantage in mortality among urban households. As regard this disparity in mortality, ST and OBC households did not seem to having the disadvantage that SC households experienced, particularly in urban space. The rural -urban divide brought to light the mortality disadvantage according to social group identity that was more pronounced in urban areas than the rural scene. Considering the rural areas, states like Madhya Pradesh, Jharkhand and Odisha displayed a greater social group disadvantage than others. This entire disaggregated exercise with rural-urban break up suggests relative disadvantage among the schedule caste households.
There is no disagreement in improved survivorship over time, but the inclusiveness of this improvement remained questionable. RDI values offered systematic evidence to this effect. Bihar and Uttar Pradesh had disadvantages in mortality when compared to other states. Analysing the rural-urban divide, urban areas exhibit more disparity among the social class and caste groups. Considering economic class, mortality among the urban poorest, poorer and middle had been worse than rural. Similar expositions hold true among caste identities as well. On the whole, these evidence points towards mortality gains being disproportionate across population groups. Alternative supporting evidence to this findings relate to the observation made by Subramanian (2006) in terms of the probability of surviving among Indian schedule tribe being lesser than the others (Po & Subramanian, 2011; Subramanian et al., 2006). People in lower castes experience a greater mortality risk in their adolescent age.
Although we have explored this reported information on death by household, this study was not without its limitations. Such information on death of a family member is very sensitive in Indian households, hence there is every likelihood of underreporting of such an event like death. The design of the study limits the analysis at the household level, although individual details of the death event are also available. Such details include the information on age of deceased, cause of death which are beyond the scope of this analysis.
Footnotes
Acknowledgments
The authors express their gratitude to the reviewers and the editorial board of the Journal.
Declaration of Conflicting Interests
The author(s) declared no potential conflicts of interest with respect to the research, authorship, and/or publication of this article.
Ethical Standards
As the survey is based on the secondary data and available in the public domain, it needs no prior ethical approval.
Funding
The author(s) received no financial support for the research, authorship, and/or publication of this article.