
Abstract
Urban food systems in Ghana are changing, along with rapid urbanization and growth in household incomes. Using data from retail inventories of packaged products carried out in eight cities in 2015 and 2016, we find that the interplay of urbanization, imports and domestic processing and packaging has led to some surprising outcomes. Imports are dominant, especially for milled rice and tomato paste, and the shares are higher in smaller cities than in Accra. Imported products are more prevalent in traditional retail outlets than in modern retail outlets. Moreover, imported products come mainly from East Asia; excluding South Africa, which accounts for 6% of imports, less than 3% of imported products were from other African countries.
Introduction
Developing countries are going through significant changes in their food systems (Reardon et al., 2009; Reardon, 2015; Regmi and Meade, 2013; Tschirley et al., 2015a). These changes are generating new market opportunities and policy questions. Diet shifts and growing demand for processed foods can create opportunities for adding value to primary agricultural products. However, a transforming food system also can lead to higher food import bills and possible macroeconomic imbalances, and changing diets can create new public health risks such as non-communicable diseases caused by over-nutrition (Rischke et al., 2015). A new food system paradigm has further implications for education and employment policies, as labour markets shift to respond to changing production systems (Tschirley et al., 2015b).
As the food system changes, policymakers can benefit from reliable data to help determine how to enable developing economies to take advantage of new opportunities and address new challenges posed to farmers, processors and consumers (Timmer, 1997). For example, one of the policy issues raised by these shifts is the impact on smallholder farmers of a consumer shift towards processed foods. There is some evidence from China that some farmers can benefit from such a transition (Wang et al., 2009). In contrast, some smallholder farmers in Kenya (Neven et al., 2009), South Africa (D’Haese and Van Huylenbroeck, 2005) and Vietnam (Mergenthaler et al., 2009) have been excluded from supply chains as consumers and retailers have shifted to processed foods. Market data on processed foods can provide a starting point for policy analysis on this topic.
In many developing countries, however, such data typically are not available. Ministries of industry and parastatal agencies may track sales of some processed foods by selected state enterprises, and ministries of agriculture may collect information on the performance of development projects that support some aspects of food processing. However, data on processed food imports, domestic production and retailing of processed food products typically are not recorded in official statistics. This lack of data on the food processing sector is particularly noticeable for African countries, while data have been available for research on Asia (Reardon, 2015).
Research on food system transformation in Africa has focused on eastern and southern Africa (D’Haese and Van Huylenbroeck, 2005; Hassen et al., 2016; Ijumba et al., 2015; Minten and Reardon, 2008; Minten et al., 2013; Minten et al., 2016; Tschirley et al., 2015a). Until recently, relatively little attention has been paid to West Africa (Hollinger and Staatz, 2015; Liverpool Tasie et al., 2016; Theriault et al., 2018). West Africa is a suitable setting for this type of research because it is experiencing important trends such as rising food imports (Zhou and Staatz, 2016) and rapid urbanization; it is home to highly integrated cross-border markets for agricultural inputs and food staples; and it has a broader diversity of staple diets compared to the rest of Africa.
This article contributes to the emerging literature on food system transformation in Africa by describing processed food retail in urban Ghana. It examines the pace at which supermarkets are opening in Ghana’s cities, measures the penetration of imports and compares domestic and imported food products in terms of their availability in different types of retail outlets and their product packaging and labelling. Although the transformation of Ghana’s urban food system has been recognized (Hollinger and Staatz, 2015), the product inventory approach to assessing food availability is novel in the Ghanaian context. As a rapidly urbanizing, lower middle-income country, Ghana has conditions that are favourable for demand growth for processed foods. In recent years, the country’s urban population has grown to 54% of the total population (United Nations, 2014), and incomes have been rising steadily. However, to date, the implications of these changes for food retail in Ghana’s cities have not be assessed.
To obtain data on the marketing channels and the types of food products in the cities, we collected information on retail outlets and processed foods for sale in eight cities, following an inventory approach used recently in Mali (Theriault et al., 2018), Nigeria (Liverpool Tasie et al., 2016) and Tanzania (Ijumba et al., 2015; Snyder et al., 2015). The inventories focused on specific products under the broad categories of processed meats; fruits and vegetables; grains; and starches. As in most African countries, Ghana’s governments have sought to build a food processing sector to add value to raw outputs and to compete against imports. Accordingly, as described in detail in the methods section below, the products selected for data collection have high demand among urban consumers and are produced using crops and livestock that have been focus of recent policy strategies to improve the competitiveness of Ghana’s agriculture.
Transformation of urban food systems in developing countries
Some common trends have been associated with transforming food systems in developing countries, such as increasing availability of processed foods, diet shifts and the realization of Bennett’s Law, which holds that as household incomes increase, the share of food expenditure on food staples decreases (Minten and Reardon, 2008; Reardon et al., 2009, 2010, 2015). Households, especially in urban areas, often demand more diverse and exotic foods, which food processors typically supply through supermarkets (Reardon et al., 2010). As a result, modern retail systems and supermarkets expand as part of the transformation of the food system (Minten et al., 2013; Reardon et al., 2010; Timmer, 2004, 2009). Supermarkets serve as middle agents, collecting processed food products from around the world and making them available and accessible to urban consumers. Supermarkets also can as act as vehicles for increasing consumer welfare by providing reduced prices, broader sources of diet diversity (introducing consumers to new products) and better food safety (Reardon et al., 2010). Supermarkets can lead to higher consumption of processed foods but, adversely, they may be associated with higher rates of adult obesity (Rischke et al., 2015).
Policymakers in a transforming food system often face questions specific to a country’s food needs. For example, the diversity of a country’s traditional diet may affect the pace of the transformation and the associated policy challenges. Minten et al. (2013) and Hassen et al. (2016) have documented how changes in Ethiopia’s food system were driven in part by public investments to develop modern varieties of teff, the main staple cereal. However, Ethiopia’s experience may not be easily transferrable when it comes to setting Ghana’s public research priorities in crop technologies. Instead of one dominant staple in rural and urban diets, Ghana’s traditional diets are based on a variety of staple crops including cassava, maize, plantain, rice and yams. Ghanaian diets also are shifting across these staples as people move to cities (Hollinger and Staatz, 2015). To grapple with the new challenges of the changing food system, specific research is needed on each country’s food system, pre-existing diet patterns and the capacity of its food processing sector.
The Ghanaian context: A quest for a competitive domestic food processing sector
Even before the country’s recent trends in urbanization, economic policy debates in Ghana included concerns about processed food imports. In the 1960s, Ghana’s post-independence industrialization program established state-run enterprises to promote domestic food processing of selected commodities (Ackah et al., 2014). These policies are considered to have failed, owing to inefficiencies with state intervention, and recent policies recognize the need for private-sector involvement.
The policy approach has not changed entirely since the earlier programs were abandoned, however, and the state continues to support specific industries such as tomato and cassava processing. Nevertheless, the range of processed foods has expanded, and several private processors currently produce maize, rice, cassava, yam, plantain, tomatoes, oil palm, groundnut, cocoa, fruits and fish products. In spite of these changes, the agricultural sector still struggles to achieve the productivity levels required to provide processors with adequate, reliable supplies of raw material (see, e.g. the case of tomato processing in a study by Robinson and Kolavalli (2010)).
Although there are few reliable official statistics on the performance of the food processing sector, there is evidence that the broader manufacturing sector has declined over the years. The contribution of industry to Ghana’s economy has increased, but the contribution of manufacturing to total industrial gross domestic product (GDP) fell from 70% in the 1980s to less than 10% in the mid-2000s. These trends, combined with rising food imports across West Africa (Hollinger and Staatz, 2015; Zhou and Staatz, 2016), have led to continued attention from Ghanaian policymakers seeking ways to improve the domestic food processing sector to generate employment and to serve as a market for agricultural produce.
Policymakers are likely to maintain their keen interest in the performance of the sector, given the ongoing demographic changes that will have implications for the country’s food system. From 2000 to 2015, the urban population growth rate averaged around 3.9%. The urban population surpassed the rural population in 2009 and now stands at 54% of the total population. Ghana’s population also has become wealthier – per capita nominal GDP increased from about US$1100 in 2009 to more than US$1400 in 2014.
Data and methods
Study sites
This study conducted inventories of processed foods in all the major urban centres in Ghana. The inventories were completed in Accra in 2015 (Andam et al., 2015) and in Cape Coast, Ho, Koforidua, Kumasi, Sekondi-Takoradi, Sunyani and Tamale from May to July 2016 (Figure 1). These study sites include the four most populous urban areas in Ghana and represent different aspects of the economic geography of the country (Table 1). Accra, Ghana’s administrative and commercial capital, is one of Africa’s emerging megacities and Kumasi is the commercial centre of the country’s middle belt. Sekondi-Takoradi is the second major coastal city and the centre of Ghana’s new oil industry, whereas Tamale is the urban centre of northern Ghana. The other four cities are regional capitals. The populations in the surveyed cities represent 44% of Ghana’s total urban population, as defined by the Ghana Statistical Service (2012, 2014) and 78% of the country’s urban population in large, medium-sized towns with populations greater than 50,000 (Table 1).
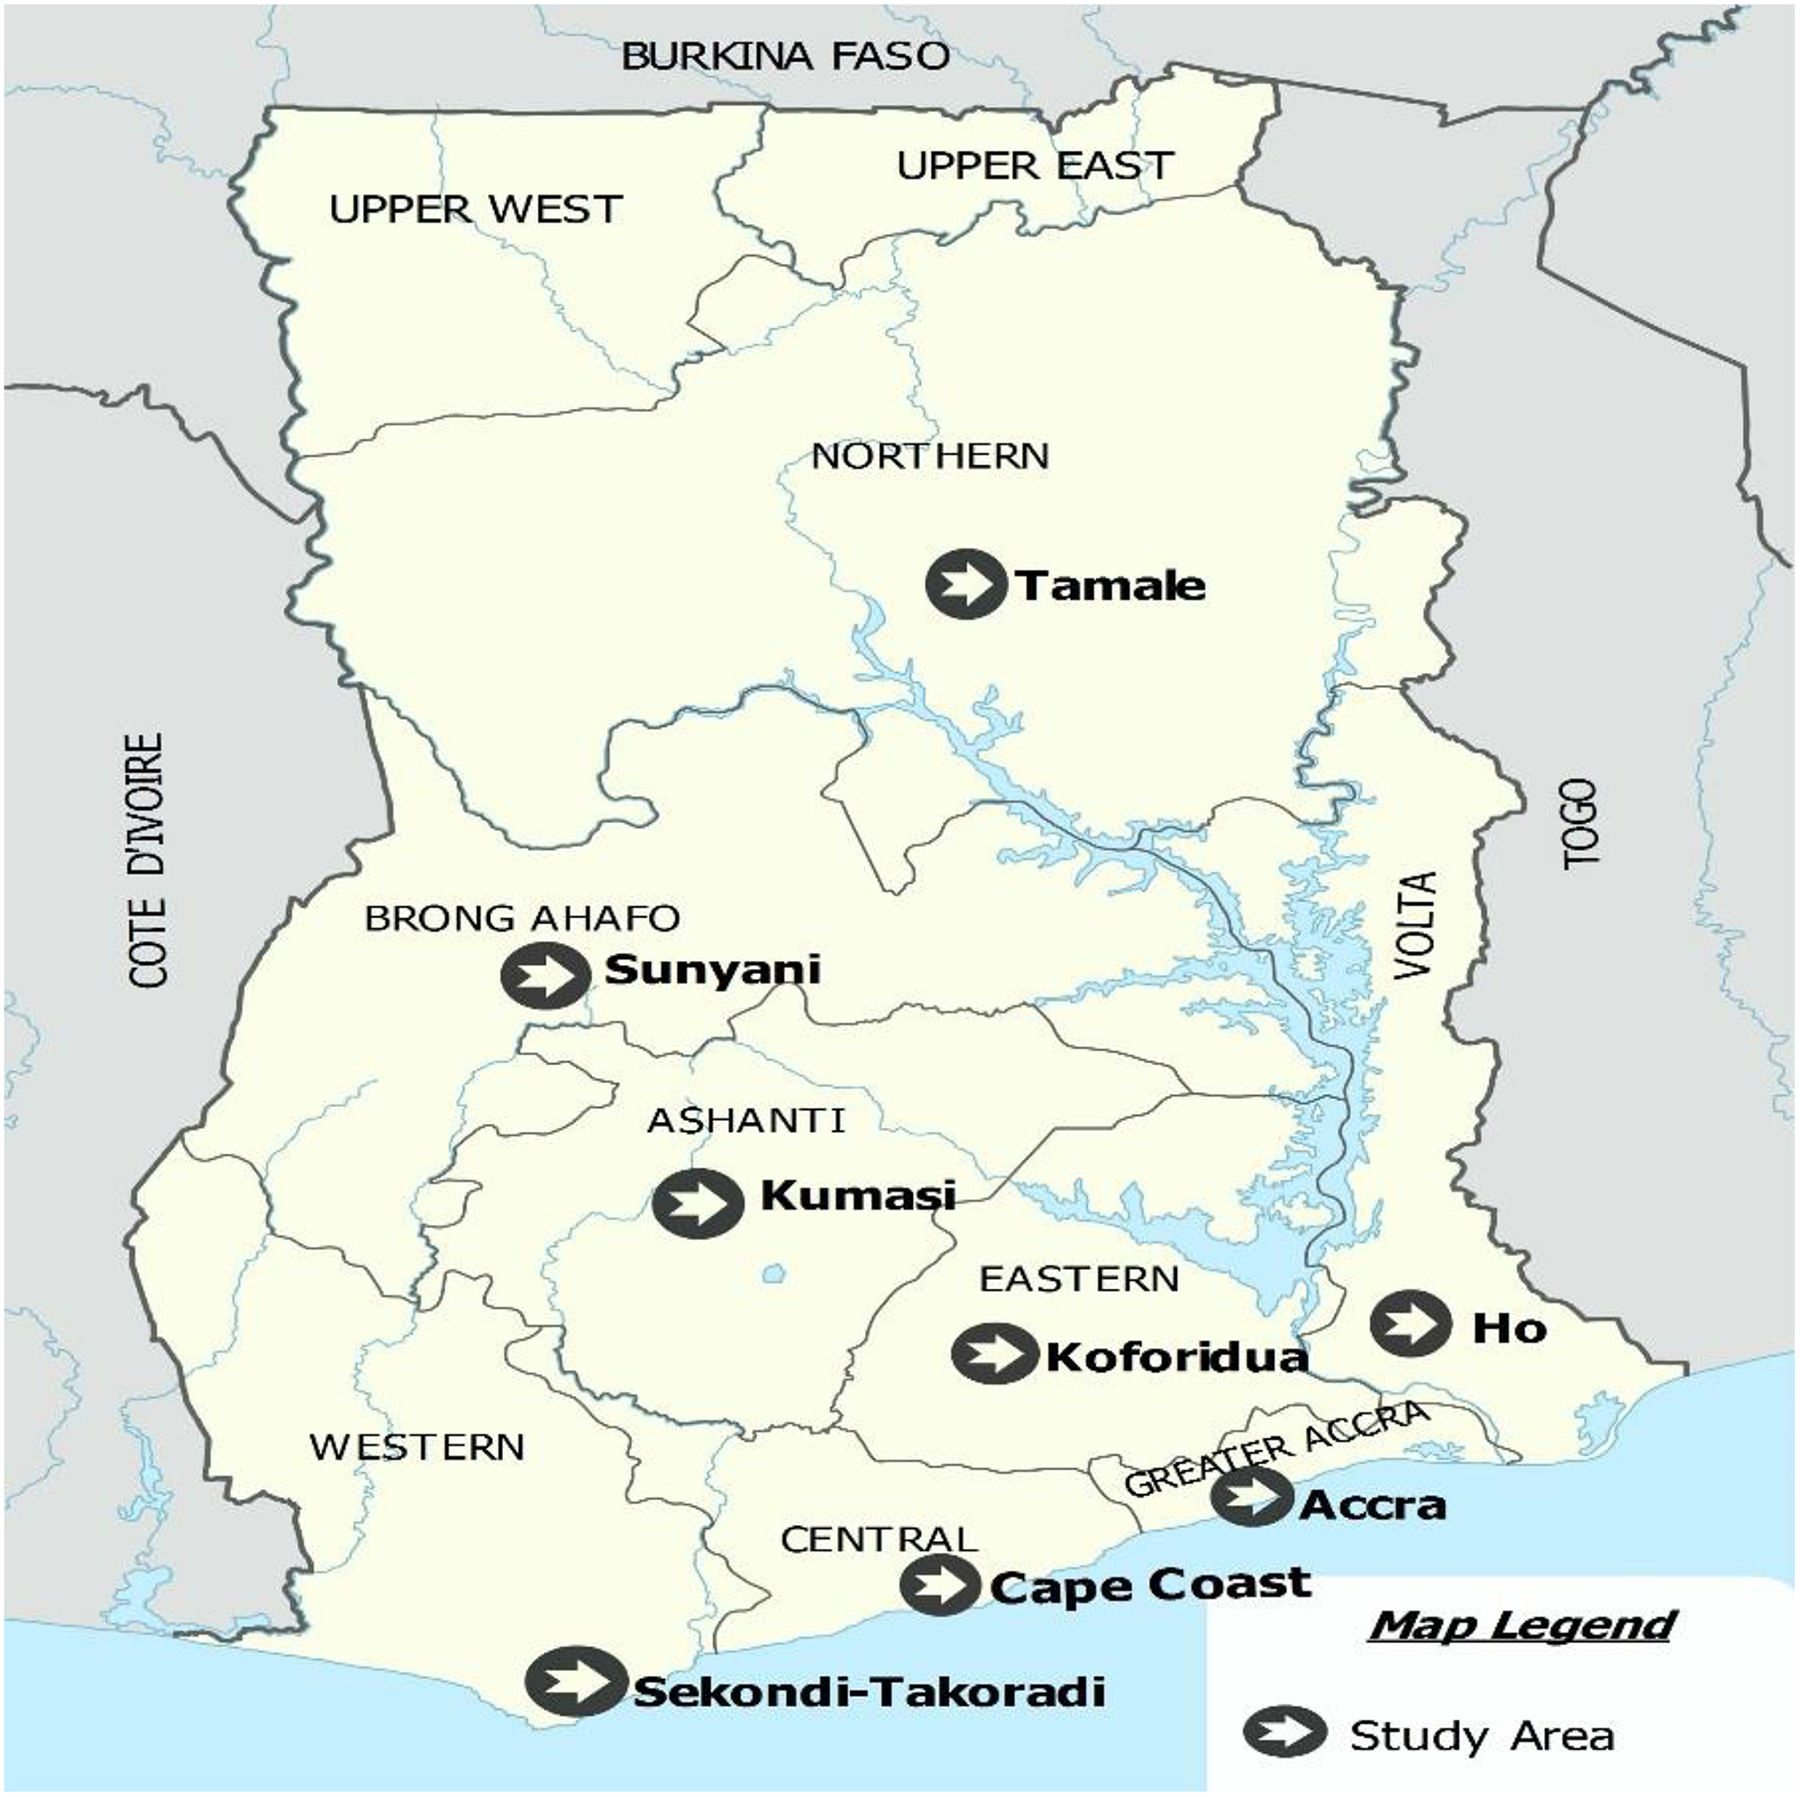
Map of Ghana showing study sites. Source: Administrative boundaries based on map from Wikimedia Commons (https://upload.wikimedia.org/wikipedia/commons/7/7b/Ghana_location_map.svg).
City populations (2010, 2016), population growth rates (1970–1984, 2000–2010) and poverty levels (2012/2013).
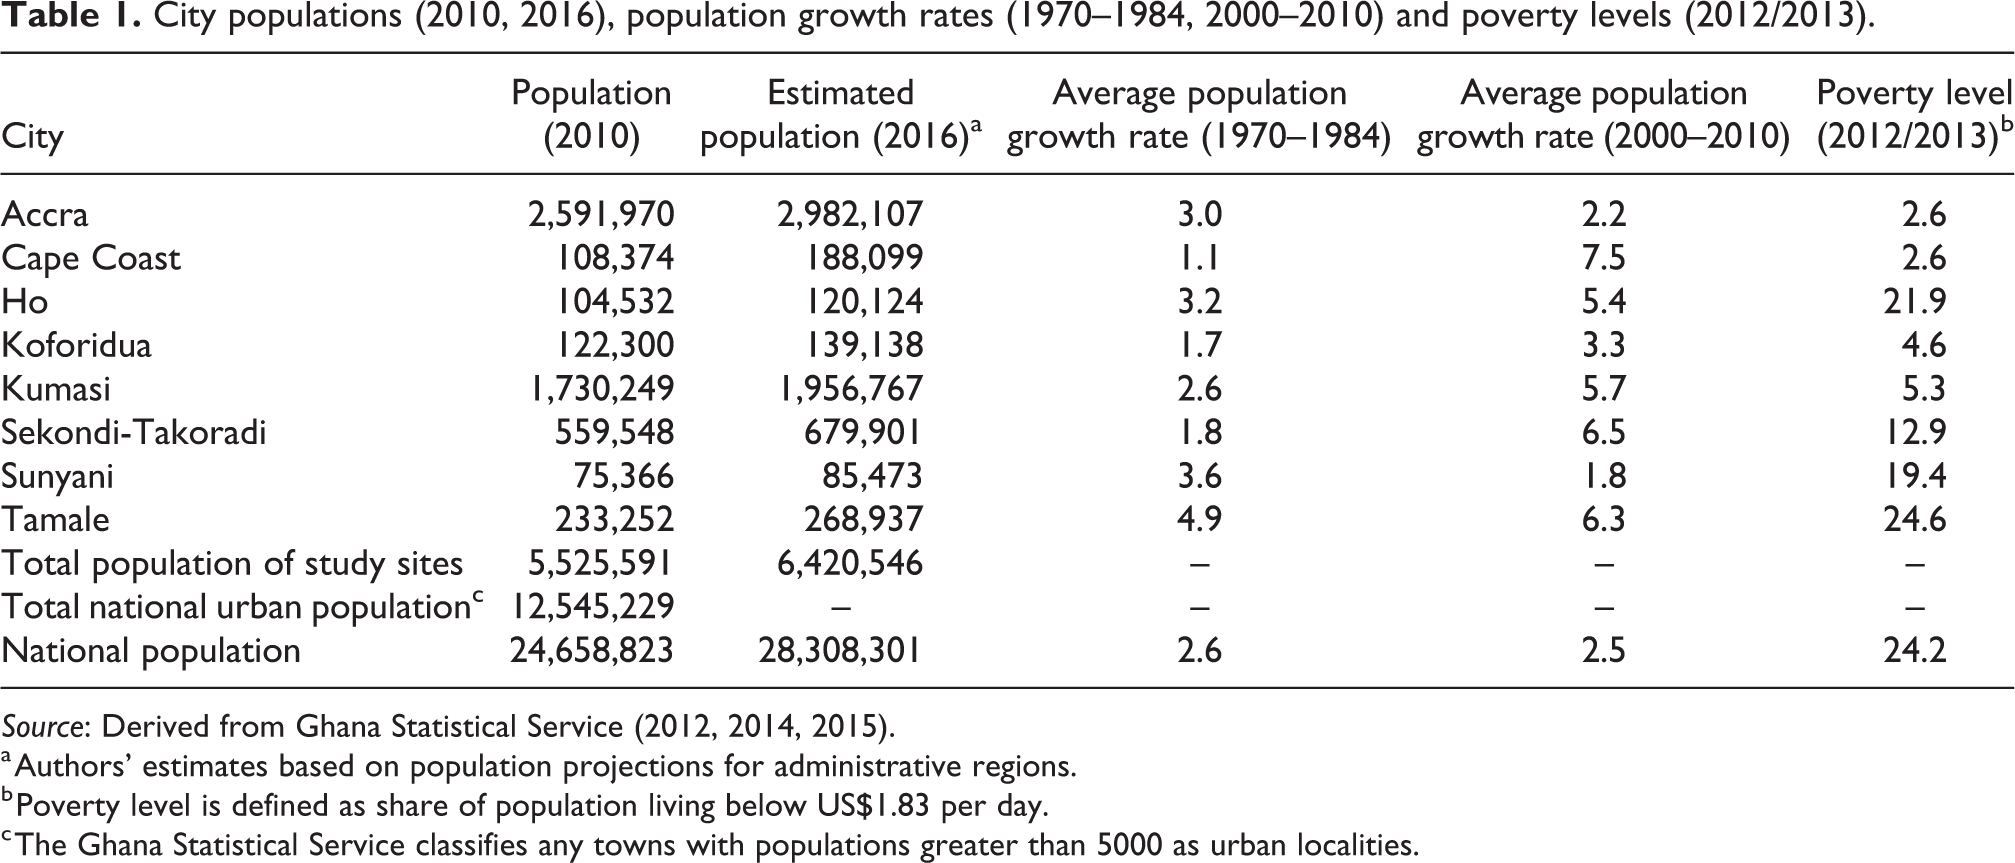
Source: Derived from Ghana Statistical Service (2012, 2014, 2015).
a Authors’ estimates based on population projections for administrative regions.
b Poverty level is defined as share of population living below US$1.83 per day.
c The Ghana Statistical Service classifies any towns with populations greater than 5000 as urban localities.
Retail inventory
We identified six types of processed food retail outlets: (1) stalls in open-air markets; (2) street-side vendors, operating in wood or metal sheds outside markets; (3) traditional, non-self-service shops in concrete structures; (4) self-service grocery stores with one register; (5) single-enterprise, self-service supermarkets with two or more registers; and (6) self-service supermarkets with two or more registers that are part of a store chain (labelled ‘chain supermarkets’ in tables below). These categories include all types of food traders operating from fixed structures in Ghanaian cities. We excluded shops whose primary business is in non-food products and transient street traders. We identified and listed retail outlets through pre-inventory exploratory visits, using city maps and key informants in each city.
The inventory included packaged foods with any level of post-harvest processing. Thus, the range of products extended from minimally processed items, such as milled grain, to products with more sophisticated processing and packaging, such as canned tomatoes. We excluded prepared meals consumed away from home. The inventoried food products were selected from three processed food groups within the United Nations Inventory of Classifications (ISIC Revision 4, Code 10, http://unstats.un.org/unsd/cr/registry): processing and preserving of meat; processing and preserving of fruits and vegetables; and manufacture of grain mill products, starches and starch products.
Within each food group, we selected products for inventory based on Ghana’s policy and market context (Table 2). For example, packaged chicken meat and eggs are included because of the keen attention paid to the poultry industry’s performance against frozen meat imports, and processed tomatoes are included because tomato processing has been a focus of Ghana’s industrial policy. The milled grains, roots and tubers category includes milled rice, maize flour and other product types that are specific to West Africa such as gari and fufu flours (Table 2).
Product types included in inventory.
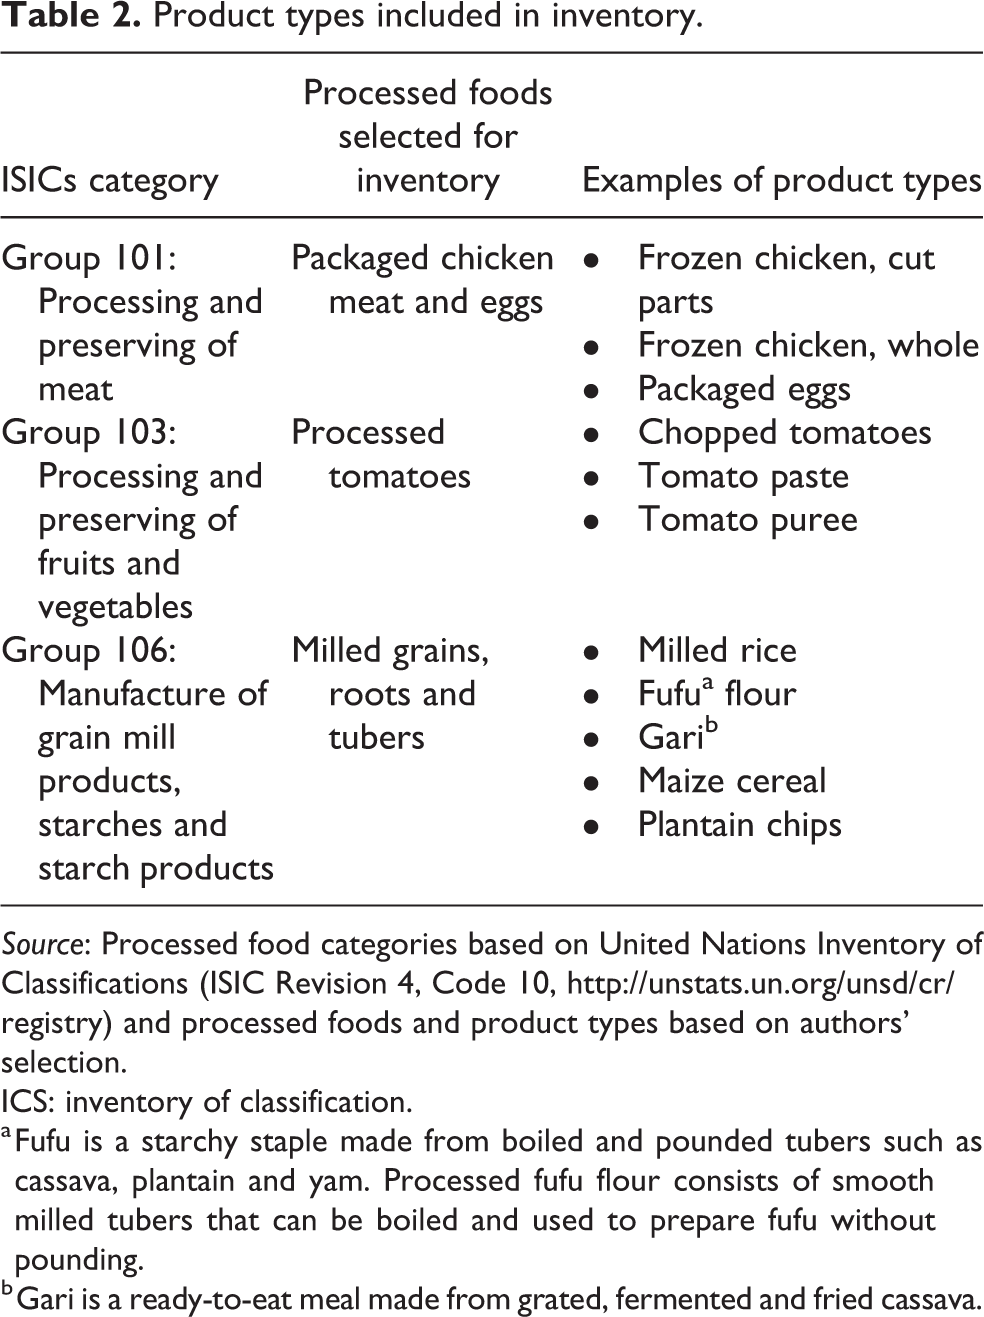
Source: Processed food categories based on United Nations Inventory of Classifications (ISIC Revision 4, Code 10, http://unstats.un.org/unsd/cr/registry) and processed foods and product types based on authors’ selection.
ICS: inventory of classification.
a Fufu is a starchy staple made from boiled and pounded tubers such as cassava, plantain and yam. Processed fufu flour consists of smooth milled tubers that can be boiled and used to prepare fufu without pounding.
b Gari is a ready-to-eat meal made from grated, fermented and fried cassava.
It is important to distinguish between product type and product. We use the definitions proposed by Tschirley et al. (2016), in which product type (e.g. chopped tomatoes) is derived from the intersection of the processed food group (processing and preserving of fruits and vegetables), the raw materials used (tomatoes) and the type of processing (chopping), whereas product refers to a particular brand of a product type manufactured by a company (following the example above, company X’s chopped tomatoes). In each retail outlet, enumerators, with assistance from shop attendants, identified the range of products; took pictures of each product, taking care to capture labelling information and packaging; and then entered information from the pictures into a database.
For Accra, we conducted a city-level inventory (Tschirley et al., 2016) to collect information on all food products regardless of the retail outlet type in which the product was sold. For the other seven cities, we conducted a city-outlet inventory (Tschirley et al., 2016) to make exhaustive lists of products within each product type that were available for sale within each type of retail outlet, to allow for comparisons across outlet types. For example, for milled rice, we recorded all the milled rice products (brands) found in open-air stalls and all the rice products found in traditional shops – even if some of these products were the same as the products inventoried in open-air stalls – and so on for the other types of retail outlets. Owing to the different inventory approach used in Accra versus the other cities, we exclude the Accra data from the comparisons of retail outlets below.
The city-outlet inventories started from one type of retail outlet and continued within that retail outlet type until few or no new products could be found within that outlet. For packaged chicken meat and eggs, the enumerators could not identify any new products in any of the cities by the end of the survey. For processed tomatoes, at the close of the inventory enumerators could identify less than one new product in every three retail outlets surveyed. For milled grains, roots and tubers, the broadest food category, enumerators encountered on average less than one new product per store visit by the end of the inventory.
Inventories started from commercial centres, where food retail activities are concentrated, and moved on to other parts of the city when few new products were encountered, usually after 2 or 3 days of inventory. As the cities had relatively few supermarkets, the survey included all food supermarkets. The team visited 98 retail outlets in Accra in 2015. In 2016, the enumerators visited 545 retail outlets in the other seven cities, including 196 open-air stalls, 49 street-side vendors, 206 traditional non-self-service shops, 66 self-service grocery stores, 17 single-enterprise supermarkets and 11 chain supermarkets (Table 3). Ten retail outlets declined the survey request.
Number of surveyed retail outlets, by city.
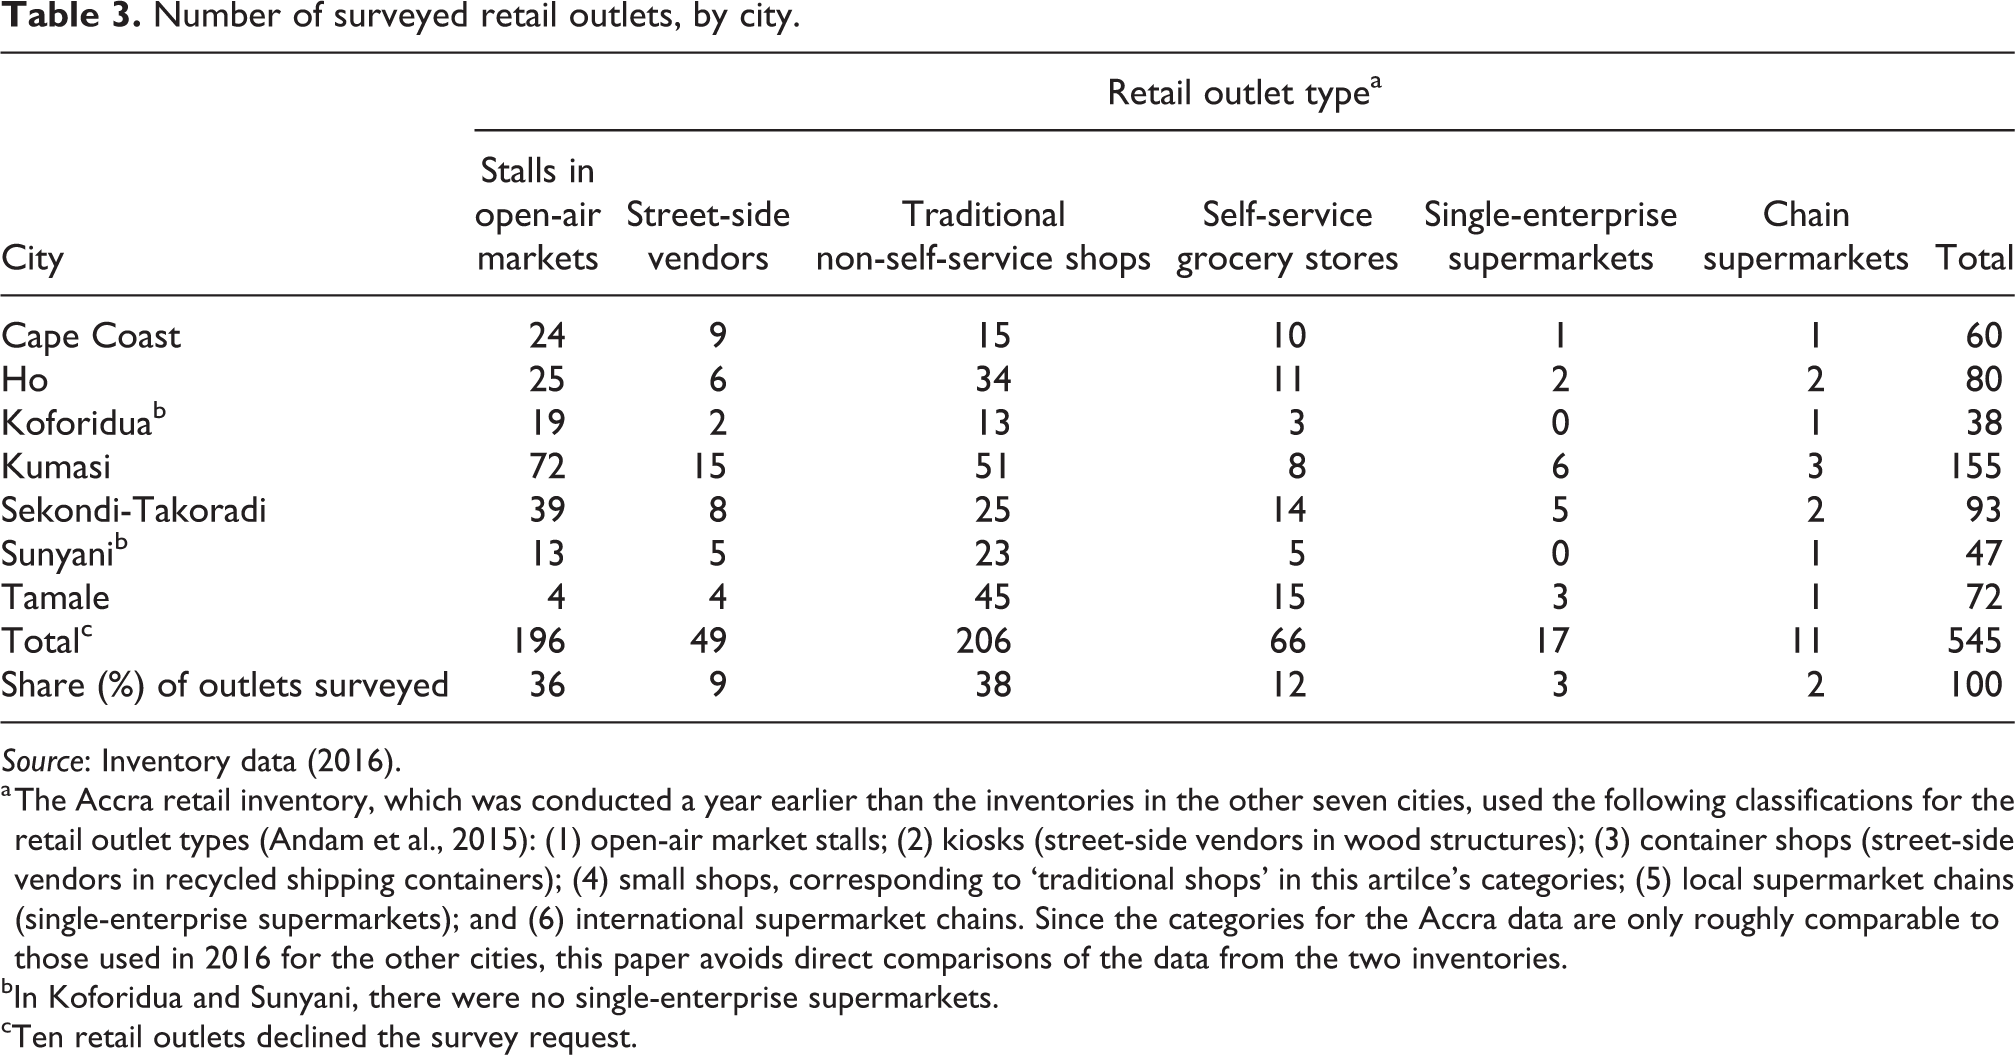
Source: Inventory data (2016).
a The Accra retail inventory, which was conducted a year earlier than the inventories in the other seven cities, used the following classifications for the retail outlet types (Andam et al., 2015): (1) open-air market stalls; (2) kiosks (street-side vendors in wood structures); (3) container shops (street-side vendors in recycled shipping containers); (4) small shops, corresponding to ‘traditional shops’ in this artilce’s categories; (5) local supermarket chains (single-enterprise supermarkets); and (6) international supermarket chains. Since the categories for the Accra data are only roughly comparable to those used in 2016 for the other cities, this paper avoids direct comparisons of the data from the two inventories.
bIn Koforidua and Sunyani, there were no single-enterprise supermarkets.
cTen retail outlets declined the survey request.
Results and discussion
Pace of food retail modernization
Contrary to the expectation that a supermarket boom will accompany rapid urbanization and per capita income growth, the team found modest supermarket growth in all eight cities, with around one supermarket for every 60,000 residents. The inventory data included the year in which each retail outlet started operations. As noted earlier, all the surveys included all supermarkets operating in the cities, and therefore the data allow for a description of the penetration of modern retail in each city.
Accra has seen the most growth. Before 2005, the city had only three supermarkets; three more opened there from 2005 to 2010, and an additional 10 have started operating in the city since 2010. These include the well-known South African supermarket chains Game and Shoprite and local supermarket chains such as Koala, MaxMart and Shop and Save. In Kumasi, the first 10 supermarkets opened in the past 20 years. Sekondi-Takoradi has seven supermarkets. Tamale experienced a brief spurt in modern retailing between 2001 and 2006, when four supermarkets were established, but there have been no supermarket openings since then. The four smaller cities have had eight supermarkets opening in the past 15 years. Instead of a rapid spread of supermarkets, the shift to processed foods is currently occurring largely through traditional retail outlets.
Availability of processed food products
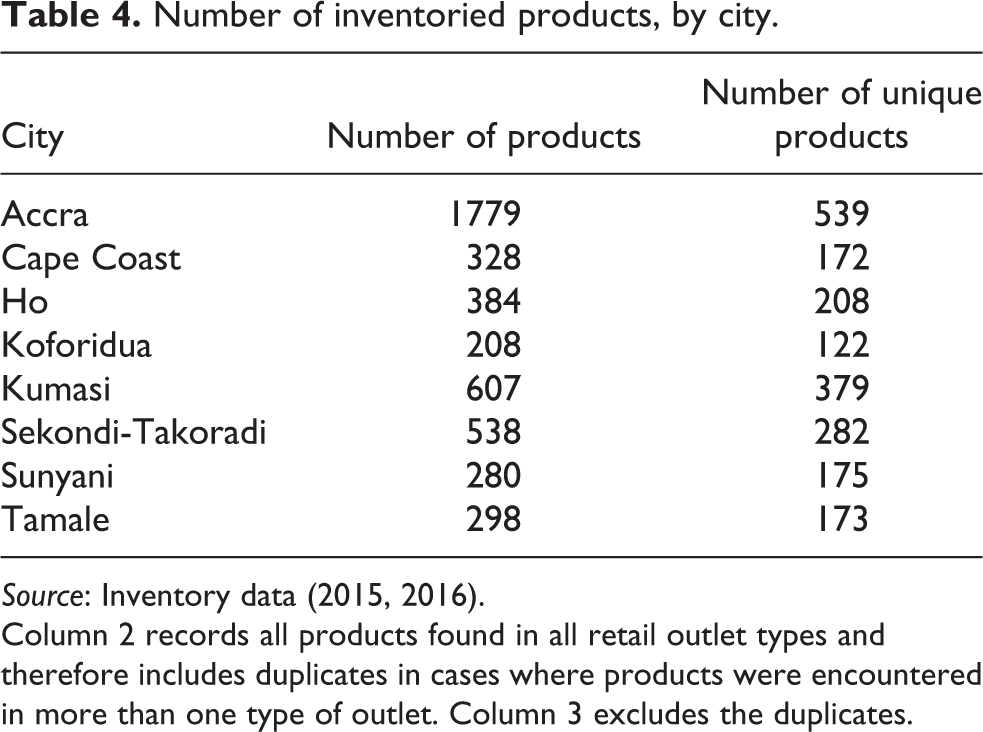
The shops have a wide range of processed products. Table 4 presents two different counts of product availability. The first counts all products recorded during the inventory. By this count, there were 1779 products in Accra alone and hundreds of products in each of the other cities (Table 4, column 2). As described earlier, these inventories recorded all products within each type of retail outlet. Therefore, some products may have been counted more than once if found in more than one retail outlet. The second count eliminates these duplicates in order to calculate the number of unique products in each city. The availability of processed foods corresponded with the size of city. The enumerators recorded the highest number of unique products, 539, in Accra, followed by 379 in Kumasi and 282 in Sekondi-Takoradi (Table 4, column 3).
Number of inventoried products, by city.
Source: Inventory data (2015, 2016).
Column 2 records all products found in all retail outlet types and therefore includes duplicates in cases where products were encountered in more than one type of outlet. Column 3 excludes the duplicates.
In the tables below, we use the two different product counts for different purposes. For example, we use the unique product count to compare shares of domestic and imported products in each city and to compare types of product packaging. This is the appropriate measure because the comparisons focus on the characteristics of the unique product, such as whether it was manufactured domestically or imported. In contrast, when we compare findings across retail outlet types (for instance, availability of imported products across retail outlet types), we maintain the overall count of products within each outlet type.
Import penetration
Imports dominate the processed foods sector in all eight cities. Import shares range from 63% to 86% of inventoried products, depending on the city (Figure 2). In terms of manufacturer location, 71–83% of processing firms are located outside Ghana. Import shares do not appear to be higher in larger cities. Surprisingly, although Accra, as the principal and most-populous city, would be expected to have higher shares of imports than the other cities, we find the opposite result. In Accra, 63% of the products are imported, whereas Koforidua, one of the smallest cities, has the highest share of imported products at 86%. Nor does import penetration seem to vary by distance from ports. In Tamale, the city farthest from coastal ports, 76% of the products are imported, whereas the coastal cities Cape Coast and Sekondi-Takoradi have import shares of 77% and 71%, respectively.

Shares (%) of imported products, by city population. Source: Import shares derived from inventory data (2015, 2016) and city populations based on Ghana Statistical Service (2014) data.
There could be two possible explanations for this unexpected finding. First, domestic food manufacturers, in the initial stages of competition against imports, may be targeting the larger market in Accra, leading to lower shares of imported products there. Second, retailers in smaller cities may be selling domestic processed foods in unpackaged form while retailers in larger cities carry packaged, domestic products. We found anecdotal evidence of the latter during the surveys for processed grains such as milled rice and maize. Future research on unpackaged processed foods, an area beyond the scope of this study’s inventories, would provide further clarity on this issue.
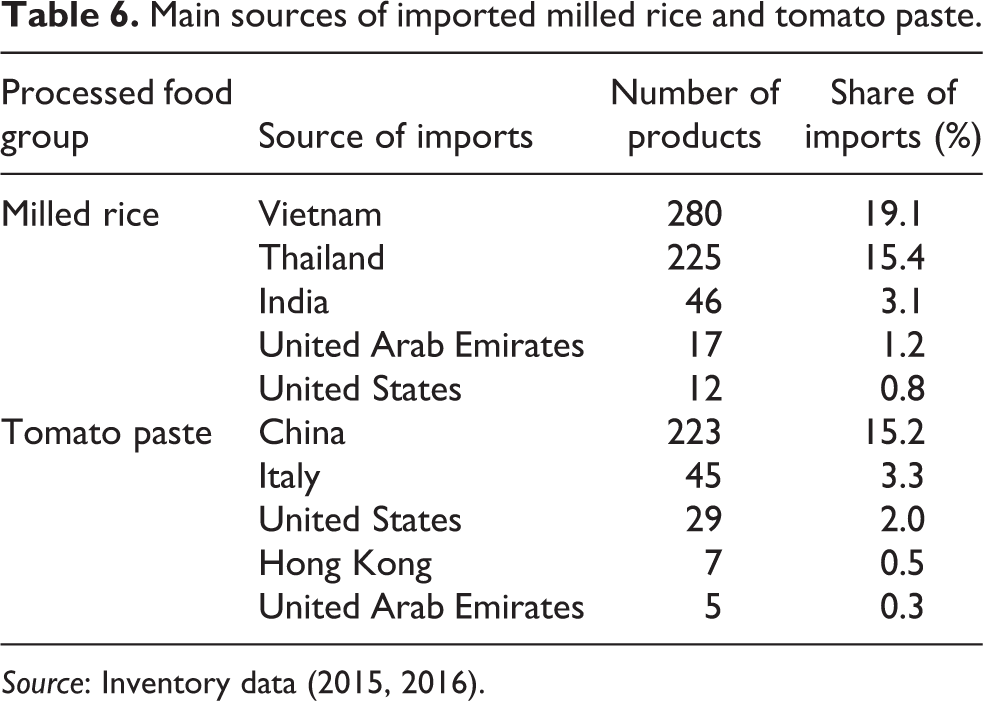
Import dominance is clearly visible in the poultry and processed tomato categories (Table 5). For example, for tomato pastes, which make up 76% of processed tomato products, import shares range from 83% to 98% (not shown in Table 5). Milled grains, roots and tubers – the products with the least value added after the farm – show the lowest import shares from 58% in Accra to 80% in Koforidua. For milled rice, which accounts for about 61% of the product in this category, import shares range from 79% to 98%. For non-rice products in the milled grains category, import shares are much lower (35% for Accra and less than 10% for Kumasi, Sekondi-Takoradi and Tamale).
Share and number of imported products, by food product category and by city.

Source: Inventory data (2015, 2016).
Imports come mainly from East Asia (Table 6). China, Thailand and Vietnam account for two-thirds of imports. Remarkably, we do not find much evidence of imports from neighbouring West African countries or indeed from other African countries. In Accra, excluding imports from South Africa (representing 6% of imports), only 3% of imports come from African countries. Products imported from other countries in Africa are nearly non-existent in the other seven cities (less than 3% of imported products in Kumasi, Sekondi-Takoradi and Tamale were from other sub-Saharan African countries). In contrast, a recent inventory in Tanzania recorded high shares of imports from other sub-Saharan African countries (Snyder et al., 2015).
Main sources of imported milled rice and tomato paste.
Source: Inventory data (2015, 2016).
Domestic processing is done primarily in Accra, followed by the city in which the product is sold (Table 7). In each city, around 50% of domestic products in the milled grains, roots and tubers category come from Accra, and about 25% come from the city in which the product was found (Table 7). Processing firms in Accra sell their products in other cities but there seems to be limited transport of processed food products manufactured outside Accra to other cities in Ghana.
Manufacturer location for products manufactured in Ghana, by city.

Source: Inventory data (2015, 2016).
Are imports more prevalent in modern retail outlets?
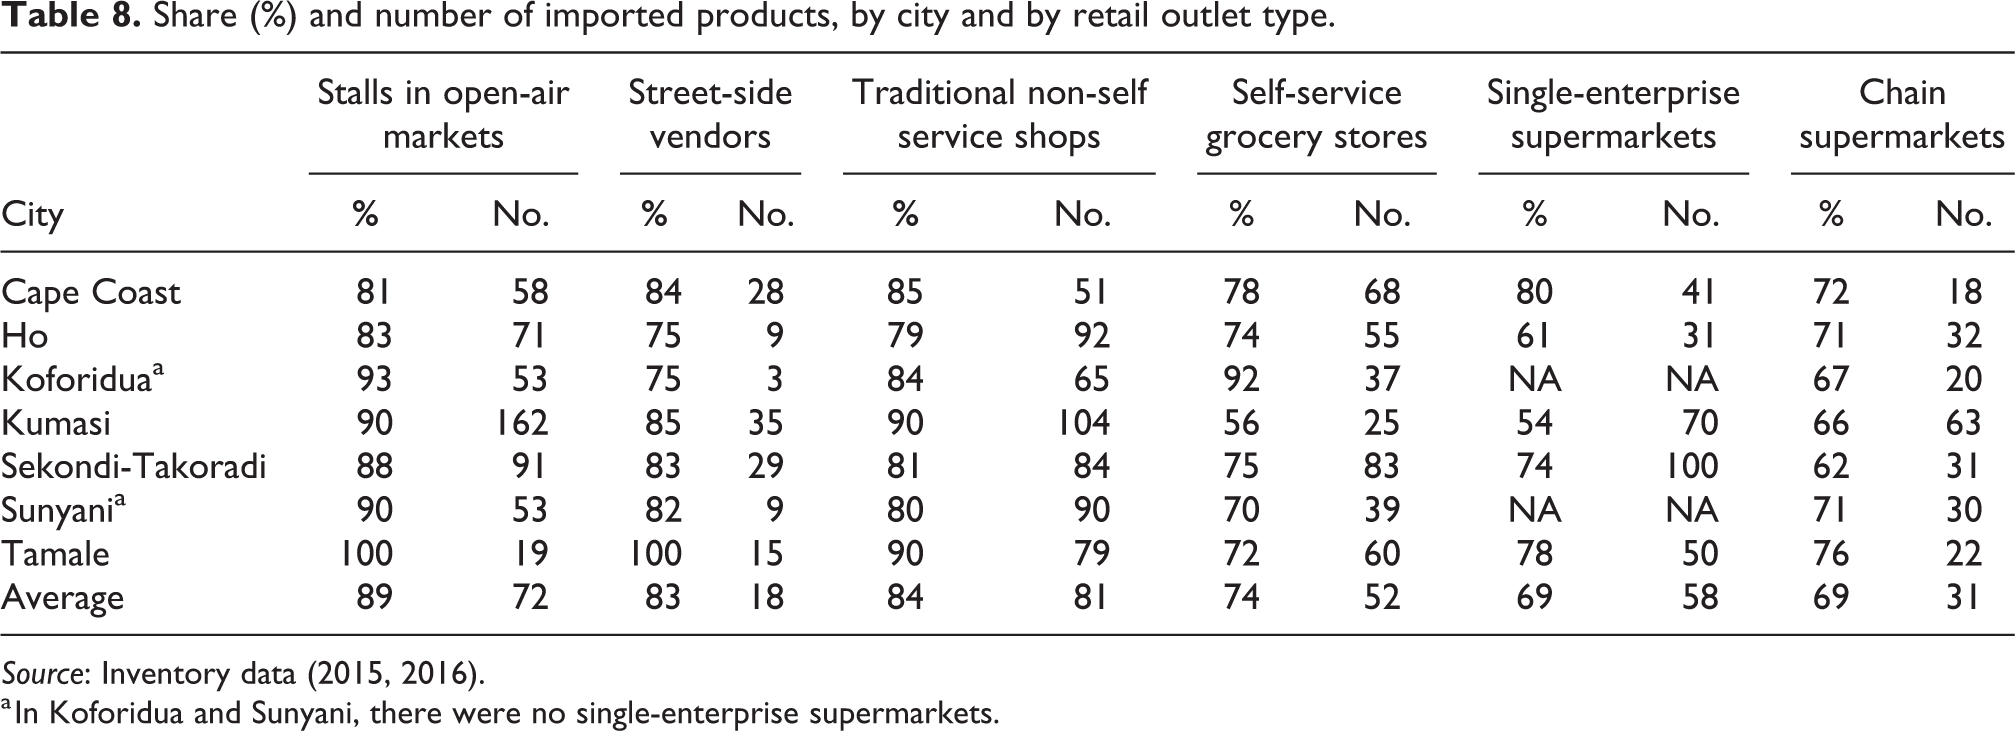
One would expect to find higher shares of imported products in modern retail outlets than in traditional outlets because supermarkets tend to cater towards wealthier customers (Traill, 2006) and because it tends to be difficult for domestic processors to enter into modern supply chains (D’Haese and Van Huylenbroeck, 2005). However, in our inventories, this is not the case. On average, 83–89% of products in traditional outlets are imported, compared with an average of 69–74% of products in modern retail outlets (Table 8). In making this assessment, we categorize traditional and modern retail outlets based on whether the outlet is self-service or not. Accordingly, we classify open-air markets, street-side vendors and traditional shops as traditional retail outlets and the other three categories – grocery stores, single-enterprise supermarkets and chain supermarkets – as modern retail outlets.
Share (%) and number of imported products, by city and by retail outlet type.
Source: Inventory data (2015, 2016).
a In Koforidua and Sunyani, there were no single-enterprise supermarkets.
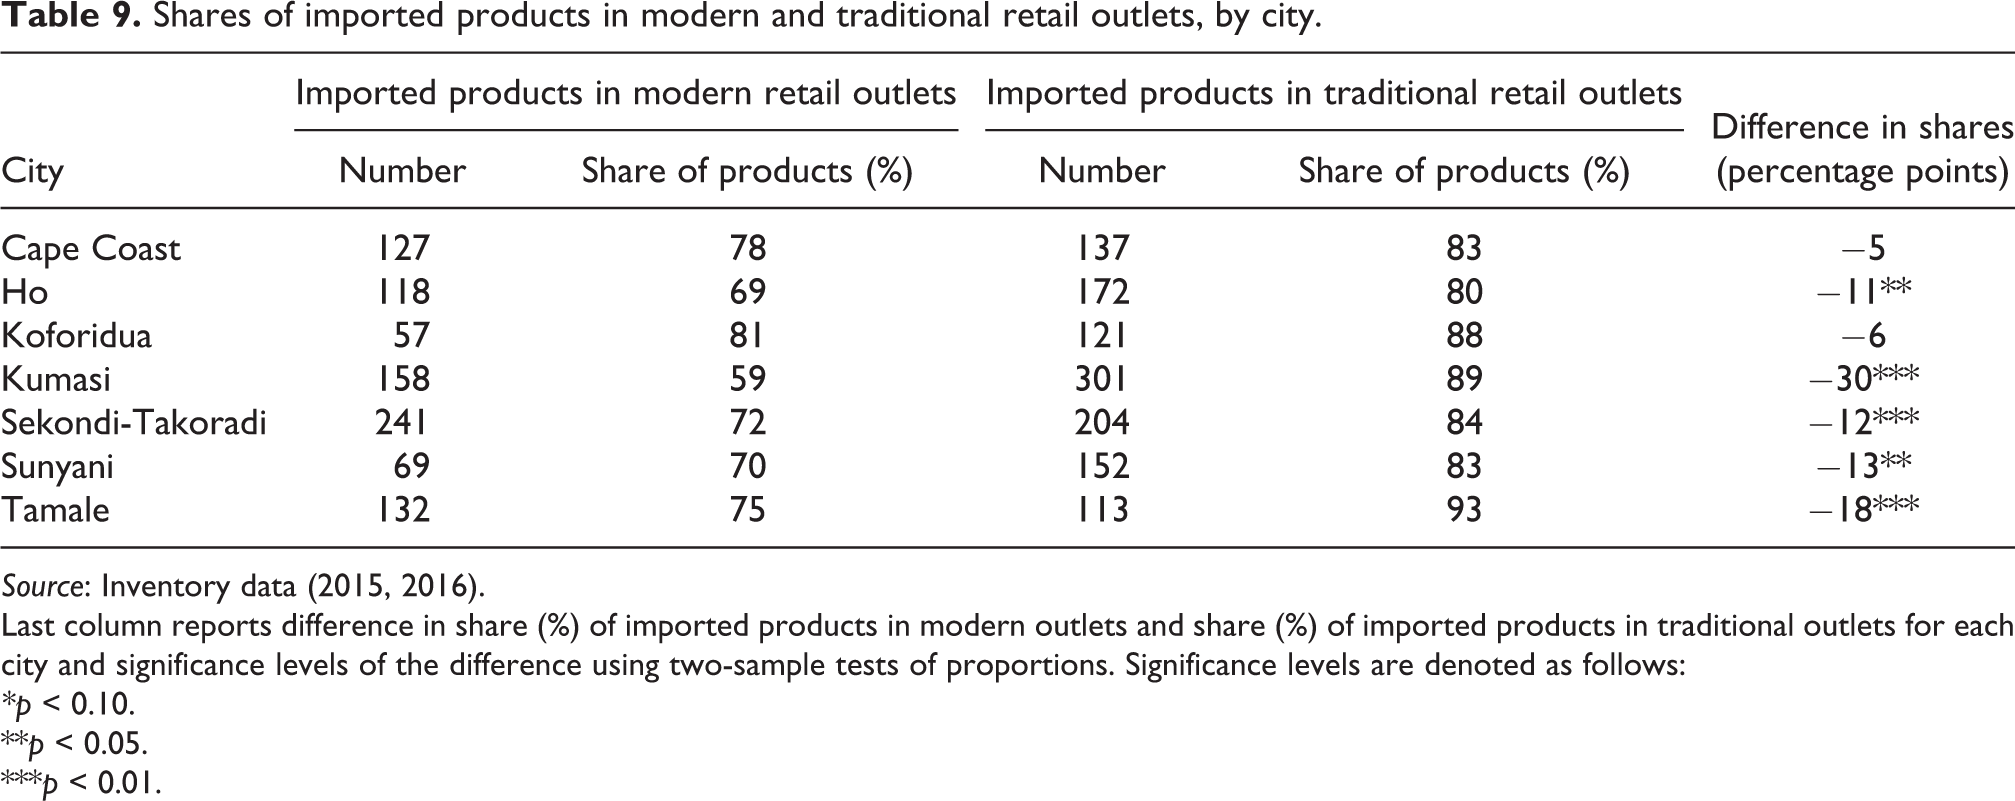
We combine the product counts for retail outlet types within each of the two categories and use simple two-sample tests of proportions to determine whether imported products are more commonly found in modern retail outlets than in traditional outlets in the cities (excluding Accra for reasons explained earlier). In the seven cities, the shares of imported products in modern outlets are higher than the shares of imported products in traditional outlets, and the differences are significant in five of the seven cities (Table 9). The situation is even starker when we compare shares of domestic and imported products in the milled grains, roots and tubers category alone. For products in the latter category, import shares in the traditional outlets are 69–84% compared with import shares of 60–67% in the modern outlets (Table 10).
Shares of imported products in modern and traditional retail outlets, by city.
Source: Inventory data (2015, 2016).
Last column reports difference in share (%) of imported products in modern outlets and share (%) of imported products in traditional outlets for each city and significance levels of the difference using two-sample tests of proportions. Significance levels are denoted as follows:
*p < 0.10.
**p < 0.05.
***p < 0.01.
Share (%) and number of imported milled grains, roots and tubers, by city and by retail outlet type.
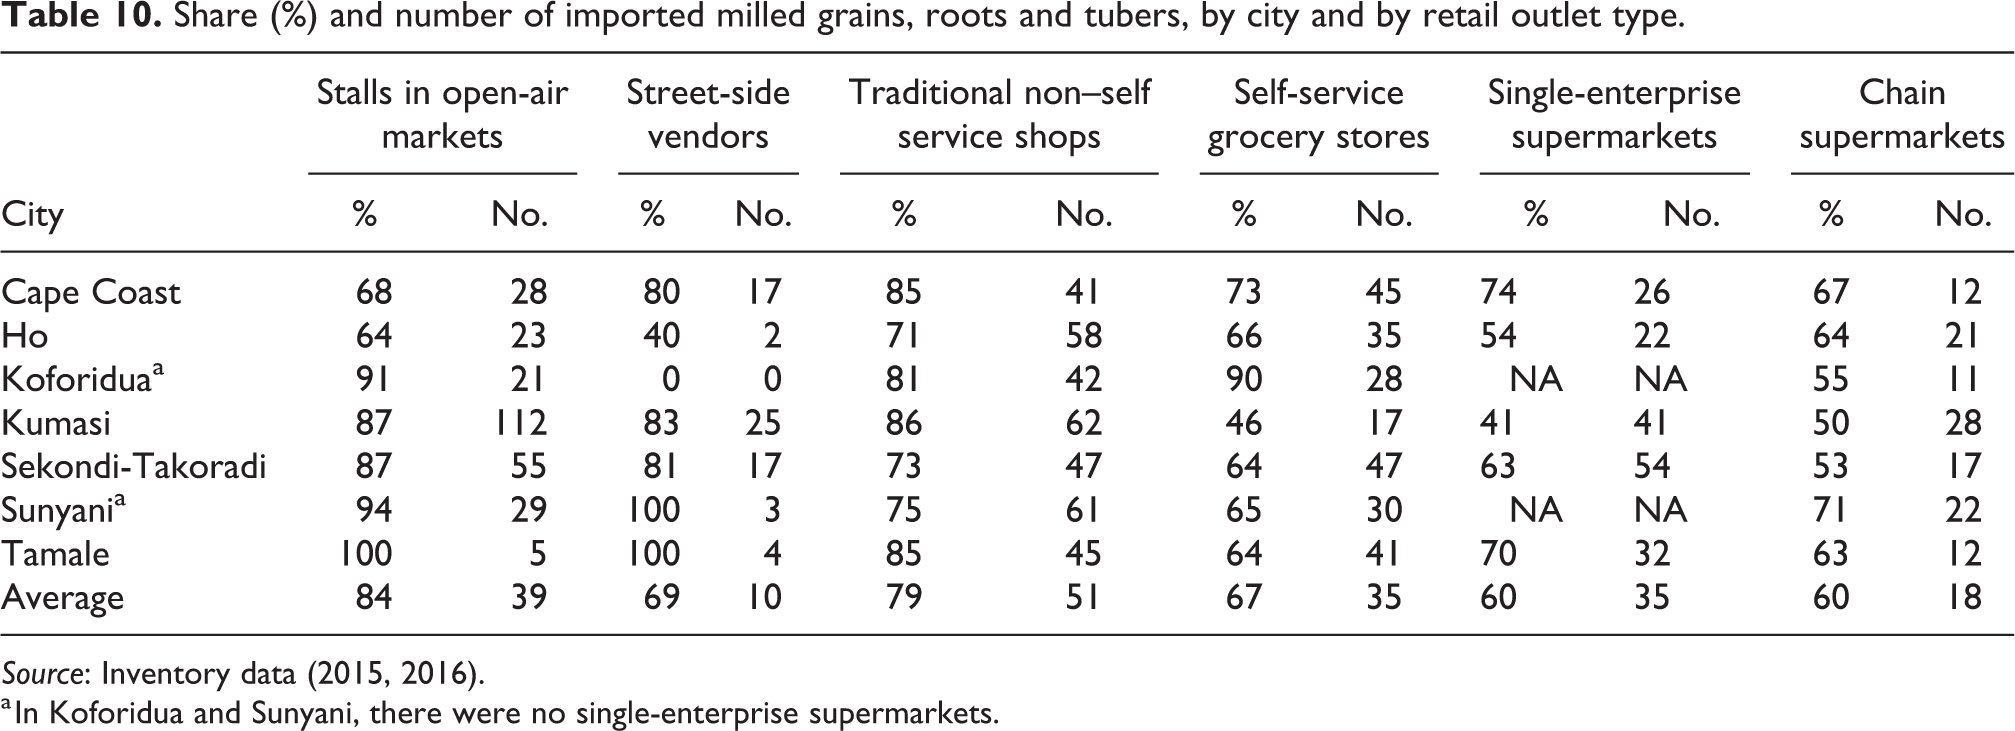
Source: Inventory data (2015, 2016).
a In Koforidua and Sunyani, there were no single-enterprise supermarkets.
Do imported products have better packaging?
We compare domestic and imported products in terms of three packaging and labelling attributes. First, we compare the type of packaging, which determines whether a packaged product could be opened (intentionally or accidentally) or attacked by pests during transportation, handling and storage. We classify hard and soft packaging, where hard packaging comprises products in tin cans and glass or plastic bottles and jars, whereas soft packaging includes all others such as plastic bags, polypropylene sacks, aluminium foils, jute sacks, paper bags and paper boxes. Second, we compare products in terms of the presence of a bar code for tracking. Third, we compare products in terms of the presence of nutritional information. Consumer surveys in Accra have suggested that consumers care about packaging as a sign of product quality (Hollinger and Staatz, 2015). We assess the extent to which food manufacturers are responding to the demand for high-quality packaging. In Table 11, we report the shares of imported and domestic products with each of the packaging attributes listed above and compare the differences using a simple two-sample test of proportions.
Shares of products with attributes: hard packaging, presence of bar code and presence of nutrition information by city.
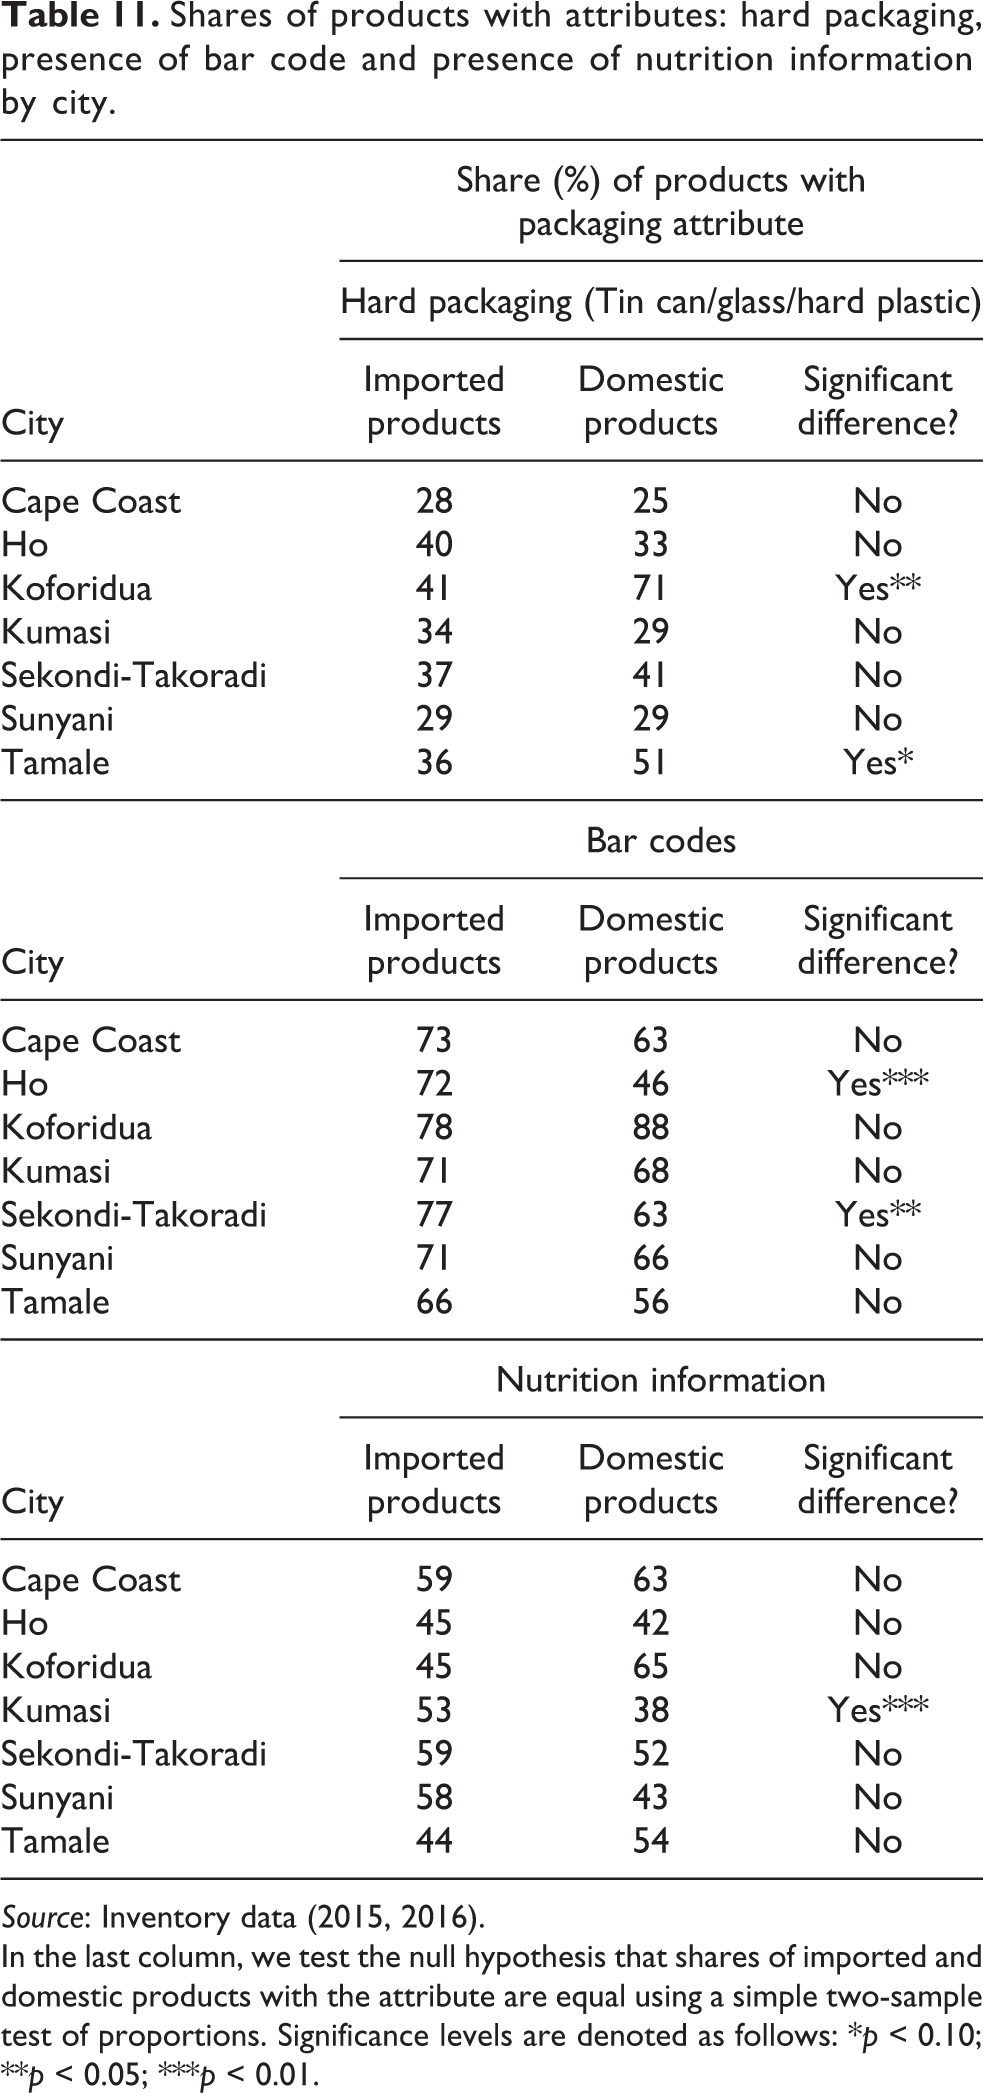
Source: Inventory data (2015, 2016).
In the last column, we test the null hypothesis that shares of imported and domestic products with the attribute are equal using a simple two-sample test of proportions. Significance levels are denoted as follows: *p < 0.10; **p < 0.05; ***p < 0.01.
We find that domestic and imported products have similar shares of hard packaging. In two cities, Koforidua and Tamale, the share of domestic products with hard packaging is higher than the share of imported products with hard packaging. In the other five cities, there are no significant different differences between domestic and imported products in terms of packaging type. In four of the seven cities, there are no significant differences in the shares of domestic and imported products with the other two packaging attributes (presence of bar codes and presence of nutrition information). Bar codes are present on a higher share of imported products than domestic products in two cities (Ho and Sekondi-Takoradi), and in one city (Kumasi), a higher share of imported products than domestic products have nutrition information on the packages. Taken together, these results suggest that domestic products are fairly matched against imported products in terms of packaging and labelling attributes.
Conclusion
In this article, the inventories of processed food products on sale in eight cities in Ghana have highlighted the following four aspects of urban food system transformation. First, supermarket growth in Ghana’s cities has been modest to date. Second, imports dominate the processed foods sector. Notably, the highest shares of imported products are found in processed tomatoes, a sector where the government has promoted domestic processing for decades (Robinson and Kolavalli, 2010). Third, few products within the food categories in this study were imported from other African countries. For policymakers and development agencies promoting intra-regional trade, this may be a cause for concern. Fourth, surprisingly high percentages of products in traditional retail outlets were imported, compared to the shares of imported products in modern retail outlets. Imported products hold a higher share in smaller cities, even those far from ports, than in larger cities. The two large coastal cities, Accra and Sekondi-Takoradi, do not show meaningfully higher import shares than the other cities. Finally, local processing takes place mainly in Accra, followed by the city in which the product is sold.
This study adds to the emerging picture of the transformation of the urban food system across Africa. Our findings confirm the prevalence of imported food products in West Africa, as shown by similar inventories conducted recently (Liverpool Tasie et al., 2016; Theriault et al., 2018). However, unlike the Mali case, where Theriault et al. (2018) found no international supermarket chains and only a few local supermarkets in the capital Bamako, we see penetration of international and local chain supermarkets across all cities in Ghana. Although inventories in Tanzania showed locally manufactured grain products dominating imports (Ijumba et al., 2015), the opposite holds true in Ghana (this study), Mali (Theriault et al., 2018) and Nigeria (Liverpool Tasie et al., 2016). Urban food markets across sub-Saharan Africa are integrating with a range of producing regions. Whereas the bulk of rice and tomato products available in Ghana’s cities are imported from East Asia, dairy and grain products in Mali are imported mainly from Europe (Theriault et al., 2018) and grain imports in Tanzania are mainly from other eastern and southern African countries (Ijumba et al., 2015; Snyder et al., 2015).
Future research on urban food systems in Africa will require comprehensive surveys and analyses to improve our understanding of farmer–processor–retailer–consumer linkages. Policymakers in Ghana and West Africa would benefit from research on the potential for local producers to be linked to urban food systems and the drivers of consumers’ preferences for processed food products, which would signal future demand trends. This study provides a step in this direction by describing the urban food retail sector in Ghana, and comparing the sources, availability and packaging of domestic and imported food products. The article’s findings suggest that, beyond the expected spread of modern retail systems and changes in food sources (Timmer, 2009), food system transformation will also lead to unexpected and counter-intuitive outcomes in urban food retail in developing countries.
Footnotes
Authors’ note
The opinions expressed here belong to the authors and do not necessarily reflect those of PIM, IFPRI, CGIAR or USAID.
Acknowledgements
The authors acknowledge financial support from United States Agency for International Development (USAID) through funding for the Ghana Strategy Support Program (GSSP) and the CGIAR Research Program on Policies, Institutions and Markets (PIM), which is led by the International Food Policy Research Institute (IFPRI). The authors thank an anonymous referee and the editor for helpful comments. Any errors remain those of the authors.
Declaration of conflicting interests
The author(s) declared no potential conflicts of interest with respect to the research, authorship, and/or publication of this article.
Funding
The author(s) disclosed receipt of the following financial support for the research, authorship, and/or publication of this article: This work was financially supported by United States Agency for International Development (USAID) through funding for the Ghana Strategy Support Program (GSSP) and the CGIAR Research Program on Policies, Institutions and Markets (PIM).