
Abstract
This article investigates whether study-specific attributes account for systematic variations in reported technical efficiency (TE) scores in crop production. We conducted a meta-regression analysis using mean TE (MTE) estimates from primary frontier studies of Ethiopian crop sub-sector over the period 1991–2015. The estimated MTE of 66% indicates a capacity to increase efficiency in crop production. Results from a fractional outcome regression model revealed that reported efficiency estimates vary substantially across studies and agro-ecologies. We found that reported efficiency estimates are influenced by the frontier methodology used, the functional form assumed, assumptions about technology representation, the estimated dimension of the model, output aggregation and the publication outlet. We show that reported efficiency estimates are sensitive to variations in agro-ecologies. We argue for the need to consider differences in agro-ecologies when estimating TE because failure to account for this may bias efficiency estimates.
Introduction
Agriculture remains the focus of many developing countries, where food insecurity and poverty persist. Yet, the contribution of the sector to food security and poverty reduction is minimal (Bachewe et al., 2018). Particularly countries in the south of the Sahara are characterized by severe food shortage resulting from a massive gap between food production and consumption. The fact that farm efficiency analysis provides significant insights into farms’ potential to enhance agricultural productivity; estimating farm efficiency has been the subject of considerable interest to researchers in the past few decades. Despite a growing number of studies examining efficiency in crop production within the context of developing countries in general (Abdul-Salam and Phimister, 2017; Adamie et al., 2018; Alene and Hassan, 2006; Coelli and Battese, 1996; Haji, 2007; ), discussions by several scholars (e.g. Bravo-Ureta et al., 2007; Chaimani et al., 2014; Ogundari, 2014; Ogundari et al., 2012; Thiam et al., 2001; Wadud and White, 2000) have shown that results from frontier studies vary substantially across studies.
Particularly in Africa, some efficiency studies used to raise policy debates on the performance of the agricultural sector (Abro et al., 2014; Abrar and Morrissey, 2006; Alene and Hassan, 2006; Arega, 2010; Croppenstedt and Demeke, 1997; Haji, 2007). Results have been mixed and inconsistent across different modelling approaches and prevailing agro-ecological conditions. Studies such as Arega (2010) argued that the contribution of the change in efficiency levels to the total factor productivity growth of the agricultural sector in Africa is negative over the years. Because of the complexity in determining the level of farm efficiency and its drivers, policy prescriptions have essentially been ad hoc. Some studies have even reported conflicting results from the same data set. For instance, using Ethiopian Rural Household Survey data, different authors (see Abrar and Morrissey, 2006; Abro et al., 2014) estimated different levels of TE of Ethiopian farmers. There are also inconsistencies in the theoretical relationships between TE and its determinants. For example, although variables such as access to extension service and schooling are expected to enhance agricultural productivity, empirical studies (see e.g. Abdul-Salam and Phimister, 2017; Alemu et al., 2009; Coelli et al., 2002; Haji, 2007) reported mixed results on the influence of these variables on TE. A recent comprehensive study by Ogundari (2014) has also shown that some studies on the technical efficiency (TE) of African agriculture have reported mixed results on the effects of key policy variables, such as extension service on farm efficiency across various regions.
Arguably, study attributes could lead to systematic differences in TE estimates. As rightly pointed out by Wadud and White (2000), differences in TE estimates mainly arise from differences in study attributes such as frontier methodology, model specification, technology representations, the location of the study and approaches to measuring output among others. Since the pioneering work of Farrell (1957), there have been many developments and controversies in frontier methodologies, which are broadly categorized into parametric models, such as the stochastic frontier approach first proposed by Aigner et al. (1977) and non-parametric techniques, such as deterministic techniques and Data Envelopment Analysis (DEA) developed by Chames et al. (1978). Despite the extensive use of the non-parametric approaches, these approaches are criticized because they ignore random errors and the estimates are affected by extreme observations (Bravo-Ureta et al., 2007). However, a plethora of studies have emerged measuring and estimating TE in farming using variants of the frontier approach. As argued by Battese (1992) and Coelli (1995), because the agricultural sector is susceptible to natural hazards, climatic conditions and events beyond farmers’ control, the choice of frontier methodologies is particularly important. However, Wadud and White (2000) noted that the choice of frontier methodologies is often driven by the study’s objectives, data availability and the researcher’s personal preferences. There also exists considerable debate about the selection of functional form in the frontier analysis. For example, as Coelli et al. (2005) argued that the Cobb–Douglas functional form is an inadequate representation of the underlying production frontier as input elasticities of farm production often vary across observations. However, Cobb–Douglas functional form is most widely used in the extant literature given its computational simplicity.
Although previous meta-analyses on agricultural efficiency studies (see Bravo-Ureta et al., 2007; Moreira López and Bravo-Ureta, 2009; Ogundari, 2014; Ogundari et al., 2012; Ogundari and Brümmer, 2011; Thiam et al., 2001) have been widely used to evaluate agricultural policies in developing countries, most of them have had a broad cross-country focus (see Bravo-Ureta et al., 2007; Moreira López and Bravo-Ureta, 2009; Ogundari, 2014; Thiam et al., 2001). As Fatima and Yasmin (2016) argue, a meta-analysis for a single country gives broader and meaningful picture compared to cross-country analysis that sets the average TE by integrating different countries as a single unit. Focusing on studies from a single country enables one to address various country-specific issues that can influence efficiency estimates (e.g. differences in the farming systems across agro-ecological regions in the country). In the African context, there is a comprehensive meta-study conducted by Ogundari (2014). However, a limited number of meta-studies have been conducted in the context of an individual country. The exceptions are two studies from Nigeria (see Ogundari et al., 2012; Ogundari and Brümmer, 2011). Focusing on a different country with distinct agro-ecological conditions, this article builds upon and extends previous studies.
The article makes three contributions to the TE literature. First, to the best of our knowledge, this study is the first to provide strong empirical evidence of the causes of the variability in estimates of TE of crop production using a meta-analysis. Unlike previous studies that focused on the agricultural sector as a whole, we exclusively focus on the efficiency estimates from crop sub-sector, which is the primary source of food and livelihood for rural households in most developing countries. The fact that a meta-analysis of studies exclusively focusing on crop sub-sector enables to identify crop-specific factors determining efficiency, this study could better inform crop-specific policies to enhance household food security through improved crop productivity. Previous meta-studies used aggregate efficiency scores estimated by integrating multiple agricultural outputs at the household level. Despite the substantial contribution of these studies, a meta-analysis based on the whole farm sector may fail to account for the heterogeneity between the crop sector and livestock sector. This follows the argument by Fatima and Yasmin (2016) and Bravo-Ureta et al. (2007) that the aggregation of farm outputs tends to inflate efficiency estimates as it ignores the variations across sub-sectors.
Second, unlike previous cross-country meta-studies, our study leads to more generalizable conclusions providing deeper insights into a systematic influence of study attributes on TE estimates because we control for distinct agro-ecological variations across regions. A critical review of cross-country meta-studies has revealed that most studies have failed to account for agro-ecological variations that lead to differences in agricultural production systems. Agricultural production is often characterized by random shocks that may even appear to be distinct across geographical locations within a country. In Ethiopia, for example, there exist considerable variations in the agro-ecological conditions across regions (Adamie et al., 2018; Alemu et al., 2009). Such variations could sometimes lead to differences in the farming systems across regions, which could consequently influence the performance of the sector. As one of the performance indicators in productivity analysis, the estimation of agricultural efficiency may tend to generate different policy implications for farmers facing different agro ecological conditions. This is particularly important in crop production because farmers cultivating in differing agro-ecologies can have different efficiency levels because of the levels of heterogeneity arising from agro-ecological variations. Therefore, it is critical to account for these differences as they do affect efficiency (Adamie et al., 2018). Third, we extend our discussion to include drivers of TE in crop production over the years and across agro-ecologies.
In brief, this article addresses three main objectives. First, it investigates differences in reported efficiency scores across study attributes and agro-ecological zones in Ethiopia. Second, it examines whether there has been development in reported efficiency scores over time. Third, we identify the major factors that have driven efficiency levels in crop production in Ethiopia between 1991 and 2015. Given the broad agro-ecological diversity across the country (Adamie et al., 2018; Alemu et al., 2009), we used the crop sub-sector of Ethiopia as a compelling case. We identified studies by six agro-ecological zones characterizing the entire landscape of Ethiopia into areas with distinct farming systems. Bereha and Kolla agro-ecologic zones are characterized by a unimodal and short rainy season with a dominance of a crop–livestock mixed farming system. Woyna Dega along with the Kolla comprise the most dominant Ethiopian agricultural belt. Woyna Dega is characterized by a unimodal (single) rainy season, and the farming system is characterized by mono-cropping. Woyna Dega is dominated by a farming system characterized by Teff 1 mono-cropping, while the Dega agro-ecologic zone is dominated by a sorghum mono-cropping. Wurch and Kur agro-ecological zones are often considered as not suitable for growing major crops.
Material and methods
Meta-data set
The first step in a meta-analysis is to identify the relevant literature to be included. In this study, a variety of sources were selected based on relevance to the research objectives. To search the relevant literature, bibliographic databases, such as Scopus, Google Scholar and Global Search (library websites), were used. We also consulted PhD dissertations from various universities. Searches were conducted for English-language articles containing combinations of multiple keywords. All bibliographical details were retrieved by the search strategy. Before conducting the analyses, the full search was exported to Endnote 8, duplicate results were removed, and the final papers were coded. The final papers to be included in the analyses were selected using the following criteria. The first broad criterion was whether a given study’s focus was on the crop sub-sector. The inclusion of relevant studies was assessed by title, by abstract and finally by a full-text review. Another criterion was the year of the survey. Our final criterion was whether a given study reported MTE estimate. Thirty-one studies of crop production, which yielded over 55 observations, were used for the final analyses.
Meta-regression framework
The major hypothesis of the current study was that the MTE estimates reported in the primary studies can be attributed to various study-specific characteristics and prevailing agro-ecologic conditions. To test this hypothesis, we developed a conceptual framework that employed an econometric technique to combine the results from multiple studies. We used a meta-regression, which is a statistical approach involving the analysis of the survey findings of primary empirical studies using the MTE scores reported by primary frontier studies on crop production in Ethiopia (1991–2015). Adapting the theoretical framework of Peterson and Brown (2005), we specified the meta-regression equation as

where MTE denotes the mean TE index reported by study i, Xi is a vector of study attributes, β is a vector of unknown parameters and εi∼N(0, σε) is the disturbance term. Estimating equation (1) is similar to the second stage of a DEA efficiency analysis: the first stage is estimating the TE and the second stage involves the investigation of the determinants of efficiency. Traditionally, given that the TE index is bounded between zero and one, several studies (Abrar and Morrissey, 2006; Chavas et al., 2005; Haji, 2007) have used linear models, such as Tobit and ordinary least squares, to identify the factors influencing MTE. However, using linear models has been criticized because the effect of an explanatory variable may not be linear over the range of values (McDonald, 2009; Papke and Wooldridge, 1993). Therefore, we estimated the meta-regression equation using a fractional outcome regression model that accounts for non-linearity in the data series.
Empirical model and variables
Using the MTE index reported in the reviewed studies, we specified our empirical meta-regression model as
We extend the meta-regression model in equation (2) by incorporating dummies representing the six traditional agro-ecological zones in Ethiopia. The model accounting for agro-ecological variation was specified as
The right-hand variables are the study-specific attributes defined in Table 1. In a different specification, we included the year the data were collected to investigate the development of efficiency over time. As argued by Fall et al. (2018) and Ogundari (2014), when reliable panel data are not available, the average year of data can serve as a proxy indicator to investigate efficiency trends over time. Further, we included a series of year dummies to capture the trends of efficiency, which may have been due to yearly differences in the prevailing policy-related and weather conditions of the study area. For analytical purposes, the characteristics of the frontier studies reviewed were further divided into different groups that consist of various hypothesized variables expected to explain the TE variations across primary studies (as defined in Table 1).
Description and summary statistics of variables used in meta-regression.a

MTE: mean technical efficiency.
aThe values in parentheses are standard deviations.
Dimension, measured as the ratio between the number of variables used and the sample size, was used to capture model dimensionality. The extant literature (see Fall et al., 2018; Thiam et al., 2001) indicate that by not accounting for the model dimensionality the frontier model becomes sensitive to the model dimension of a given study. As Thiam et al. (2001) argued, the number of variables used in the frontier model could lead to multicollinearity and thus has implications on the choice of the functional form. Therefore, we hypothesize a positive influence of a variable representing the model’s dimension (i.e. Dimension) on the reported MTE score.
According to the functional form, we divided frontier studies into translog or other functional forms, such as Cobb–Douglas. There is considerable debate about the choice of functional form in the frontier analysis, with the Cobb–Douglas and Translog being the most widely used ones in the extant literature (Abdul-Salam and Phimister, 2017). As Coelli et al. (2005) noted, the Cobb–Douglas functional form is inadequate in situations where input elasticities of production vary across observations. Given its flexible nature, some scholars argue that translog functional form can be interpreted as an approximation to any underlying production frontier (see Abdul-Salam and Phimister, 2017). This is because the use of less flexible functional forms may bias the TE estimates upwards. Therefore, we hypothesize a positive association between Translog functional form variable and the MTE score.
According to the type of frontier method, we divided the studies into parametric and non-parametric. Despite the extensive use of non-parametric approaches such as DEA, it is criticized on the basis that it ignores random errors in estimating TE (see Battese and Coelli, 1992; Coelli, 1995). Given that the agricultural sector is susceptible to natural hazards, such as climatic conditions and events beyond the farmer’s control, the non-parametric approach would potentially bias the TE estimates upwards. Therefore, following the arguments of Battese and Coelli (1992), we argue that the empirical studies that employed the parametric models would yield lower TE scores because they do account for random error or noise. Therefore, we hypothesize a negative association between the frontier method variable, Parametric, and MTE score.
To account for variations in the TE estimates attributed to differences in estimation procedures, we introduced a dummy variable (OneStage) equal to one for studies that employed a single stage estimation technique. The use of two-stage estimation procedure has the potential to bias the TE score upwards. Despite the popularity of the two-stage estimation procedure, several scholars (see McDonald, 2009; Wang and Schmidt, 2002) criticize this procedure for two main reasons. First, the input and output factors used to estimate the production frontier and TE may be correlated with the technical inefficiency scores in the second stage (see McDonald, 2009). Second, the use of the two-stage approach may yield inconsistent parameter estimates because the assumption of within-sample independence assumption may be violated as efficiency scores could be dependent on each other in the first stage. The effect is that the single-stage estimation procedure may be more efficient by reporting lower TE scores than the two-stage estimation procedure (see McDonald, 2009; Wang and Schmidt, 2002). Therefore, we hypothesize a negative association between the MTE score and the one-stage estimation procedure variable, OneStage.
We accounted for the differences in technology representations across the studies by including a dummy variable (Primal). A primal approach involves a direct estimation of the production function, as opposed to the dual approach that involves simultaneous estimation of production and cost functions (see Abrar and Morrissey, 2006). Given that the quantity of inputs used is independent of the error term, the primal approach often leads to a simultaneous estimation bias that influences the frontier parameter estimates and would consequently inflate TE estimates (see Bravo-Ureta et al., 2007; Thiam et al., 2001). Therefore, we hypothesize a positive association between the technology variable (primal) and MTE score.
Two dummies, D_HalfNormal and D_Truncated, were included to capture the influence of the distributional assumptions made by the authors for the inefficiency term. Greene (2008) has argued that compared to other distributional assumptions, the half-normal and truncated normal assumptions imposed by the frontier model does overstate the variance and may lead to misleading TE estimates. Therefore, in the revised manuscript, we hypothesize a negative association between distributional assumptions for the inefficiency term variables (D_HalfNormal and D_Truncated) and the MTE score.
To account for the influence of output aggregation, we used three dummy variables – Output, National and FarmLevel. Output represented studies that used aggregated outputs across various crops. We used a dummy variable, National, to separate studies conducted at national and regional levels. Following the studies by Fall et al. (2018) and Bravo-Ureta et al. (2007), we argue that the aggregation of crop outputs in frontier analysis tends to inflate TE estimates as it ignores the variations across production systems. Despite this, most previous studies have failed to account for the nature of aggregation of outputs. This stems from the fact that there are differences in land characteristics, such as land fertility, slope, plot size and so on, making the input mix to varying across farming systems thus bias the TE estimates upwards. Therefore, we hypothesize a positive association between output aggregation variables and MTE scores.
Further, following the existing literature and more specifically the recent articles by Fall et al. (2018) and Ogundari (2014), we introduced two variables – ImpactFactor and Journal to account for differences attributed to the type and quality of publication outlet. The variable Journal was used to distinguish studies published in scientific journals, while the variable ImpactFactor was included to separate studies that were published in a journal with an impact factor to control the quality of the study from those published in scientific journals. As Fall et al. (2018) and Ogundari (2014) argue, the disparity in reported efficiency scores can also be attributed to the quality and the type of the journal in which the articles are published. As such, most authors intending to submit a manuscript to a journal may consider targeting a top tier journal based on the quality of their empirical results.
Estimation issues
Before estimating our meta-regression models, estimation issues have been addressed to avoid spurious results and to obtain consistent estimates. The first major concern in meta-regression is to deal with the existence of publication bias (small-study effects). To detect possible publication bias, we used a funnel plot approach. The funnel plot is a simple scatter diagram of the variables of interest, such as effect size or treatment effect (reported MTE in our case), versus a measure of precision (Chaimani et al., 2014). Some of the most often used measures of precision include estimated standard error, standard deviation variances, sample sizes and the inverses of the square root of the sample sizes (Fall et al., 2018; Ogundari et al., 2012). When there is no publication selection bias, the measure of precision varies randomly and symmetrically around the vertical line. Following Fall et al. (2018), we used standard deviations of TE reported by the primary studies as a measure of precision and plotted this against the TE scores. Following Chaimani et al. (2014), we supported our graphical illustration with Egger’s meta-regression test for the weighted relationships between the reported TE scores and the standard deviation.
Another potential issue may arise because meta-analysis often incorporates studies that reported more than one TE estimates using the same data set (Espey et al., 1997; Moreira López and Bravo-Ureta, 2009). As a result, the values of the outcome variables across the observations may not be independent, and the standard errors can be biased (Thiam et al., 2001). To address this, we checked for the presence of studies that included more than five TE estimates from the same data set, following Espey et al. (1997). Finally, we addressed a potential heteroscedasticity problem that may arise because meta-regression errors are less likely to be homoscedastic as primary studies might have used different data sets, different sets of variables and different sample sizes (Moreira López and Bravo-Ureta, 2009).
Results
Descriptive results
The descriptive statistics of the variables employed in the analyses (presented in Table 2) show that the average MTE score from all the studies reviewed was approximately 0.66. An average MTE of 66% suggests that there was high technical inefficiency in the crop sub-sector in Ethiopia over the specified period. As shown in Figure 1, Woyna Dega agro-ecological zone of the country received the most attention. The mean year of the survey was 2003. The distribution of MTE studies across survey years (Figure 2) shows an increasing number of efficiency studies from the early 1990s. The number of studies dropped dramatically after 2009.
Meta-regressions of MTE.a

MTE: mean technical efficiency.
aThe values reported in parentheses are robust standard errors.
b p < 0.05.
c p < 0.1.
d p < 0.01.
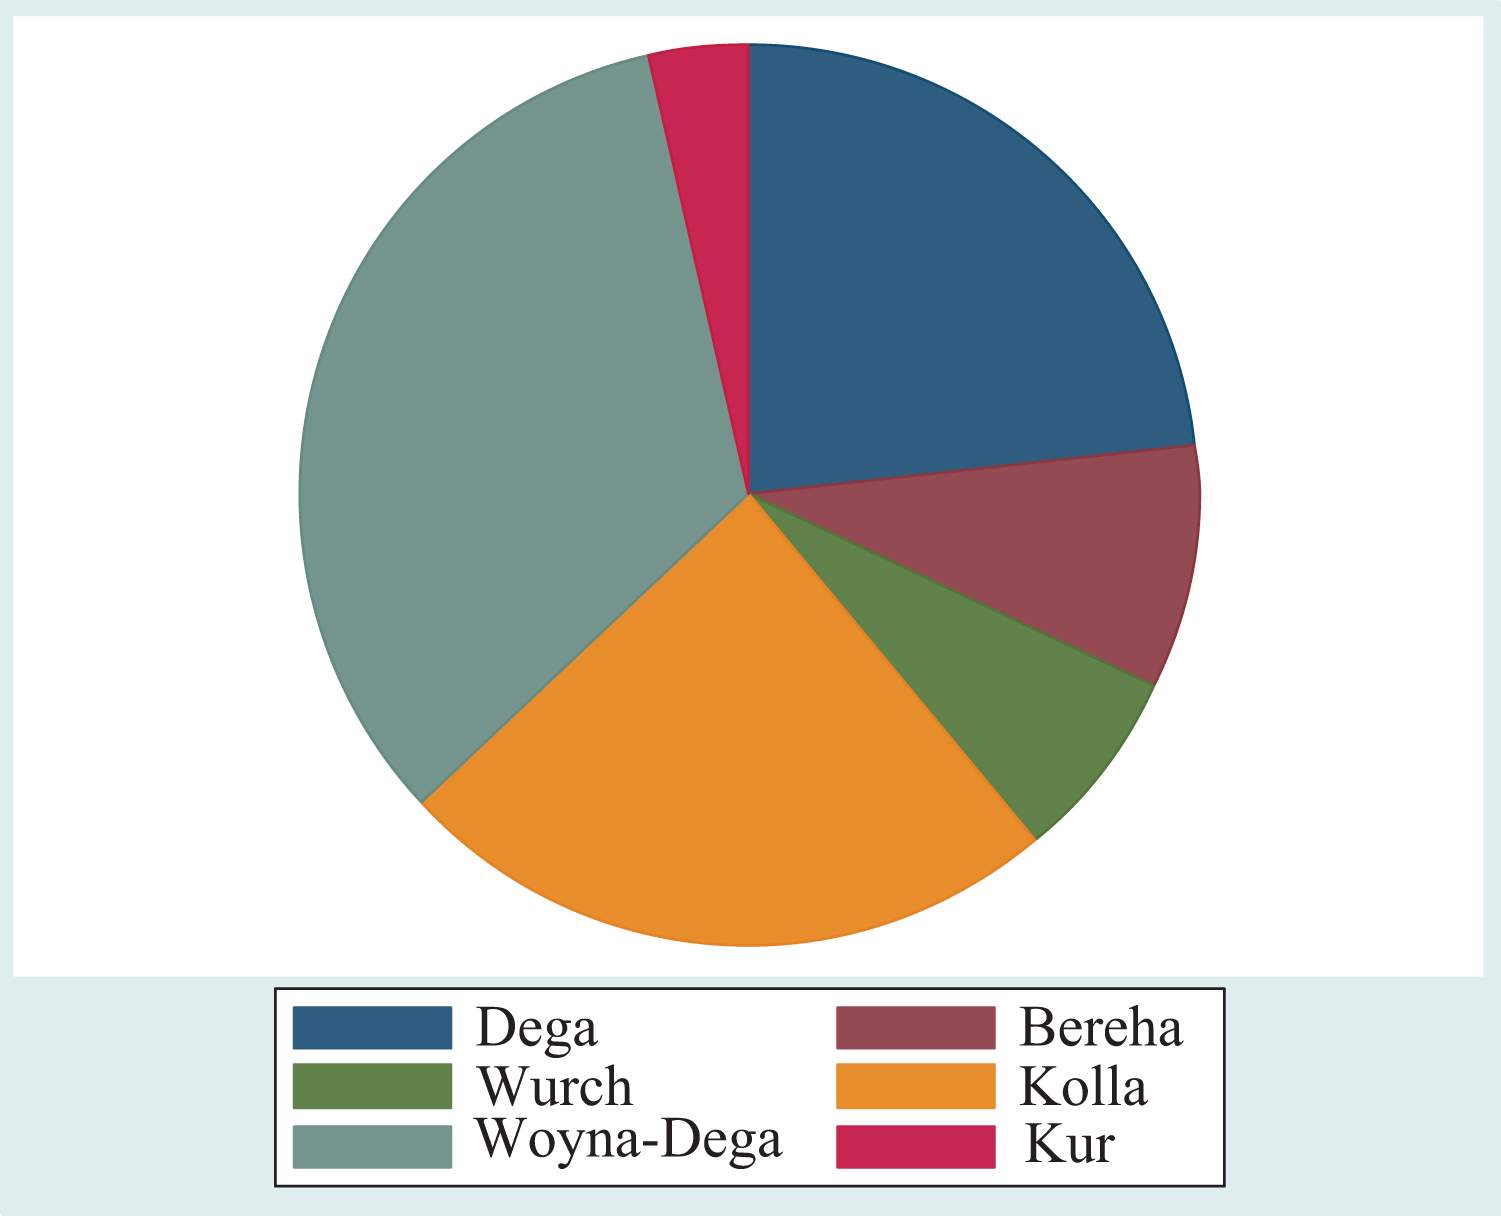
Distribution of MTE estimates across agro-ecologic zones. MTE: mean technical efficiency.

Distribution of TE studies across survey years. TE: technical efficiency.
Meta-regression results
Estimation issues
Before estimating our meta-regression models specified in equations (2) and (3), estimation issues (discussed in the previous section) were addressed. First, we explored possible publication bias using a funnel plot approach. As the funnel plot in Figure 3 shows, only one study fell outside the 95% confidence interval. This suggests that smaller studies do not tend to have systematic heterogeneity and, hence, the presence of small-study effects was unlikely in our data set. We also supported our graphical illustration with Egger’s meta-regression test for the weighted relationships between the reported TE scores and the standard deviation. The test results (with test statistics for the asymmetry of the funnel plot of −1.10, t value = −1.50 and p value = 0.147) suggest that the null hypothesis, ‘no small-study effects’, was not rejected. Following, we employed White’s heteroskedastic consistent estimator to correct for a potential heteroscedasticity problem. As we noted earlier, in the presence of a significant number of studies that reported more than one TE estimates using the same data set, the values of the outcome variables across the observations may not be independent. Our investigation showed that no study reported more than three TE estimates in our data set.
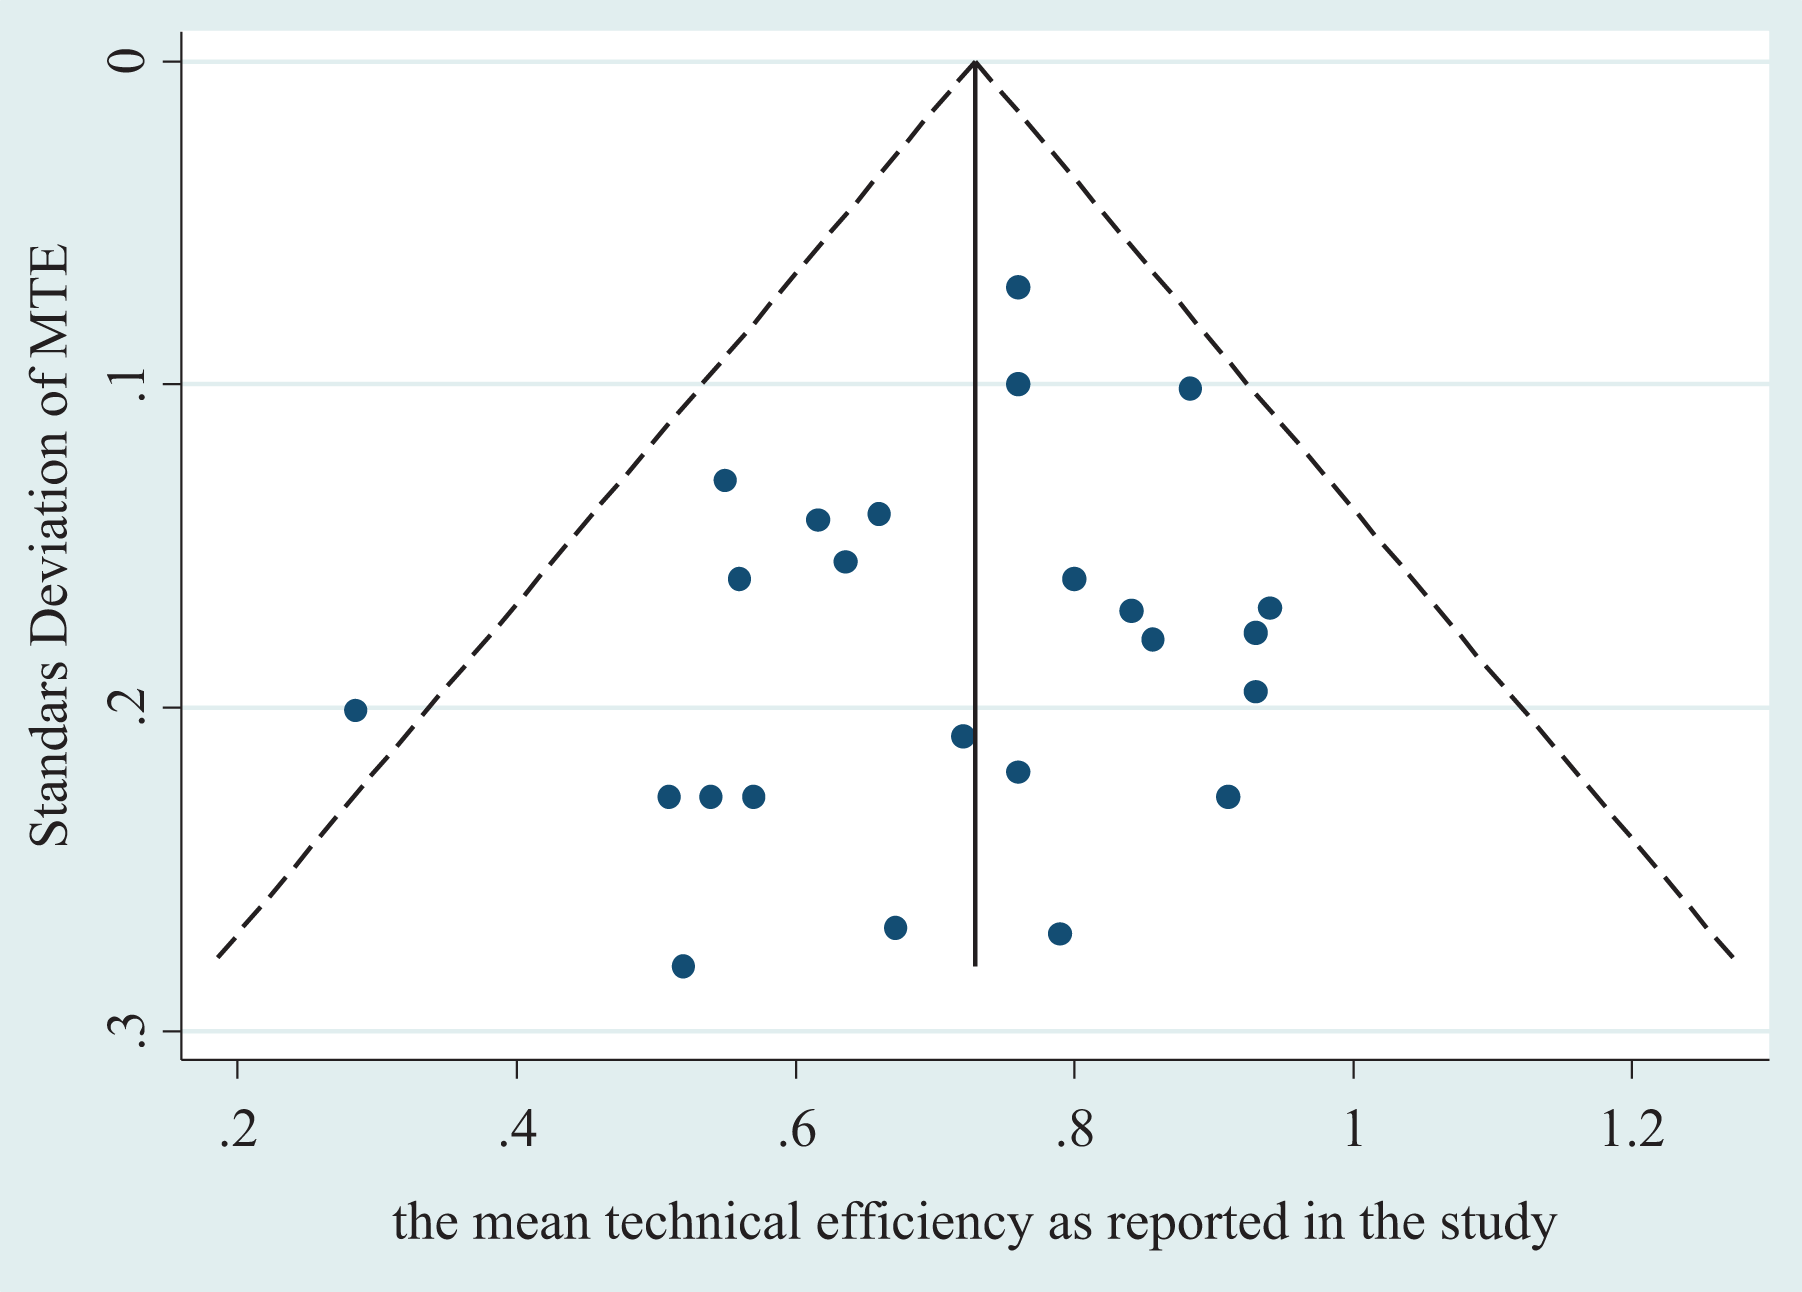
Funnel plot of MTE versus standard deviation. MTE: mean technical efficiency.
The influence of study-specific attributes on MTE estimates
Following, we ran a meta-regression model of equations (2) and (3) to investigate the influence of study specific attributes on TE estimates. The first half of Table 2 presents the results of the fractional outcome regression when the agro-ecological variations were not controlled (Model I), while the second half of the table presents the fractional outcome regression results when the agro-ecological variations were controlled (Model II). Before we ran our final models, we checked whether some of the predictor variables with low observations (e.g. Wurch, Kur) could have any influence on the regression outcomes. As a further analysis, we excluded the two regions with low observations from the data set and re-ran the same model (in equation (3)). Our results show that the inclusion or exclusion of the regions with small samples yields similar estimates of the coefficients of our meta-regression models. The results of the supplementary analysis are available from the authors upon request.
The positive and statistically significant coefficient of Dimension in Model I revealed that the MTE estimates from the studies significantly varied as the model dimensions varied. The positive sign of the coefficient suggested that studies that had a large model dimension (the ratio between some variables and the sample size) tended to estimate higher TE scores. However, the insignificant results for Dimension in Model II suggested that the MTE estimates from primary studies varied as the model dimensions differed only when agro-ecological differences were not controlled for.
The negative coefficient for Translog indicated that studies that employed the flexible translog functional form reported lower MTE scores than studies with other functional forms. However, the fact that this variable was insignificant in Model I indicated that differences in functional form did not explain the variations in MTE estimates unless agro-ecological variation was considered. Similarly, the negative and statistically significant coefficient corresponding to Parametric indicated that studies that used parametric frontier models generated significantly different TE scores than studies employing non-parametric models.
Similarly, the significant result related to the technology representation coefficient (Primal) indicated that studies that assumed primal technology representation estimated significantly large MTE scores when agro-ecological variation was not considered. The negligible parameter estimate for OneStage in Models I and II suggested that studies that used a single-stage estimation procedure did not generate different MTE scores than studies that used a two-stage estimation, regardless of the agro-ecological conditions.
The insignificant parameter estimates for the two distributional assumptions (i.e. D_HalfNormal and D_Truncated) suggest that, regardless of the agro-ecological conditions, the assumptions made about the inefficiency term did not account for significant variations in the estimated TE score.
Statistically significant and positive parameter estimate for Journal indicate that studies published in scientific journals reported significantly higher MTE estimates. The positive and significant parameter estimates for the three variables representing output aggregations revealed that, in similar agro-ecologies, studies that used an aggregate crop output reported higher MTE scores than studies that used a single output.
The trend and major drivers of efficiency in crop production over time
To investigate whether there has been development in reported crop efficiency scores over the period 1991-2015 in Ethiopia, we re-ran our meta-regression model (specified in equations (2) and (3)). Here, the year of the data was the variable of interest, while study attributes previously used in the meta-regression were used as control variables. As shown in Figure 4, there was a positive relationship between MTE scores and year of survey. However, as the regression result presented in Table 3 shows, the relationship was statistically insignificant for both specifications (i.e., with and without accounting for agro-ecological variation). This suggested that reported MTE scores had not significantly increased over time.
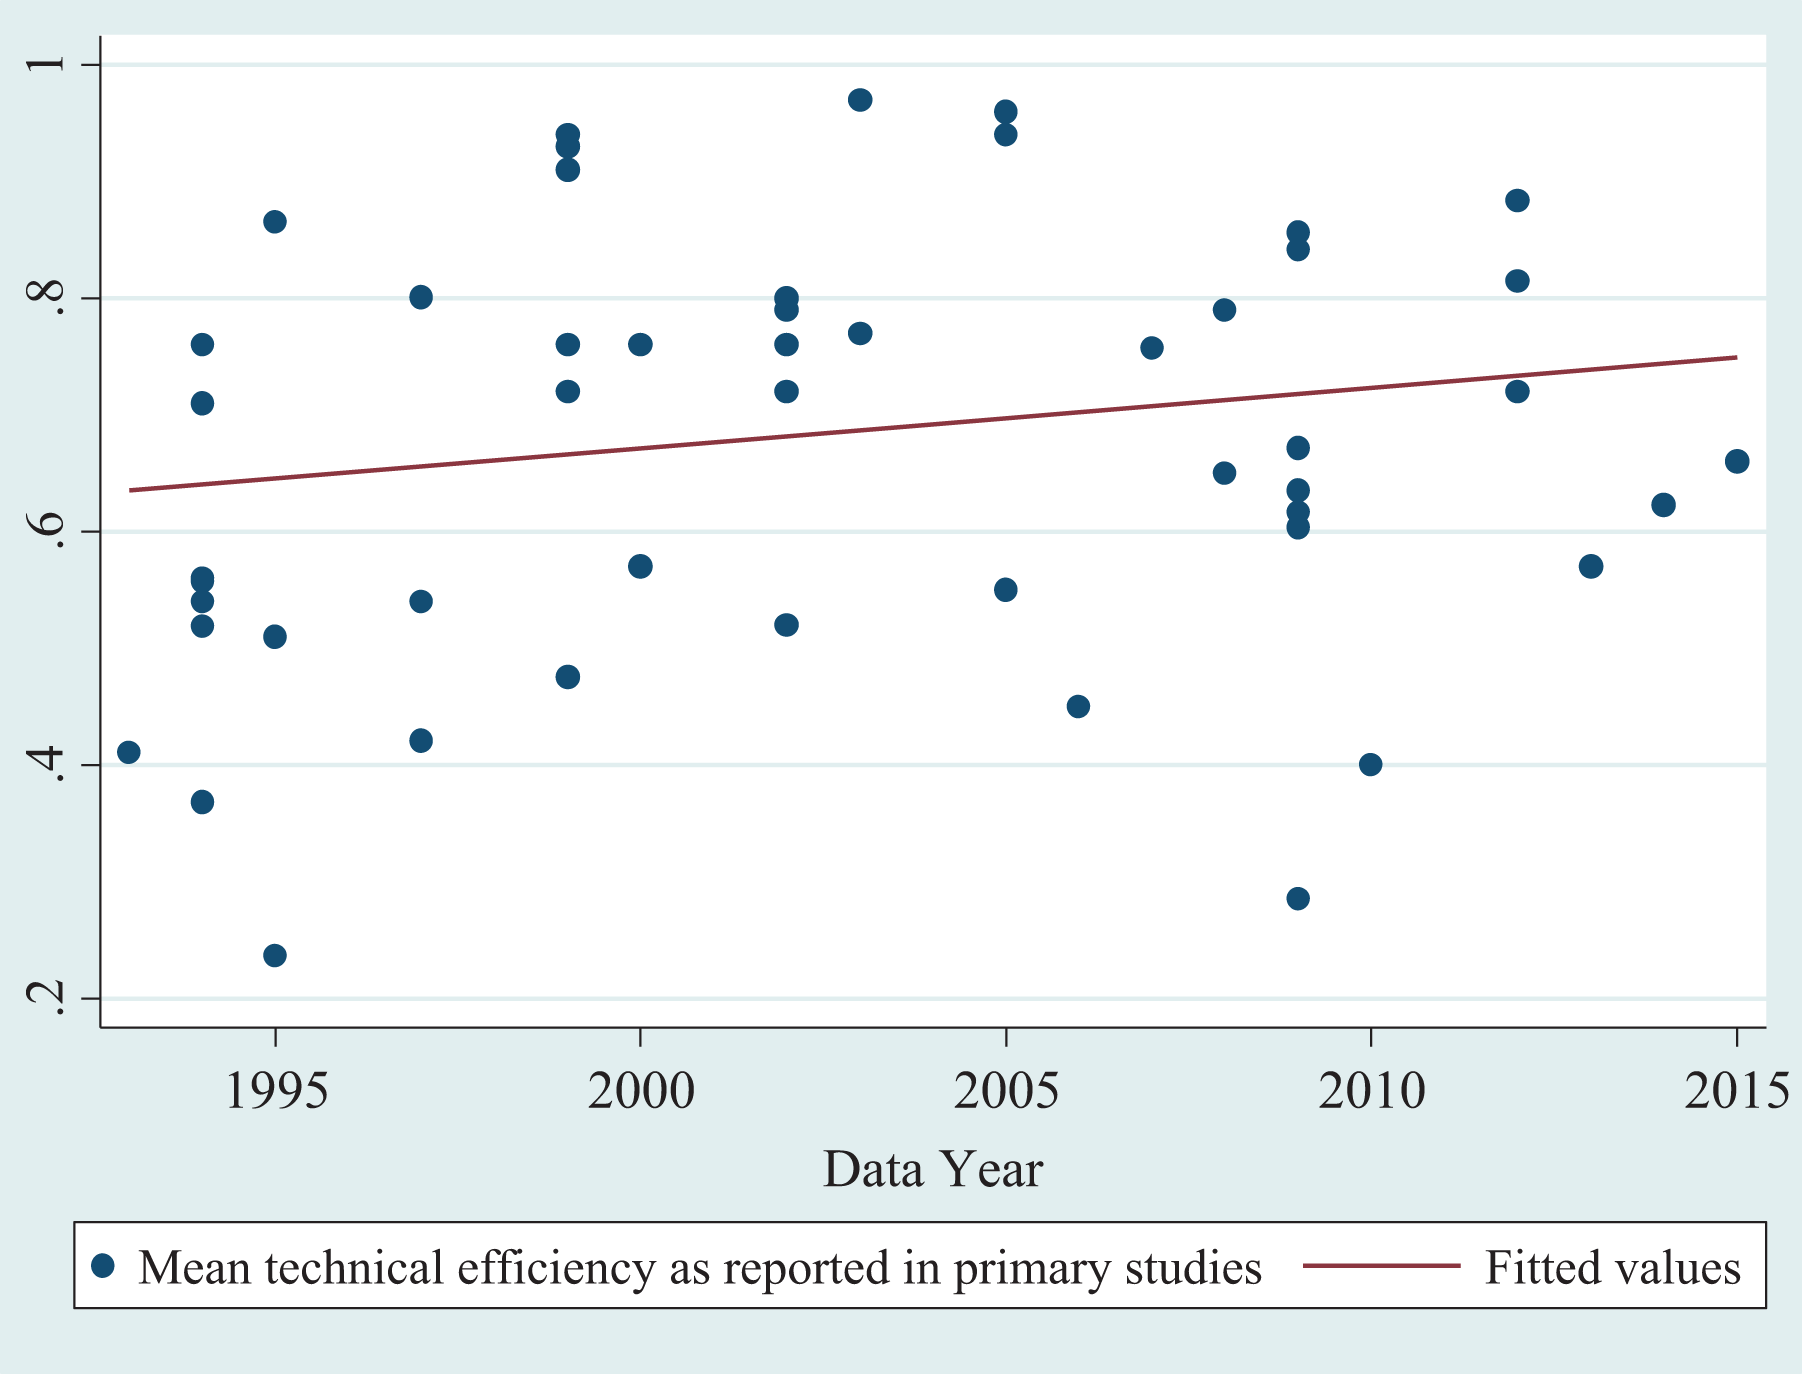
Scatter plot of the relationship between the MTE estimates and year of survey. MTE: mean technical efficiency.
Meta-regression results with a year of data, fractional outcome regression.a

aThe values reported in parentheses are robust standard errors.
b p < 0.01.
c p < 0.05.
d p < 0.1.
Finally, we explored empirical studies that reported the determinants of TE in crop production in Ethiopia to identify the key drivers of efficiency. We identified approximately 40 different variables that were used in the reviewed studies. The distributions of the ten most frequently used variables is given in Figure 5. As Figure 5 shows, education, credit, access to extension services, access to the market, cooperative membership, family size and farm size were most frequently reported to be the statistically significant determinants of TE. Although the age of the farmer is often considered to be a proxy for farming experience, the vast majority (78%) of studies that used age in their inefficiency modelling reported an insignificant age effect. This may be attributed to the fact that the studies did not consider the diminishing effects of age in their modelling. Less than 10% of reviewed studies used the squared term of the age of the household head to control for the diminishing effects of age.
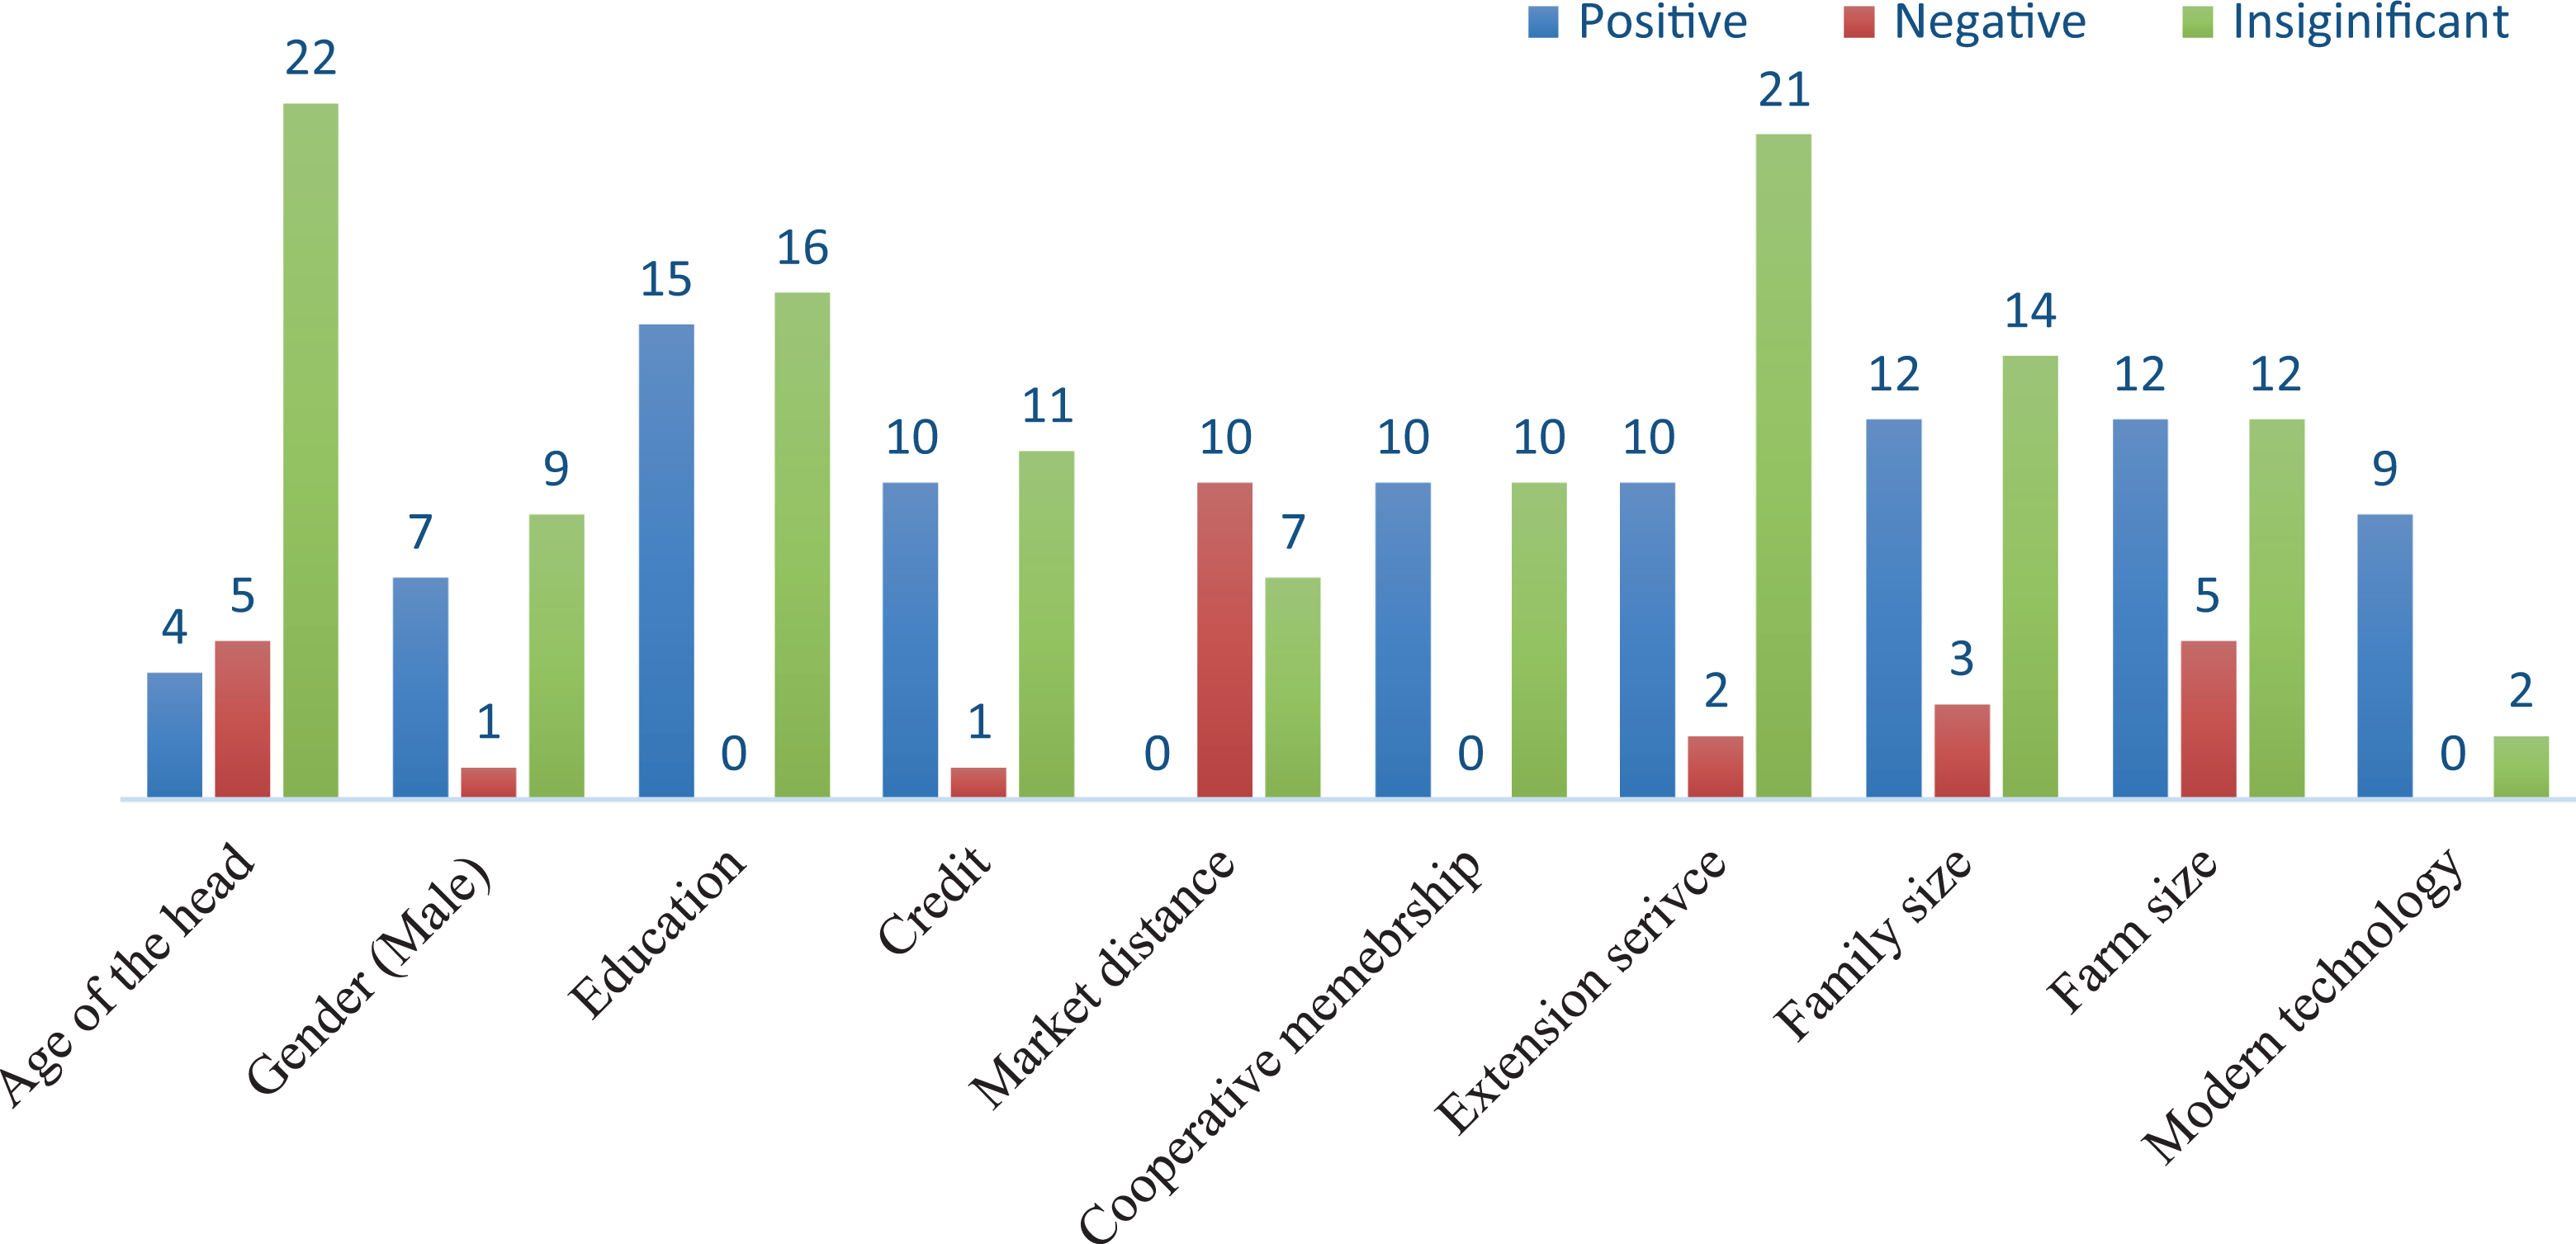
Distribution of variables used as determinants of TE. TE: technical efficiency.
Almost all reviewed studies hypothesized education as a determinant of TE. However, only approximately 50% reported that education had a statistically significant positive effect on TE. About 22 studies hypothesized access to financial credit as a determinant of TE, and approximately 50% reported a positive effect, while one study reported a negative influence of credit on TE. Approximately 60% of the studies that measured access to the market, measured in terms of walking minutes from the farm, reported that market access had a significant effect on TE.
Discussion
This article investigates the causes of variations in efficiency in crop sub-sector of Ethiopia and assesses whether study-specific attributes account for systematic differences in reported MTE scores. We found systematic variations in estimated MTE across study-specific attributes. However, some study attributes such as functional form and model dimension did not account for systematic variation in estimated TE unless the studies were conducted in different agro-ecologies. This confirmed that frontier models are less sensitive to model dimensionality if the empirical analysis considers agro-ecological variations. We found studies that employed the flexible translog functional form estimated lower MTE scores than studies that used other functional forms. However, differences in functional form did not explain the variations in MTE estimates unless agro-ecological variation was considered.
We found that studies that employed parametric frontier models generated significantly different MTE scores than studies employing non-parametric models. This finding did not accord with our a priori expectation that MTE scores from non-parametric models, which assume all deviations from the frontier are technical inefficiencies, would be lower. However, this finding was consistent with other cross-country meta-studies, such as Thiam et al. (2001) and Bravo-Ureta et al. (2007). This finding is in contrast to empirical studies (e.g., Haji, 2007) claiming that parametric and non-parametric methods yield similar TE estimates.
Consistent with previous findings from meta-studies on efficiency studies from developing countries such as that by Thiam et al. (2001), we found a significant influence of assumption on the technology representation of the frontier function. However, this finding was not consistent with previous findings from meta-studies in the African context. Ogundari (2014), for example, found insignificant effects of technology representation on TE variation across studies.
The results for the three variables representing the output aggregations indicated that aggregating crop outputs biases TE estimates. This could be because when multiple outputs are aggregated there is a possibility of ignoring variations in land characteristics (e.g., land fertility, slope and plot size) across various farms. Further, because aggregation is often made possible by converting outputs into monetary values, failure to account for inflation may distort TE estimates.
Besides the methodological approaches and the assumptions imposed on the frontier estimations, we found that publication outlet accounts for systematic variations in reported MTE estimates. This finding was consistent with the findings of Ogundari (2014) from a meta-analysis of African agriculture. We confirmed that studies published in journals that have an impact factor reported significantly lower MTE estimates. Different from the finding of Ogundari (2014), we had shown that this held true only when the studies were conducted in similar agro-ecological conditions.
Other results demonstrated that education, access to credit, access to extension services, access to the market, cooperative membership, family size and farm size had been the key drivers of the efficiency of the crop sub-sector of Ethiopia over the past two decades. These results support the theoretical predictions of the positive role of rural institutions and improvement in resource endowments, such as human capital (Becker, 1964). These findings were consistent with previous meta-studies from Africa (e.g., Ogundari, 2014; Ogundari et al., 2012) and studies from other developing countries, such as Thiam et al. (2001) and Bravo-Ureta et al. (2007). However, the insignificant effect of survey year did not accord with our a priori expectation that the TE in Ethiopian agriculture has increased over time. This result was inconsistent with previous cross-country meta-studies in Africa (see Ogundari, 2014).
While we acknowledge that our findings have been established in the efficiency literature on African agriculture, our results are more or less consistent with the findings of similar studies from other countries (see Bravo-Ureta et al., 2007; Fatima and Yasmin, 2016; Moreira López and Bravo-Ureta, 2009; Thiam et al., 2001). Our finding confirming the sensitivity of frontier models to model dimensionality is in agreement with the finding of studies exclusively focusing on the farm efficiency studies from developing countries (see, for, example Thiam et al., 2001). Our finding on the influence of model dimensionality supports the arguments of Thiam et al. (2001) about the sensitivity of frontier models to model dimensionality. However, we argue that frontier models are less sensitive to model dimensionality if the empirical analysis considers agro-ecological variations. Although our finding did not accord with empirical studies from Africa claiming that parametric and non-parametric methods yield similar TE estimates (see Haji, 2007), the finding that efficiency scores significantly differ between these models was consistent with other cross-country meta-studies, such as Thiam et al. (2001); Bravo-Ureta et al. (2007); and Moreira López and Bravo-Ureta (2009). Our findings also support the findings from studies focusing on sub-sectors. Conducting a partial analysis of Pakistan’s crop sub-sector, Fatima and Yasmin (2016) argued that variations in efficiency are majorly attributed to the selection of functional form in modelling crop production. Similarly, using a meta-regression for dairy sector in English and Spanish countries, Moreira López and Bravo-Ureta (2009) revealed that model dimension, functional form, output aggregation and technology representation account for systematic variations in reported efficiency scores.
Conclusion
This article investigated the causes of variation in efficiency in crop production in Ethiopia using meta-regression analyses. Fractional outcome regression results revealed that MTE estimates varied substantially across studies and agro-ecologies. Our findings suggest that variations in the number of the variables used in frontier function estimation and model dimensionality are worth considering when estimating TE only if studies involve different agro-ecologies. Our finding for the selection of functional form indicate that the selection of functional form for empirical efficiency studies on crop production should be made with caution when the study involves different agro-ecologies. The results for the three variables representing output aggregations indicated that aggregating crop outputs might bias TE estimates unless the studies are conducted in similar agro-ecologies.
Overall, these findings have policy implications for enhancing food security by reducing inefficiency in crop production in Ethiopia and other comparable developing countries. The reported efficiency estimates are sensitive to variation in agro-ecologies. Thus, we recommend that future efficiency analyses need to account for agro-ecological variations. The results for some attributes were not consistent with previous cross-country meta-studies. This indicated a cross-country evidence might not hold true for countries with diverse agro-ecologies and different farming systems. This suggests that it may not be appropriate to adopt similar development strategies and policy interventions in countries with differing agro-ecologies. Therefore, it is worth considering differences in agro-ecologies and farming systems in particular countries in empirical modelling of farm efficiency. Further, the potential role of the smallholder crop sub-sector in reducing poverty and food insecurity requires policy actions aligned with the identified drivers of efficiency in crop production.
Despite the fact that our results could help gain insight into the influence of study-specific attributes important for modelling efficiency in crop production, two limitations worth noting in this study. First, the study was based on efficiency estimates from cross-sectional studies. Although it is also possible to categorize frontier studies according to the type of data used (cross-section or panel data studies), this was not possible because we found a limited number of studies that used panel data in the Ethiopian crop sub-sector. Second, we used very small observations for some agro-ecologies because a very limited number of studies have been conducted in those regions. Although the inclusion or exclusion of the regions with small samples in our analysis yield similar estimates, future research taking a broader set of studies might ensure the generalizability of our empirical findings.
Footnotes
Declaration of conflicting interests
The author(s) declared no potential conflicts of interest with respect to the research, authorship, and/or publication of this article.
Funding
The author(s) received no financial support for the research, authorship, and/or publication of this article.