



Abstract
Efficient agricultural markets can be a bedrock for diverse economy-wide benefits ranging from improvements in resource use to price stabilisation. However, as is the case with most developing and agrarian countries, Malawi's agricultural markets are still developing. This is mainly the case in the country's legume markets, especially the bean marketing system. The current study assessed the market efficiency of common bean traders in Malawi using a multiple linear regression model. By focusing on the bean traders in the major markets in Malawi, the study departs from earlier research on bean marketing, which has placed greater emphasis on the farmer. The findings reveal that traders in bean markets mostly use informal sources of market information. Again, transaction costs such as transportation, storage, handling and distance to sources of bean reduce marketing efficiency. The scale of the operation portrayed a positive influence on marketing efficiency. Access to credit significantly increased marketing efficiency for both wholesalers and retailers. In addition, markets that are located in rural areas had a negative effect on marketing efficiency as compared to markets in urban areas, further agreeing with the focus of the National Agriculture Policy (NAP) to introduce structured markets in rural areas. The study recommends adjustments in policies in the NAP that would promote smooth access to reliable market information, especially in rural areas. The upgrading of the rural road system and warehousing facilities should be promoted in order to lower transaction costs. This will enable bean traders to expand their operations on a larger scale while also lowering expenses and increasing profits.
Introduction
In agrarian economies, the efficient functioning of agricultural markets has invaluable implications for the use and distribution of resources countrywide (Frimpong et al., 2015). Ideally, efficiency in agricultural marketing is pivotal in facilitating the efficient flow of factors of production, curbing price volatilities and ultimately improving the general welfare of the population, inter alia (Frimpong et al., 2015). However, the development of efficient markets is a major challenge in many countries in sub-Saharan Africa (SSA), including Malawi (Jones and Gibbon, 2011). Malawi, an economy whose main thrust is agriculture, generally operates in an environment where her agricultural marketing systems are unreliable and rudimental (JICA, 2021). Despite this, the country's agricultural environment is rife with crops that contain great market potential locally and internationally. One such crop is the common bean.
Common bean (Phaseolus vulgaris L.) is known to offer multiple benefits including human health, livelihoods and sustainable farming systems (Mapemba et al., 2019). In human health, the common bean is a significant and affordable source of dietary energy, fibre, protein and vitamins, calcium and zinc (CIAT et al., 2013; FAO, 2018; Sichilima et al., 2016). The blend of nutrients from the consumption of bean is essential for improved nutrition outcomes, particularly for consumers who are unable to afford animal-sourced nutrients (CIAT et al., 2013). Therefore, to a degree, the common bean is a valuable resource in hunger and food security considerations of many countries (Tumeo et al., 2017).
Globally, bean is the most important food legume, coming only second to groundnuts in some parts of the world atlas (Farrow and Muthoni-Andriatsitohaina, 2020; Mtumbuka et al., 2014). In SSA, common bean is a staple food for over 200 million people (Farrow and Muthoni-Andriatsitohaina, 2020). Over the past three decades, there has generally been an increase in the global and regional production of common bean due to an increase in the demand for the crop owing largely to population increase in most parts of the globe (Sichilima et al., 2016; Tebeka et al., 2017). The global area under common bean cultivation has expanded from 14.3 million ha in 1998 (Wortmann et al., 1998) to 33.1 million ha in 2019 (Azhar et al., 2021). Similarly, global bean yield has increased in this period from 11.6 to 28.9 million tons (Azhar et al., 2021).
Africa has also seen general improvements in bean production, as reflected in an increase in area under bean cultivation and higher bean yields (Farrow and Muthoni-Andriatsitohaina, 2020). In 2020, the common bean was cultivated on 7 million ha on the African continent (Farrow and Muthoni-Andriatsitohaina, 2020). In contrast, bean was only produced on 3.2 million ha in 1998 (Wortmann et al., 1998). Similar improvements have been reported for Southern Africa. Only 518,000 ha were allocated to bean production in 1998 while in 2020, bean was produced in an area covering a little over a million ha (Farrow and Muthoni-Andriatsitohaina, 2020). The main drivers of the increase in bean production, especially in Africa, are identified as increased consumer demand, intensification of bean production, good agronomic practices and the adoption of improved varieties (Birachi, 2012; Sichilima et al., 2016). Although the world has reported a general upward trend in bean production, it is noteworthy that some areas of the world such as eastern and southern Africa have experienced fluctuations in bean production over the years. These fluctuations have been attributed to extreme weather, infestation of pests, lack of institutional support and poor linkages to bean markets (Farrow and Muthoni-Andriatsitohaina, 2020; Nkhata et al., 2021; Tebeka et al., 2017). These drawbacks have frustrated efforts to develop the bean subsector to a point where production is sometimes unable to meet local and international demand.
Benefits of the bean crop transcend the promotion of human health (Akibode and Maredia, 2012). The crop is a significant source of income for all players in its value chain (Farrow and Muthoni-Andriatsitohaina, 2020). Further, the crop is convenient for small-scale, resource-poor producers due to its ability to use less labour and land resources during production. For instance, in Africa, the crop is usually grown in intercropped cropping patterns (Latati et al., 2016 as cited in Nkhata et al., 2021). Their production can, therefore, strive in areas with limited land resources. In addition, bean production in SSA is largely done by smallholder famers who make use of family labour, thereby, making bean a labour saving crop (Birachi, 2012). The foregoing, coupled with their natural ability to fix nitrogen make common bean a key player in improving the quality of crop production systems (CIAT et al., 2013; Nassary et al., 2020).
In Malawi, while bean production has increased over the years, albeit occasional fluctuations, its production is still relatively low and below potential relative to consumer demand locally and internationally (Magreta and Jambo, 2012; Mtumbuka et al., 2014). Recently, Malawi produced a yearly average of 152,000 tons of bean, harvested over approximately 350, 000 ha of land translating to a national average grain yield of 500 kg/ha (FAO, 2018). In 2010, Malawi bean production was over 228, 880 2010 ha (CIAT et al., 2013) with an annual mean yield of 106,219 tons in 2010 (Nkhata et al., 2021). The majority of bean producers in Malawi are smallholder farmers who grow the crop in cereal–legume intercropping or mixed cropping systems (Birachi, 2012).
Despite decades of bean production in Malawi, the participation of the crop in local and international markets is still in its infancy. Policy and institutional efforts linked to the bean subsector have largely focused on enhancing bean production and productivity (Magreta and Jambo, 2012). Such efforts have emphasised the development of new varieties associated with disease resistance, drought tolerance, early maturity and high yields (Birachi, 2012). Although these efforts have led to a substantial increase in bean production adequate for consumption with surplus for sale, little information is available regarding the performance of bean marketing in Malawi (Birachi, 2012). Current and projected increases in local and international demand for bean (Birachi, 2012; Magreta and Jambo, 2012) necessitate that the country's efforts cater to bean production but even more so, to understanding the dynamics of marketing of the crop so as to harness its market potential.
Malawi developed the National Agriculture Policy (NAP) in 2016 in order to provide a clear and comprehensive guidance in the nation's agricultural sector. The country has in recent years made tremendous efforts in ensuring the linkage between agricultural production and marketing of agricultural products. These efforts stem from market liberalisation, development of rural markets, enhancement of market information systems and the establishment of agricultural commodity exchange markets (Chitete et al., 2021). Nonetheless, agricultural commodities in Malawi still face inefficient marketing systems, and in some instances, missing markets persist, mostly in remote areas (GoM, 2016). This has mainly been the case for legume crops, especially bean. As such, the 2016 Agricultural National Policy (NAP) was set out (as one of its main objectives) to facilitate the creation of structured markets, especially in legumes. However, to ensure that legume markets are efficient, there remains a need to understand the determinants of legume market efficiency, particularly the most consumed legume crop. The NAP recognises that the focus on tobacco as the country's main cash crop has resulted in inadequate provision of infrastructure in legume markets, which coupled with policy incoherencies has mainly affected legume marketing. This later on affects farmer participation in legume value chains (GoM, 2016). To incentivise farmer participation in legume markets, studies that assess the legume markets with an emphasis on understanding the drivers of market efficiency are imperative in the design and implementation of policies that aids the functioning of the NAP. The bean marketing system in Malawi is largely informal and disorganised (Birachi, 2012). The market has neither enforceable standards nor specific bean policies to guide local trade (Birachi, 2012). Small-scale informal private traders (vendors) dominate the Malawian bean market both in rural and in urban markets. Vendors play a significant role in bridging bean production points and consumption points. Vendors usually travel long distances to production points in search of bean whose next destination is urban markets – the biggest ‘demanders’ of the commodity.
Scholarship on agricultural markets in Africa has identified several key factors that affect the performance of bean marketing system. These factors include consumer demand, price, market location and grain characteristics and access to finance (Birachi, 2012; Sichilima et al., 2016). Consumer demand is one of the most important drivers of the bean market through its ability to affect prices (Sichilima et al., 2016). The price of bean has implications on the quantity traded among producers, traders and consumers (Sichilima et al., 2016). The location of the bean market is a key determinant of the transportation costs, storage costs, handling costs, prices and level of demand from the consumers (Sichilima et al., 2016). Further, grain characteristics such as size, colour and general quality of the grain have an impact on the quantity of bean demanded as well as costs incurred in sorting and grading the commodity (Sichilima et al., 2016). Access to finance is another important factor in bean marketing because it impacts on quantity available on the market and demand decisions from consumers (Birachi, 2012). Despite the existence of literature on bean marketing efficiency in some parts of Africa as demonstrated above, little research has been carried out to understand the bean trading environment in Malawi and the key drivers of the efficiency of the bean marketing system.
Therefore, this paper aims at identifying factors that shape the bean marketing system in Malawi, particularly, factors that affect bean marketing efficiency from a trader's perspective. Understanding these factors and addressing how these factors affect bean marketing dynamics (through policy formulation) has the potential for improving bean market performance at national and international markets leading to better incomes and livelihoods for players in the value chain. The current study will hence contribute to literature in at least three relevant ways. Firstly, it will contribute to the growing yet small literature on legume market systems in developing countries including Malawi, providing more insights on possible policy directions crucial in improving the market efficiency of legumes in Malawi. Secondly, it will provide an evidence base of the constraints in marketing of legumes or bean, which are relevant in designing market infrastructure that foster bean or legume marketing in the country. Lastly, the study will change the direction of policy attention, as most interventions in the agricultural value chains in Malawi have been focusing much on farmers only (Magreta and Jambo, 2012; Mtumbuka et al., 2014; Mapemba et al., 2019), leaving out traders who are equally very pivotal in the agricultural value chains.
Materials and methods
Data sources
Lilongwe is a district and the capital city of Malawi located in central region. It covers an area of 6159 square kilometres. It is located 1050 meters above sea level with temperature ranging between 18°C and 24°C. Approximately, the district has 1,346,360 people. Lilongwe is one of the districts that in most cases registers high bean production and consumption.
Multistage sampling technique was employed to sample bean traders. A list of bean traders in Lilongwe district was obtained from Grain Legume Traders Association (GALA). These are the traders who have been registered under GALA. We opted for bean traders registered under GALA to avoid opportunistic traders who switch between business ventures. Mendoza (1995) and Ayieko et al. (2014) report that there is no agreed technique for sampling traders as most traders in agricultural commodities are seasonal. Agricultural traders usually switch between business ventures because most agricultural businesses depend on season. Thus, it becomes difficult to characterise the market of bean if we involve such categories of traders. This is why a list of permanent bean traders was obtained from GALA. The study, therefore, included only those traders who have been in bean business for a long time. There are 673 bean traders registered under GALA in Lilongwe district. GALA provided a list of markets where these registered traders would be found. Simple random sampling technique was used to select 18 markets. These markets included Mitundu, Kamphata, Nanjili, Nathenje and Malingunde in rural areas; and Nsungwi, Area 18, Mgona, Wakawaka, Chinsapo, Area 23, Lizulu, Area 25, Area 24, Area 36, Kaphiri and Mchesi in Lilongwe urban. These markets are shown in Figure 1. A sample of 316 bean traders was therefore generated. In each market, a simple random method was employed to select traders for interview. Key informant interviews with larger traders and associations were conducted to help explain results from quantitative data.
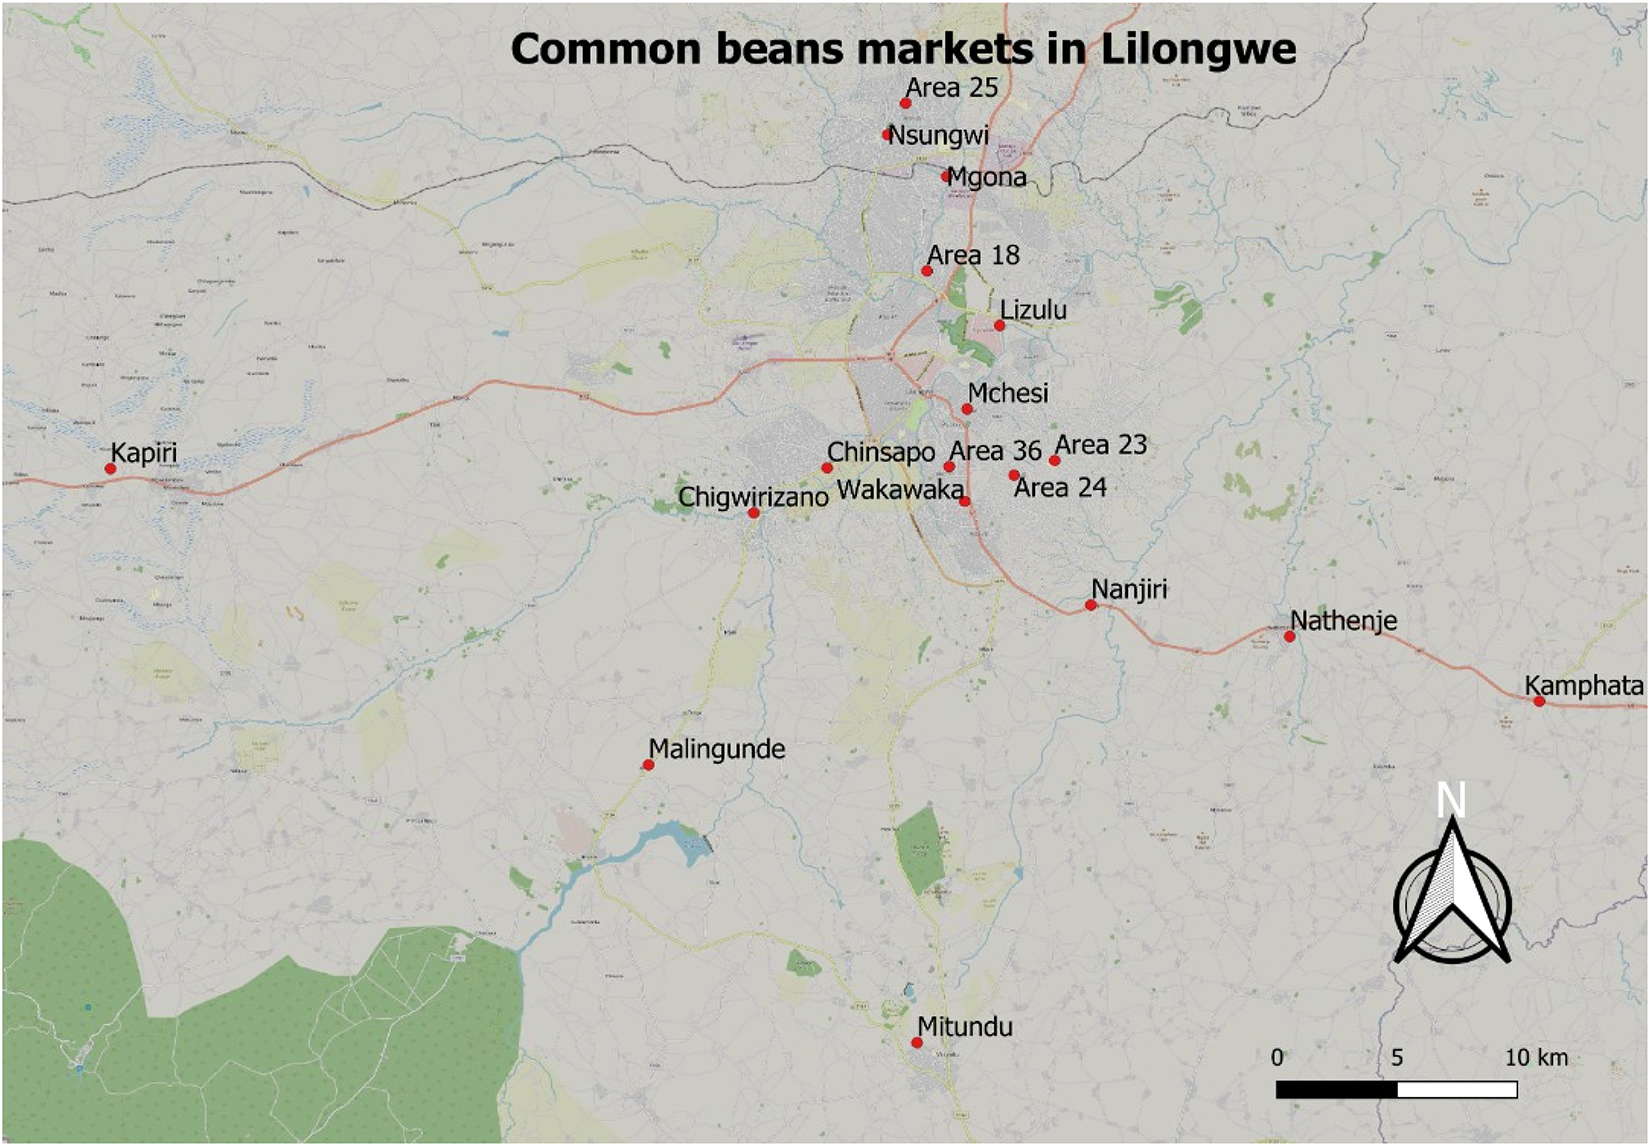
Map showing common bean markets sampled in Lilongwe district, Malawi.
Theoretical framework
Profit maximisation under transaction costs
The current study uses profit maximisation theory in the context of transaction costs. Traders’ decisions to participate in bean trading are influenced by profit realised in the said trade. In order to make profits, total costs are removed from total revenues. Consider a trader who is engaged in a transaction i in market j, a trader faces Proportional transaction Costs


Furthermore, the trader selling at market j faces fixed transaction costs, which according to Key et al. (2000) are costs that are invariant to quantity handled by the trader. In this case, FTC is denoted by
The trader, therefore, chooses to sell

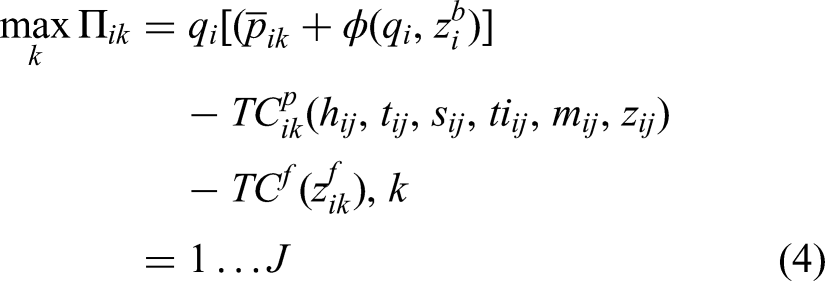
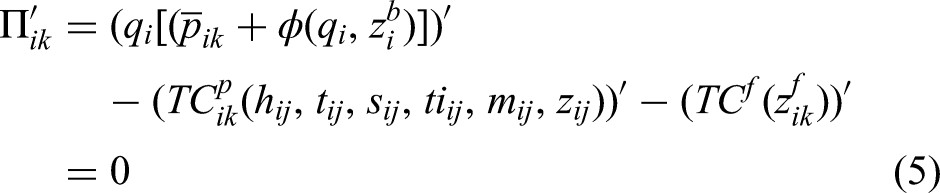


Empirical model
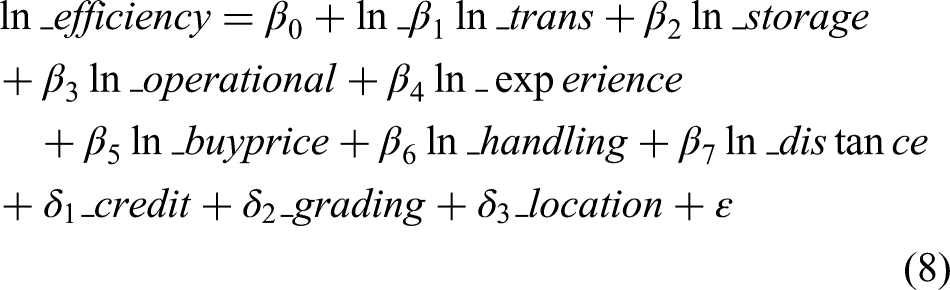
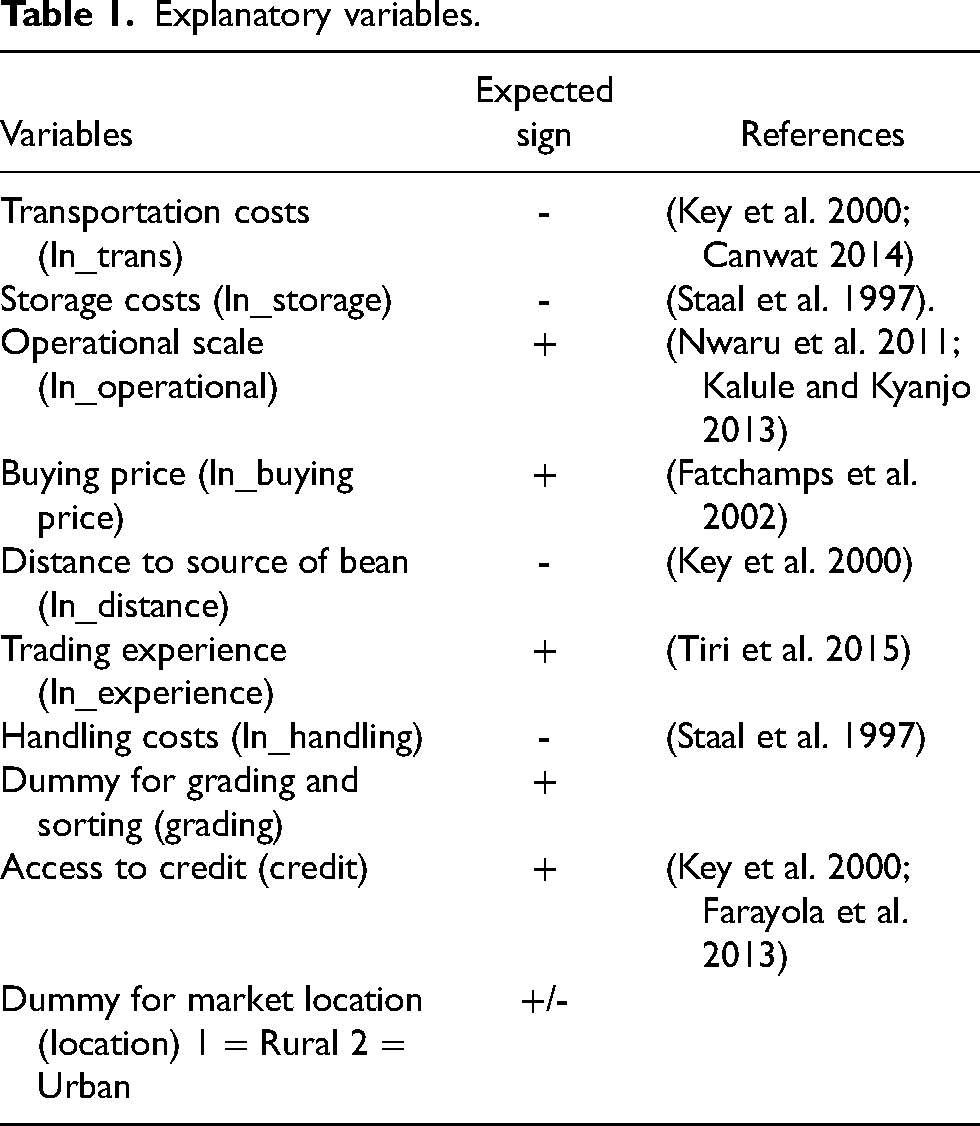
The main aim of this study centred on characterising the bean marketing system by evaluating the efficiency of common bean traders. In this regard, a multiple linear regression model was used to determine the effects of transaction costs and other factors on bean market performance. Marketing efficiency was used as a proxy variable for market performance. Following Shepherd (1965), marketing efficiency was calculated and used as a dependent variable in the following multiple linear regression model. Table 1 summarises independent and dependent variables and their expected signs.
Explanatory variables.
Results
Descriptive statistics
Table 2 summarises demographic characteristics of common bean traders who participated in the interviews. The results of the study show that out of 316 traders who participated in the interview, 48% had attained secondary education and 44% attained primary education. Very few traders attained tertiary education. It should further be observed that over 80% of traders sampled were married, followed by a 10% of traders who reported that they have never been married. A high percentage of traders indicated that agriculture trading was their main occupation. The results further show that over 60% of traders reported that small-scale business is their main occupation. It has been further observed that 17% rely on farming as their main occupation. These are traders who mostly operate in rural areas. The results further show that 88% of sampled traders have not received any form of business management training.
Descriptive statistics.
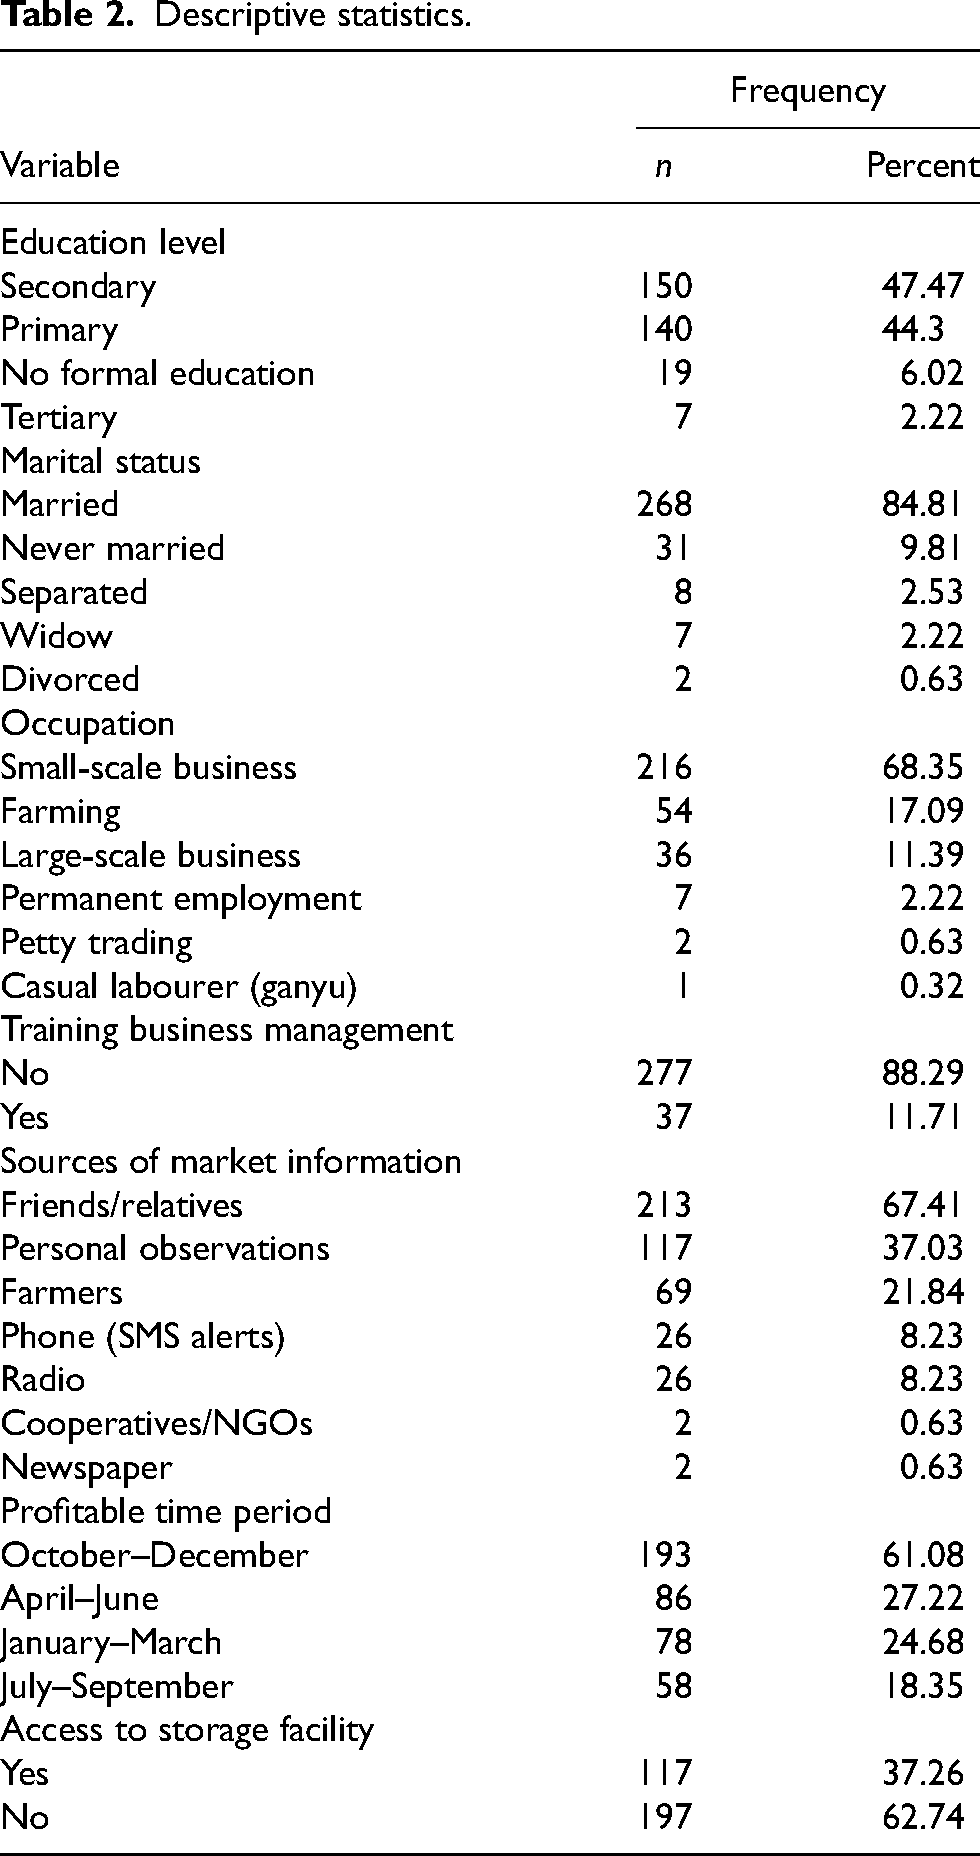
It has been further noted that most traders (67%) received information on market dynamics through friends or relatives. Highly educated traders would prefer to use advanced sources of market information such as newspapers, radio, SMS alerts, television and internet. This might be one of the reasons why a majority of traders in this study used friends and relatives as their major source of market information.
The results in Table 2 further show that 61% of bean traders find it profitable to sell starting from the month of October–December. These are the months when bean become scarce and they attract high prices. It has been observed in Table 2 that only 37% of traders had access to storage facilities. This shows that most traders do not have access to storage facilities. It can further be observed from Table 2 that only 11% of traders have attended any business management training.
Summary of transaction costs
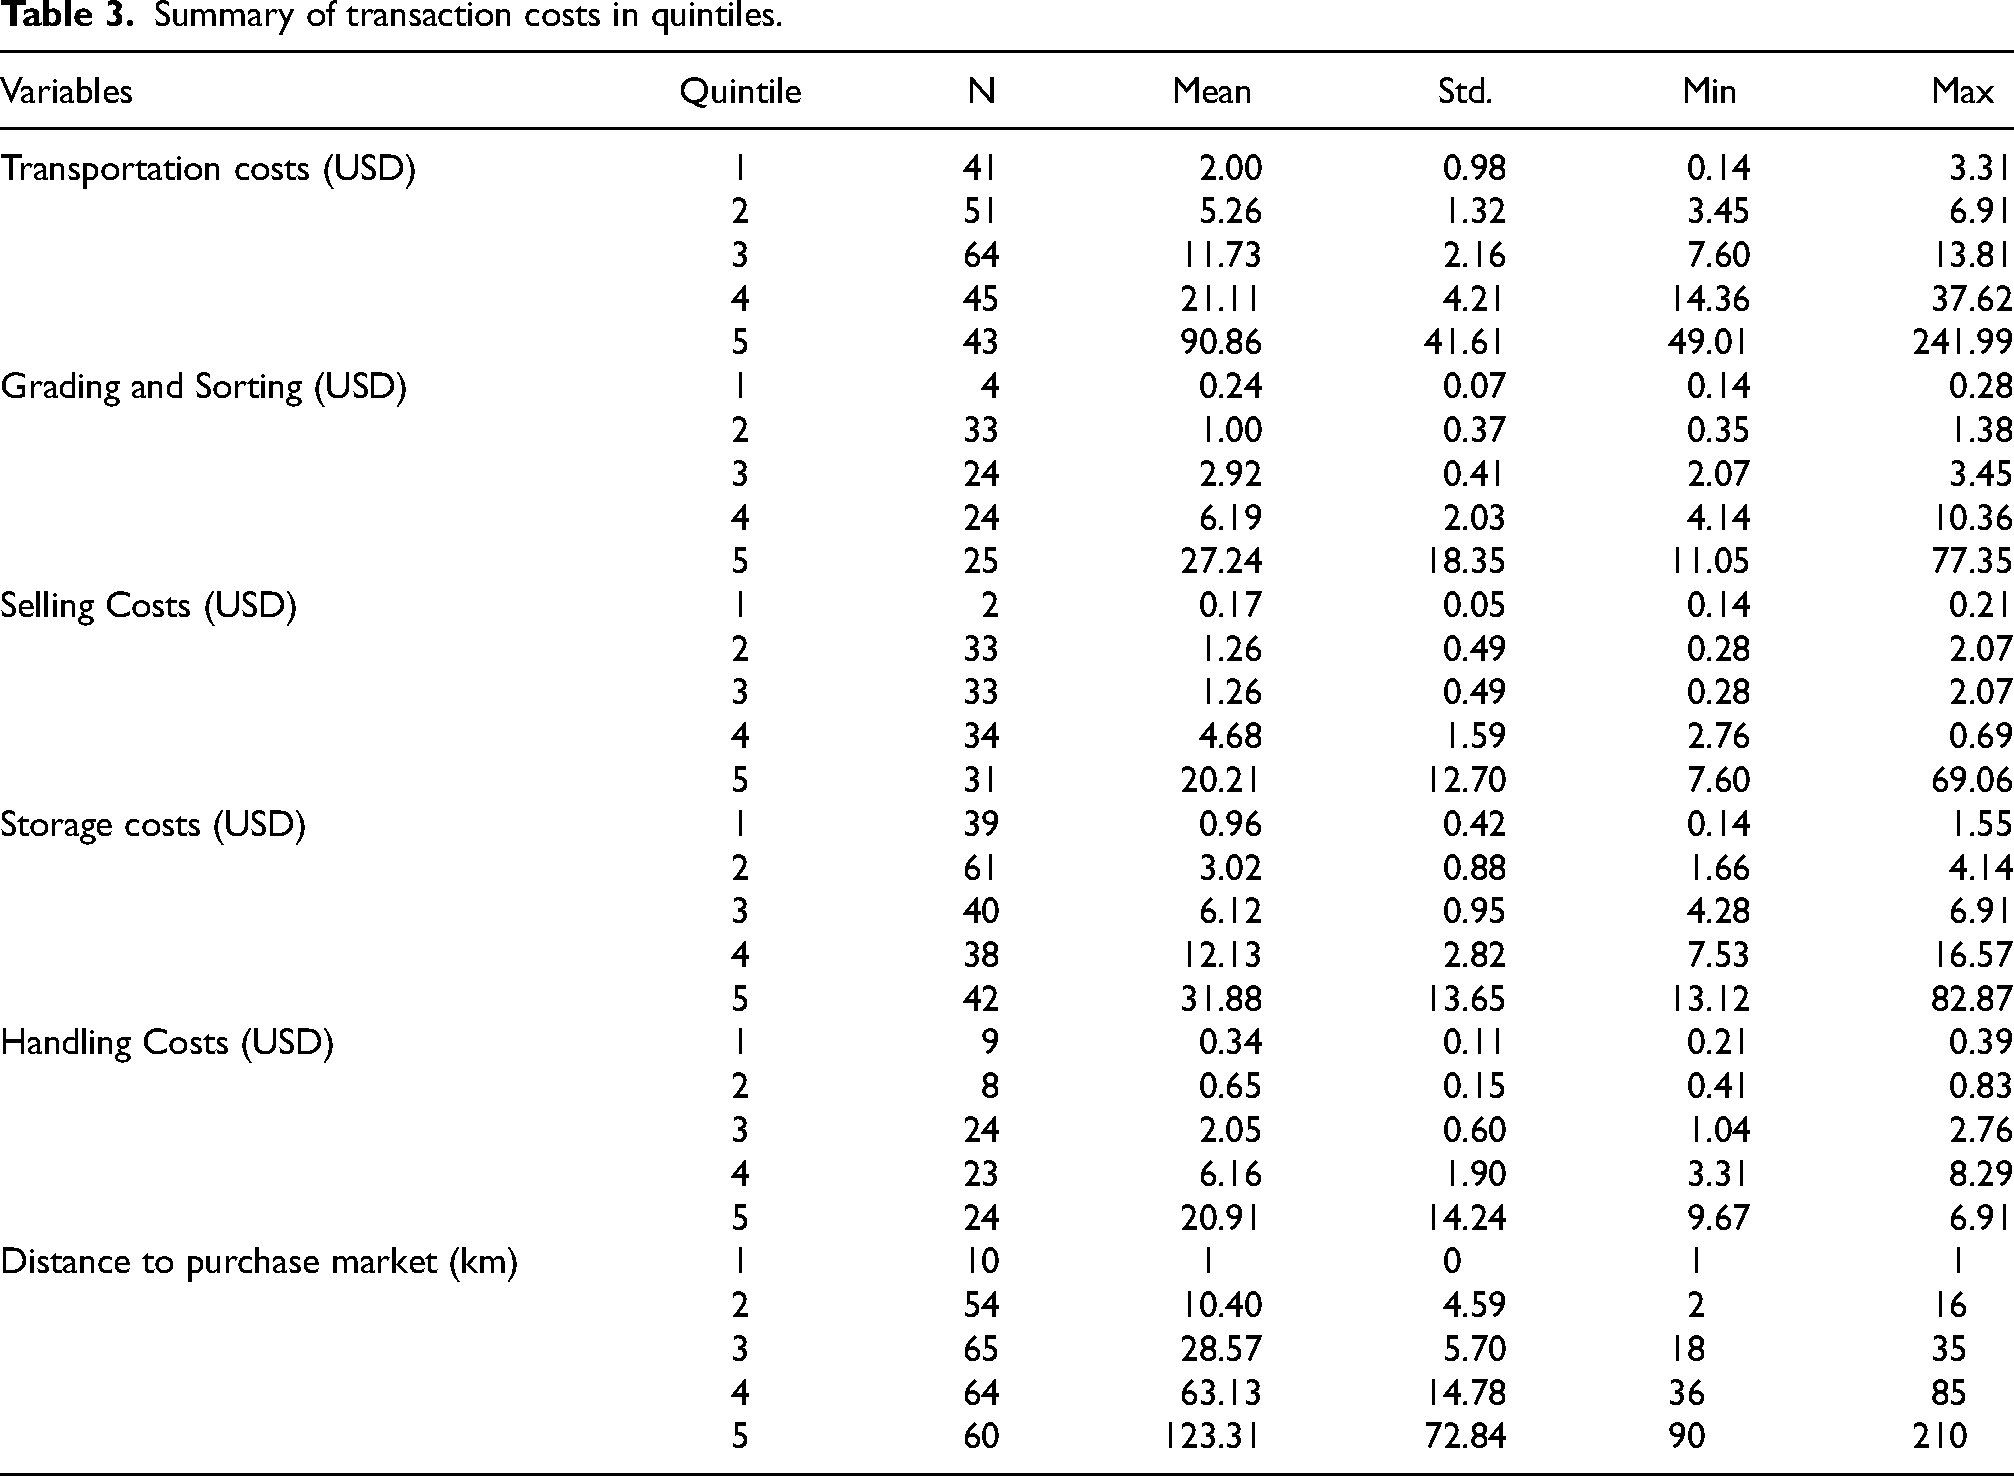
Table 3 presents a summary of transaction costs calculated per annum except for distance to source of bean sold on the market. The descriptive statistics are presented in quintiles in order to provide a proper understanding of the spread of the observations. Transportation costs ranged from $0.14 to $241.99, with the mean ranging from $2 in the first quintile to $90.86 in the fifth quintile. This is mainly due to differences in distances where traders procure their bean for sale. This is further observed in the distances to purchase markets where the average distances ranged from 1 km in the first quintile to 123.31 km in the fifth quintile. Thus, some traders source bean within their localities, whilst others travel long distances to purchase the bean. Grading and sorting costs ranged from $0.14 to $77.35 depending on the quantities handled by the different traders. The mean varied from $0.24 in the first quintile to $27.24 in the fifth quintile. Average selling costs were within $0.17 in the first quintile and $20.21 in the fifth quintile. Average storage costs were between $0.96 in the first quintile and $31.88 in the fifth quintile. This is so as different markets are expected to charge different rates for different quantities stored in the warehouses by the traders. Lastly, average bean handling costs ranged from $0.34 in the first quintile to $20.91 in the fifth quintile, depending on the quantities handled by the different traders in the markets.
Summary of transaction costs in quintiles.
Determinants of bean marketing efficiency
Table 4 presents the results of multiple linear regression model. The data were first transformed using natural logarithms. Data transformation was done to eliminate the possible problems for potential outliers in the data and achieve normal distribution in the data. The variable names showing log transformation have been presented in Table 1, where each variable has been described. Diagnostic tests were conducted for multicollinearity and heteroskedasticity. Breusch–Pagan/Cook–Weisberg test for heteroskedasticity was conducted and we failed to reject the null hypothesis that the error terms are homoskedastic. Regressions with robust standard errors were, therefore, conducted to remedy the heteroskedasticity problem. Furthermore, a test for multicollinearity was conducted using Value Inflation Factor (VIF). The mean VIF obtained was 1.88 for pooled model. Since the VIF value is less than 10, it can, therefore, be concluded that multicollinearity was not a problem among the fitted variables.
Factors affecting common bean marketing efficiency.

Standard errors in parentheses.
***p < 0.01, **p < 0.05, *p < 0.1.
Transaction costs that have a negative relationship with marketing efficiency include transportation, storage, handling and distance to source bean. As transportation costs significantly increase by 10%, a corresponding decrease in marketing efficiency of both categories of traders by 9.6% is observed (p < 0.01). Specifically, a marginal increase in transportation costs by 10% results in a decrease in marketing efficiency of retailers by 8.8%.
Cost of storage significantly affects marketing efficiency negatively. An increase in storage costs by 10%, reduces marketing efficiency by 0.07% for both retailers and wholesalers (p < 0.01). Moreover, storage costs reduce marketing efficiency among retailers by 0.3% (p < 0.01) whereas in bean wholesalers, storage costs have less effects as compared to retailers. In this case, market efficiency reduces by 0.4% (p < 0.05). Since bean wholesalers handle bean in relatively larger quantities, they are well prepared in terms of warehousing, chemicals and sacks for storing bean.
Distance to the source of bean depicts a negative influence on marketing efficiency for both traders as expected, such that, a 10% increase results in a decrease of marketing efficiency by 0.55% at 5% level of significance. However, bean retailers are the only traders who are affected by distance to the source of bean for sale at 5% level of significance.
Handling costs affect marketing efficiency negatively. As handling costs increases by 10%, a corresponding decrease in marketing efficiency by 0.27% for both retailers and wholesalers (p < 0.01) is accompanied. However, when disaggregated by category of trader, the cost significantly affects bean retailers only (p < 0.01). These are the costs of labour that traders incur when handling bean to and from various markets.
Marketing experience in years has a positive relationship with marketing efficiency. The overall model shows that an increase in trading experience by 10% increased marketing efficiency by 8%. The retailers’ model also showed that increasing trading experience by 10% significantly led to an increase in marketing efficiency by 11%.
The scale of operation significantly affects marketing efficiency positively as expected. Volume of bean handled per month was used as a proxy for scale of operation. There is a positive relationship between the scale of operation and marketing efficiency. The results in the pooled model show that an increase in scale of operation by 10% significantly increases marketing efficiency of both categories of traders by 11%. An increase in scale of operation of bean retailer traders by 10% increases marketing efficiency by 9.9% (p < 0.01). The study further found that bean wholesaler traders registered a positive yet, highly significant scale of operation. An increase in scale of operation by 10%, results in the increase in marketing efficiency among bean wholesalers by 10.22% (p < 0.01).
Buying price shows different result contrary to what was expected. A 10% increase in buying price for both traders significantly increases marketing efficiency of retailer traders by 3.4% and the result is statistically significant at a 1% level of significance. For bean retailer traders, increasing buying price by 10%, marketing efficiency increases by 3.1% (p < 0.05).
Sorting and grading showed a negative relationship with marketing efficiency among wholesalers. Grading and sorting of bean significantly reduced marketing efficiency. Grading and sorting reduced marketing efficiency because traders incurred costs when sorting and grading their bean thereby resulting in a negative implication on profit and subsequent profit.
Access to credit is another significant variable that positively affects marketing efficiency for bean traders. Access to credit increases marketing efficiency by 1.8% (p < 0.05) for both bean traders. Location of the market affected marketing efficiency of bean traders negatively. Markets that are located in rural areas significantly decreased marketing efficiency by 0.14% for retailer traders (p < 0.01) as compared to traders in urban markets of Lilongwe. The results are presented in Table 4.
Discussion
Table 2 indicates that only a relatively small percentage of traders (11%) have taken business management training. It demonstrates that traders are not focused on various business management factors. The preceding discovery regarding the education level of traders can be used to explain this outcome. Most traders only completed their secondary education. They might not recognise the value of extra training for the expansion of their bean business as a result of education level attained.
Another significant result is that the best time to sell bean is from the month of October–December. Due to trade reversals, there is a significant demand for bean at the moment (Ochieng et al., 2019). Normally, after harvest, dealers purchase bean from farmers. During the specified time, farmers purchase the same bean from traders as seed. Due to the low availability of bean at the time, bean is sold at exorbitant prices. Although most bean dealers claimed that selling during the specified period is profitable, the majority of them start selling in May and continue through August. Ochieng et al. (2019) note that due to a lack of storage facilities and domestic emergencies, the majority of agricultural dealers in Malawi sell their agricultural commodities earlier.
The current study has also demonstrated the informal nature of the sources of market information. The majority of traders relied on word-of-mouth recommendations from friends to learn about various market trends. Most often, it has been said that getting information from friends is unreliable. The majority of marketing agents in Malawi make irrational marketing judgments as a result of a lack of accurate market information (Chikuni and Kilima, 2019). Due to a lack of trustworthy market information to facilitate decision-making, traders are unable to enhance the outcome of bean markets.
The analysis also confirmed that there is a conflict between marketing efficiency and transportation expenses. As anticipated, higher transportation costs reduce traders’ ability to effectively market bean. Traders limit the amount of bean handled to save money on transportation costs, which lowers marketing efficiency. Additionally, if retailers keep raising prices in response to rising transportation costs, fewer sales will occur, decreasing marketing efficiency. When compared to other studies, the current study supports the findings of Tiri et al. (2015), who discovered that the marketing effectiveness of dealers of orange sweet potatoes in Kano, Nigeria, was considerably impacted negatively by transportation expenses.
Distance to the source of bean reduced marketing efficiency. Although some traders were buying bean at their respective marketplaces, some traders travelled long distances to source bean. The results confirm earlier finding in Table 3, where the distance to the source of bean ranged from 1 km to 210 km. Traders travel long distances to remote areas to source bean, thereby leading to a reduction in marketing efficiency. Selling in small quantities might be another reason why distance to source of bean reduced marketing efficiency of bean retailers. Retailers have limited operating capital to buy bean in bulk. This makes bean retailers to buy bean frequently, resulting in increased costs.
The marketing efficiency of bean traders was also negatively affected by handling costs. It has been demonstrated that bean retailers’ marketing efficiency decreases as handling costs rise. This was anticipated because most retailers buy bean in low quantities, which made them to purchase bean frequently. Costs associated with handling bean rise as the frequency of purchases increases. This is consistent with the findings of Kalule and Kyanjo (2013), who found out that the effectiveness of banana marketing in Uganda was negatively impacted by an increase in handling expenses.
Trading experience has been found to help bean traders promote their bean more efficiently. It was discovered that a trader's marketing efficiency was positively impacted by experience. The results support those of Kalule and Kyanjo (2013) who discovered that trading experience influenced Uganda's banana marketing efficiency in a positive way. Additionally, Tiri et al. (2015) reported that dealers of orange sweet potatoes in Nigeria were more efficient marketers due to their market experience. This is due to traders’ increased ability to manage any risk that may arise during normal business operations as they gain more business expertise. Traders are able to forecast price variations that may occur in company with a high degree of accuracy by drawing on past experience, allowing them to plan ahead to manage such a risk.
The scale of operation had a positive significant influence on traders’ marketing efficiency. Hoarding bean in large quantities spreads out the transaction costs on bean business thereby making traders more efficient in marketing of bean. Scale of operation among bean wholesalers was highly significant and positively influenced marketing efficiency. This is because buying in large quantities is associated with price discounts that enable the trader to be able to realise more profits. Eventually, this results in economies of scale because the trader is able to stock bean in large quantities while selling at profit. The present study seems to be consistent with the findings of previous studies on marketing efficiency. For example, this result agrees with the findings of Nwaru et al. (2011) and Kalule and Kyanjo (2013) who found that scale of operation affected profit and marketing efficiency of banana retailing in Nigeria and Uganda, respectively. The economies of scale are easily achieved if the trader stocks large quantities of bean, making the trader more profitable.
The study further reports a negative relationship between marketing efficiency and the prices offered to traders when purchasing bean from various sources. The results disagree with the findings of Tiri et al. (2015) who found that buying prices had a negative relationship with marketing efficiency of orange sweet potatoes in Kano, Nigeria. The negative relationship can be explained by the fact that a larger percentage (62%) of traders bought bean from farmers. It shows that the marginal increase in farmgate prices matters less to traders (Kyomugisha et al., 2018). Traders are still able to make profits even if the farmgate prices increase since the increase is insignificant. In Malawi, farmers are exploited in the rural areas where production takes place (Luiz et al., 2019; Sitko and Jayne, 2014). Most of the time, there are no regulations governing the selling of agricultural products, thus dealers are free to set the price for the bean that they are ready to pay. Due to the fact that the majority of farmers rely on the sale of their goods to cover urgent household expenses, they are forced to sell their bean even when the prices are below the breakeven point.
Access to credit significantly increased marketing efficiency as expected. Credit augments trader's operating capital which helps to improve bean performance. The findings confirm the results of Farayola et al. (2013) who found that access to credit affected marketing efficiency of stallholder cocoa marketers in Oyo State, Nigeria. Perhaps traders who have access to credit garnered potential to increase the stock hence being able to sell in profitable period.
Trading in rural areas significantly decreased marketing efficiency of retailer traders, and all traders in general. Rural retailers experienced a decrease in market efficiency as compared to urban retailers. In general, rural traders are less efficient as compared to urban traders. In rural areas, most of the bean available at the markets might have been bought cheaply from nearby farmers. Common bean might also be sold cheaply in such markets since most of the bean consumed at a household level might in most cases come from own production. Unlike in urban markets where bean consumption is strictly dependent on the markets.
Conclusions and recommendations
The main purpose of this study was to evaluate the efficiency of bean traders in Malawi's capital city, Lilongwe. We draw a number of conclusions from the efficiency of bean traders in Malawi. First, most bean traders are mainly using a source of market information that is not reliable. They use a word of mouth from friends or relatives to access market information. Secondly, we conclude that most traders have not received business management training, an aspect which provides an impetus for boosting their businesses. Thirdly, we conclude that a number of traders do not have access to storage facilities, a thing which deters them from selling bean in profitable periods. Fourthly, on factors affecting marketing efficiency, we observed that transaction costs from transportation, storage, handling and distance to source of market reduce marketing efficiency. The scale of operation was found to have a positive influence on marketing efficiency. As traders increase their operating capital, they eventually increase the amount of bean thus, increasing marketing efficiency. We further observed that traders’ buying prices had a positive influence on marketing efficiency. Access to credit significantly increased marketing efficiency for both wholesalers and retailers. Markets that are located in rural areas had a negative effect on marketing efficiency.
Since it was observed that most traders use friends or relatives to access market information, we, therefore, recommend that policies in the NAP that would promote smooth access to reliable market information should further be promoted. Furthermore, effort to improve traders’ common bean business performance through the provision of business management training should be promoted. As one way of promoting business trainings, government and relevant stakeholders may promote business incubation centres and other platforms where traders can acquire skills and knowledge for managing their businesses. The upgrading of the rural road system and warehousing facilities should be promoted in order to lower transaction costs, which will enable bean traders to expand their operations on a larger scale while also lowering expenses and increasing profits. These costs stem from high transportation costs (which are inflated by surge in fuel prices); handling costs; and distance to the source of bean. Access to credit should also be promoted as most of the traders have inadequate operating capital to facilitate the smooth functioning of their businesses. Storage function should be seriously looked into, as it was observed that a number of traders do not have access to storage facilities.
Footnotes
Declaration of conflicting interests
The author(s) declared no potential conflicts of interest with respect to the research, authorship, and/or publication of this article.
Funding
The author(s) received no financial support for the research, authorship, and/or publication of this article.
