
Abstract
While fine manual dexterity develops over time, the extent to which children show independent control of their digits in each hand and the impact of perinatal brain injury on this individuation have not been well quantified. Our goal in this study was to assess and compare finger force and movement individuation in 8–14 year old children with hemiplegic cerebral palsy (hCP; n = 4) and their typically developing peers (TD; n = 10). We evaluated finger force individuation with five independent load cells and captured joint movement individuation with video tracking. We observed no significant differences in individuation indices between the dominant and non-dominant hands of TD children, but individuated force and movement were substantially reduced in the paretic versus non paretic hands of children with hCP (p < 0.001). In TD participants, the thumb tended to have the greatest level of independent control. This small sample of children with hCP showed substantial loss of individuation in the paretic hand and some deficits in the non-paretic hand, suggesting possible benefit from targeted training of digit independence in both hands for children with CP.
Keywords
Introduction
Fine manual control develops over years after birth (Kilshaw & Annett, 1983; Shaklai et al., 2017). Unfortunately, this development can be impeded by neurological perinatal damage, such as is experienced by children with cerebral palsy (CP). CP has an incidence of two of every one thousand live births, making it the most common childhood movement disorder (Hurley et al., 2011; Kirby et al., 2011; Oskoui et al., 2013). Fine motor control of the hand is a typical impact of CP, with almost half of all children with hemiplegic cerebral palsy (hCP), the second most common form of CP, experiencing greatest impairment in the upper limb (Makki et al., 2014; Paul, 1988), with particular compromise of fine motor hand function in the paretic hand (Arnould et al., 2014). Yet, our review of extant literature suggests that the way these deficits present has not been well characterized (McCall et al., 2021).
One aspect of fine motor control, finger individuation, can be used to predict most variance in hand function (Lang & Beebe, 2007). Finger individuation has been characterized in both neurotypical adults and adults who are post-stroke (Kim et al., 2008; Raghavan et al., 2005; Wilhelm et al., 2014; Wolbrecht et al., 2018), but it has not been characterized among children with hCP. As motor control may differ between children and adults, further study of fine motor control is warranted for children generally and particularly for those with hCP. An evaluation of finger individuation capability would help target those who might benefit most from training. Evaluations should separately address control of individuated finger motion and force production, as these are important but differentially controlled hand functions (Venkadesan & Valero-cuevas, 2008; Xu et al., 2017).
In this study, we examined both individuated force and movement production across all five digits of both hands in children with hCP and their typically developing (TD) peers. We hypothesized that TD children would show no significant difference in individuation capability between their dominant and non-dominant hands (Wilhelm et al., 2014), while children with hCP would have poorer force and movement individuation in their paretic hands, compared with either their non-paretic hands or either hand of TD children.
Methods
Participants
Inclusion/exclusion criteria for all participants were to be 8–14 years old and free of orthopedic issues affecting use of the hand or arm. We selected a minimum age of 8 years to ensure that all children could adequately understand and follow directions; and we chose an upper age limit of 14 years so that the cohort would represent children currently undergoing motor development of finger individuation capability (Shim et al., 2007). Children with hCP also needed an assessment with the Manual Ability Classification System (MACS) (Eliasson et al., 2006) yielding a score of I, II, or III. MACS was developed to classify hand function of children with CP. A MACS score of I indicates the ability to easily handle objects, while a MACS score of III indicates that help or modification of activities is necessary to handle objects. This range of scores represents mild to moderately impaired hand function.
After imposing these inclusion/exclusion criteria, our participants were four children with hCP (2 males, 2 females) and ten children with typical development (5 males, 5 females). Recruiting a larger sample size was found to be impractical due to the target population’s size, status as children, and pandemic related recruitment difficulties. While the number of hCP children was small, we proceeded with an explorative study that might determine whether a further expanded study would be beneficial. Parents of all participants provided written informed consent, and all participants provided informed written assent. The research protocol was reviewed and approved by the Institutional Review Board of the [University of North Carolina at Chapel Hill]. Participants were recruited by flyers distributed within the local community and provided to [UNC] hospital physicians likely to interact with the population of interest.
Experimental Protocol
We evaluated fine motor control in both hands of each participant with three assessments: finger force individuation (FI), finger movement individuation (MI), and the Jebsen-Taylor Test of Hand Function (JTTHF) (Jebsen et al., 1969). The JTTHF is highly reliable and valid in children with CP aged 6–18 years (Tofani et al., 2020).
During evaluation of FI, participants were seated with the forearm supported and pronated, the wrist in a neutral position and the digits extended. Each digit tip rested on a separate six degree-of-freedom load cell (Nano-17 or Mini40, ATI Industrial Automation, Cary, NC). High density electromyographic (HDEMG) electrode arrays were placed on the forearm and hand to capture muscle activation patterns. Specifically, two 64-electrode (5×13) EMG arrays were placed on the dorsal and ventral sides of the forearm, to record from the finger extensor and flexor muscles, respectively covering the extensors and flexors, and a 32-electrode (4×8) electrode array was placed on the dorsal side of the hand to record from intrinsic muscles. The EMG signals were sampled at 2048 Hz and bandpass-filtered (10–900 Hz) by an EMG-USB2 + device (OT Bioelettronica, Italy). The participant was instructed to create force with a single digit while maintaining contact with the load cells with the other digits. A separate trial was performed for each digit, with three repetitions within each trial. Visual feedback of the desired and actual force levels was provided for the instructed digit only.
To evaluate MI, reflective markers were placed on the joints and tip of each digit in the hand, and on the back of the hand. Marker positions were captured with a 12-camera system (120 Hz, VICON, Oxford, UK). Participants, seated with the forearm pronated and supported, and the elbow flexed to 90°, were instructed to start with their fingers maximally extended and then to sequentially flex each finger while maintaining extension of the non-instructed fingers. Participants were instructed to perform each finger motion three times.
Data Analysis
Finger Force Individuation
To analyze FI, for each trial, we identified a 250-ms window corresponding to a period of minimal force variation while the participant maintained the instructed force. We computed the average force in the normal direction with respect to the fingertip and load cell across this window for each digit. Values for a given digit were averaged across the multiple attempts. FI was computed for each digit as the ratio of the instructed digit force (F
instructed
) to the total force across all of the digits (n) (Equation (1)) (Shim et al., 2007). A higher FI metric (closer to 1) indicates better force individuation.

To calculate the relative spread of force production across the digits, another metric, FI_DEV, was computed. This metric weighted force produced by uninstructed digits by their normalized distance from the instructed digit (Equation (2)). Here, distance between digits is represented using the term “Finger”, where each digit is assigned a number (1–5) (thumb: 1, index: 2, etc.).

We resampled EMG signals at 2000 Hz to match the sampling rate of the force data. We then removed electrical noise and motion artifacts from the EMG data using an algorithm described in the literature (Zheng & Hu, 2019). To minimize noise common to all electrodes, we employed common average reference spatial filtering across all channels of each electrode array at each time point. A 20-Hz high-pass filter was then applied, the data were rectified, and a 250-ms moving average filter was applied. The resulting signal for each channel was normalized according to its peak value recorded during the experiment. We generated two-dimensional activation maps for each electrode array by averaging EMG signals across the time window used to calculate FI. For each activation map, the centroid of activation was calculated (Equations (3) and (4)). The term AMP
ij
indicates the activation of a particular electrode, and the terms i and j indicate the rows and columns within the electrode array.


Finger Movement Individuation
We filtered the marker position data using a 2nd-order Butterworth low-pass filter with a 10-Hz cutoff. These data were used to calculate finger joint angles. We computed the sum of the displacement of the metacarpophalangeal and proximal interphalangeal (interphalangeal for the thumb) joints to determine when this sum first reached 90° for the instructed digit. MI was calculated using the joint sum for each digit at this time point as the


Statistical Analysis
A post-hoc power analysis was performed using G*Power software and the four force individuation measurement groups (Dominant/Non-Dominant/Non-Paretic/Paretic) to determine the achieved power after data collection was completed. The power analysis was performed with an alpha of 0.05, and a force individuation effect size of 0.639 and a post-hoc power of 0.747 was determined. As this level of statistical power was sufficient to detect a large effect size difference between groups, we proceeded with plans for further analyses.
We performed one-way analysis of variance (ANOVA) for each primary outcome measure (FI/MI/JTTHF) with the independent variable of Hand (paretic/non-paretic/non-dominant/dominant). Bonferroni correction was employed for multiple tests, with a significance level of α = 0.0167. Pairwise testing of Hand was performed for ANOVAs exhibiting a significant effect using the Tukey Honest Significant Difference. Additionally, Pearson correlation coefficients were calculated between the primary outcome measures.
Results
Participant Characteristics by Group.
Note. Participants with hCP were given the identifier of “CP” followed by a numerical value, while those with TD were given the identifier, “TD” followed by a numerical value.
Finger Force Individuation
Force distribution across the five digits of children in each group revealed greater force production in non-instructed digits among children with hCP than among TD children (see Figure 1). A univariate ANOVA showed a significant main effect for Hand on FI, averaged across all five digits (F3,24 = 12.956, p < 0.001, ηp2 = 0.639). TD participants had a larger mean FI measurement (M dominant = 0.66, M nondominant = 0.60) compared to children with hCP (M paretic = 0.34, M non-paretic = 0.52) (see Figure 2). Post-hoc Tukey tests revealed that the score for the paretic hand of children with hCP was significantly smaller (poorer individuation) than the values for either the non-dominant or dominant hands of the TD children (p < 0.001). The FI value for the non-paretic hands of children with hCP was lower than the value of the dominant hands of TD children (p = 0.035). The FI values for the TD children’s dominant and non-dominant hands were not significantly different (p = 0.717, and the values for the paretic and non-paretic hands of the children with hCP were not significantly different (p = 0.093). Flexion Force for Each Finger. Force Individuation Index (FI) for Each Hand.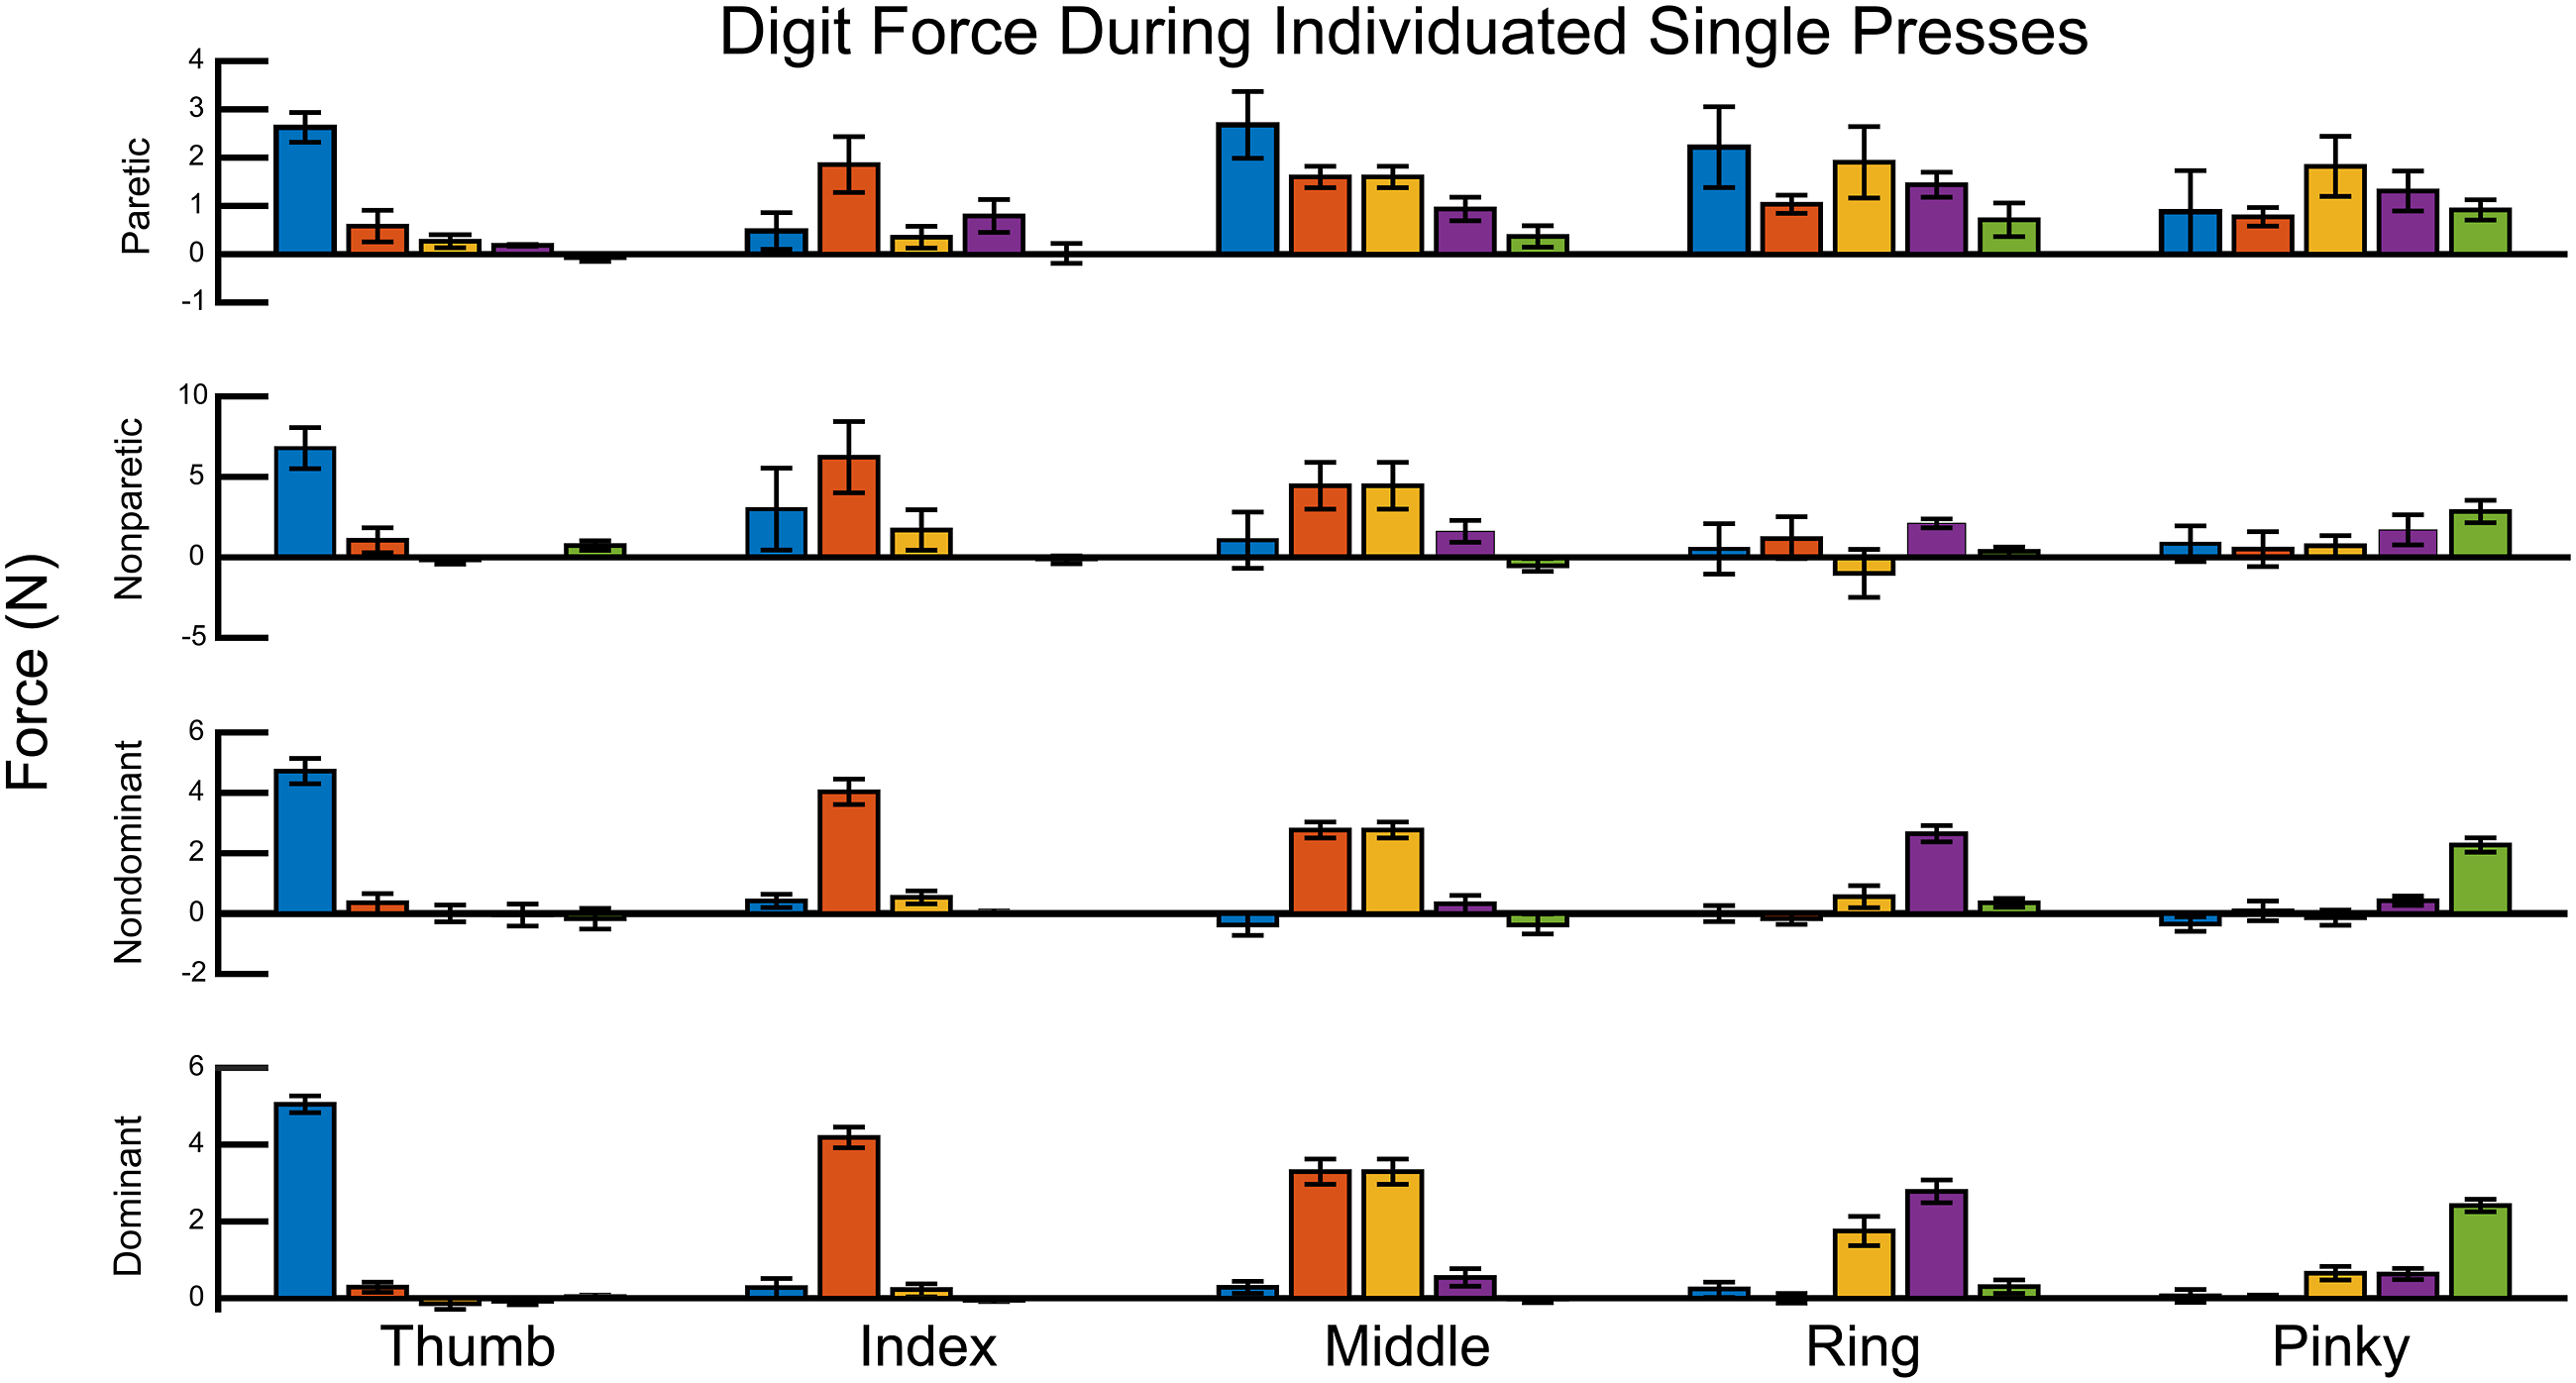

Across hands for children with TD, FI was greatest for the thumb (M Dominant thumb = 0.81, SE = 0.03) and least for the pinky finger (M Dominant pinky = 0.57, SE = 0.04) (see Figure 3). Among children with hCP, F1 deficits for the paretic hand relative to the dominant hand of the children with TD were the smallest for the thumb and similar across the fingers. FI Values for Each Digit.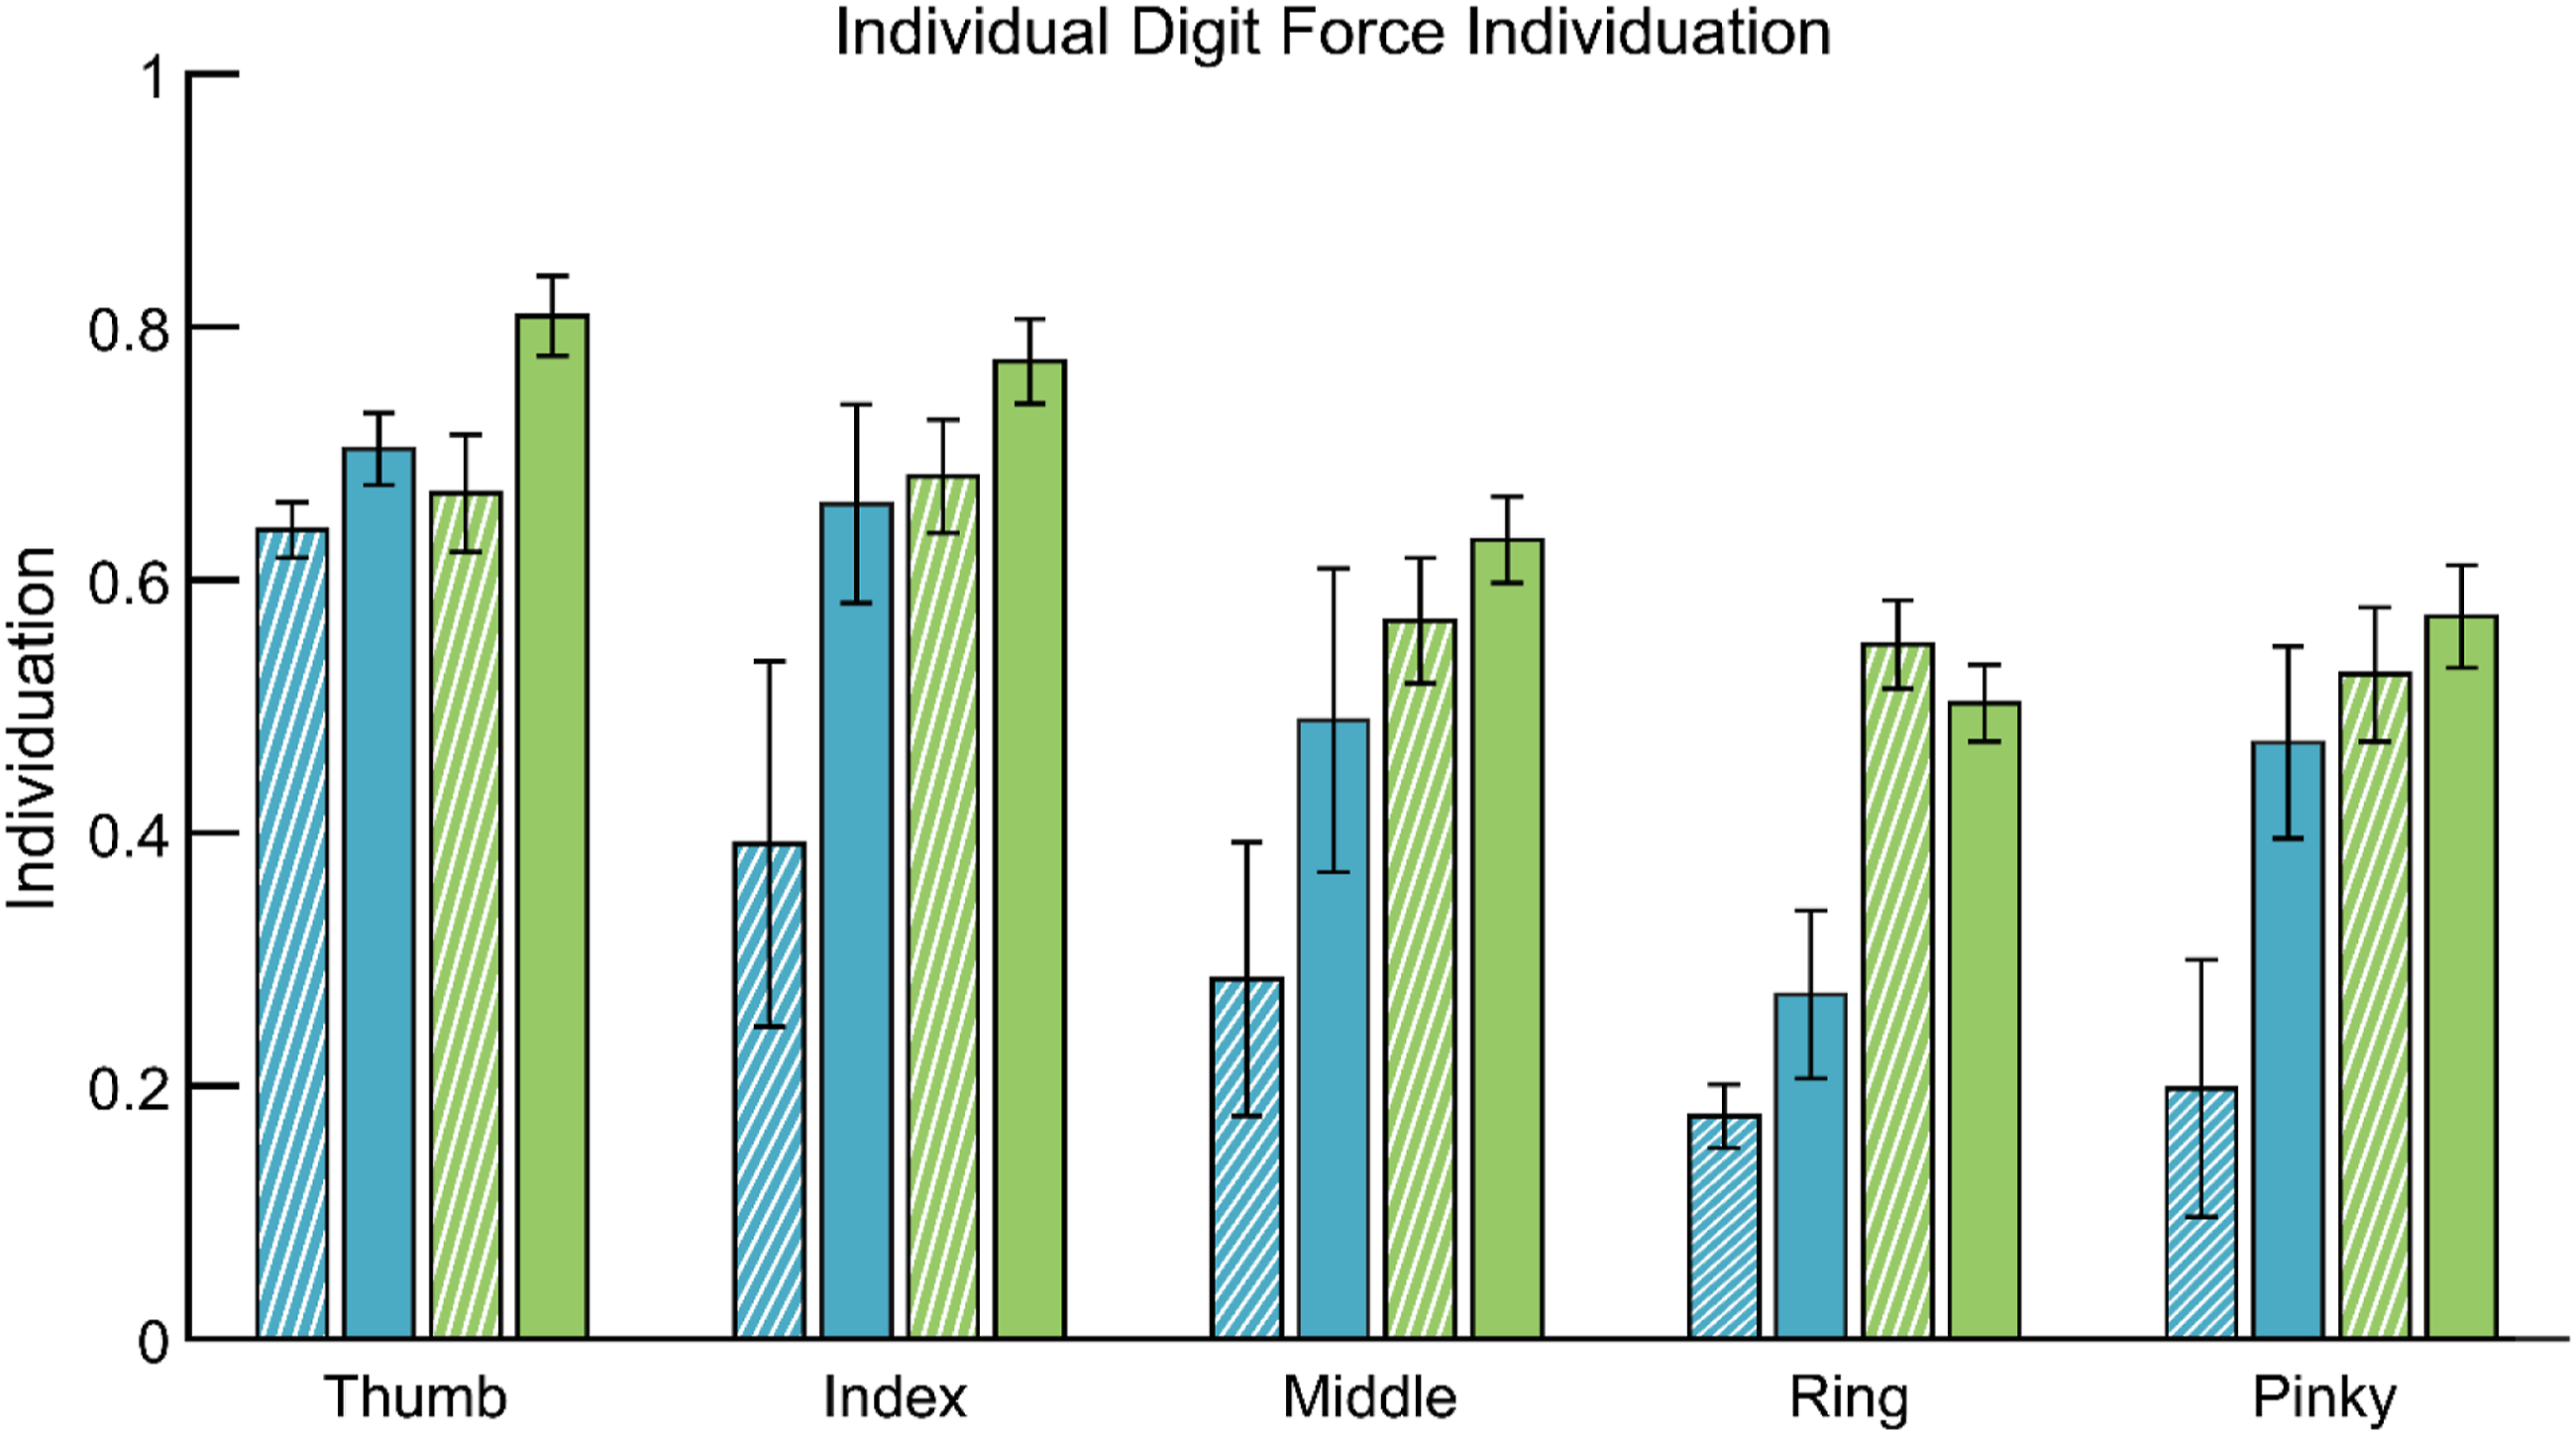
Unintended force production tended to be spread more widely across the digits for the children with hCP (see Figure 1). For the TD children, force creation in uninstructed digits was largely seen only in the digit adjacent to the instructed digit. Examination of FI deviation, FI_DEV, confirmed that the TD participants had better force localization during attempted force individuation (M non-dominant = 4.89, SE = 0.89; M dominant = 3.18, SE = 0.32) compared to the children with hCP, (M paretic = 8.71, SE = 1.04; M non-paretic = 9.45, SE = 4.33).
The EMG data captured during FI tasks confirmed differences in muscle activation patterns for the hCP children. We focused on instructed presses for the index and middle fingers, as activity for these fingers were best captured by the electrode arrays. The separation of the centroids of activation for presses with the index finger and middle finger was less for the paretic side. For the hand flexors, centroid separation of the paretic hands for children with hCP was roughly half that of the non-paretic hands (M Paretic = 5.6, 95% CI [0.5, 10.7]; M Non-paretic = 11.4, 95% CI [5.9, 16.9]) and also half of that of either hand of TD children (M Non-dominant = 10.6, 95% CI [6.9, 14.3]; M Dominant = 9.0, 95% CI [5.4, 12.6]). Centroid separation for the extensors for the paretic hand of children with hCP (M paretic = 10.4, 95% CI [1.8, 19]; M non-paretic = 9.3, 95% CI [0.7, 17.9]) was similar to that of the non-dominant hands but considerably smaller than that of the dominant hands of children with TD (M non-dominant = 12.2, 95% CI [6.4, 18]; M dominant = 17.2, 95% CI [11.5, 22.9]). For the intrinsic muscles, centroid separation was relatively smaller for the paretic hands of children with hCP (M paretic = 4.1, 95% CI [0, 10.1]) than these children’s non-paretic hands (M non-paretic = 13.5, 95% CI [7.3, 19.7]) or either the dominant or nondominant hands of children with TD (M non-dominant = 10.6, 95% CI [6.4, 14.8]; M dominant = 9.3, 95% CI [5.1, 13.5]).
Movement Individuation
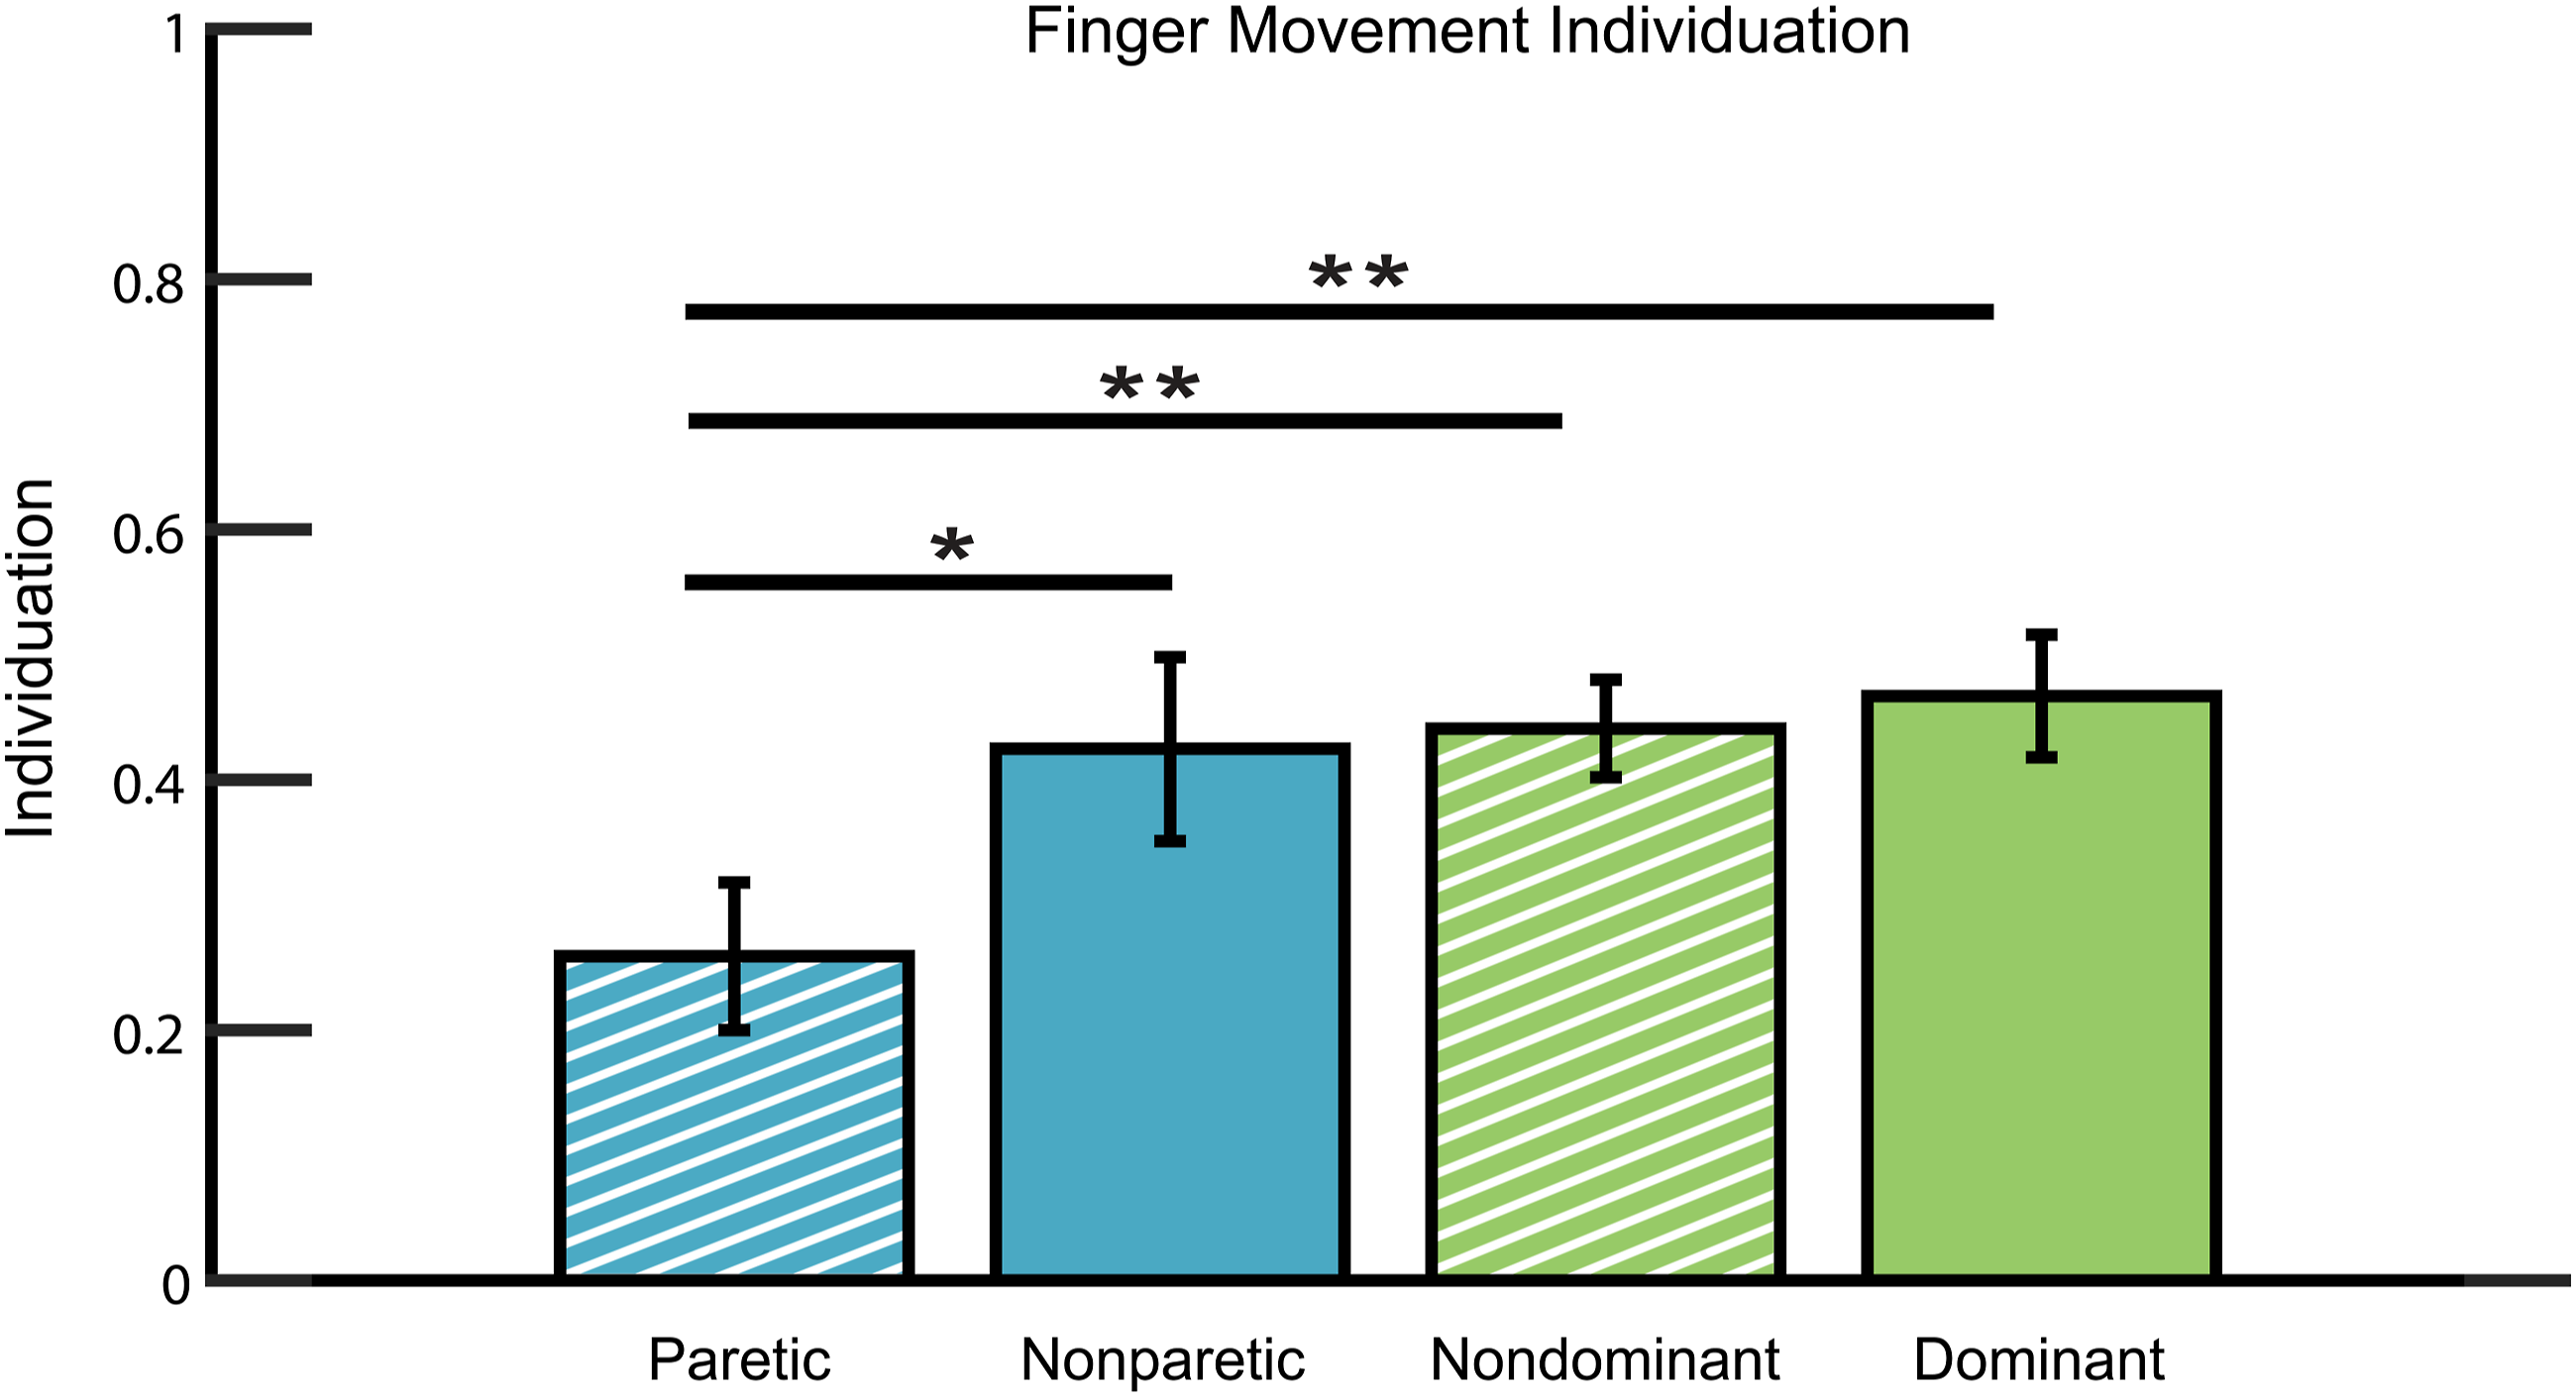
Among children with hCP, kinematic data showed movement of all digits in the paretic hands despite the instruction to move a single digit (see Figure 4). The ANOVA results showed a significant main effect for Hand MI (F3,24 = 9.990, p < 0.001, ηp2 = 0.577). Tukey pairwise comparisons revealed that MI for the paretic hands was significantly smaller than that of the TD children’s dominant hands (p < 0.001) or, non-dominant hands (p < 0.001), or the non-paretic hands of children with hCP (p = 0.021) (see Figure 5). No other significant differences were observed across hands. Finger Flexion (degrees) for Each Digit During Movement of the Instructed Digit Indicated. MI Averaged Across All 5 Digits.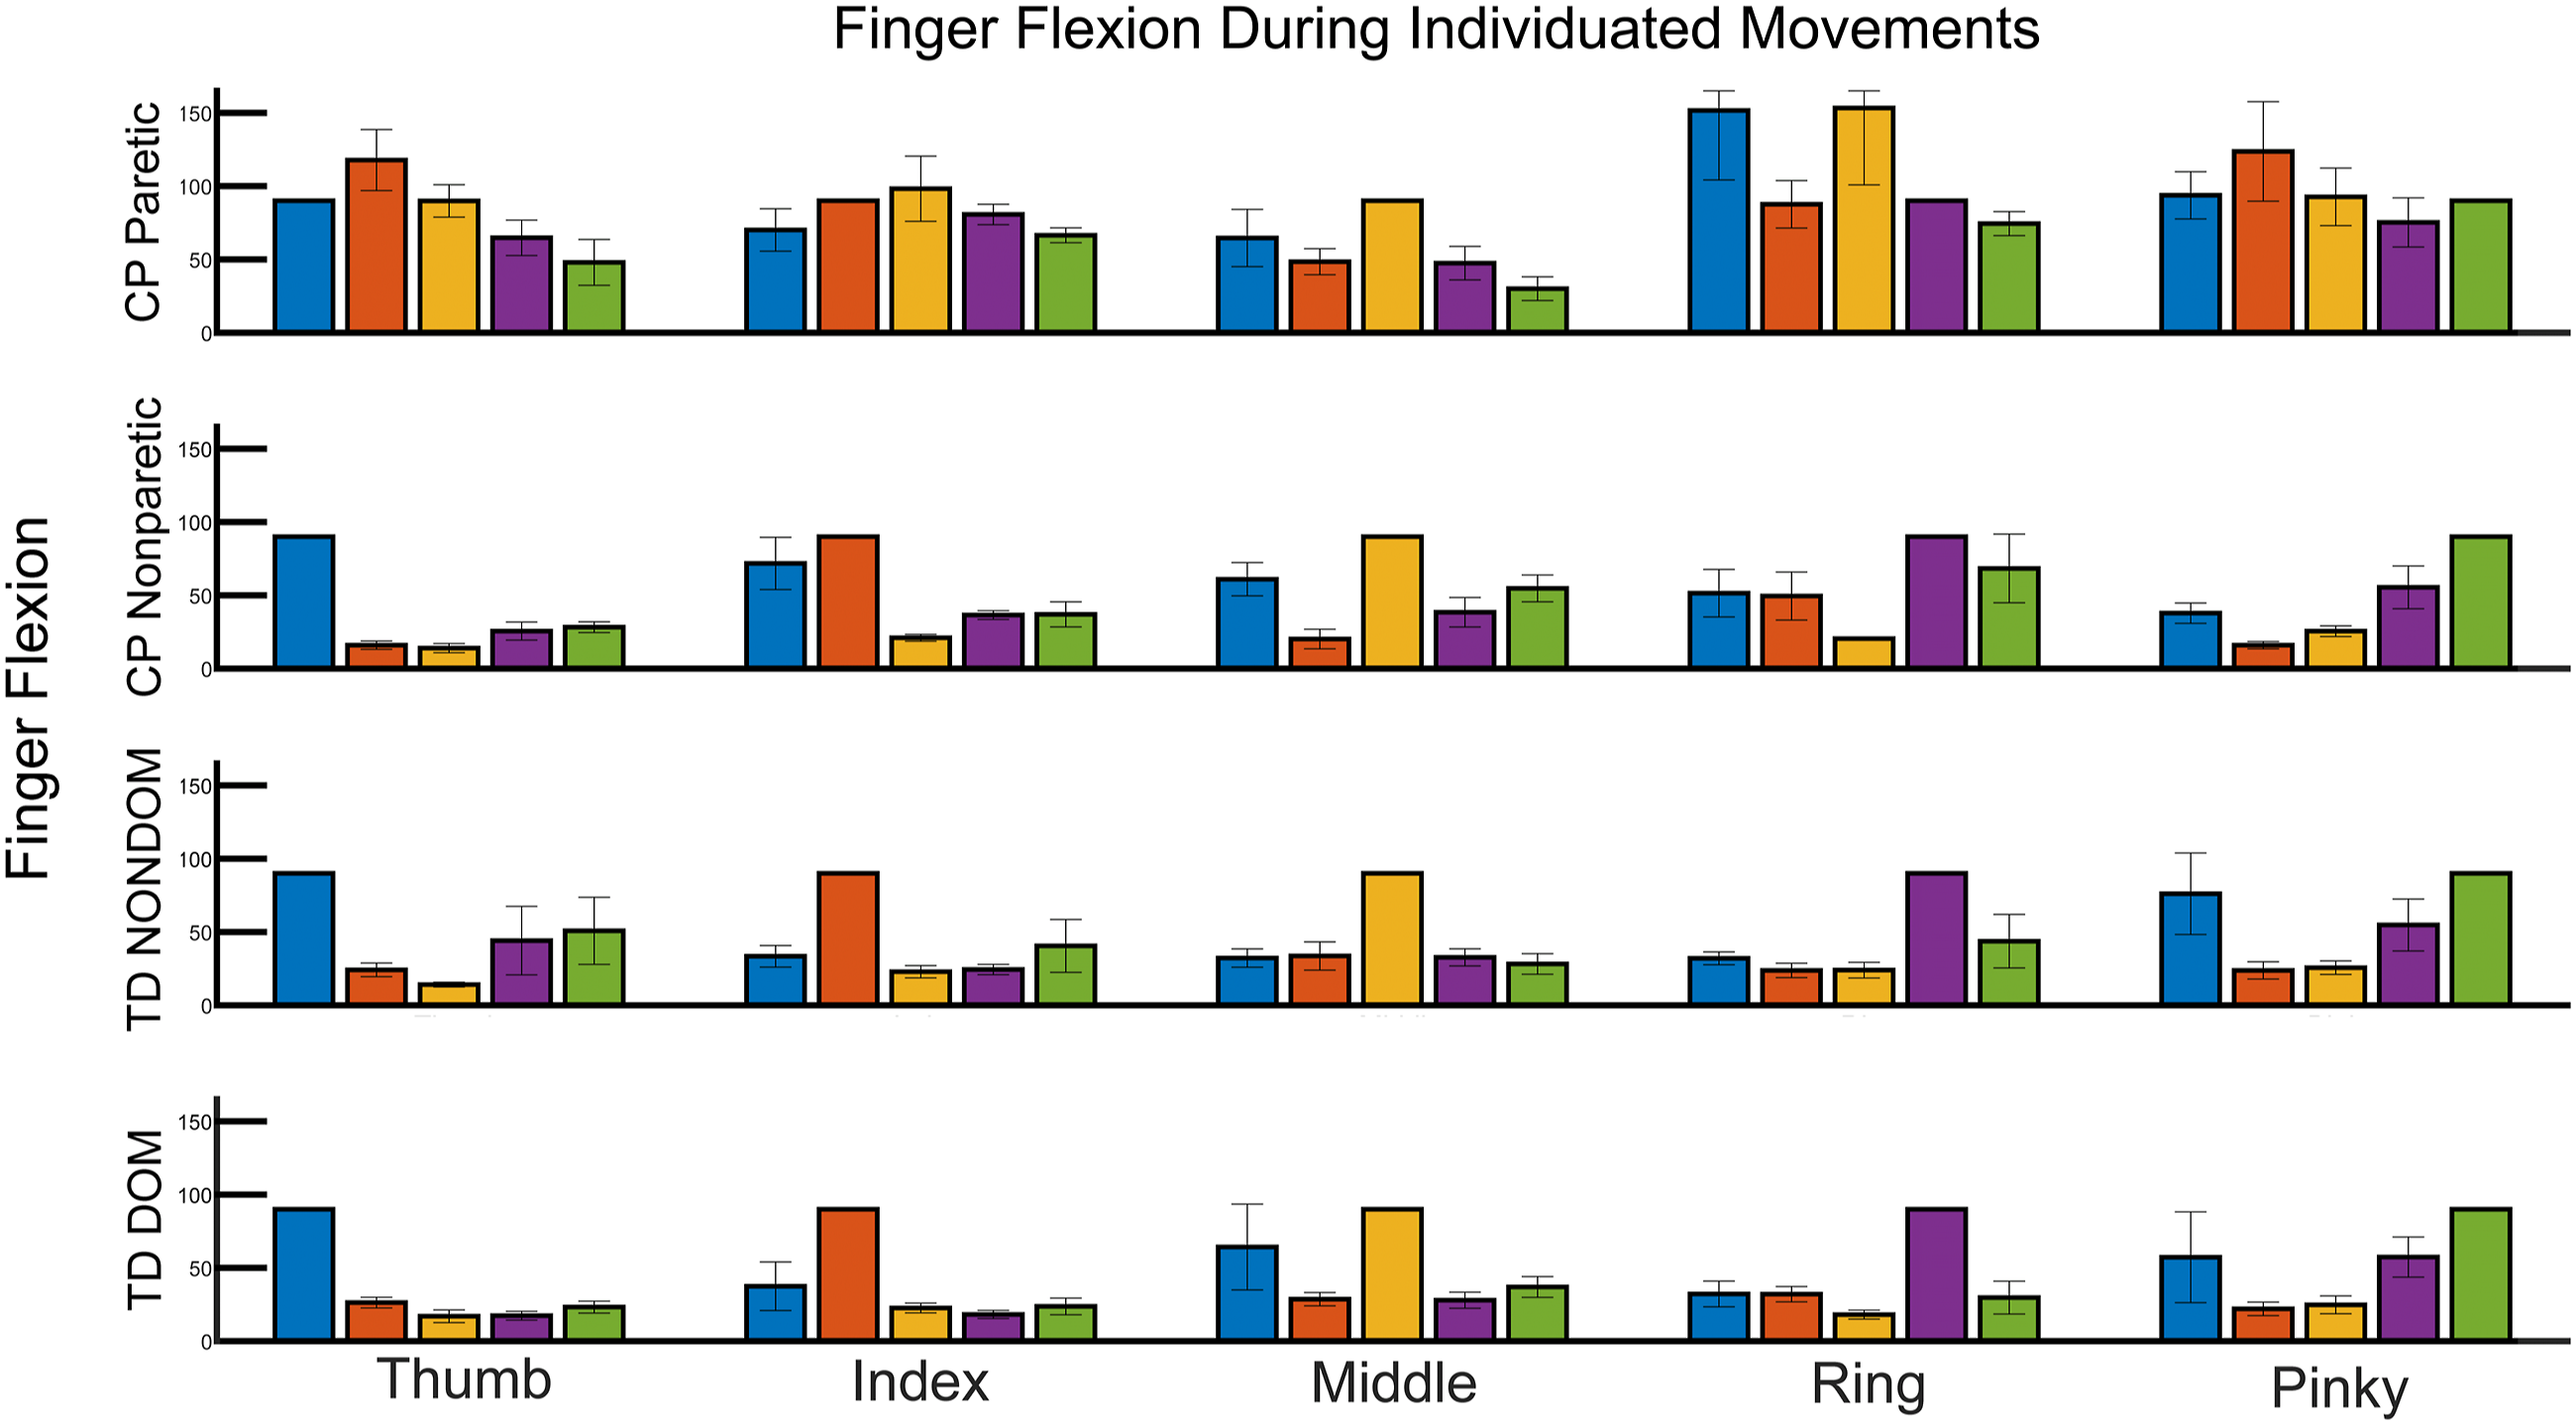
Deficits were similar for all digits in the paretic hands of children with hCP, aside from the middle finger (see Figure 6). Among TD participants, MI tended to be greatest for the thumb and decreased modestly with ulnar displacement toward the pinky. MI for Each Digit.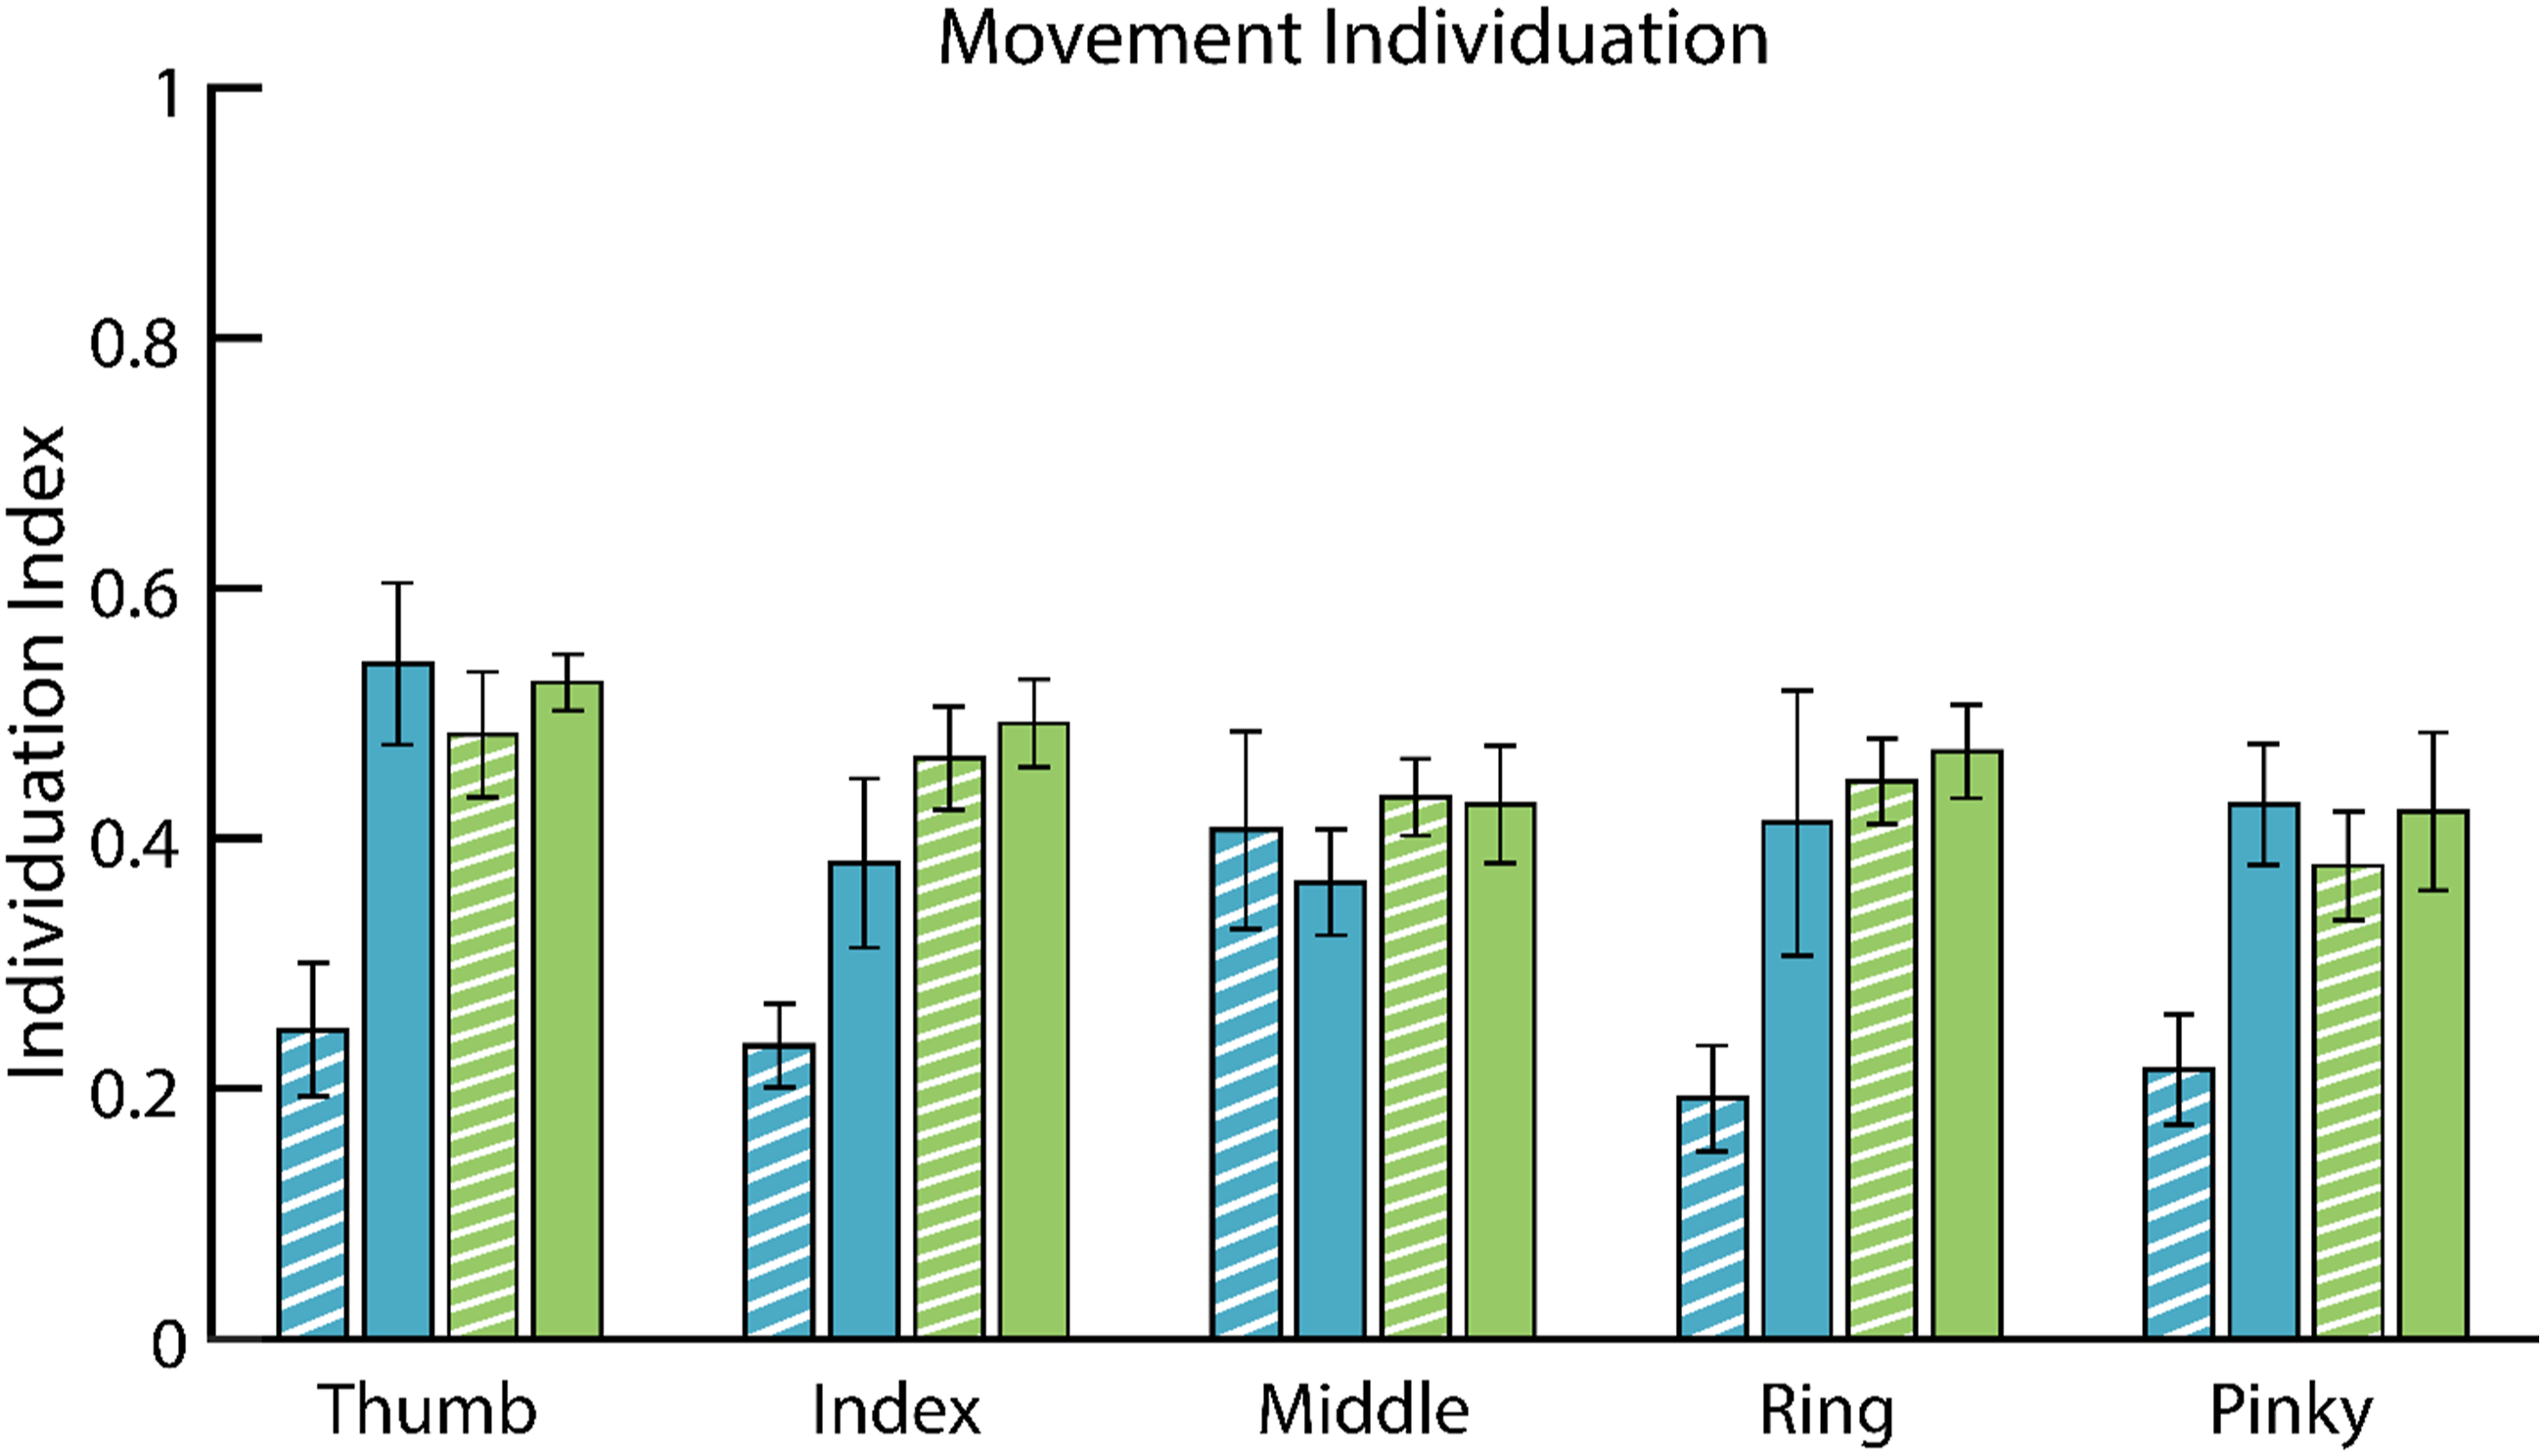
The distribution of unintended movement relative to the location of the instructed finger, MI_DEV, was slightly higher for the paretic hands of children with hCP (M paretic = 1.47, SE = 0.07), compared to their non-paretic hands (M non-paretic = 1.16, SE = 0.08) and the hands of TD children (M non-dominant = 1.16, SE = 0.07; M dominant = 1.06, SE = 0.06).
Jebsen-Taylor Test of Hand Function
ANOVA results further revealed that children with hCP had a significantly higher difference in JTTHF completion time between their two hands than did TD children (F3,24 = 8.836, p < 0.001, ηp2 = 0.546). Examining each hand individually, the JTTHF time for the paretic hands was significantly longer than for the non-paretic hands, or either the non-dominant or dominant hands of TD children (p ≤ 0.001 for all comparisons).
Correlational Analyses
Correlations between Assessments Across Participants.

JTTHF: Jebsen-Taylor Test of Hand Function; FI: force individuation; MI: movement individuation. Correlations and the significance of those correlations are presented for each combination of two different outcome measures.
Discussion
We quantified the hand function abilities of TD children and children with hCP, with specific attention to their ability to create independently force or movement with each digit of both hands. Within this cohort of TD children, we observed no significant difference in force or movement individuation of the digits between their dominant and non-dominant hands. While absolute values of individuation are difficult to compare across studies, due to differing tasks and metrics, our finding of no significant differences between the dominant and non-dominant hands of TD children is consistent with previous reports in adults for both movement individuation (Häger-Ross et al., 2000; Kong et al., 2019) and force individuation (Wilhelm et al., 2014). Also in accordance with past adult findings, our individuation for our TD participants tended to be greatest for the thumb (Häger-Ross et al., 2000; Lang et al., 2004a). This may be expected, since the thumb has the least amount of mechanical coupling with other digits (Lang & Schieber, 2004a); and it has less neurological coupling in that, in contrast to the fingers, it is not actuated by the multi-compartmental extrinsic finger muscles exhibiting synchronous activation (Fuglevand, 2011). The correspondence between this child and adult behavior may have been influenced by the ages of children in this study. Individuation capability first manifests months after birth (Kimmerle et al., 2010; Wallace & Whishaw, 2003), and dexterity develops throughout childhood (Shaklai et al., 2017); but force individuation, for example, approaches an adult ability level by age 10 years (Shim et al., 2007) and participants in this study ranged in age from 10–14 years old. Thus, it is reasonable to expect that some participants would have already attained moderate finger individuation capability.
Our results for children with hCP revealed significant deficits in force and movement individuation in comparison with values for TD children. Similar force individuation deficits in paretic hands were reported in adults with diplegic cerebral palsy (Kong et al., 2019). Deficits in force individuation were especially pronounced for the middle, ring, and pinky fingers, but not for the thumb despite the reliance of thumb sensorimotor control on cortical neurons likely to be impacted by CP. Overall, FI capability of TD children and children with hCP appeared to be reduced compared to neurotypical adults, although FI scores for the dominant hand in TD participants approached that of adults (Kapur et al., 2010). This diminished individuation was most pronounced for the paretic hands, but it extended to the non-paretic hands as well. A loss of individuation appeared to result from widespread activation of non-instructed digits, as the FI_DEV values were much greater for both the paretic and non-paretic hands of the children with hCP in comparison to both hands of TD children. This supposition is further supported by the HDEMG data, with children with hCP exhibiting a smaller separation in the activation centroids for the force productions with the index and middle fingers than TD children. It should be stated, however, that activation patterns were difficult to interpret as they often included multiple clusters of activation, in agreement with one study with neurotypical adults clusters (van Beek et al., 2018), although in contrast to another (Hu et al., 2015).
MI was also impacted in the paretic hands of children with hCP, but unlike for FI, the MI of the non-paretic hands was not significantly impacted when compared to the non-dominant and dominant hands of the TD children. This pattern of MI impairment is similar to previously reported results (Petra, 2011). Similarly, the spread of unintended movement (MI_DEV), was greater for the paretic hands than for non-paretic hands or the hands of TD children. MI deficits were similar for all digits across the paretic hands (except for the middle finger which had less impairment, due to excellent restraint of the index finger), despite the greater mechanical coupling among the middle, ring, and pinky fingers. Interestingly, values for the MI index were much lower than for FI across all participants. Although it is difficult to compare our study results with MI capabilities of neurologically intact and post-stroke adults, especially as study protocols vary and measurement of MI varies across studies (Lang et al., 2004a; Thielbar et al., 2014), both children with hCP and adults who were post-stroke showed MI capability with their non-paretic hands that is similar to the MI capability of the dominant hands of their peers (Lang & Schieber, 2004a). While biomechanical movement constraints may partially account for this, neurological control of individuated movement may also prove more challenging than individuated force control.
Movement and force individuation were significantly correlated with better task performance. Thus, training of individuation may prove to be a viable treatment for impaired fine manual dexterity among children with hCP, has been previously demonstrated for stroke survivors (Thielbar et al., 2014). Movement and force individuation were also significantly, although moderately, correlated. The extent to which FI and MI rely on common neural pathways remains to be determined.
Limitations and Directions for Further Research
Readers should appreciate limitations in generalizing these results from only four children with hCP to most other children with hCP; replications with larger participant numbers are needed to cross-validate and extend this research to include assessments of any modifications to these findings from gender or age. That said, the fact that we obtained evidence of statistically significant group differences in this small study attests to relatively large effect size differences, meaning that statistical power was not a chief concern. Further research is now needed to determine whether interventions for children with hCP can make meaningful changes in their individuation capacities.
A post-hoc power analysis suggested that this study was slightly underpowered (power of 0.747), perhaps partly due to the lower observed effect size of 0.639 compared to the effect size of 1.97 observed in others’ pilot data (McCall et al., 2019). Unfortunately, there was significant difficulty in recruiting children with hCP within the appropriate age range and hand function capability, despite significant support from local hospitals and rehabilitation clinics. In addition to the usual difficulties with recruiting children with hCP, pandemic related concerns during the period of this research resulted in almost 50% of scheduled children with hCP not participating in the study. The recruitment rate of participants with hCP was approximately one participant every 2.5 months.
The nature of the force and movement assessments may also limit translation to other situations. The force individuation assessment was performed with all fingers extended and resting on load cells, while movement individuation was measured by examining task-independent finger flexion/extension. While providing good standardization, these tests are not necessarily indicative of how finger individuation may be used functionally during real world tasks. The coincident motor control of the arm and hand that is needed for some tasks may further impede the ability to independently use each digit. The HDEMG data showed differences between TD children and children with hCP, but it was difficult to identify consistent spatial changes in activation patterns for different tasks. The widespread production of unintended finger forces meant that identifying the centroid of activation relevant to the intended finger was especially difficult, and the poor control of some fingers by children with hCP meant there was relatively little muscle activation for some finger presses. For both children with hCP and TD children, spatial EMG analysis and correlation of EMG activation with finger force production was further confounded by the coactivation of extensors as a strategy for undesirable flexor activation.
Conclusion
Despite a very small sample size of children with hCP in this study, these early data provide a strong indication that children with hCP may exhibit substantial individuation deficits in their paretic hands, and force individuation impairments in their non-paretic hands. These deficits seemed to arise from neurological coupling among muscles and muscle compartments that led to widespread involvement across all digits, when attempting individuated digit control. Therapy targeting individuation may improve fine motor performance in children with hCP, but this treatment avenue remains largely unexplored. Whether training force individuation in children impacts movement individuation and vice versa warrants further examination.
Footnotes
Acknowledgments
The authors acknowledge Miranda C. Ludovice's contribution to the development of the finger force measuring system.
Declaration of Conflicting Interests
The author(s) declared no potential conflicts of interest with respect to the research, authorship, and/or publication of this article.
Funding
The author(s) received no financial support for the research, authorship, and/or publication of this article.
Ethical Approval
The protocol was reviewed and approved by the Institutional Review Board of the University of North Carolina at Chapel Hill.