



Abstract
The neural strategies for movements of the lower extremities for landings from different landing heights in trained half-pipe snowboarders are not well known. We observed changes in brain activity as measured by electroencephalography (EEG) and lower limb muscle activity as measured by electromyography (EMG) in trained and untrained half-pipe snowboarders landing from different heights (30 and 60 cm). There were 12 trained male half-pipe snowboarders (HS) and 12 untrained participants (UP). We recorded EEG signals during motor preparation prior to dropping and EMG signals from right lateral rectus femoris (RF), tibialis anterior (TA), and gastrocnemius lateralis (GL) muscles during landings. Generally, theta power in the frontal cortex significantly increased in the preparation period compared to the resting state, while the alpha 1 and alpha 2 power values in central and parietal cortical areas decreased as dropping heights increased. Additionally, the HS group displayed greater magnitudes of change in power values in three frequency bands compared to the UP group. The HS group (relative to UP group) also showed higher normalized EMG amplitudes for RF and GL during contact, especially at 60 cm. The HS group (relative to the UP group) presented lower antagonist EMG activity and a higher GL/TA ratio at the 60 cm dropping height. Long-term specialized training might lead to greater neural modulation of predictive sensorimotor control and specific neuromuscular activation patterns during landing.
Introduction
Landing from a higher to a lower height is a task performed in many daily activities, and it is part of specialized movements in some athletic events. Such landings impose a major challenge on motor control prior to and during contact with the supporting surface. The potential neural control mechanisms and biomechanics of landing are complex, despite the seeming simplicity of this routine act. Although some studies have revealed some biomechanical characteristics of drop landing, including the prediction of the magnitude of vertical ground reaction force (vGRF) and the control of angles of multiple joints in lower limbs (Christoforidou et al., 2017; Santello et al., 2001), fewer studies have elucidated their underlying neural mechanism. A greater understanding of the sensorimotor control process mediating the biomechanical characteristics of drop landings is needed if we are to help athletes reach higher levels of performance in these activities.
The sensorimotor control process during a successful landing refers to a dynamic interaction between sensory information processing in the nervous system and motor output to perform postural control (Baumeister et al., 2013). Furthermore, some studies reported that motor preparation, planned in advance, is an important part of a drop landing task (Baumeister et al., 2013; Taube et al., 2012) . Researchers who have employed electroencephalography (EEG) to evaluate brain activity during sensorimotor tasks have found that changes in theta and alpha frequencies in the frontal, central, and parietal cortices may be sensitive indices of sensorimotor processing (Baumeister et al., 2008, 2013; Doppelmayr et al., 2008; Slobounov et al., 2000). Specifically, the amplitude of theta rhythms in the frontal cortex has been shown to increase with higher requirements for information processing during motor control, whereas decreases in slow alpha oscillations over broad cortical areas have been related to nonspecific attention and expectancy processes. Fast alpha rhythms are dominant in the parietal cortex and decline with neuronal activation in the somatosensory cortex. Additionally, theta and alpha rhythms in the frontal and parietal cortices are sensitive and predict sensorimotor control in drop landings (Baumeister et al., 2013). However, to our knowledge, there have been no studies of brain areas involved in predictive (i.e., preparatory motor activity) sensorimotor control for drop landings from different heights.
Half-pipe snowboarding is an increasingly popular winter sport. As participation and level of competition have increased, so have the number of injuries (Teh et al., 2003). Although untrained persons suffer from injuries due to higher landing heights (Teh et al., 2003), trained half-pipe snowboarders performing many landing exercises suffer fewer leg injuries, especially in the knees. This reduced incidence of injury may be related to trained half-pipe snowboarders having adopted special neural strategies to decrease the occurrence of knee injury during landing (Teh et al., 2003). Although some studies have reported that landing stability is related to leg stiffness (Christoforidou et al., 2017; Leukel et al., 2008), landing surface characteristics (Kamibayashi & Muro, 2006), and dropping heights (Peng, 2011; Peng et al., 2017; Santello & McDonagh, 1998), the different neural strategies that may be used by trained and untrained snowboarders when landing from different dropping heights are still poorly understood. To the best of our knowledge, only a few researchers have addressed this topic, and they have reported some interesting differences among trained athletes in how they approach landing from different dropping heights (Christoforidou et al., 2017). These investigators found that the landing strategy preferred by trained athletes is influenced by long-term and specialized training. However, these researchers only focused on the vGRF and EMG of lower limb muscles, tending to ignore brain activity as measured by EEG.
Our aim in this study was to examine how trained half-pipe snowboarders and untrained participants might adapt differently to landings. We hypothesized that trained half-pipe snowboarders might adopt special neural strategies. We measured EEGs of both groups during motor preparation prior to dropping, and we measured EMG in both groups from lower limb muscles of the same barefoot double-leg during landings from 30 cm and 60 cm heights.
Method
Participants
Means (and Standard Deviations) and Non-Significant Group Differences for Participant Characteristics.

Note. N/A represents Not Applicable.
Experimental Design
First, the participants performed a 20-minute full-body warm-up comprised of 10 minutes of jogging and 10 minutes of stretching (walking lunges, head rolls, and side twists). An EEG electrocap was attached to the participants’ heads, and then the EMG electrodes were placed on the targeted muscles. EEG signals were recorded at rest and during the preparation phase prior to drop landing. Recording of resting-state EEG signals began approximately 30 minutes after warm-up when the participants stood on the platform with their eyes open for two minutes. As for the preparing-state EEG measurement, all participants were instructed to intentionally prepare for the drop landing for 10 seconds before an auditory signal reminded them to immediately drop off the platform (Baumeister et al., 2013).
All participants were required to stand barefoot on a high platform with their heels at the edge of the platform and face a force plate (HUMAC Balance, USA) in front of the platform. They were asked to drop and land on the force plate while barefoot in landing positions (arms at their sides and knees bent to the angle of their choice). The participants were allowed to practice several times before formal data collection. They performed five successful landings each from 30 cm and 60 cm dropping heights (Bruening & Richards, 2006; Wallace et al., 2010) in a randomized sequence. The criterion for a successful trial was that the supporting feet landing on the plate showed no obvious motion during the entire trial. We averaged their performance over five successful trials to analyze the center of pressure (COP) and EMG data for each participant.
Experimental Procedures
Vertical Ground Reaction Force Data Collection and Processing
We used the HUMAC Balance System, which has a usable surface of 45 cm × 26.5 cm, to evaluate each participant’s vGRF. The force data were acquired at a sampling rate of 100 Hz. A low-pass filter at 10 Hz (a fourth-order and zero lag Butterworth filter) was applied after the measurement (Bruening & Richards, 2006). The peak vGRF was normalized to body mass to reduce intersubject variability. Normalization of the peak vGRF was calculated by dividing the average greatest GRF amplitude recorded for five successful landings at each dropping height and then dividing by body mass.
Center of Pressure Data Collection and Processing
The center of pressure (COP) variation and range during the period between initial foot contact with the force plate and the peak vGRF were calculated to observe differences in landing stability between the half-pipe snowboarders and untrained participants. The COP variation was calculated as the standard deviation of the COP for the medial-lateral (M–L) and anterior-posterior (A–P) axes. The COP range was calculated as the sum of the absolute maximum and minimum excursions of the COP for the M–L and A–P axes.
Electroencephalography Data Collection and Processing
We employed portable EEG equipment (eego™ sports, ANT Neuro, the Netherlands) to collect EEG data. A 32-channel EEG-Cap (Waveguard™, ANT Neuro, the Netherlands) was mounted according to the 10-20 system. The ground reference was positioned between FPz and Fz, and all electrodes were referenced to the CPz electrode. EEG signals were continuously digitized with a sampling rate of 1000 Hz and filtered with a bandpass filter from .01 to 100 Hz. By adjusting the injected gel, all electrode impedances were maintained at less than 5,000 ohms.
The subsequent offline processing and analysis of EEG data were completed using MATLAB (R2013b, MathWorks Inc., Natick, MA) and the EEGLAB toolbox. Briefly, large artefacts in EEG signals were removed through visual inspection, followed by downsampling to 250 Hz. Then, the EEG signals were bandpass filtered at .5–30 Hz. The processed EEG data were rereferenced again to the average of the left (M1) and right (M2) mastoids. The continuous EEG data were segmented into 2-second epochs. A baseline correction was applied to the whole epoch. Electrooculogram (EOG), EMG, and electrocardiographic (ECG) artefacts were eliminated using independent component analysis (ICA). Any epoch containing amplitudes exceeding ±80 μV at any electrode was excluded from further analysis. The artefact-free epochs were subsequently analyzed. We employed fast fourier transformation (FFT) to compute the power spectra of the artefact-free epochs during the resting and preparation periods of each drop landing with a frequency resolution of 0.5 Hz using the Hanning window function based on the Welch technique. According to previous studies (Babiloni et al., 2009, 2011), the following frequency bands were selected: theta (4–8 Hz), alpha 1 (8–10.5 Hz), and alpha 2 (10.5–13 Hz). Additionally, according to Baumeister et al. (2013), EEG electrodes covering three topographical regions of interest were selected: (a) mid-frontal (F3, Fz, and F4), (b) central (C3, Cz, and C4), and (c) mid-parietal (P3, Pz, and P4).
Electromyography Data Collection and Processing
A wireless EMG system (Noraxon, Scottsdale, Arizona, USA) was used to collect EMG signals from three representative right lower extremity muscles, including the rectus femoris (RF), tibialis anterior (TA), and gastrocnemius lateralis (GL). Round-shaped bipolar surface Ag/AgCl electrodes with a 1 cm diameter and a 2 cm interelectrode distance were placed over the middle of the muscle belly along the longitudinal axis, which was confirmed by palpating the muscle bulk during a brief maximal isometric contraction, according to the SENIAM guidelines (Hermens et al., 2000). The skin was shaved and cleaned with a 60% alcohol solution to maintain skin impedance. The raw EMG signals were recorded at a sampling rate of 2000 Hz and bandpass filtered at 8–500 Hz. Cables were strapped to the lower limbs with elastic bandages to reduce the effect of motion artefacts. For EMG signal processing, first, the raw EMG signals were high and low-pass with cut-off frequencies of 10 and 300 Hz (Santello & McDonagh, 1998), respectively, followed by full-wave rectification to reduce the effect of landing movement artefacts.
In this study, all EMG data were normalized to the amplitude during a maximal voluntary contraction (MVC). In the present study, the method of MVC techniques was adopted from Konrad (2005). The MVC test was conducted for each muscle separately. MVCs were performed against static resistance. The participants were given verbal encouragement during the two maximal isometric efforts for three seconds with a 3-minute rest. The average of the maximal EMG amplitude of each muscle was calculated. Finally, EMG values were normalized and reported as percentages of the reference value of MVC EMG. To avoid having the MVC test influence brain activities, we conducted the MVC test after completion of all dropping experiments. In this study, EMG activities during the period between initial contact and peak vertical ground reaction force were analyzed. The coactivation index was defined as the GL/TA EMG ratio.
Statistical Analysis
We used GraphPad Prism 8.3.0 and SPSS 19.0 software for statistical analyses. In this study, a two-factor (Group: HS vs. UP by Height: 30 vs. 60 cm) analysis of variance (ANOVA) was performed to test the significance of differences in peak vGRF, COP, and EMG. We used the power of different EEG rhythms as an independent variable in a two-way ANOVA for the two Group levels (HS vs. UP) × the two dropping Heights (30 vs. 60 cm) to assess differences in cortical activity under different conditions. Significant main effects and interactions were examined with the post hoc Sidak test to correct for multiple comparisons. All data conformed to a normal distribution and homogeneity of variance prior to conducting ANOVAs. Effect sizes were reported as Cohen’s d (d) for comparing two means and partial eta squared (η2) for ANOVA. The mean difference (MD) (PRE-REST) in changes in brain activity between the resting (REST) and preparation (PRE) periods was described. The significance level was set to p < .05.
Results
Peak Vertical Ground Reaction Force
Significant main effects of Group, F(1, 22) = 53.18, p < .0001, η2 = .340, and dropping Height, F(1, 22) = 170.8, p < .0001, η2 = .456, were observed. As presented in Figure 1, the normalized peak vGRF was significantly higher among the half-pipe snowboarders than in the untrained participants, regardless of whether the dropping height was 30 cm (corrected p < .0001, d = 2.87) or 60 cm (corrected p < .0001, d = 2.24). Moreover, the normalized peak vGRF significantly increased with an increase in dropping height for the HS (corrected p < .0001, d = 2.78) and UP (corrected p < .0001, d = 2.99) groups. Average Values for Normalized Peak vGRF Normalized to Body Weight for Each Group (HS and UP) and Each Dropping Height (30 and 60 cm).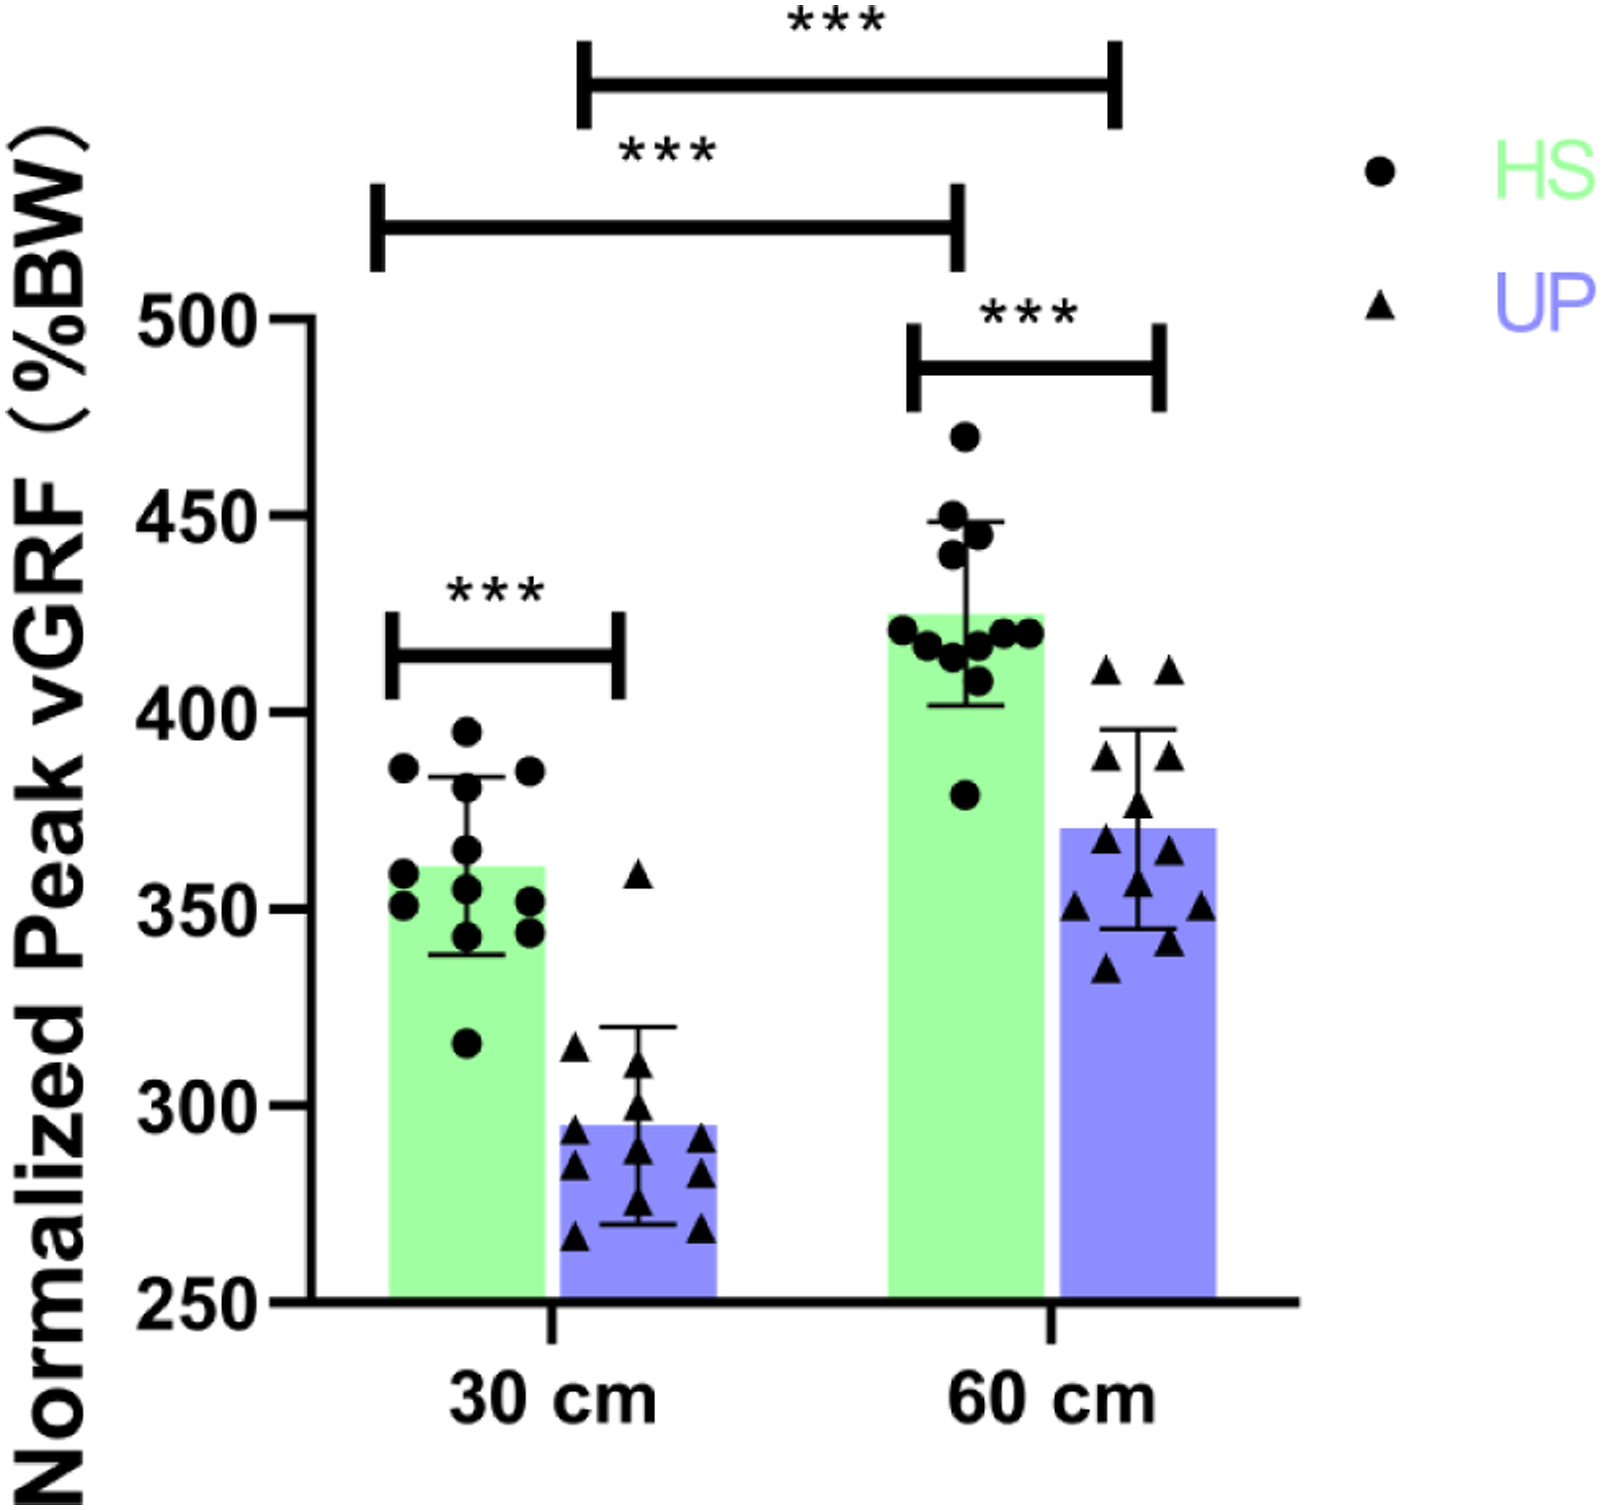
Center of Pressure
As illustrated in Figure 2, significant group effects on the COP variation (Figure 2a), F (1, 22) = 4.325, p = .049, η2 = .143, and COP range (Figure 2c), F (1, 22) = 7.922, p = .010, η2 = .209, in the M-L axis were observed. However, the changes in COP in the A-P axis were more dominant. Significant Group effects, F(1, 22) = 9.793, p = .0049, η2 = .182, on the COP variation, F(1, 22) = 7.941, p = .010, η2 = .296, were observed on the COP range in the A-P axis and a dropping Height effect, F(1, 22) = 13.30, p = .0014, η2 = .078, was observed on the COP range in the A-P axis (Figure 2b and d). Briefly, multiple comparisons revealed the following findings: COP variation: UP > HS (corrected p = .043, d = .761) at 60 cm in the M-L axis (Figure 2a); UP > HS (corrected p = .0023, d = 1.37) at 60 cm in the A-P axis (Figure 2b); 60 cm > 30 cm (p = .048, d = .736) in the A-P axis in the UP (Figure 2b). COP range: UP > HS (corrected p = .008, d = 1.22) at 60 cm in the M-L axis (Figure 2c); UP > HS (corrected p = .009, d = 1.22) at 60 cm in the A-P axis (Figure 2d); 60 cm > 30 cm (corrected p = .0057, d = .732) in the M-L axis in the UP (Figure 2c); 60 cm > 30 cm (p = .0063, d = .726) in the A-P axis in the UP (Figure 2d). Mean Values for COP Variation in the Medial-Lateral Axis (M-L) (a) and Anterior-Posterior (A-P) Axis (b) and COP Range for the Medial-Lateral (M-L) Axis (c) and Anterior-Posterior (A-P) Axis (d) in Each Group (HS and UP) and at Each Dropping Height (30 and 60 cm).
Electromyography Activity
The EMG activity of RF, GL, and TA is shown in Figure 3. The Group, F (1, 22) = 9.081, p = .0064, η2 = .09, and dropping Height, F(1, 22) = 51.67, p < .0001, η2 = .464, significantly altered the normalized EMG amplitude of RF, which generally increased with increasing height and performance level (Figure 3a). Similar to the RF, the GL also presented the same effect of the Group, F(1, 22) = 12.49, p = .0019, η2 = .144) and dropping Height, F(1, 22) = 32.76, p < .0001, η2 = .339, (Figure 3b). However, the comparison of EMG activity in TA between HS and UP differed for GL and RF, which showed a lower EMG amplitude in the HS compared to that in the UP (Figure 3c), especially at 60 cm (corrected p = .034, d = 1.04). Significant effects of the Group, F(1, 22) = 4.843, p = .038, η2 = .07, and dropping Height, F(1, 22) = 15.66, p = .0007, η2 = .244, on the EMG activity of TA were observed. We also calculated the GL/TA EMG ratio. A significant effect of the Group on the GL/TA ratio, F(1, 22) = 14.49, p = .001, η2 = .258, was observed, but HS > UP only occurred at 60 cm (corrected p = .0037, d = 1.8) (Figure 3d). Average Values for the Normalized EMG Amplitude Normalized to the Amplitude of MVC for the Rectus Femoris (RF) (a), Gastrocnemius Lateralis (GL) (b), Tibialis Anterior (TA) (c), and Gastrocnemius Lateralis/Tibialis Anterior (GL/TA) Ratio (d) for Each Group (HS and UP) and Each Dropping Height.
Cortical Activity
EEG Power Values of Theta, Alpha 1, and Alpha 2 Oscillations in Frontal, Central, and Parietal Cortices during Rest (REST) and Preparation (PRE)

Note. MD represents the mean difference between REST and PRE (REST-PRE); * and ** represent corrected p < 0.05 and p < 0.01 between REST and PRE, respectively; & and && represent comparisons to the 30 cm height in MD, corrected p < .05 and p < .01; # and ## represent comparisons with the 60 cm height in MD, corrected p < .05 and p < .01, respectively. M, SE, and 95% IC represent mean values, standard error, and 95% confidence intervals, respectively.
Discussion
In the present study, we explored the EMG and EEG dynamics of the landing mechanism for trained snowboarders and untrained participants by comparing the EMG of their lower extremities during landing and their EEG cortical activity prior to drop landing from different drop heights. We found that long-term specialized training for half-pipe snowboarders modified landing biomechanics, relative to untrained participants, as reflected in a higher peak vGRF and smaller COP range, and more effective neuromuscular modulation as evidenced by lower agonist/antagonist EMG ratio of lower limb muscles. Regarding the brain activity of trained snowboarders and untrained participants, we observed increased theta band power values in the frontal cortex and decreased alpha 1 and alpha 2 band power values in the central and parietal cortices in the landing preparation period compared to the resting state in both groups. Notably, however, the magnitude of changes in the theta, alpha 1 and alpha 2 band power values increased with increasing drop height, and the trained half-pipe snowboarders showed greater amplitudes of change in power values for three frequency bands between REST and PRE, compared to the untrained participants.
Peak Vertical Ground Reaction Force
Although half-pipe snowboarders were familiar with the landing tasks, they showed a significantly higher peak vGRF (by 20%) than the untrained participants, regardless of the 30 cm or 60 cm drop heights. Our result is consistent with that of other studies (Christoforidou et al., 2017; Saunders et al., 2014; Seegmiller & McCaw, 2003). Saunders et al. (Saunders et al., 2014) compared the difference in peak vGRF when landing from a 20 cm platform between figure skaters and nonskaters, and found that figure skaters exhibited a significantly higher normalized peak vGRF (3.50 × bodyweight for skaters vs. 3.13 × bodyweight for non-skaters), with skaters showing an approximately 15% higher peak vGRF. However, these investigators did not compare other drop heights. Seegmiller and McCaw (2003) observed differences in peak vGRF when landing from 30, 60, and 90 cm drop heights between gymnasts and recreational athletes. Gymnasts showed a greater peak vGRF at 60 and 90 cm heights. However, in this study, no significant group difference was observed at the 30 cm drop heights. They postulated that the lower height (30 cm) was not sufficient to induce a significant effect. Christoforidou et al. (2017) studied the effects of trained girl gymnasts versus untrained girls at varied drop heights (20 vs. 40 vs. 60 cm) on the vGRF. Trained gymnasts had a greater vGRF during landing for all examined drop heights. This finding was also consistent with our results. However, to the best of our knowledge, no prior investigators reported the peak vGRF for half-pipe snowboarders relative to untrained participants when landing from different heights. When the values for athletes in other sports, such as gymnastics, have been reported, trained gymnasts had a greater peak vGRF than untrained participants (Christoforidou et al., 2017; McNitt-Gray, 1993; Seegmiller & McCaw, 2003). These researchers proposed that trained gymnasts develop a special landing strategy by stiffening their muscle-tendon unit to a greater extent than untrained participants, perhaps contributing to their higher peak vGRF. Based on the results from these studies, we would expect that the greater peak vGRF we observed among half-pipe snowboarders is also associated with greater stiffening of their muscle-tendon units.
Center of Pressure
In this study, we observed interesting modifications of COP among our participants. First, the degree of sway of COP for the A-P axis was higher than that of the M-L axis in both our participant groups. Since the body leans slightly forwards during standing, the main stabilization in the sagittal plane is maintained by the plantar flexors, which pulls the body backwards against gravity (Borg et al., 2007). Additionally, compared to untrained participants, half-pipe snowboarders showed a lower degree of sway of COP during landing, regardless of whether drop heights were 30 or 60 cm. At the same time, the untrained participants presented a higher degree of sway of COP during landing at 30 cm compared to 60 cm drop heights. We speculate that the better landing performance of half-pipe snowboarders, as shown in the COP during landing, might be related to the long-term specialized training of half-pipe snowboarders.
Electromyography
The EMG data indicated that myoelectric activity of lower limb muscles increased during landing for both half-pipe snowboarders and untrained participants when drop heights increased, which may be a neural mechanism underlying knee and ankle joint stiffness (Arampatzis et al., 2003; Santello & McDonagh, 1998). Our results are consistent with Christoforidou et al. (2017), who found that normalized EMG values relative to peak EMG during landing at the 60 cm height increased with an increase in dropping height from 20 to 60 cm, among both trained gymnasts and untrained controls. Notably, the half-pipe snowboarders in this study showed more prominent EMG activity in lower limb muscles during landing, especially at the 60 cm drop height, than did untrained participants. We assume that this difference might be related to the increased amount of forces that these trained participants exerted during landing. Additionally, the EMG amplitude of TA in the trained half-pipe snowboarders was lower than that in the untrained participants at the 60 cm drop height. According to previous studies (Arampatzis et al., 2003; Christoforidou et al., 2017), TA, which acts as an antagonist during landing, plays an important role in maintaining body stability. The level of agonist and antagonist coactivation has been used as an index to evaluate joint stability and force distribution around the joint (Tam et al., 2017). Furthermore, some researchers found that people with less training experience and/or worse motor techniques exhibited enhanced antagonistic EMG activity of lower limb muscles when performing landing tasks (Christoforidou et al., 2017; Lazaridis et al., 2010). Therefore, we calculated the agonist/antagonist EMG ratio to further explore the difference in neural strategies of lower limbs from different landing heights between the untrained participants and the half-pipe snowboarders. We found that the GL/TA (agonist/antagonist) EMG ratio was lower in the untrained participants than in the half-pipe snowboarders, and the coactivation index markedly increased in the untrained participants when the dropping height increased from 30-60 cm. This result might be due to the relatively poorer technique during landing of the untrained participants who increased neural modulation of TA during landing to obtain a more stable landing, perhaps leading to a less efficient landing than that of the trained half-pipe snowboarders.
Brain Activity
Preparation is an important phase of a drop landing task. Instead of sensorimotor control relying on the principle of online sensory feedback sensation, advanced motor preparation planning was not altered by online peripheral sensory feedback prior to ground contact (Taube et al., 2012). The central nervous system (CNS) precisely controls the muscles for self-initiated landings, most likely through an internal model of the dynamics of the limbs (Kawato, 1999). The calculated sensory information from this model is predictively integrated into movement preparation. Theta rhythms show a prominent distribution in frontal cortical areas during sensorimotor control (Baumeister et al., 2012; Kay, 2005) and high-skilled sports (Baumeister et al., 2008; Doppelmayr et al., 2008). Some studies based on fMRI and cortical source analysis indicate that the source location of theta oscillations is the anterior cingulate cortex (ACC) (Doppelmayr et al., 2008; Gevins et al., 1997), which is associated with executive attention. Executive attention refers to control and regulation neural activity that, in turn, is related to task complexity (Baumeister et al., 2008). Thus, theta power values may be an indicator of neural activation in the ACC related to increased attention activity in frontal cortical areas (Smith et al., 1999). In the current study, both groups of our participants showed higher frontal theta power values in the preparation period with an increase in the drop heights, perhaps reflecting a higher attentional control for a successful landing at a higher drop height level. The predictive calculation and integration of information for landing result in a higher processing demand that leads to these higher theta values. Some evidence is available to support our results. Baumeister et al. (2013) showed that theta oscillations in the frontal cortex are sensitive predictors of the sensorimotor control of drop landings. Additionally, Smith et al. (1999) observed an increase in frontal theta power with increased complexity during a sensorimotor control task. Sauseng et al. (2007) explored the relevance of complex motor behavior and its relation to frontal theta rhythms, and they found that theta long-range coupling, including frontal and parietal cortices, played a role in integration of sensory information into executive control components of complex motor behavior. Therefore, the frontal theta power values we observed might sensitively reflect the alterations in cortical activity during the preparation period prior to drop landings. In addition, long-term practice might induce cortical plasticity in practitioners, including alterations in cortical activity such as theta rhythms (Doppelmayr et al., 2008; Haufler et al., 2000). Haufler et al. (2000) reported a higher theta power in expert shooters than in novices, showing the strongest effects on frontal sites (F3 and F4). Similarly, Doppelmayr et al. (2008) reported a steady increase in theta power for the last three seconds before the shot for experts, but not for novices. Generally, these authors assumed that elite marksmen have a higher degree of attentional focus. The results of our study are similar, showing stronger activation of theta power in the frontal cortex of trained half-pipe snowboarders during preparation prior to drop landing compared to untrained participants.
In addition to the theta rhythms, we also found that the preparation for a landing might be sensitive to the power values of alpha 1 and alpha 2 in central and parietal cortices. In prior research movement preparation and execution were characterized by a decrease in alpha frequency over the sensorimotor area, i.e., event-related desynchronization (ERD) (Neuper et al., 2006; Pfurtscheller et al., 1996). Experimental data from several studies imply that alpha ERD represents an electrophysiological correlate of activated brain areas related to information processing, selective attention, and motor preparation (Pfurtscheller & Klimesch, 1992; Pfurtscheller et al., 1996). The magnitude of the ERD reflects the large neural networks involved in the performance of a specific task. For example, task complexity increases the ERD magnitude (Dujardin et al., 1995). Our data support this finding. The magnitude of decrease in alpha 1 and alpha 2 power values and magnitude of increase in theta power values were more significant at higher drop height (60 cm) than at the 30 cm drop height during preparation compared to the resting state. Thus, we speculate that a greater information-processing demand during the preparation for a drop landing is required at a higher drop height.
Our trained half-pipe snowboarders showed a greater magnitude of decreased alpha power in the central and parietal cortical areas during the preparation period than did our untrained participants. Behmer and Jantzen (2011) also found that elite musicians presented significantly greater decreases in alpha rhythms (10–12 Hz) than nonmusicians when observing sheet music and musical performances. The magnitude of alpha ERD is closely associated with the capacity to process information. An explanation for this finding in our study may be that the trained half-pipe snowboarders had a higher capacity for information processing during preparation prior to a drop landing, especially at a higher dropping height, than did the untrained participants. We interpret our data to indicate that the trained half-pipe snowboarders were better able to allocate cortical resources (Behmer & Jantzen, 2011). Therefore, we suggest that the trained half-pipe snowboarders employ specific neural strategies during the preparation period for drop landing.
Limitations and Directions for Further Research
Although we obtained some interesting results from the present study, an important limitation of our study was the lack of high-speed motion capture, preventing us from obtaining kinematic data for the lower limbs during landing. This limitation contributes to an incomplete explanation of some of our results. Therefore, we recommend that future researchers employ high-speed motion cameras to capture kinematic characteristics of lower limb joints during landing from different dropping heights, combined with kinetic data, to further clarify the landing mechanism for trained snowboarders and untrained participants. Furthermore, future researchers might improve on our design by conducting the experiment in a snow environment and with a snowboard and boots. Also, although resting-state EEG measurement began approximately 30 minutes after warm-up, and there may be a potential impact of warm-up on the brain activity analysis at rest. This too might be improved in future research.
Conclusion
In this study, we found it to be likely that long-term specialized training for half-pipe snowboarders results in modifications in landing biomechanics, as reflected in their higher peak VGRF, smaller COP range and more effective neuromuscular modulation than untrained participants. Half-pipe snowboarders exhibit better adaptability when landing at height, especially at 60 cm. Additionally, the EEG data indicate variations in theta and alpha power values in frontal, central and parietal cortices during preparation for landing from different dropping heights, which may be related to attentional control and information-processing demands.
Footnotes
Declaration of Conflicting Interests
The author(s) declared no potential conflicts of interest with respect to the research, authorship, and/or publication of this article.
Funding
The author(s) disclosed receipt of the following financial support for the research, authorship, and/or publication of this article: This work was supported by the Project of China Talent Research Association (ZRH-2112).
