
Abstract
In addition to language, the human voice carries information about the physical characteristics of speakers, including their body size (height and weight). The fundamental speaking frequency, perceived as voice pitch, and the formant frequencies, or resonators of the vocal tract, are the acoustic speech parameters that have been most intensely studied for perceiving a speaker’s body size. In this study, we created sine-wave (SW) replicas of connected speech (sentences) uttered by 20 male and 20 female speakers, consisting of three time-varying sinusoidal waves matching the frequency pattern of the first three formants of each sentence. These stimuli only provide information about the formant frequencies of a speech signal. We also created a new experimental condition by adding a sinusoidal replica of the voice pitch of each sentence. Results obtained from a binary discrimination task revealed that (a) our SW replicas provided sufficient useful information to accurately judge the speakers’ body height at an above chance level; (b) adding the sinusoidal replica about the voice pitch did not significantly increase accuracy; and (c) stimuli from female speakers were more informative for body height detection and allowed higher perceptual accuracy, due to a stronger correlation between formant frequencies and actual body height than stimuli from male speakers.
Introduction
The human voice, which serves as the raw material for spoken language, not only carries language information but also provides considerable information about the speaker’s physical appearance, personality, and social characteristics. Extensive research has addressed the relationship between the voice and human listeners’ perceptual accuracy of the physical characteristics of the speaker (particularly the body size) (Bricker & Pruzansky, 1976; for a review see Kreiman & Sidtis, 2011). Considering people of different ages and sexes, investigators have observed significant correlations between some acoustic parameters of voice, such as the average fundamental frequency (F0) and formant frequencies, and the speaker’s body size (Fitch & Giedd, 1999). However, among same sexed adults, correlations have been much weaker (González, 2006).
The voice is produced by vocal folds within the larynx, and it is subsequently filtered by the supralaryngeal vocal tract, giving rise to different formants or resonant frequencies (Fant, 1960). The vocal folds vibrate to produce the fundamental frequency (F0), perceived as voice pitch. As an individual grows, the vocal folds also grow, lowering F0. For this reason, adult voices are deeper than children’s voices; and, as women are, on average, shorter than men, their vocal folds are also shorter, making the pitch of a woman’s voice higher on average than that of a man’s voice. However, within the same sex/age group, the length of the vocal cords bears little relation to height. That is, a tall man does not necessarily have longer vocal cords than a short man, and the same goes for women.
However, beyond pitch alone, the formant frequencies seem to be more informative than F0 about the speaker’s body when distinguishing individuals within the same age/sex group. Formants are the resonant frequencies of the vocal tract, and, as the vocal tract length increases, the formant frequencies decrease, and vice versa (Fitch, 2000). The vocal tract is more constrained than the vocal folds by anatomical structures that are closely related to aspects of body size, including the skull or the skeleton and body length. Consequently, moderate negative correlations have usually been observed between formant frequencies and the speaker’s body size (Bruckert et al., 2006; González, 2004; 2006; Pisanski et al., 2014b). On the other hand, correlations between F0 or voice pitch and body size among people of the same sex/age have been found to be very weak or virtually nil, because vocal folds are made of soft tissue (Bruckert et al., 2006; González, 2006; Künzel, 1989; Pisanski et al., 2014b; Van Dommelen & Moxness, 1995).
Researchers have demonstrated that human listeners can roughly infer a speaker’s body height, based on the formant frequencies of the voice (Kreiman & Sidtis, 2011). Unexpectedly, researchers have also revealed that listeners mistakenly infer the speaker’s height based on voice pitch (F0) in that they have exhibited a consistent misattribution bias by tending to associate low F0 with tall people and high F0 with short people (Feinberg, et al., 2005; Pisanski & Rendall, 2011; Pisanski et al., 2014b; Rendall, et al., 2007; Van Dommelen & Moxness, 1995). Likely, this bias results from an overgeneralization of the physical principle that large or long objects produce low-frequency vibrations, whereas small or short objects produce high-frequency vibrations.
Because voice pitch barely correlates with body size, one would expect that adding pitch information to formant information would not increase accuracy in body size perception. However, Pisanski et al. (2014a) found that although men’s voice pitch and physical height were unrelated, the accuracy of the listeners’ size assessments from Canadian vowels increased in the presence versus absence of pitch information.
In the present study, we used sine-wave (SW) replicas of Spanish sentences to provide new unique acoustic information from formant frequencies, and we included a new condition in which we added pitch information. The sine-wave (SW) replicas or sinusoidal speech were first used as experimental stimuli and published in Science by Remez, et al. (1981). Despite the apparently unnatural speech quality in these replicas, researchers have demonstrated that this type of signal is perfectly intelligible for people with normal hearing, and it allows talker identification (Remez et al., 1981; Remez, et al., 1997; Remez, et al., 1994; for a recent review see Remez, 2021). The SW speech consists of time-varying sinusoidal patterns that follow the trajectories of formant frequencies. As they are “pure” sinusoids that follow the paths of the formants, they only carry information about the frequency pattern of the formants (and the amplitude envelope), omitting any other type of information provided by the human speech. To our knowledge, we are the first to use this type of stimulus in an experiment on the perception of the speaker’s body size (height) from listening to the speaker’s voice.
Method
Participants
Listening participants were 88 young adults of both sexes (77 females; 11 males; age range 17–39 years; M age = 19.56, SD = 3.68). All participants were undergraduate psychology students at the University Jaume I (Spain), who were compensated with course credit. All of them voluntarily participated and provided their informed consent. The experimental procedure applied was in accordance with the Deontological and Ethical Committee for studies involving human participants.
Materials
The content of voice stimuli consisted of a Spanish interrogative sentence (‘¿Cuántos años tiene tu primo de Barcelona?’ [How old is your cousin from Barcelona?]) recorded from 40 young adult speakers, 20 men and 20 women, who had been university students several years ago, unknown to the participants. These recorded voices were selected from a pool of voice recordings (González & Oliver, 2005) and they were used in other work (González-Alvarez & Sos-Peña, 2022); the speakers’ heights had been measured with a metric tape affixed to the wall (see Appendix), with male speakers’ heights ranging from 160–189 cm M height = 176.9, SD = = 6.3 cm), which approximates that of the general population of men in Spain (M height = 176.6 cm; NCDRISC, 2018). The range of heights of the selected female speakers was 154–175 cm (M height = 163.4, SD = 7.5 cm), approximating that of the general population of women in Spain (M height = 163.4 cm; NCDRISC, 2018). All recorded speakers also provided their informed consent for research participation. From each recording, three types of stimuli were derived.
Natural Sentences
The sentences were recorded in a sound-attenuated booth with a Shure SM58 microphone at an approximate distance of 12 cm from the mouth, and a Sony-TCD D-8 digital audiotape (DAT) recorder with a sample frequency of 44.1 kHz. Then, the speech signal was digitally transferred to a PC computer and converted to 16-bit WAV files. Finally, the files were equated in RMS (root mean square) amplitude. The information in the Appendix shows the main acoustic parameters from each speaker’s sentence obtained by means of Praat software (Boersma & Weenink, 2016).
Sine-Wave Replicas
From each natural sentence, we created a sine-wave (SW) replica composed of three time-varying sine waves matching the frequency pattern of the first three formants (F1-F3) (see Figure 1). We followed González and Oliver (2005) in our method of creating these sine-wave replicas using the Praat software (Boersma & Weenink, 2016) and applying a Praat script provided by Chris Darwin at: http://www.lifesci.sussex.ac.uk/home/Chris_Darwin/Praatscripts/SWS Spectrograms of Three Examples of Experimental Stimuli. Note: (a) Natural (N) sentence (‘¿Cuántos años tiene tu primo de Barcelona?’ [How old is your cousin from Barcelona?]) uttered by a male speaker. (b) Sine wave (SW) replica derived from the above natural sentence composed by three sine waves following the frequency pattern of the first three formants (F1-F3). (c) Sine wave replica + Pitch (SWP), the same replica with the Pitch or Fundamental Frequency (F0) of the natural sentence added. (b) and (c) are scaled up in the vertical axis; the soft vertical stripes of C correspond to the beginnings and ends of the pitch wave.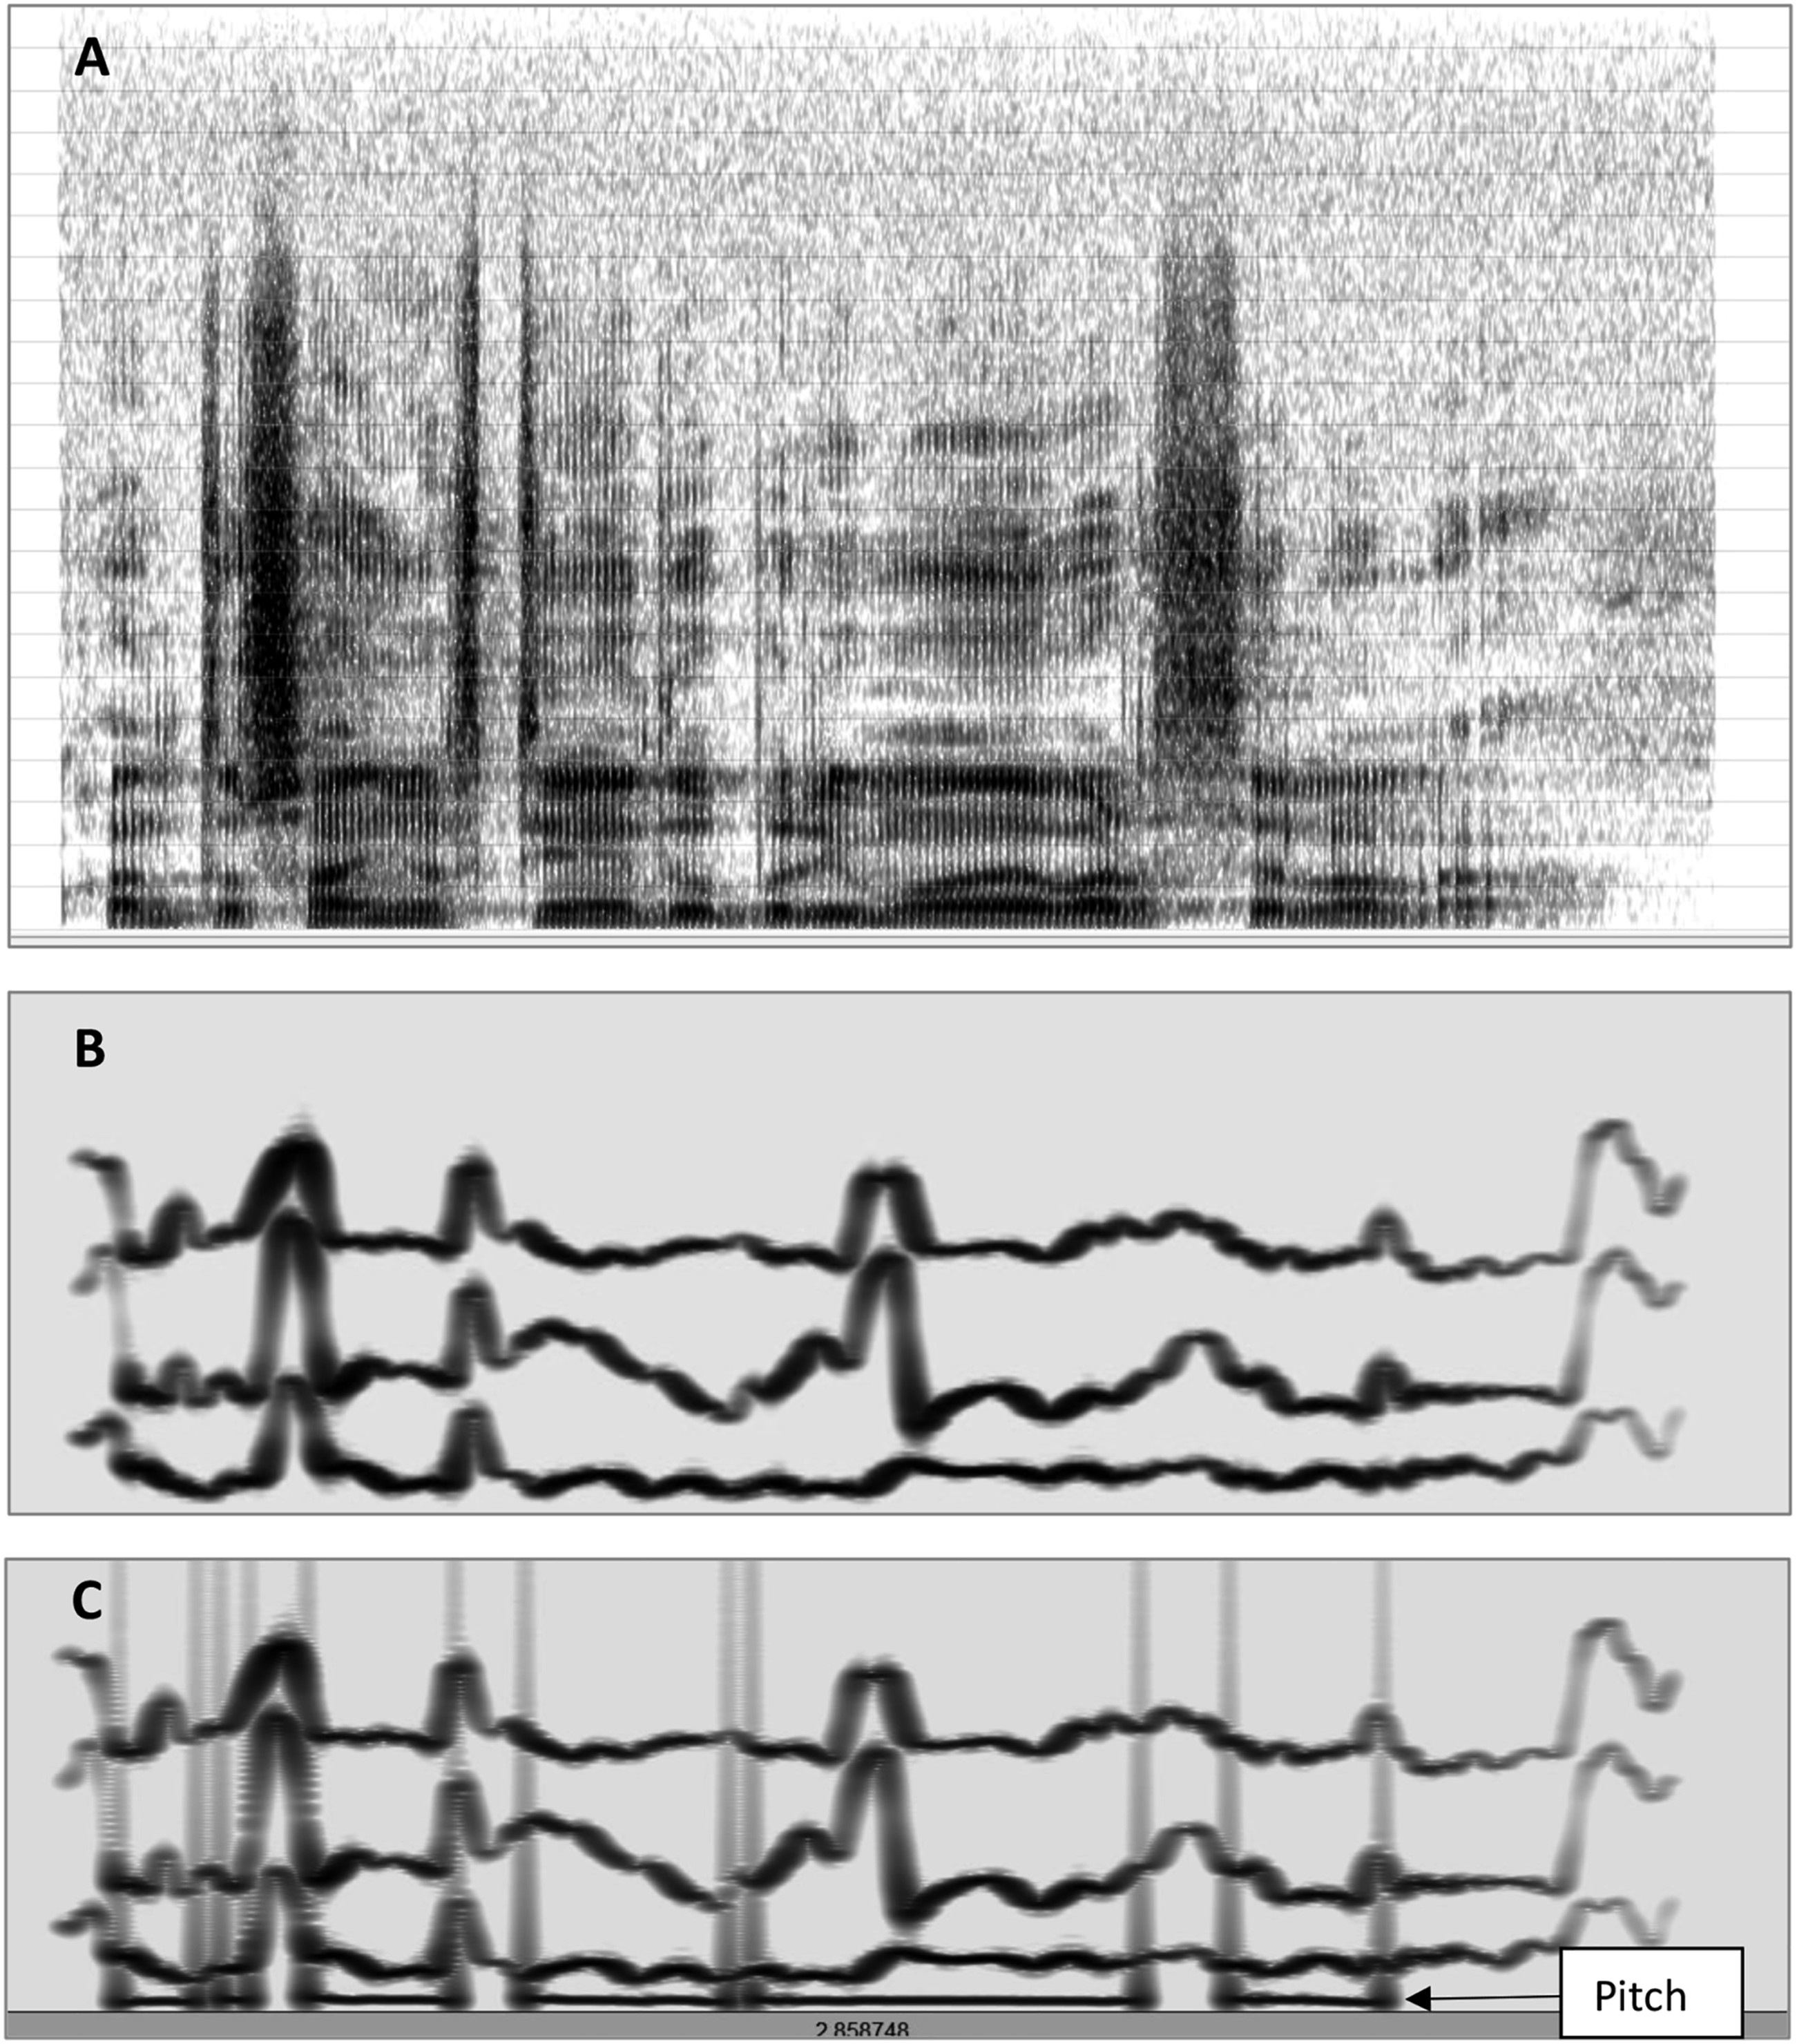
Sine-Wave Replicas + Pitch
From each sine-wave replica, we created a new stimulus by adding a sine wave corresponding to the voice pitch, or fundamental frequency (F0) of the natural sentence. Pitch was extracted from each natural sentence using the Praat software (Boersma & Weenink, 2016), and we applied an algorithm that performed an acoustic periodicity detection on the basis of an accurate autocorrelation method, as described in Boersma (1993).
Pairing of Speech Stimuli
We created 240 pairs of stimuli, 40 for each experimental condition (N, SW, SWP) by speaker’s sex (males, females). In each experimental condition by sex of the speakers there were 20 different speakers. Of the total of (20 x 19)/2 = 190 possible different pairs of speakers, 40 pairs were randomly chosen with the only condition that their heights did not differ by less than five centimeters. Each pair was formed by two different stimuli belonging to the same type of stimulus and the speaker’s sex, separated by 800 ms of silence. The N/male condition was formed by 40 different pairs of natural sentences from male speakers, whose height differences ranged from 5 – 19 cm (M height difference = 9.3, SD = 3.9 cm); half of the pairs included the taller man in the first place, and half included the taller man in the second place. The N/female condition was formed by 40 different pairs of natural sentences from female speakers, whose height differences ranged from 9 – 17 cm (M height difference = 13.9 SD = 3.0 cm); half of the pairs included the taller woman in the first place, and half included the taller woman in the second place. The pairs of speakers were the same for the other two experimental conditions (SW, SWP). These 240 pairs were divided into four sets of 60 pairs (10 per each type of stimuli x speaker sex), to ensure that neither pair of speakers was repeated within the same set.
Procedure
Each participant was randomly assigned to one of the four sets of stimuli, resulting in a total of 60 size assessment trials per participant. No pair of speakers was repeated for any participant. Participants individually performed the experiment in six short sessions of ten stimuli of the same type of stimulus/speaker sex condition. The order of the sessions was randomized through the participants, although the first session was always with natural sentences (N). At the beginning of each session, participants were informed as to whether the speakers were men or women.
On each trial, participants were presented, through headphones, with the voices of two speakers’ of the same stimulus condition (N, SW, SWP) and speaker’s sex (males or females). Voices were played consecutively and separated by 800 ms of silence. After listening to the pair of voices, participants were asked to indicate which of the two voices belonged to the taller speaker by selecting the corresponding button on the screen. On each trial, participants could listen to the pair of voices again at will by clicking on a play button. In the SW and SWP conditions, participants were told that the voices were distorted but belonged to real people.
Statistical Analyses
The data were analyzed using the Statistical Package for Social Sciences (SPPS, version 29; IBM Corp, NY, 2022). For each participant, we obtained the average percentage of correct answers in each experimental condition and speaker sex. These data were analyzed by submitting the SDs and the confidence intervals [95% CI] to an analysis of variance (ANOVA) to study the significance of the main factors and their interactions. We also calculated the values of the partial eta squared (η2p) to measure the effect size of the variables in the ANOVA model. This parameter calculates the proportion of variance explained by a given variable of the total variance. The effect size interpretations for η2p values are: .01 = small, .06 = medium, and .14 = large (Cohen, 1988).
Results
Figure 2 shows the proportions of accurate judgments of speaker height for each stimulus condition (Natural sentences, N; Sine-wave replicas, SW; Sine-wave replicas + Pitch, SWP), separated by the speaker’s sex. Keeping in mind that the chance level for this binary discrimination level was 0.500, every value was significantly higher than chance, except for the SW-males condition (.516; p = .404). Total values indicated that Natural sentences reached the highest level of accuracy, .643, 95% CI [.617, .668], followed by the Sine wave + Pitch condition, .564 [.534, .593], and the Sine wave condition, .559 [.530, .587]. Mean Proportions Correct in a Binary Discrimination Task on the Speakers’ Body Height. Note: Data separated by experimental conditions (Natural sentences, Sine waves replicas, and Sine waves + Pitch) and speakers’ sex. Error bars represent plus and minus one standard error of the mean.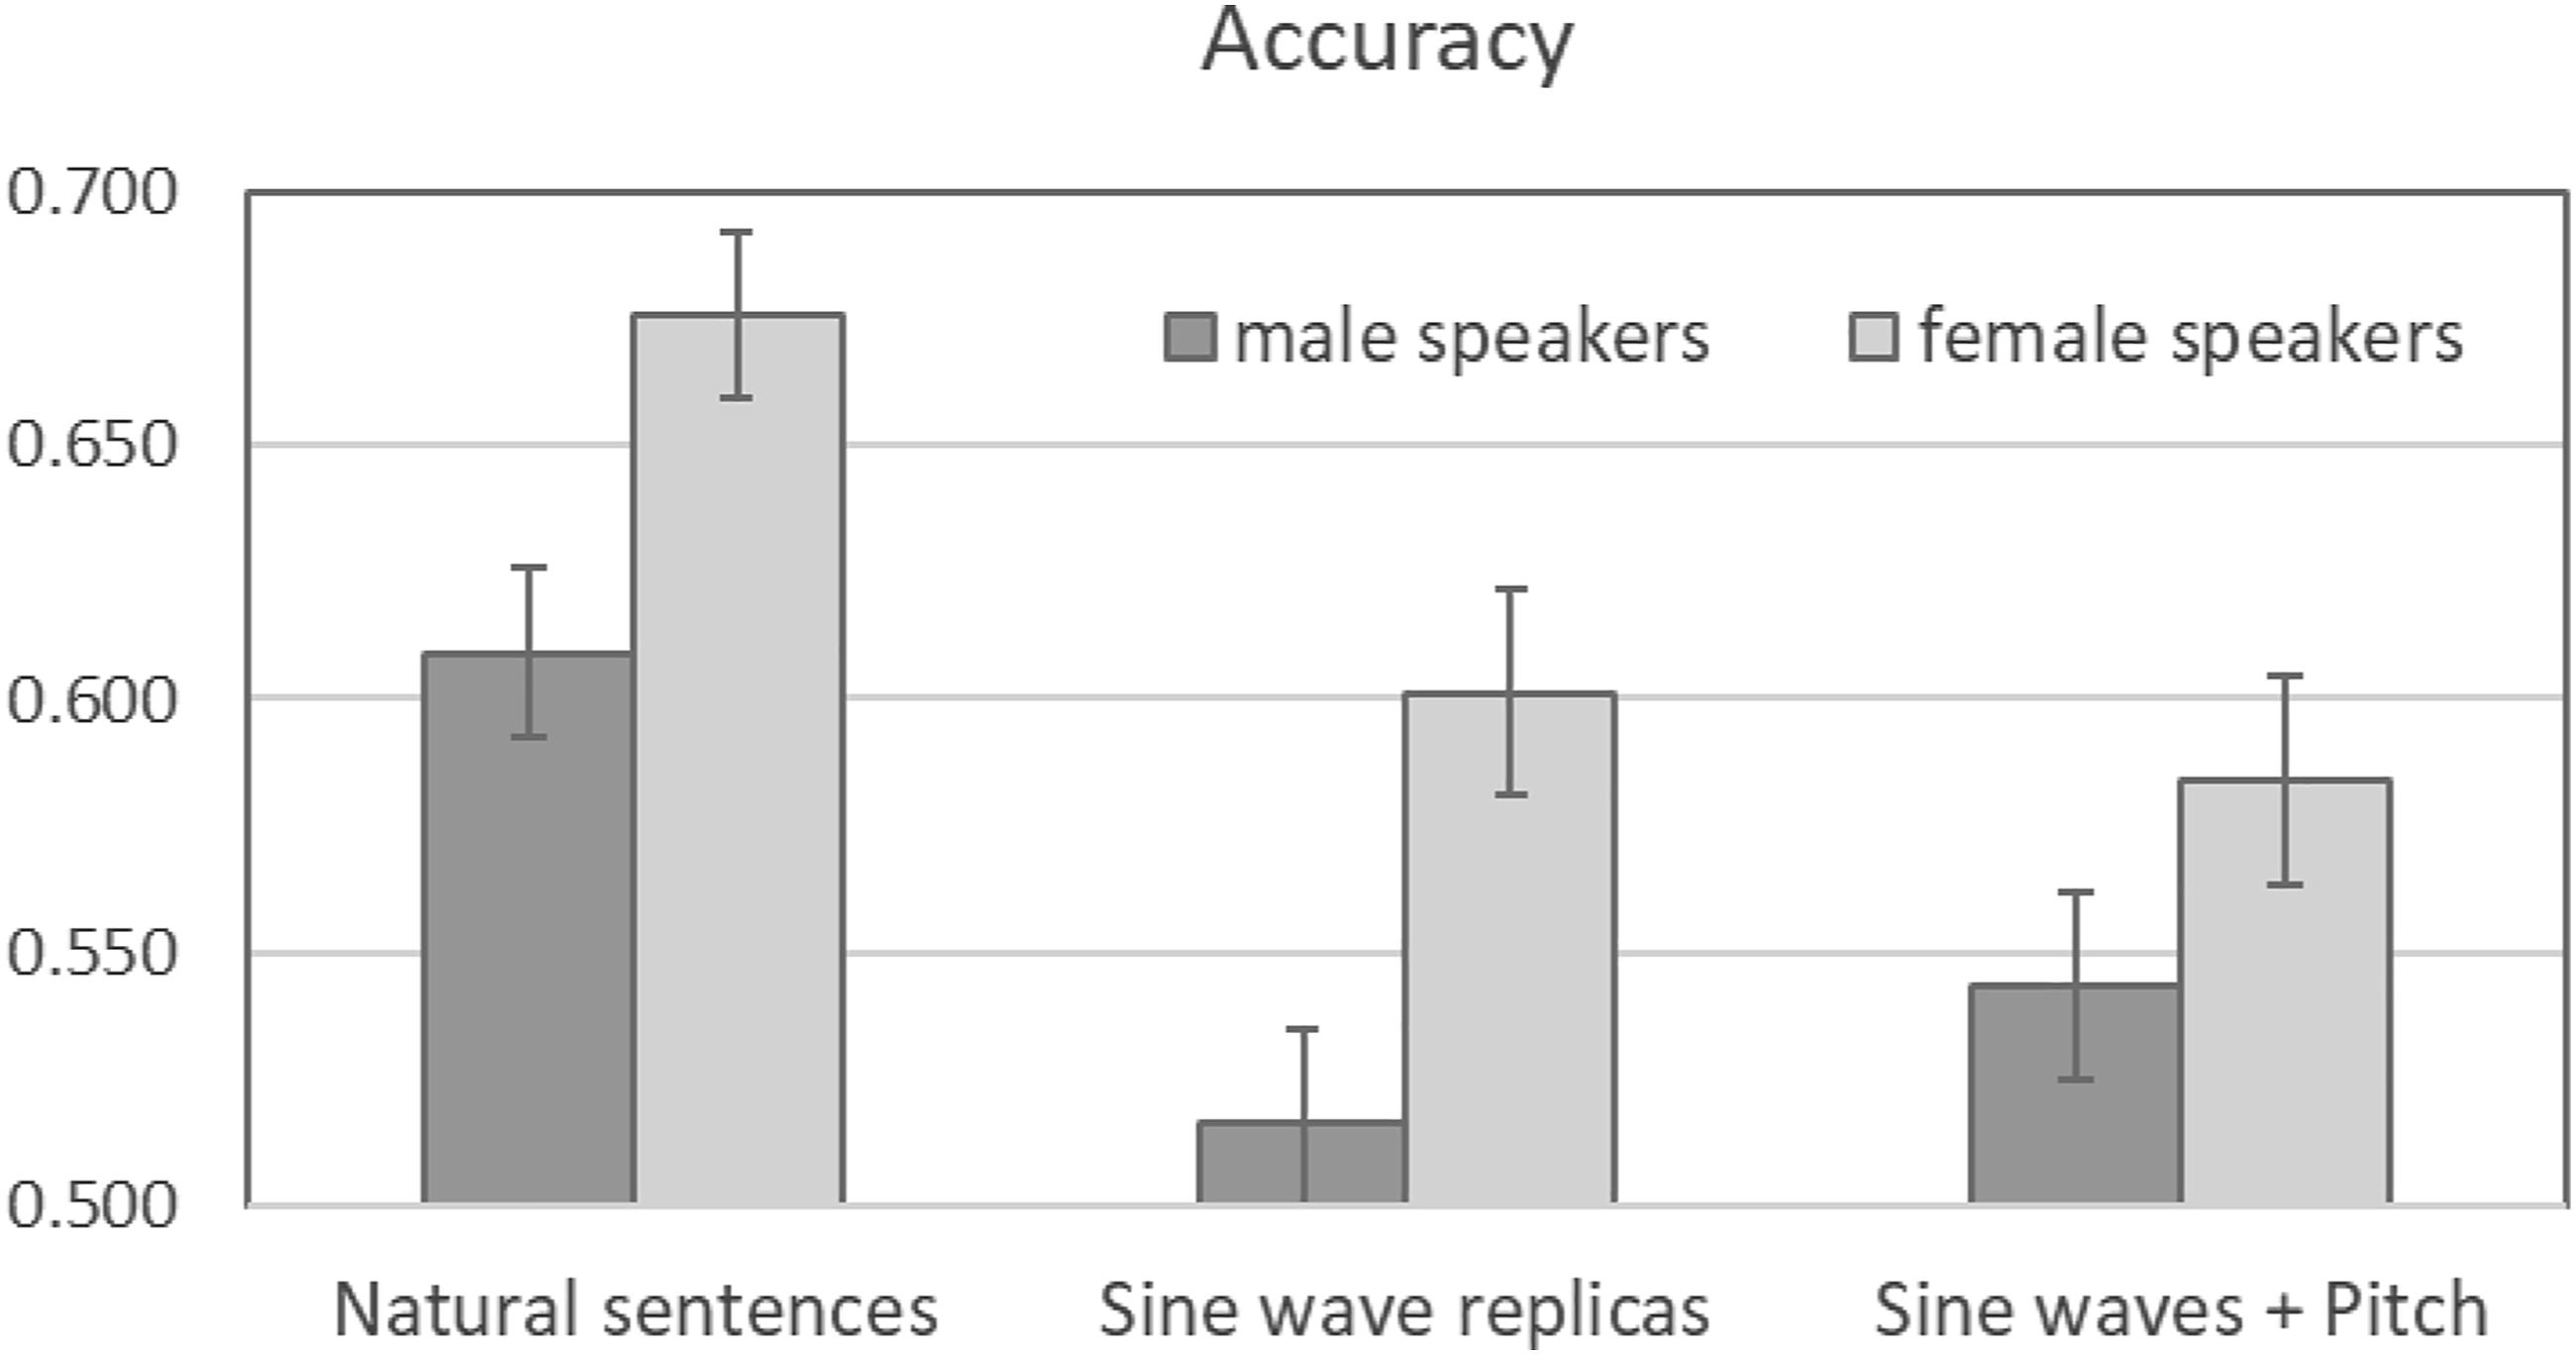
A 3 (Stimulus condition: N, SW, SWP) by 2 (Sex of speakers: male, female) ANOVA found a significant main effect of the Stimulus condition, F (2, 174) = 18.19, MSe = .022, p < .001, η2p = .173, and a significant main effect of the Sex of speakers, F (1, 87) = 22.05, MSe = .025, p < .001, η2p = .202, because the female speakers received higher rates of accurate judgments (.620, 95% CI [0.598, 0.642]) than the male speakers (.556, 95% CI [.535, .577]). The Stimulus condition by Sex of Speaker interaction did not reach statistical significance, F (2, 174) < 1. Within-subject contrasts showed, as expected, that accuracy from the Natural sentences (N) was significantly higher than accuracy from the other conditions, F (1, 87) = 23.66, MSe = .026, p < .0001, η2p = .214. However, the within-subject contrast did not find a significant difference between the scores from SW versus SWP conditions, F (1, 87) < 1. Similarly, this difference (SW vs. SWP) did not reach significance for only male speakers, F (1, 87) = 1.267, MSe = .052, I = .263, η2p = .014, or only female speakers, F (1, 87) < 1.
Discussion
Our data clearly suggested that the formant information contained in the sine-wave replicas (SW) of natural sentences were useful for listeners who attempted to judge the speakers’ body size at an above chance level in a binary discrimination task. Nevertheless, the level of accuracy listeners reached did not equal the score obtained from listening to natural sentences, indicating that, beyond the formants, natural speech contains additional information useful for discriminating the speaker’s height. González and Oliver (2004) found that actual height was the strongest predictor of perceptual judgments from a spoken sentence in both male and female speakers, suggesting that there may be other acoustic predictors of body size beyond the pitch and the formants. In the González and Oliver (2004) study, the partial correlation between actual height and judgments of “taller” in a binary discrimination task reached 0.51 for male stimuli after removing the influence of F0 and F1–F4. On the other hand, adding information about the voice pitch of each sentence in our experiment did not help increase the level of accuracy.
Our findings also revealed that stimuli recorded from the female speakers were more informative for judging the speakers’ body size than the stimuli recorded from male speakers. As mentioned above, we acoustically analyzed the stimuli used in our experiment, attending particularly to the natural sentences that served as the basis for creating the other two experimental conditions. Data in the Appendix, separated by speakers’ sex, includes the speakers’ heights and the acoustic parameters corresponding to the means of F0 (fundamental frequency), F1 (first formant), F2 (second formant), and F3 (third formant). We also, included the average frequency of the three formants, and the dispersion between formants [((F2 − F1) + (F3 − F2))/2]. The correlations within the same sex group between speakers’ heights and speech parameters were generally null or moderate, consistent with what has been found by other investigators (Barsties, et al., 2016; González, 2004; 2006; Owren, 2011; Pawelec, et al., 2020; for a review see Pisanski et al., 2014b). The highest correlations with speakers’ heights corresponded to the second formant (F2, r = −.306, accounting for 9.4% of the variance or r2) for male speakers, the second formant (F2, r = −.472, accounting for 22.3% of the variance), and the formant average (r = −.355; accounting for 12.6% of the variance) for female speakers. The fact that the correlations between speakers’ heights and formant frequencies were somewhat higher for female speakers, especially for the formant average, might explain why the participant assessments were more accurate for female stimuli. Note that part of the superiority of the height-formant correlation for perceiving female speakers could be because female heights were more variable than male heights. Pisanski et al. (2014b) conducted a large meta-analysis of vocal indicators of body size in adult men and women, including 295 correlation coefficients derived from 39 independent samples across participants in five different continents. They concluded that (a) formant-based estimates of vocal tract length explained about 10% of height within sexes and (b) voice pitch (F0) explained only 2% of the variance in predicting men’s height and 0.5% of the variance in predicting women’s height. Our stimuli yielded a correlation of r = −0.209 (accounting for 4.4% of the variance) between height and voice pitch (F0) for male samples, and a null correlation (r = −0.003; with no variance predicted) for female samples. This difference could explain why, in the case of the male stimuli, the SW replicas + pitch gave a slightly higher accuracy (.543) than the SW replicas alone (.516), although this small increase was nominal.
Limitations and Directions for Further Research
A limitation of this study was the asymmetry of this sample of listener-participants, all of whom were undergraduate psychology students comprised mostly of females. This asymmetry was not a serious problem since we did not aim to compare the listeners’ gender in relation to perceptual accuracy. However, future investigators may wish to address that question. Secondly, we used sine-wave replicas created from Spanish sentences. As Spanish is a Romance language in which syllables play a crucial role as units of articulation within the connected speech (i.e., a syllable-timed language), future investigators should determine whether a stress-timed Germanic language, such as English would produce different results. Finally, we used a non-demanding task from a perceptual-cognitive point of view, asking participants to choose, between just two voices, the one that corresponds to the taller person. Future research might explore the results with a more demanding task, such as directly estimating height in centimeters and/or analyzing other physical aspects of the body, such as weight, using sine-wave replicas.
Conclusion
We employed sine-wave replicas of sentences to study the perception of body height from human voices for the first time. This type of stimuli allows a rigorous experimental control since it provides information solely and exclusively on the formants (resonances of the vocal tract) without any other information from the speech signal spectrum. Our results show that human listeners can perceive body height from this information alone and that adding vocal pitch does not significantly increase accuracy. Most previous studies used intact samples of vowels or syllables (usually in English), but we used connected speech in Spanish. Connected speech is more than the sum of a series of phonemes since it comprises a dynamic and coarticulated succession of speech sounds forming syllables as units of articulation, particularly in Spanish (González-Alvarez & Sos-Peña, 2022). The time-varying trajectories of the vocal formants might operate as sources of inference about the articulator apparatus’s biomechanical properties—mass, mobility, and inertial characteristics.
Footnotes
Acknowledgments
This work was completed with resources provided by the University Jaume I (Spain). The authors would like to thank Paul Boersma and David Weenink for their PRAAT software and Chris Darwin for his PRAAT scripts, since one of them was used to create the sine-wave speech stimuli. The authors thank Dr. J.D. Ball and two anonymous reviewers for their helpful and valuable comments received on an earlier version of this paper.
Declaration of Conflicting Interests
The author(s) declared no potential conflicts of interest with respect to the research, authorship, and/or publication of this article.
Funding
The author(s) received no financial support for the research, authorship, and/or publication of this article.
Ethical Approval
All procedures performed in studies involving human participants were in accordance with the Deontological Commission and of the Ethical Committee of the University Jaume I (Spain) and with the 1964 Helsinki Declaration and its later amendments or comparable ethical standards. Written informed consent was obtained from all individual adult participants included in the study.
Appendix
The table below (Appendix A) details the speakers’ heights and sex and the acoustic parameters of stimuli. Voice parameters are means of F0 (fundamental frequency), F1 (first formant), F2 (second formant), F3 (third formant), average of F1-F3, and dispersion between formants [((F2-F1) + (F3-F2))/2]. Acoustic analysis were performed with Praat software (Boersma & Weenink, 2016). Appendix A. Speaker Heights and Acoustic Parameters of Stimuli (Natural Sentences), Separated by Speakers’ Sex (M: Men; W: Women). *Significant at the .10 level (1-tailed); **Significant at the .05 level (1-tailed)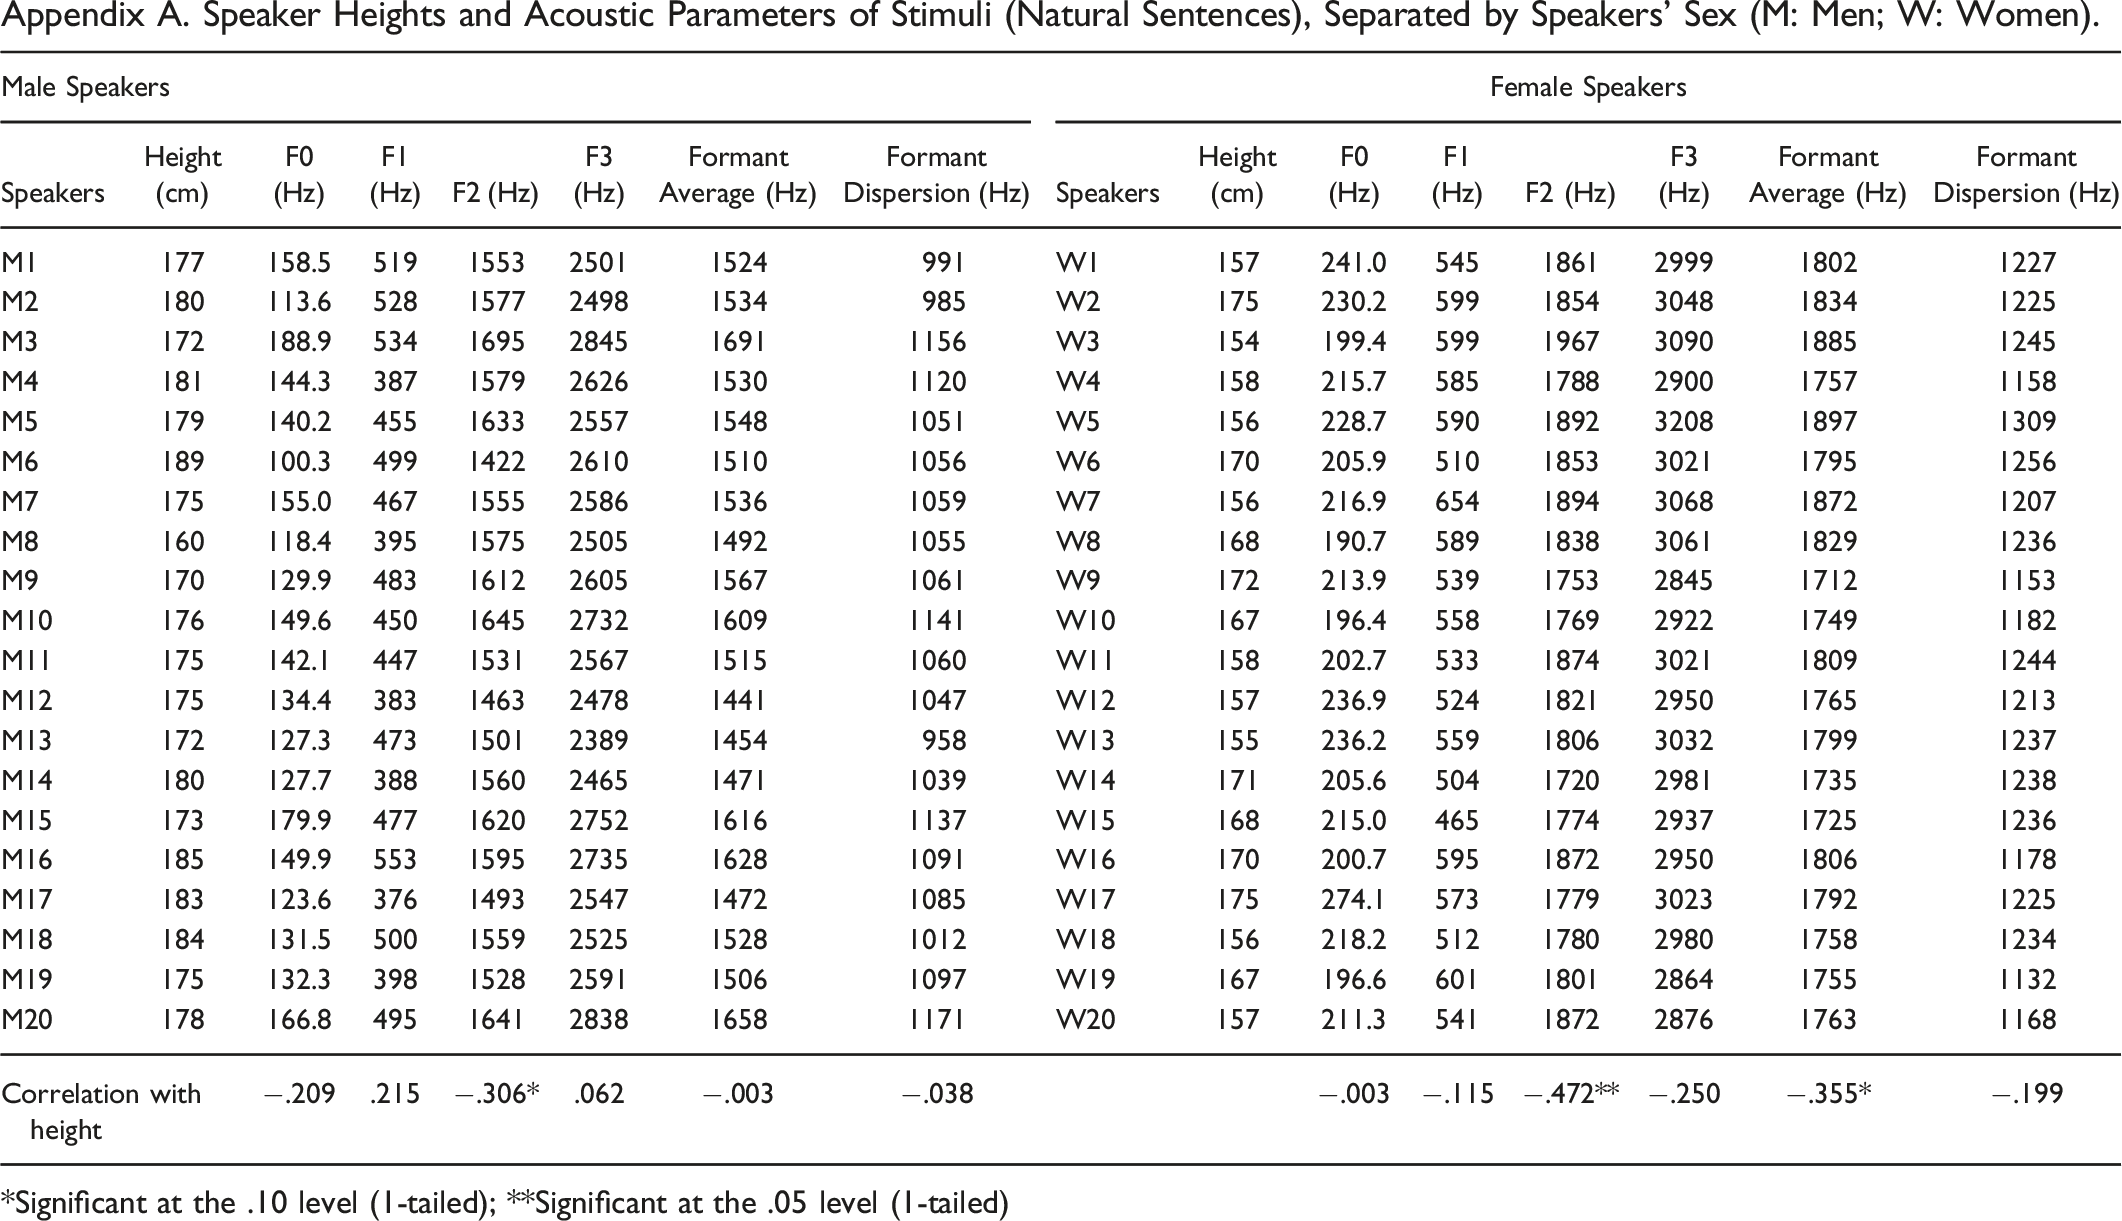
Male Speakers
Female Speakers
Speakers
Height (cm)
F0 (Hz)
F1 (Hz)
F2 (Hz)
F3 (Hz)
Formant Average (Hz)
Formant Dispersion (Hz)
Speakers
Height (cm)
F0 (Hz)
F1 (Hz)
F2 (Hz)
F3 (Hz)
Formant Average (Hz)
Formant Dispersion (Hz)
M1
177
158.5
519
1553
2501
1524
991
W1
157
241.0
545
1861
2999
1802
1227
M2
180
113.6
528
1577
2498
1534
985
W2
175
230.2
599
1854
3048
1834
1225
M3
172
188.9
534
1695
2845
1691
1156
W3
154
199.4
599
1967
3090
1885
1245
M4
181
144.3
387
1579
2626
1530
1120
W4
158
215.7
585
1788
2900
1757
1158
M5
179
140.2
455
1633
2557
1548
1051
W5
156
228.7
590
1892
3208
1897
1309
M6
189
100.3
499
1422
2610
1510
1056
W6
170
205.9
510
1853
3021
1795
1256
M7
175
155.0
467
1555
2586
1536
1059
W7
156
216.9
654
1894
3068
1872
1207
M8
160
118.4
395
1575
2505
1492
1055
W8
168
190.7
589
1838
3061
1829
1236
M9
170
129.9
483
1612
2605
1567
1061
W9
172
213.9
539
1753
2845
1712
1153
M10
176
149.6
450
1645
2732
1609
1141
W10
167
196.4
558
1769
2922
1749
1182
M11
175
142.1
447
1531
2567
1515
1060
W11
158
202.7
533
1874
3021
1809
1244
M12
175
134.4
383
1463
2478
1441
1047
W12
157
236.9
524
1821
2950
1765
1213
M13
172
127.3
473
1501
2389
1454
958
W13
155
236.2
559
1806
3032
1799
1237
M14
180
127.7
388
1560
2465
1471
1039
W14
171
205.6
504
1720
2981
1735
1238
M15
173
179.9
477
1620
2752
1616
1137
W15
168
215.0
465
1774
2937
1725
1236
M16
185
149.9
553
1595
2735
1628
1091
W16
170
200.7
595
1872
2950
1806
1178
M17
183
123.6
376
1493
2547
1472
1085
W17
175
274.1
573
1779
3023
1792
1225
M18
184
131.5
500
1559
2525
1528
1012
W18
156
218.2
512
1780
2980
1758
1234
M19
175
132.3
398
1528
2591
1506
1097
W19
167
196.6
601
1801
2864
1755
1132
M20
178
166.8
495
1641
2838
1658
1171
W20
157
211.3
541
1872
2876
1763
1168
Correlation with height
−.209
.215
−.306*
.062
−.003
−.038
−.003
−.115
−.472**
−.250
−.355*
−.199