
Abstract
The Repeatable Battery for the Assessment of Neuropsychological Status (RBANS) was developed to briefly measure a broad range of cognitive abilities, but it initially lacked a scale to evaluate executive functioning. Robert Spencer and colleagues recently created an Executive Errors scale (RBANS-EE) that quantified executive functioning (EF) errors committed during four RBANS subtests: List Learning, Semantic Fluency, Coding, and List Recall. In the present paper we cross-validated the RBANS-EE with a sample of 234 U.S. military veterans (M AGE = 67.2, SD = 11.5 years; M EDUCATION = 13.3, SD = 2.4 years) who completed the RBANS and various EF criterion measures as part of neuropsychological assessments they underwent during their clinical care. We found the RBANS-EE to be significantly correlated with most of the criterion EF measures. The RBANS-EE scale demonstrated modest ability to classify EF impairment at mild and severe levels; and, similarly, the RBANS-EE was modestly capable of accurately classifying those veteran respondents who were determined to have or to not have a neurocognitive disorder. Overall, the RBANS-EE can be quickly calculated, adds no administration time to an RBANS assessment, and yields useful scores to screen for EF dysfunction without replacing standalone EF tests.
Keywords
Introduction
Randolph (1998) developed the Repeatable Battery for the Assessment of Neuropsychological Status (RBANS) as a brief, objective measure of cognitive abilities. More recently, the RBANS has been rated as the seventh most frequently used neuropsychological assessment instrument, and it was rated the third most frequently used mental status or global cognition instrument (Rabin et al., 2016). The RBANS has demonstrated adequate reliability (Duff et al., 2003; Randolph, 2012) and satisfactory validity for detecting cognitive impairment (Duff et al., 2008). In terms of comprehensiveness, the RBANS falls between a cognitive screening test and a full-fledged neuropsychological test battery (Block, Johnson-Greene, et al., 2017). The RBANS is ideal when stand-alone screening tests do not provide sufficient coverage or depth and full evaluations are infeasible or justifiable (Groth-Marnat & Wright, 2016). In clinical practice, the RBANS is often used as a stand-alone instrument in evaluations for dementia or as part of a larger test battery with individuals who have subtler forms of cognitive dysfunction (Randolph, 2012). Among its limitations, however, it does not include a specific scale for measuring executive function (EF; Shaughnessy et al., 2019).
Executive function is a multi-faceted construct involving many aspects of cognition, including organizing, planning, and problem-solving. Executive dysfunction is central, or involved to varying degrees, in many neurologic disorders, including Huntington’s Disease, frontotemporal dementia, cortico-frontal cerebrovascular accidents and neoplasms, and traumatic brain injury (Caeyenberghs et al., 2014; Fiorention et al., 2013; You et al., 2014); and it characterizes various forms of psychopathology, such as Attention-deficit/Hyperactivity Disorder (ADHD; Willcut et al., 2005). For these reasons, the assessment of EF is critical to an accurate diagnosis in many clinical situations (Rabinovici et al., 2015), and many stand-alone tests have been developed to assess a broad range of separate abilities that fall beneath the EF umbrella (see Luria, 1980; Lezak et al., 2012; Strauss et al., 2006).
To address the RBANS weakness for measuring executive dysfunction, attempts have been made to reapportion standard metrics from within the RBANS with tasks that might relate to EF or be mediated by brain regions associated with EF. For example, Randolph et al. (1998) proposed examining a cortical/subcortical ratio score that can be derived from the RBANS to compare an examinee’s performances on tests believed to be responsive to those anatomical brain regions. Duff et al. (2009) further proposed examining scores on visual versus verbal subtests, noting that factor analyses have generally uncovered visual and verbal factor scores. These methods, however useful they may be for some clinical purposes, have not explicitly addressed executive dysfunction, nor do they examine qualitative aspects of an examinee’s performance.
Within its various subtests, the RBANS offers many opportunities to sample lapses in EF that are not explicitly quantified in existing indices or subtest scores. In research with other tests, investigators have shown that errors of intrusions and repetitions observed during fluency tasks and on tests involving learning and recalling word lists can represent not only specific memory lapses, but also failures to keep track of prior responses and/or the objectives of the task(s) at hand that increase with advancing age (Hankee, 2013; Rasmusson et al., 1998) and are evident among individuals with executive dysfunction (Holden et al., 2020; Kiselica & Benge, 2019). Although only modestly reliable (Woods et al., 2005) when used in isolation (e.g., Delis et al., 2017), scores based on these errors have been shown to correlate with formal measures of EF (Hill et al., 2012; Smith et al., 2020) and frontal lobe brain integrity (Baldo et al., 2002). Although we are not aware of aggregated EF scores from separate tests, such combinations may confer psychometric advantages in that aggregated evidence from varied sources may provide a particularly robust single measure of EF.
To this end, Spencer et al. (2018) developed the RBANS Executive Errors scale (RBANS-EE) in a post-hoc fashion, using errors on items and subtests throughout the RBANS to quantify several different aspects of EF into a single measure. The RBANS-EE score includes the total number of repetition and intrusion errors occurring during the RBANS subtests of List Learning, List Recall, and Semantic Fluency, as well as errors made during the Coding subtest. The RBANS-EE produces an index or percentage score by dividing the sum of these various errors by the total number of responses on those subtests. Higher RBANS-EE scores indicate a more problematic performance. In their initial study, Spencer et al. (2018) found that individuals with RBANS-EE scores below 5% did not typically perform poorly on other tests of EF within a broad neuropsychological test battery, whereas individuals with scores higher than 15.0% frequently exhibited parallel difficulties on other tests of EF. In a subsequent study, Ringdahl et al. (2019) observed that individuals classified as having no neurocognitive disorder, a mild neurocognitive disorder, and a major neurocognitive disorder obtained average RBANS-EE scores of 1.4%, 6.0%, and 9.5%, respectively. Additionally, examinees’ RBANS-EE scores have been moderately to strongly positively correlated with other tests of executive dysfunction, and these scores successfully distinguished people with and without neurocognitive disorders (area under the curve [AUC] = .88). More recently, Bolton et al. (2020) found moderate correlations between RBANS-EE scores and other measures of EF, with an adequate ability to identify impairment (defined as scores that were 1.5 standard deviations below the mean for respondents in the normative sample) on the Trail Making Test Part B (TMT B) in a sample of older adults.
Despite encouraging data supporting the use of RBANS-EE as a screening instrument for executive dysfunction with clear construct validity, the scale requires both cross-validation in other clinical samples and evidence that it provides either incremental utility within a broad neuropsychological test battery that includes other measures of EF or the capacity to substitute more briefly for these other EF measures. Accordingly, we had four broad aims in the current project. First, we sought to re-address the RBANS-EE construct and replicate its concurrent validity, hypothesizing a pattern of positive correlations between the RBANS-EE and other measures of EF in another participant sample. Second, we sought to cross validate Spencer et al.’s (2018) earlier neuropsychological impairment screening statistics, hypothesizing that the RBANS-EE scale would successfully detect executive dysfunction defined categorically at 1.0 SD and 2.0 SD below the mean score for the normative population on the other measures of EF. Third, we planned to analyze the RBANS-EE’s predictive validity for classifying examinees with and without a neurocognitive disorder and hypothesized that it would be comparable in its predictive validity for this purpose with other EF criterion measures. Finally, we sought to examine the incremental validity of the RBANS-EE scale, predicting that it would predict executive dysfunction at levels beyond the other criterion tests of EF.
Method
Participants
Participants in this study were 313 U.S. military veterans who completed the RBANS as part of a comprehensive neuropsychological evaluation within a Midwestern Veterans Affairs facility. We used retrospective clinical data for this purpose, with approval by the Institutional Review Board of this facility. As these data were collected from clinical evaluations that did not use a fixed battery, clinicians decided which measures to administer, based on the specifics of each patient’s referral question. They tended to use the RBANS for older veterans and tended to give formal measures of executive functioning to all but the most profoundly impaired. We excluded 29 veteran participants from analyses because of invalid test data, as determined by clinical consensus among the authors after reviewing behavioral and psychometric data. We excluded data from another 50 veteran participants who were not administered other EF criterion measures. Thus, the primary remaining participant sample for further data analyses was composed of 234 veterans who received neuropsychological assessments as part of their medical care (93.2% male; M AGE = 67.2 years, SD = 11.5; M EDUCATION = 13.3 years, SD = 2.4). The sample was predominantly White (91.9%) and Black (7.3%) with other races combined comprising less than 1% of the sample. Chi-square tests and analyses of variance (ANOVA) that compared differences between (a) those with problematic performance validity, (b) those not taking enough EF tests, and (c) the final sample did not differ with respect to sex, years of education, race, or Effort Index scores. However, participants in the final, selected sample tended to be older than those in the two excluded groups. The primary diagnoses, made at the conclusion of the neuropsychological evaluation and not incorporating the RBANS EE performance, included (a) mild neurocognitive disorder (n = 70, 29.9%); (b) major neurocognitive disorder (n = 49, 20.9%); (c) psychiatric disorder (n = 44, 18.8%); (d) sleep disorder (n = 4, 1.7%); (e) substance use disorder (n = 2, .9%); (f) no diagnosis (n = 59, 25.2%)l and (g) other (n = 5, 2.1%). These diagnoses were dichotomized into those with a neurocognitive disorder (n = 123, 52.6%) and those without a neurocognitive disorder (n = 111, 47.4%).
Measures
As noted earlier, the RBANS-EE scale is an EF composite index that and is a summation of errors committed on the List Learning, Semantic Fluency, Coding, and List Recall subtests, divided by the total responses (including errors) on those subtests (Spencer et al., 2018). The RBANS-EE score is multiplied by 100 to generate a percentage score. We used percentages throughout our analyses because no age stratified normative data pertaining to RBANS-EE exist.
Criterion measures included the Trail Making Test Part B (TMT B; Reitan, 1955), letter-based oral word fluency (FAS; Benton et al., 1976), semantically-based oral word fluency (Animals; Goodglass et al., 1972), and Wisconsin Card Sorting Test perseverative errors (WCST-PE; Heaton et al., 1993). Raw scores for the criterion measures were transformed into normative data, based on test manual norms for WCST-PE performances and Mitrushina et al. (2005) norms for TMT B, FAS, and Animals performances. EF criterion scores were averaged together to create composite scores, and levels of EF impairment were defined as 1.0 (mild) and 2.0 (severe) standard deviations below the normative mean on the composite score.
Design and Procedure
We calculated descriptive statistics for all measures, and we examined the relationship between the RBANS-EE scale score and its components with the criterion measures using Spearman correlations due to significant positive skew (1.33–.16) and kurtosis (2.00–.32). We used corrected item-total correlations to report on the internal consistency of the RBANS-EE, but we acknowledge difficulty attaining a respectable value due to characteristics of the measure (e.g., floor effects, non-normal distribution, small number of scale items). Normative scores for the EF criterion measures were averaged together to create EF composite scores. We examined the predictive validity of the RBANS-EE scale in classifying EF impairment at two levels, mild and severe, as defined as EF composite scores at −1.0 and −2.0 standard deviations below the normative mean, respectively. Predictive validity was considered adequate if the receiver operating characteristic area under the curve (AUC) was .70 or greater (Hosmer et al., 2000). We compared the AUC of RBANS-EE and the criterion measures to detect whether participants were or were not diagnosed with a neurocognitive disorder as their primary diagnosis. We assigned neurocognitive disorder diagnoses in accordance with the Diagnostic and Statistical Manual of Mental Disorders—Fifth Edition (DSM-5; American Psychiatric Association, 2013). To test whether the RBANS-EE added predictive value in assessing EF, we used hierarchical regressions with the criterion measures with significant correlations with RBANS-EE. In each case, one criterion measure served as the dependent variable and the other(s) were entered in step one of the regressions to test whether RBANS-EE at step two added incremental prediction, as assessed by a change in variance accounted for (R2).
Results
The participant sample averaged an RBANS-EE score of 5.9% (SD = 5.0) with a range of .0–26.5%, and these scores significantly correlated with age, r = .26 (p < .001). Sex and years of education were not significantly related to RBANS-EE scores. Among the components of the RBANS-EE scale, the only significant inter-correlation observed was between the List Learning and List Recall (r = .20, p = .002).
Descriptive Statistics and Spearman Correlation Matrix for the RBANS EE and Criterion Measures.
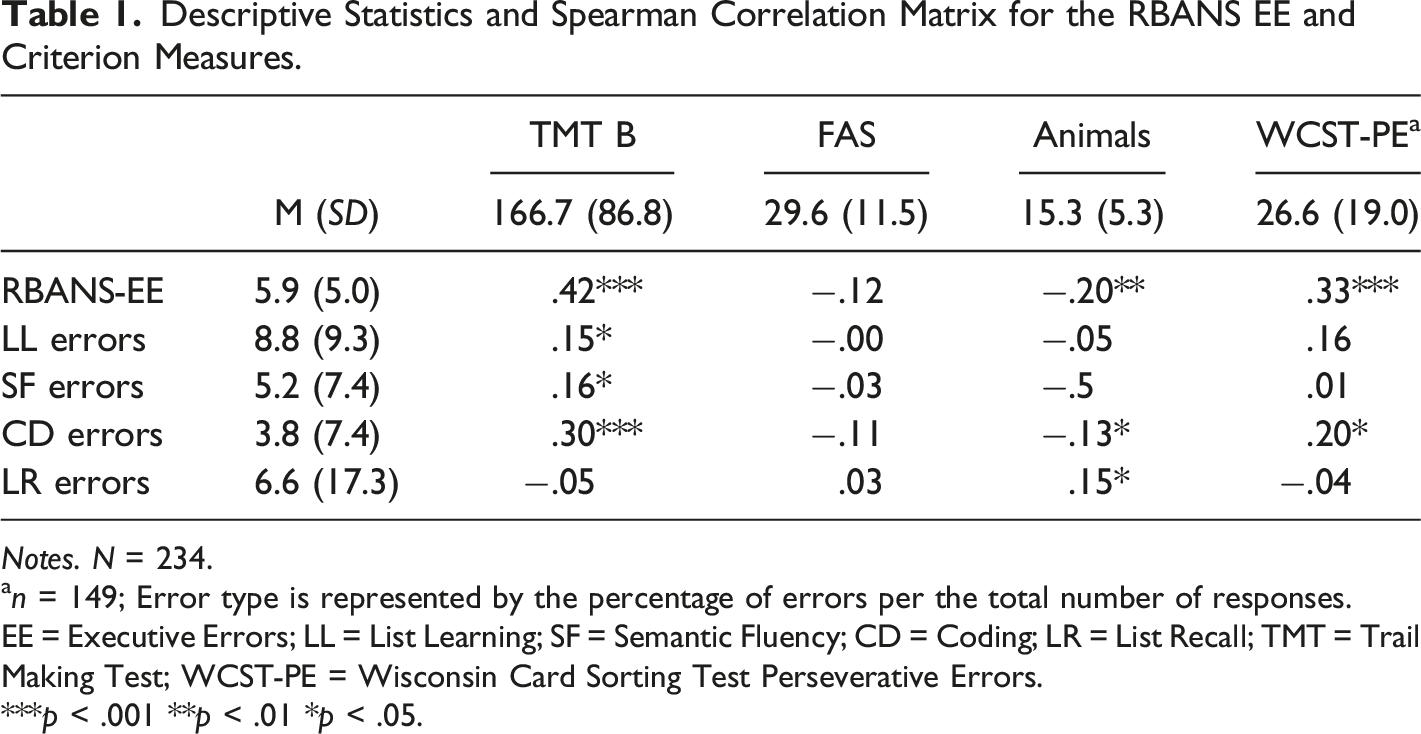
Notes. N = 234.
an = 149; Error type is represented by the percentage of errors per the total number of responses.
EE = Executive Errors; LL = List Learning; SF = Semantic Fluency; CD = Coding; LR = List Recall; TMT = Trail Making Test; WCST-PE = Wisconsin Card Sorting Test Perseverative Errors.
***p < .001 **p < .01 *p < .05.
Executive Errors Percent Impaired on Executive Functioning Composite.

Notes. EF = Executive functioning composite; Mild and severe EF was defined as 1.0 and 2.0 standard deviations below the normative mean, respectively.
RBANS-EE Scale Classification Analyses of Executive Dysfunction.

Notes. N = 234.
an = 149.
EF = Executive functioning.
RBANS-EE Scale and Criterion Measures Classification of Neurocognitive Disorder.
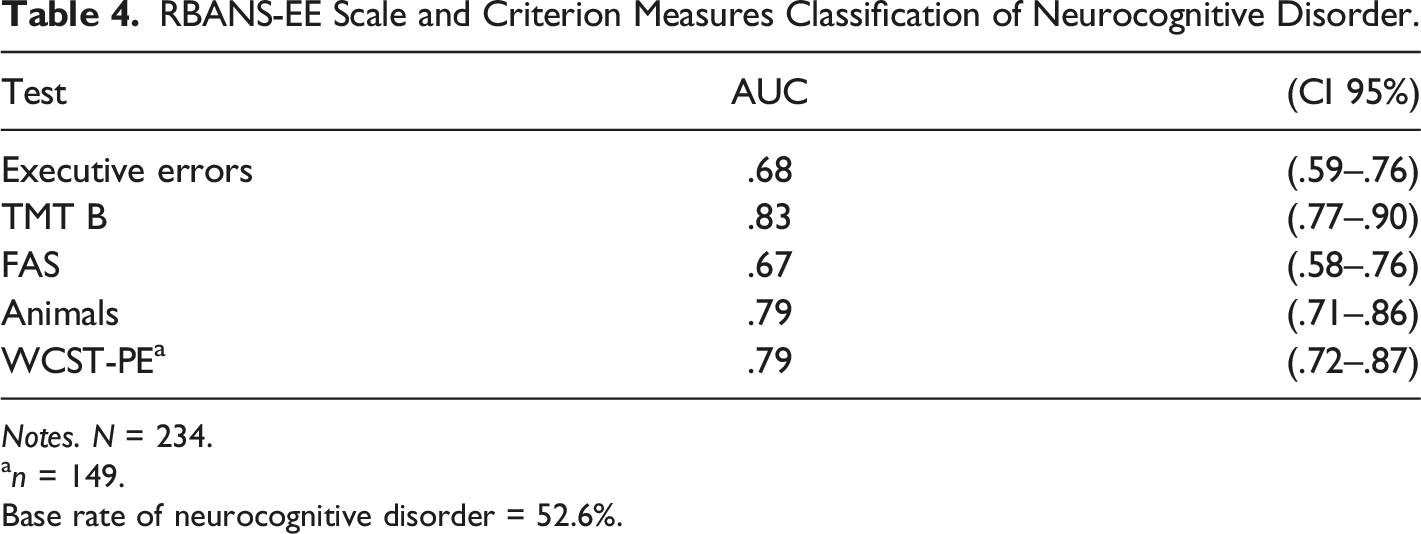
Notes. N = 234.
an = 149.
Base rate of neurocognitive disorder = 52.6%.
The TMT B and WCST-PE were most strongly related to the RBANS-EE, through both correlational and AUC analyses. Thus, in supplemental analyses, we used hierarchical regression analyses to test whether the RBANS-EE added unique predictive information in assessing these two criterion measures. For each analysis, one criterion measure served as the dependent variable, and the other criterion measure was entered as a predictor in step one of the models with RBANS-EE added in step two. In predicting perseverative errors, TMT B scores were significant at step one (R2 = .258, p < .001) and the RBANS-EE added 1.6% (p = .078). In predicting TMT B scores, perseverative errors were significant at step one (R2 = .258, p < .001) and the RBANS-EE added 7.6% (p < .001).
Discussion
The RBANS-EE, although related to diagnoses of neurocognitive disorders and generally correlated with stand-alone measures of EF, was not sufficiently precise to replace the use of standard measures of EF. The RBANS-EE still provided relevant data and merits additional research, but it has yet to demonstrate stand-alone validity as an EF measure. These conclusions differ from the results of other recent efforts to validate the RBANS-EE (Bolton et al., 2020; Ringdahl et al., 2019; Spencer et al., 2018).
Although parsing apart cognitive constructs necessarily involves semantics, it is possible to articulate how the RBANS-EE functions phenomenologically as a test of EF. Manifestly, the RBANS-EE measures lapses in attention (Coding errors) as well as poor self-monitoring (repetition and intrusion errors). Statistically, our results are generally consistent with prior studies (Bolton et al., 2020; Ringdahl et al., 2019; Spencer et al., 2018) that reported strong correlations between the RBANS-EE and both TMT B, which measures processing speed, working memory, and set shifting, and WCST-PE, which measures mental flexibility and other aspects of metacognition. Unexpectedly, the RBANS-EE was not significantly related to either of the two oral word fluency tasks or to List Recall errors. It is possible that fluency tasks differed significantly from the component scores within the RBANS-EE, although these scores have been moderately correlated in other samples (Ringdahl et al., 2019; Spencer et al., 2018). List Recall errors had the most variability, the largest positive skew, and relatively few occurrences in our sample, which may account for these discrepant results with Ringdahl et al. (2019) who found List Recall errors to have diagnostic value. Additional research is needed to determine which components account for the most variance in the overall scale and clarify which facets of executive functioning have sufficient coverage.
Regarding clinical utility, the RBANS-EE was nearly as predictive of clinical diagnosis as were the other criterion measures. Numerically, the RBANS-EE was marginally more predictive than letter-based oral word fluency, and was less predictive than semantically-based oral word fluency, WCST-PE, and TMT B. However, because data for the criterion tests were available to the individuals determining clinical diagnoses while the RBANS-EE was not used for this purpose, the actual values on these tests may be more equivalent. Additional research is needed to examine this issue with criterion measures based on independent sources of data, such as brain imaging, functional status, biomarkers, or prognoses.
Regarding incremental utility, the RBANS-EE did not predict WSCT-PE performance beyond TMT B; however, RBANS-EE did predict TMT B beyond WCST-PE. These results indicate that RBANS-EE in its current form has marginal incremental validity within a battery that includes other tests of EF, and therefore its scores serve more of a screening or triage function than that of an independent measure of executive functioning within a battery.
With modifications, RBANS-EE, or at least the concept underlying RBANS-EE can be applied to other settings and with other cognitive tasks. One concept apparent across studies examining the RBANS-EE is that each individual component measure has relatively weak validity when compared to the collective measure. Therefore, the value of the RBANS-EE is in the aggregation of its component parts; attending to any one aspect of the test would invite excessive randomness to the evaluation. Perhaps additional research could take a similar approach as the RBANS-EE by adding additional dysexecutive observations to a composite scale. Although typically evaluated in isolation from other qualitative indices, other qualitive errors have demonstrated validity in detecting executive dysfunction. Tolle et al. (2019) observed that tabulating the violations from the instructions of the examiner when engaging in the Grooved Pegboard was associated with executive dysfunction generally, but especially with impulsivity. Possin et al. (2012) found that repetitions during design fluency was a distinctive characteristic of individuals with behavioral variant frontotemporal dementia and those with lesions to the right frontal lobe. Similarly, the number of errors committed during TMT B is strongly predictive of a behavioral variant of frontotemporal dementia and frontal lobe lesions (Kiselica & Benge, 2019) and may be more predictive than time to completion (Kopp et al., 2015). Perhaps adding qualitative observations from more tests could lead to a more stable, battery-wide, aggregate collection of otherwise-discarded measures into a useful metric.
Limitations and Directions for Further Research
This study and RBANS-EE have significant limitations. Foremost among them is that the concept of EF is broad, heterogenous, and complex. While executive functioning is often discussed as a single entity, it is varied in its elements. Thus, it is unrealistic for any summary measure to encompass the entire construct. No single measure can capture all its qualities, and abnormal summary scores should only be used as signal flags for to delving into a deeper assessment, perhaps by altering neuropsychological test batteries to more fully explore component abilities subsumed under the executive functioning umbrella. In this study, we followed the direction of Spencer et al. (2018) who considered errors on coding as either impulsive or the consequence of haste. We regarded repetitions and intrusions as examples poor self-monitoring and failures to distinguish between presented and novel information, respectively. We ultimately do not believe that evaluators should rely solely on the RBANS EE as a robust measure of EF; rather they should acknowledge that it quantifies observable behavior that helps mark some aspects of EF and has adequate psychometric justification as an acceptable screening tool. Separate tests of component skills falling under the umbrella of EF tend to correlate only moderately (e.g., Delis-Kaplan Executive Function System; Delis et al., 2001), and, like these tools, the RBANS-EE does not represent a single construct. This point is illustrated by the scale’s poor internal consistency but adequate correlations with criterion measures. If the items are correlated with outcomes and have cumulative predictive utility, internal consistency becomes less relevant. Scales with uncorrelated items are not necessarily undesirable, provided the measures correlate with their intended criteria. With these caveats, high RBANS-EE values indicate potential carelessness and/or deficient self-monitoring, and these problems should be further investigated with additional complementary methodologies.
For this retrospective study, we employed a demographically narrow participant sample consisting of predominantly male veterans, and data regarding race and ethnicity were not recorded. As a result, our findings may not be representative of populations with broader demographics, likely limiting their generalizability. The RBANS-EE should be evaluated in more diverse samples. Further research should also use other aspects of EF as criterion measures. For example, Spencer et al. (2018) included seven executive measures that, included tests of social judgment, planning, and response inhibition. Until future researchers explore the relationship between RBANS-EE and a wider array of EF skills, we urge caution in interpreting RBANS-EE performances.
While there are advantages to constructing EF tests from theory (e.g., Miyake et al., 2000), this approach involves constructing new stimuli; the RBANS-EE repurposes qualitative data from existing stimuli, creating a limitation underlies some of the shortcomings of the RBANS-EE, such as its modest classification statistics. An ideal test of the value of RBANS EE within an overall battery might be to demonstrate its incremental validity in relationship to standard neuropsychological practices for measuring EF. Although our data set was not well-suited for this purpose, we recommend this approach for subsequent research and, without evidence of such incremental utility, we view the RBANS EE as best suited for EF screening.
Conclusion
The RBANS-EE has now been researched in four independent samples by three groups of researchers, though no normative data or indices of test-retest reliability are available. The rationale for an aggregate measure like the RBANS-EE would be further strengthened by demonstrating its association with neuropathology, especially conditions associated with frontal pathology. Intrusion errors on other list learning tests have been associated with Huntington’s disease (Holden et al., 2020) and frontal lesions (Baldo et al., 2002), and repetition errors are common with ADHD (Pollak et al., 2008) and prolonged methamphetamine use (Woods et al., 2005). Similar research with the RBANS-EE is needed. The RBANS-EE scale takes no additional time to administer, making the information it yields essentially “cost free.” Our findings clearly demonstrate a screening value for this scale, even if it does not eliminate the need for further testing of EF.
Footnotes
Author Contributions
This work was authored as part of the contributor’s official duties as an Employee of the United States Government and is therefore a work of the United States Government. In accordance with 17 U. S. C 105, no copyright protection is available for such works under U. S. Law.
Declaration of Conflicting Interests
The author(s) declared no potential conflicts of interest with respect to the research, authorship, and/or publication of this article.
Funding
The author(s) received no financial support for the research, authorship, and/or publication of this article.