
Abstract
Driving a car requires a complex combination of various cognitive functions (e.g., visual perception, motor control, decision making, and others), and deficits in any of these processes may compromise driving safety. Amongst these, executive functions such as inhibitory control, task switching, and decision-making are important, as they enable drivers to process information from their surroundings and respond appropriately to changing road conditions. Although previous research has focused on laboratory measures of individual executive functions, it remains unclear whether performance on such laboratory tests readily translates to actual on-the-road driving performance, especially since drivers’ skill levels can vary widely, based on their driving frequency. To this end, we divided 30 participants into two categories based on their driving frequency (i.e., daily commuter vs. weekend only drivers), and we used three well-known executive functioning tasks (the stop signal task, Iowa gambling task or IGT, and a task-switching test) to see whether scores on these tasks predicted such driving performances and behaviors such as braking time, lane-keeping, speed limit violations, and inter-vehicle distance (e.g., in a driving simulator). Participants went through a follow-lead-car scenario in the driving simulator for 20 minutes and then completed the three executive tasks. We found that stop signal reaction time (SSRT) best predicted driving performance, and remained predictive against driver distraction, as well as variabilities in driving frequency. The IGT predicted speed limit violations in high-frequency drivers, whereas task-switching cost predicted lane keeping performance in low-frequency drivers. Together, these results highlight the importance of driving frequency when considering correlates between executive functions and driving performance and behavior. They also imply that executive tasks better predict driving performance in low-frequency (or inexperienced) drivers, while driver temperament (i.e., impulsiveness as indicated by IGT) better predicted driving performance in high-frequency (or experienced) drivers.
Introduction
Driving is a complex task that requires the use of multiple cognitive skills, including attention, perception, memory, and executive functions. Amongst these, executive functions such as inhibitory control, task switching, and decision-making are important elements of driving as they enable drivers to process information from their surroundings and respond appropriately to changing road conditions. An understanding of the role of executive functions in driving is crucially important, because these executive functions affect the driver and others on the road. For example, poor inhibitory control can delay a driver’s braking reaction to unexpected road events, whereas poor task-switching ability can delay the driver’s recovery from that braking event to resume normal driving. Driver variability in executive functions should produce observable differences in driving behaviors.
Previous studies have already demonstrated a relationship between executive function and driving performance in young novice and older drivers. Young, novice drivers have been found to have a high risk of motor vehicle accidents, especially immediately after their licensure (McCartt, et al., 2003). The reasons for this association are multifaceted, involving social (e.g., risk shift), executive (e.g., poor inhibitory control), and experiential (e.g., lack of experience) factors (Rolison & Moutari, 2020). Young drivers are still undergoing brain development directly related to executive functioning (Diamond, 2013; Huizinga, et al., 2006). Studies have explored the relationship between driving performance in young novice drivers and individual developmental differences in executive functions (e.g., Jongen et al., 2011; Walshe et al., 2017). Mantyla et al. (2009) used the lane change task to measure teenage drivers’ lane keeping ability and six tasks to measure their executive functions, including their response inhibition, working memory, and cognitive flexibility. Only working memory was positively correlated with lane change performance, and teenage drivers with poor working memory had larger lateral lane deviations (i.e., difference between observed deviation and optimal reference line in lane change task). Jongen et al. (2011) used a simulated 28 km daylight driving task and a stop signal task to investigate the relationship between inhibitory control and risky driving behavior as measured by at least a standard deviation of lateral position (SDLP) deviance, speeding, red light running, and their number of collisions. Young drivers scored lower on inhibitory control and had higher SDLP in simulated driving. Similarly, Ross et al. (2015) had participants perform verbal working memory, visuospatial working memory and response inhibition tasks and measured driving performance in a follow-lead-car driving task. In this study, young drivers’ executive functions such as inhibitory control and verbal working memory performance significantly predicted lane keeping performance. Their visuospatial working memory performance was related to yellow-light running and following distance. The underlying mechanisms behind the link between working memory and yellow-light running remain unknown. These findings suggest clear associations between laboratory measures of executive functions and poorer driving performance in young drivers.
Elderly drivers are another group of at-risk drivers with high collision rates (Baker et al., 2003; Braver & Trempel, 2004; Lyman et al., 2002; Maycock, 1997; Ryan et al., 1998). Some investigators have focused on the impact of declining executive functions on driving performance in older adults (Anstey et al., 2005). Daigneault et al. (2002) compared executive functions of older drivers with and without records of prior accidents and found that those with prior accidents had poorer executive functioning (also see Brown et al., 2016). Adrian et al. (2011) compared abilities and on-road driving performance of 42 healthy older drivers aged 60 or above; when they considered age, gender and personality factors, no executive abilities significantly predicted driving performance. Thus, although it is generally accepted that executive functions readily translate to driving performance and road safety, the extent of this relationship remains unclear.
There may be many factors that contribute to inconsistent findings in the associations between executive functioning and driving performance. First, the way laboratory tasks are designed and conducted can make a huge impact on subsequent observations. Even though multiple studies have used “working memory” tasks, the parameters of such tasks can be divided into verbal versus visuospatial, recognition memory versus recollection memory and in other ways. Second, most past investigators examined young or elderly drivers who were deemed particularly susceptible to premature or declined executive functions, respectively. But correlations between these variables of interest may be difficult to observe when a specific group of participants with a skewed data distribution is preselected. Third (and the purpose of the current study), inter-individual variability in driving frequency might predictably impact drivers’ familiarity and expertise with driving. For example, someone who drives daily might find driving easier than someone who drives only on weekends due to a difference in the amount of exposure/practice. Therefore, aggregating these different drivers into a single group may mask correlations between executive abilities and driving performance that might otherwise have been observed.
With individual differences in driving frequency in mind, we aimed to investigate the relationship between three different aspects of executive functioning (i.e., inhibitory control, impulsivity/risk-taking, rule-switching) and driving behavior, while dividing our participants into two driving categories based on their driving frequency (i.e., daily commuters vs. weekend drivers). Specifically, we chose the stop signal task, the Iowa Gambling Test, and task-switching tasks to gauge participants’ executive functioning. We then correlated their scores on these tasks with participants’ driving performance (e.g., braking reaction time, inter-vehicle distance, lane deviation, and the standard deviations of all these measures) in a follow-lead-car task (focused vs. distracted) on a driving simulator. We hypothesized that any correlations between executive functions and driving behavior would be modulated by participants’ frequency of regular driving, which we expected to be a proxy for their level of driving expertise.
Method
Participants
We recruited 30 participants via online advertisement into this study (13 females, 17 males; M age = 30.83). There were age differences between men (M = 28.88, SD = 4.69) and women (M = 33.39, SD = 5.36), t (28) = 2.450, p = .021. Participants reported no previous neurological history, and they had normal or corrected-to-normal vision. All experimental procedures were approved by the Joint Institutional Review Board of the Taipei Medical University, Taiwan, and all participants gave informed consent prior to their participation.
Procedures
Before starting an experimental driving task, all participants completed a 5-min practice session to familiarize themselves with braking and accelerating in the driving simulator. Participants then performed two driving scenarios on a driving simulator as described below under Driving Performance. The driving task was followed by three computer-administered executive tasks (i.e., stop signal task, task-switching task, and Iowa Gambling Task) that were designed to measure each participant’s response inhibition, rule/task-switching, and risk-taking behavior, as described separately below. At the end of the experiment, participants were asked two questions: (a) in the past three months, how often did you drive a car? and (b) during the experiment did you feel dizzy when you drove the driving simulator? If a participant answered “yes”, their data would be excluded from data analysis as we could not be sure whether their performance in the simulator was representative of their driving ability. There were no ‘yes’ responses to the latter question.
Driving Simulator
We used a commercial driving simulator (Carnetsoft BV, NL) that consisted of a computer, three rendering monitors, an experimenter monitor, a Logitech G27 steering wheel, pedals, and a gear shift. The monitors had a 24” diagonal and a 60 Hz frame rate. Pedals and driver’s seat were adjusted individually for comfort.
Driving Performance
There were two driving scenarios: (i) In Scenario 1, participants completed a 10-minute follow-lead-car task on a two-lane road with bidirectional traffic; the lead car would brake or accelerate at irregular intervals, and participants were instructed to brake as soon as they saw the lead car brake and to make sure they kept a safe following distance without excessive length; and (ii) in Scenario 2, participants completed the same 10-minute follow-lead-car task but were also given a secondary detection response task in which they were asked to press a button on the steering wheel as soon as they saw a small red square on the windshield (>1 cm2, upper left corner, see Figure 1). This secondary task served as an attention distractor, making Scenario 1 “focused driving” and Scenario 2 “distracted driving.” We set the speed limit at 80 km/hour in both scenarios, and we always displayed the speed limit in the upper right corner of the windshield (Figure 1). Example of the Driving Scenarios. Note. Participants drove in bidirectional traffic with the lead car in front of them. In Scenario 2, a red square (center display) randomly appeared intermittently in the upper left quadrant of the center display, at which time participants were instructed to press a button on the steering wheel as quickly as possible.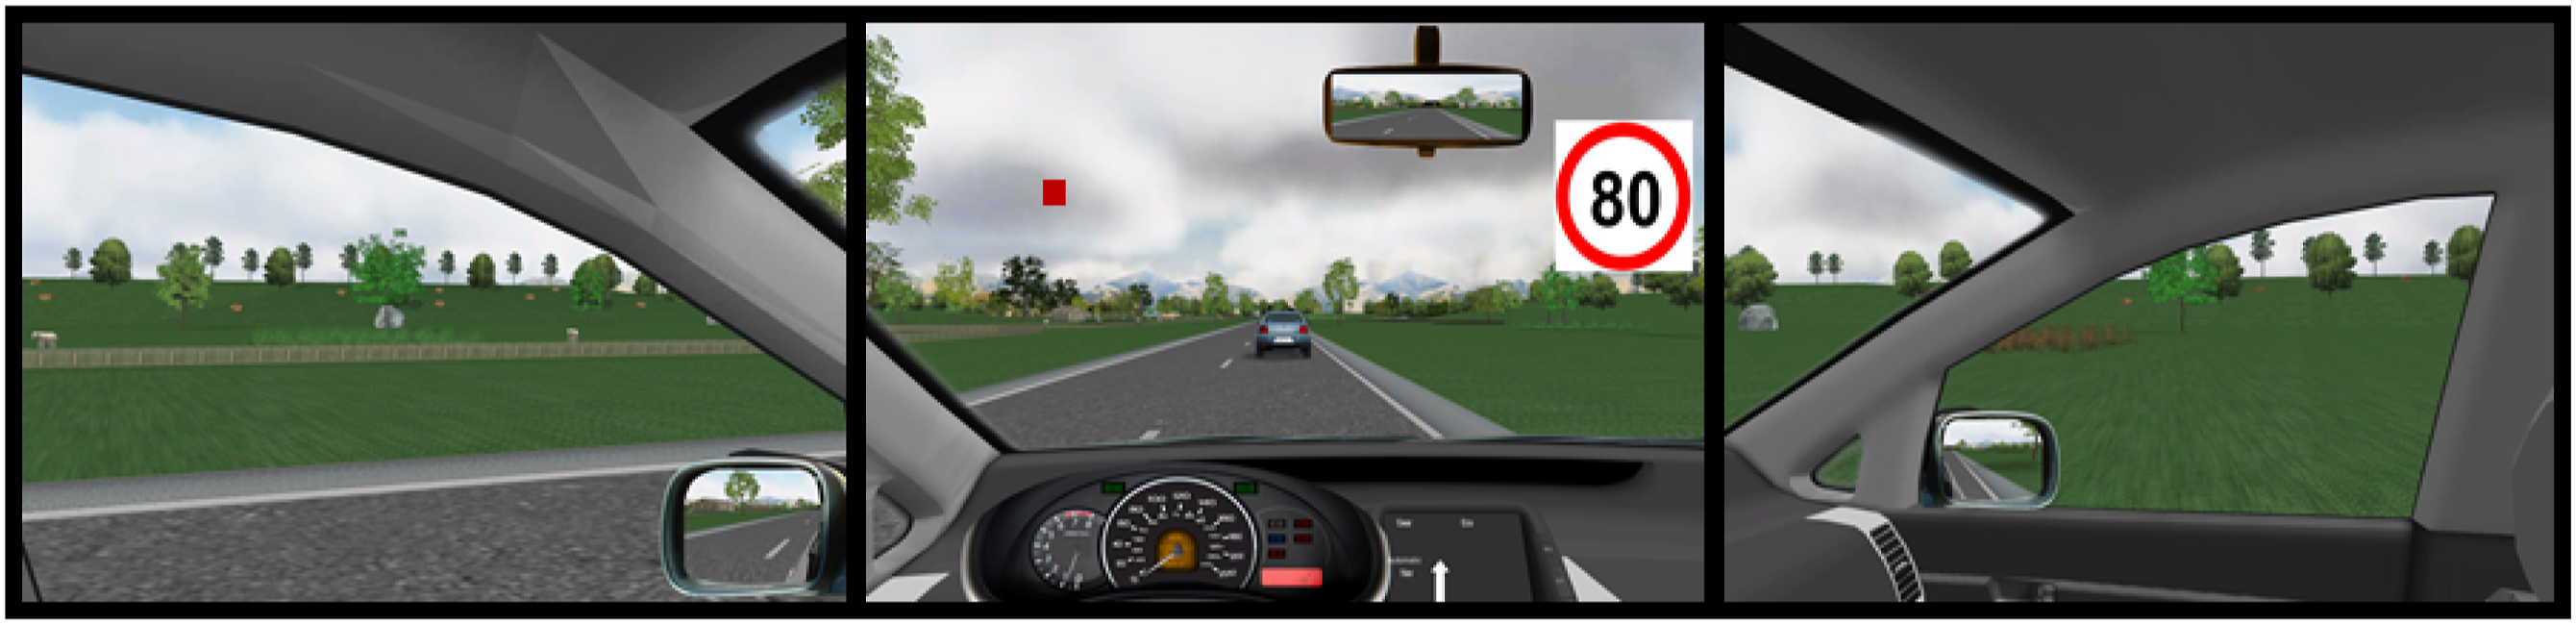
Means and Standard Errors of Driving Performance.
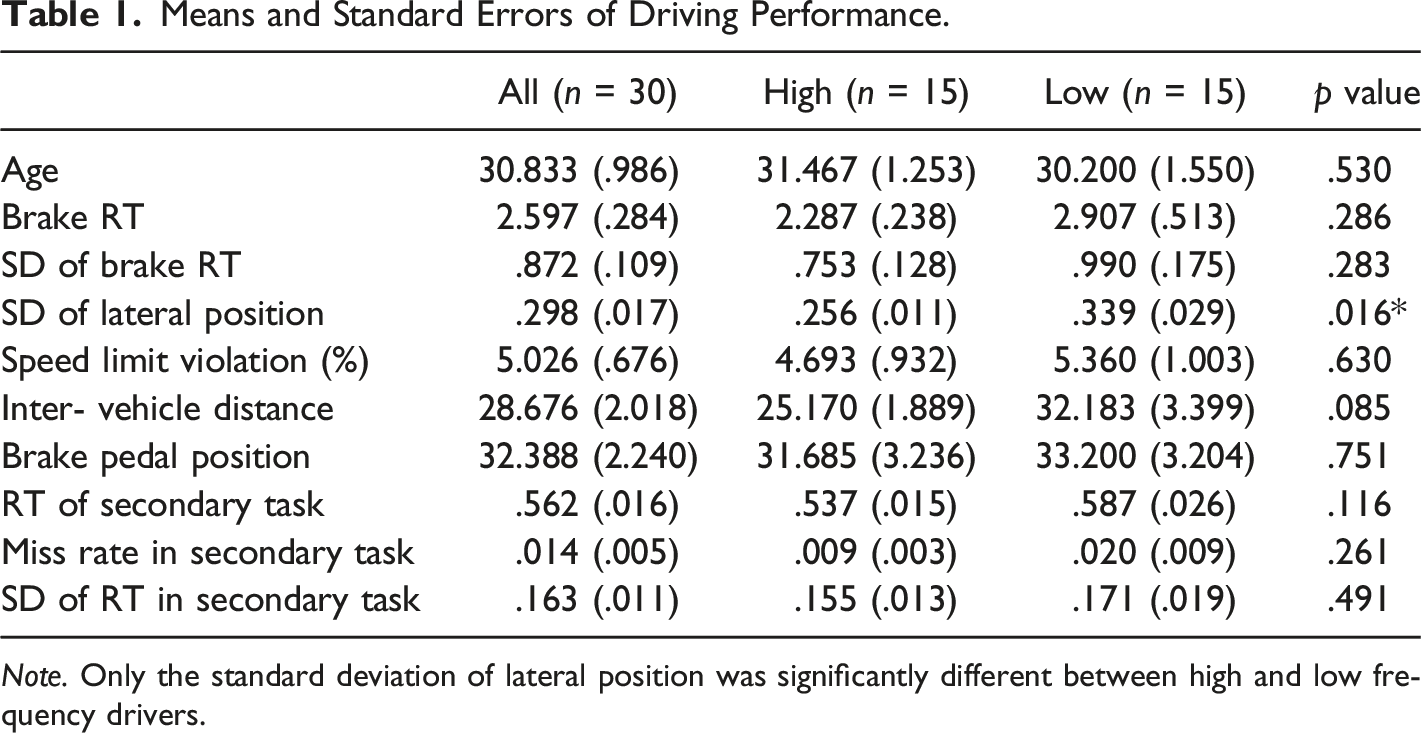
Note. Only the standard deviation of lateral position was significantly different between high and low frequency drivers.
Executive Functioning Tasks
We used three executive functioning tasks to gauge participants’ response inhibition (stop signal task), their risk-taking behavior (Iowa gambling task), and their task-switching ability (task-switching task). All three tasks were implemented using codes from PsyToolkit (Stoet, 2010, 2017).
Stop Signal
The ability to inhibit one’s responses is often measured with the stop signal paradigm (Jongen et al., 2011; Lo et al., 2013). The stop-signal paradigm consists of two kinds of trials (Figure 2): a more frequent “go” trial versus a less frequently occurring “stop” trial in the ratio of 3:1, respectively. In “go” trials, the computer displays a “go” signal that requires a rapid motor response from the participants (e.g., pressing a button). In “stop” trials, a post-go “stop” signal is displayed, which requires the participants to cancel the already-initiated go-response (Logan & Cowan, 1984). In our task, each trial began with a white circle displayed at the center, then the “go” signal would be displayed in the form of a green arrow either pointing to the left or right. Participants were to press the button with their left or right finger as soon as the arrow appeared to indicate their understanding of the direction the arrow was pointing (go trial). They were also told that sometimes the white circle would change to a red circle (i.e., a stop signal), at which time they should cancel their already-initiated action for the “go” signal and not press any button. Furthermore, all responses toward the “go” signals had to be completed within 500 ms, or the trial would be considered incorrect. Therefore, the pressure to respond quickly and accurately to the frequently occurring go signal would make these go responses harder to cancel in midair (when the stop signal did appear). In summary, a correct response in a “go” trial was an accurate left/right response under 500 ms, and a correct response in a “stop” trial is no button press. Procedure of the Stop Signal Task. Note. Participants were to press a key for the go trial. But in 30% of the trials, a red circle would appear, signaling the participants to ignore the go signal and not press any button. The SSD would vary from 100, 150, 200, to 250 ms, coupled with participants’ error rate, to gauge each participant’s ability to inhibit a motor action.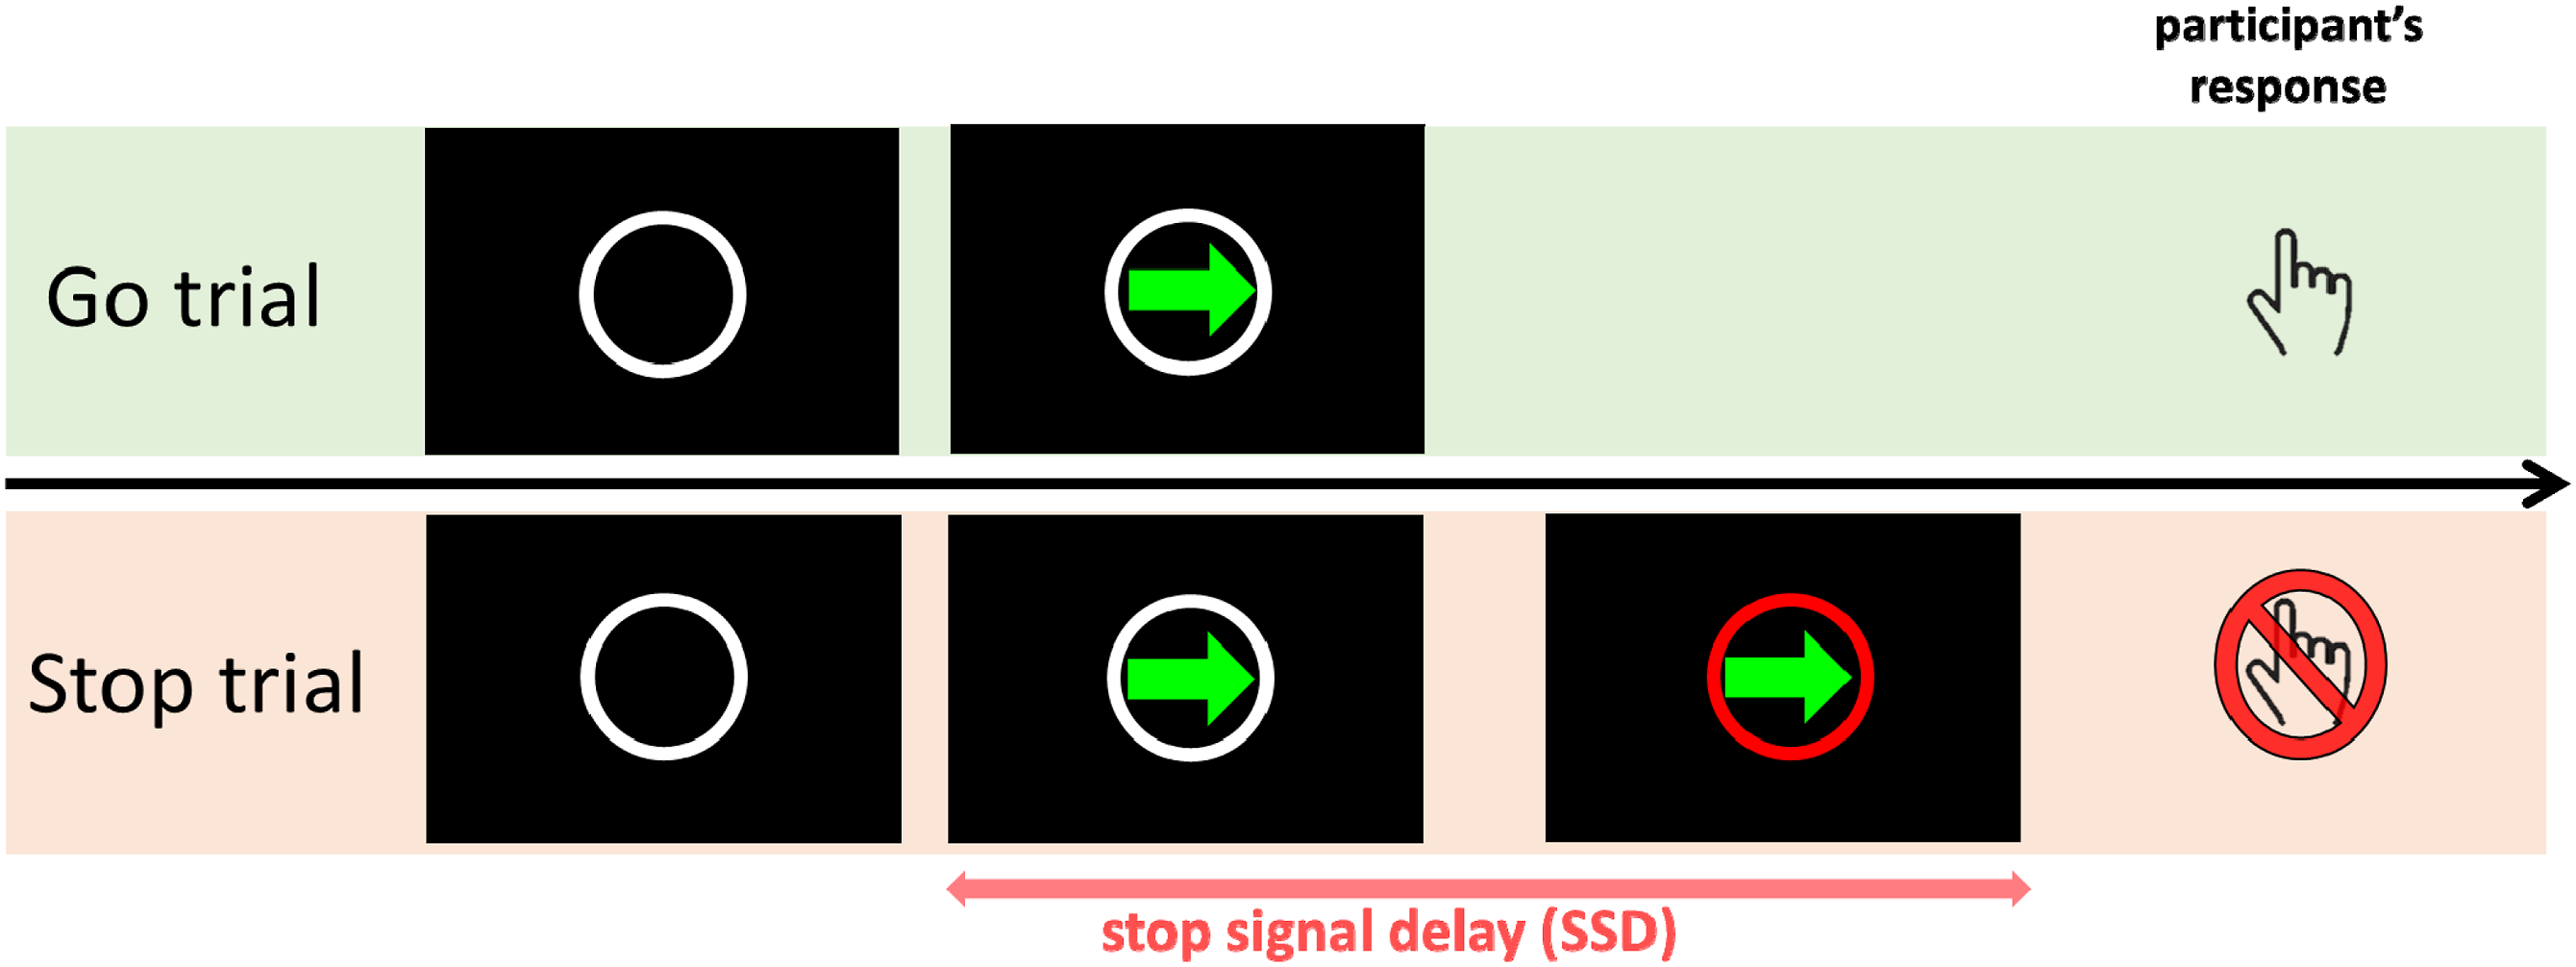
In the first session, participants responded quickly to “go” trials until they responded correctly to at least 20 successive trials. In the second session, they completed a formal stop signal task consisting of 84 go trials and 36 stop trials (120 trials total). In the 36 stop trials, the onset of the stop signal (i.e., the red circle) was either 100, 150, 200, or 250 ms after the onset of go signal, in random order. This time interval that began with the “go signal” and ended with the “stop signal” was called the stop signal delay (SSD), where shorter SSD is easier and longer SSD is harder.
We first analyzed individual mean RT for successful go trials. We then calculated each participant’s stop signal reaction time (SSRT) by considering the distribution of go RT and the likelihood of responding when faced with a stop signal delay (i.e., failure to stop, or error rate). In essence, if the error rate was represented by 'x' at a particular SSD, it signified that the stop processes had concluded at the point corresponding to ‘x’ within the observed go RT distribution. Subtracting the SSD from this ‘x’ value yielded the SSRT. For example, if SSD = 150 ms, non-cancelled rate = .4, and the 40th percentile RT of the observed go RT distribution = 350 ms, the observed SSRT would be 350–150 = 200 ms for this SSD. We calculated SSRT for each of the 4 SSD (i.e., 100, 150, 200, 250 ms), then averaged the four SSRTs (Logan, 1994; for a brief review, see Verbruggen & Logan, 2008; for an in-depth review and theoretical models, see Verbruggen & Logan, 2009).
Task-Switching
The task switching paradigm was used to measure rule-switching ability, which is an aspect of executive function (Ravizza & Carter, 2008). In this paradigm, participants shifted their attention between two tasks according to a task cue. On each trial of this task, a rectangular frame with upper and lower sections was displayed. The words “shape” and “filling” were presented above and below the frame, respectively. Four stimuli were used in this task, consisting of a combination of two shapes (diamond and rectangle) and a filling of two or three dots. One of the four stimuli was displayed in the upper or lower section of the computer screen on each trial. Participants were asked to judge whether the stimulus represented a shape or a numerical judgement based on the location of the stimulus. If the stimulus was presented in the upper section, participants were asked to press a button based on the shape of the stimulus. If the stimulus was presented in the lower section, participants were asked to press a button based on the number of dots within the shape. Participants completed these two simple judgement tasks over 48 trials each for shape and numerical judgement. For the simple shape judgement, the stimulus always appeared in the upper section, and for the simple numerical judgement, the stimulus always appeared in the lower section.
After completing the simple judgement tasks, participants engaged in 96 multitask trials in which shape and numerical judgements were presented alternately, with the stimulus appearing in the upper or lower section at random. Participants were required to respond based on the location of the stimulus, and their reaction times and accuracy were recorded. In the multitasking block, the trial following a trial with a different judgement was a switch trial, and the trial following a trial with the same judgement was a repetition trial. The difference in reaction time between switch trials and repetition trials was the switch cost, with a higher switch cost indicating that participants took more time to switch between tasks compared to their response times when repeating the same task (Monsell, 2003; Wylie & Allport, 2000). This measurement of switch cost was based on the rationale that some processes of ‘task-set reconfiguration’ – analogous to mental ‘gear changing’ – are necessary in order for a successful task-switch to happen (Figure 3). This task-set reconfiguration can include multiple processes, such as shifting attention from task A to B, retrieving goals/rules of task B, or shifting motor responses from task A to B (for a brief review, see Monsell, 2003). Research has shown that the task-switching task, like many other tasks sensitive to executive functioning, relies heavily on activities from the prefrontal cortex (Hyafil et al., 2009; MacDonald et al., 2000). Procedure of the Task-Switching Task. Note. A target stimulus might appear either in the upper or lower half of the display. On the simple task, if the target stimulus appeared in the top half, participants were to respond according to the shape. If the target stimulus appeared in the lower half, participants were to respond according to the number. On multitask trials, participants had to monitor both the location of the stimulus and the need to switch or repeat their response.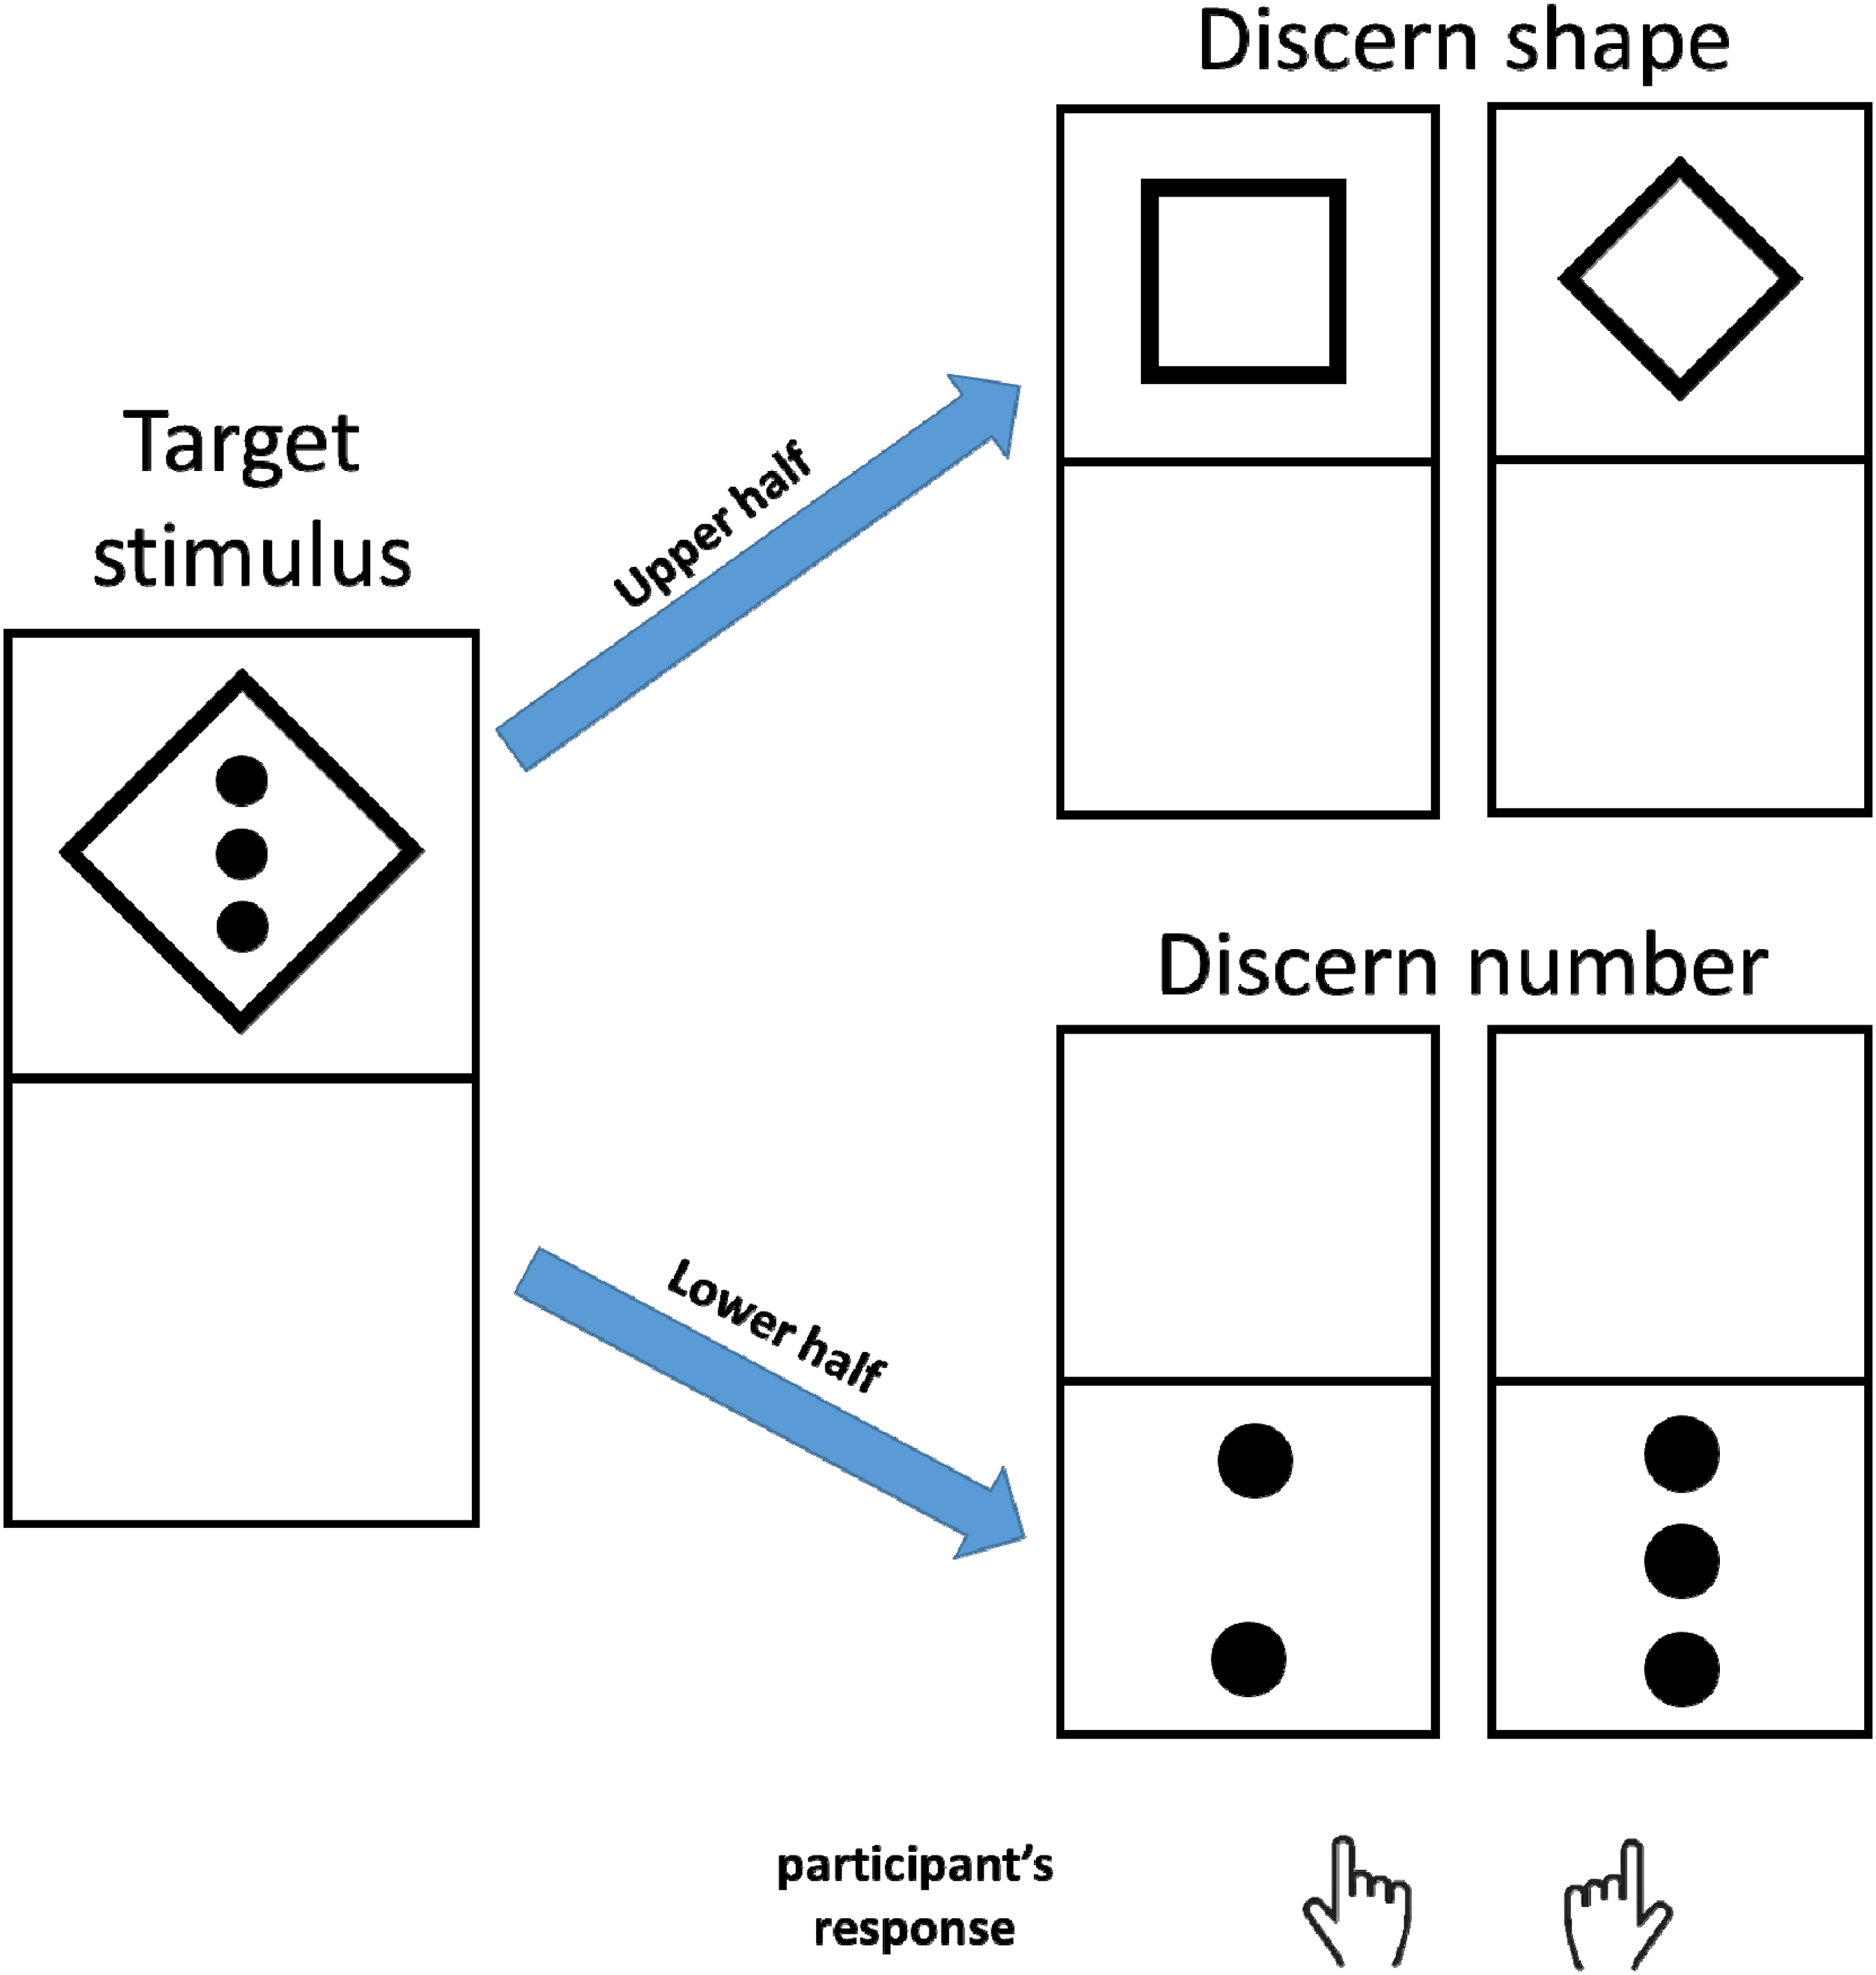
Iowa Gambling Task or IGT
Participants completed 100 trials of the IGT. At the beginning of each trial, the participant was given $2000 virtual dollars, which were displayed on the screen. In each trial, the participant was asked to select from one of four decks: A, B, C, or D. After making their selection, they would receive feedback on the screen indicating whether they had won or lost money. The amount of money they had remaining was displayed at the top of the screen. The goal of the task was to win as much money as possible.
For selections made from decks A or B (i.e., the “bad” decks), there was a 50:50 chance that participants would win $100 or lose $250. For selections made from decks C or D (i.e., the “good” decks), there was a 50:50 chance for winning $50 or losing $50. The number of times the participant selected each of the four decks was recorded, and a behavioral score was calculated by subtracting the number of selections from the bad decks (i.e., decks C and D) from the number of selections from the good decks (i.e., decks A and B). Lower scores indicated higher risk-taking preference or poorer decision-making performance (Figure 4). Sample Display of the Iowa Gambling Task. Note. Participants began with $2000 virtual dollars and had to pick a card from one of the four decks (i.e., A, B, C, and D). The winning rate was always 50%, but the bad decks (e.g., (A), (B) would either win $100 or lose $250, whereas the good decks (e.g., (C), (D) would either win $50 or lose $50.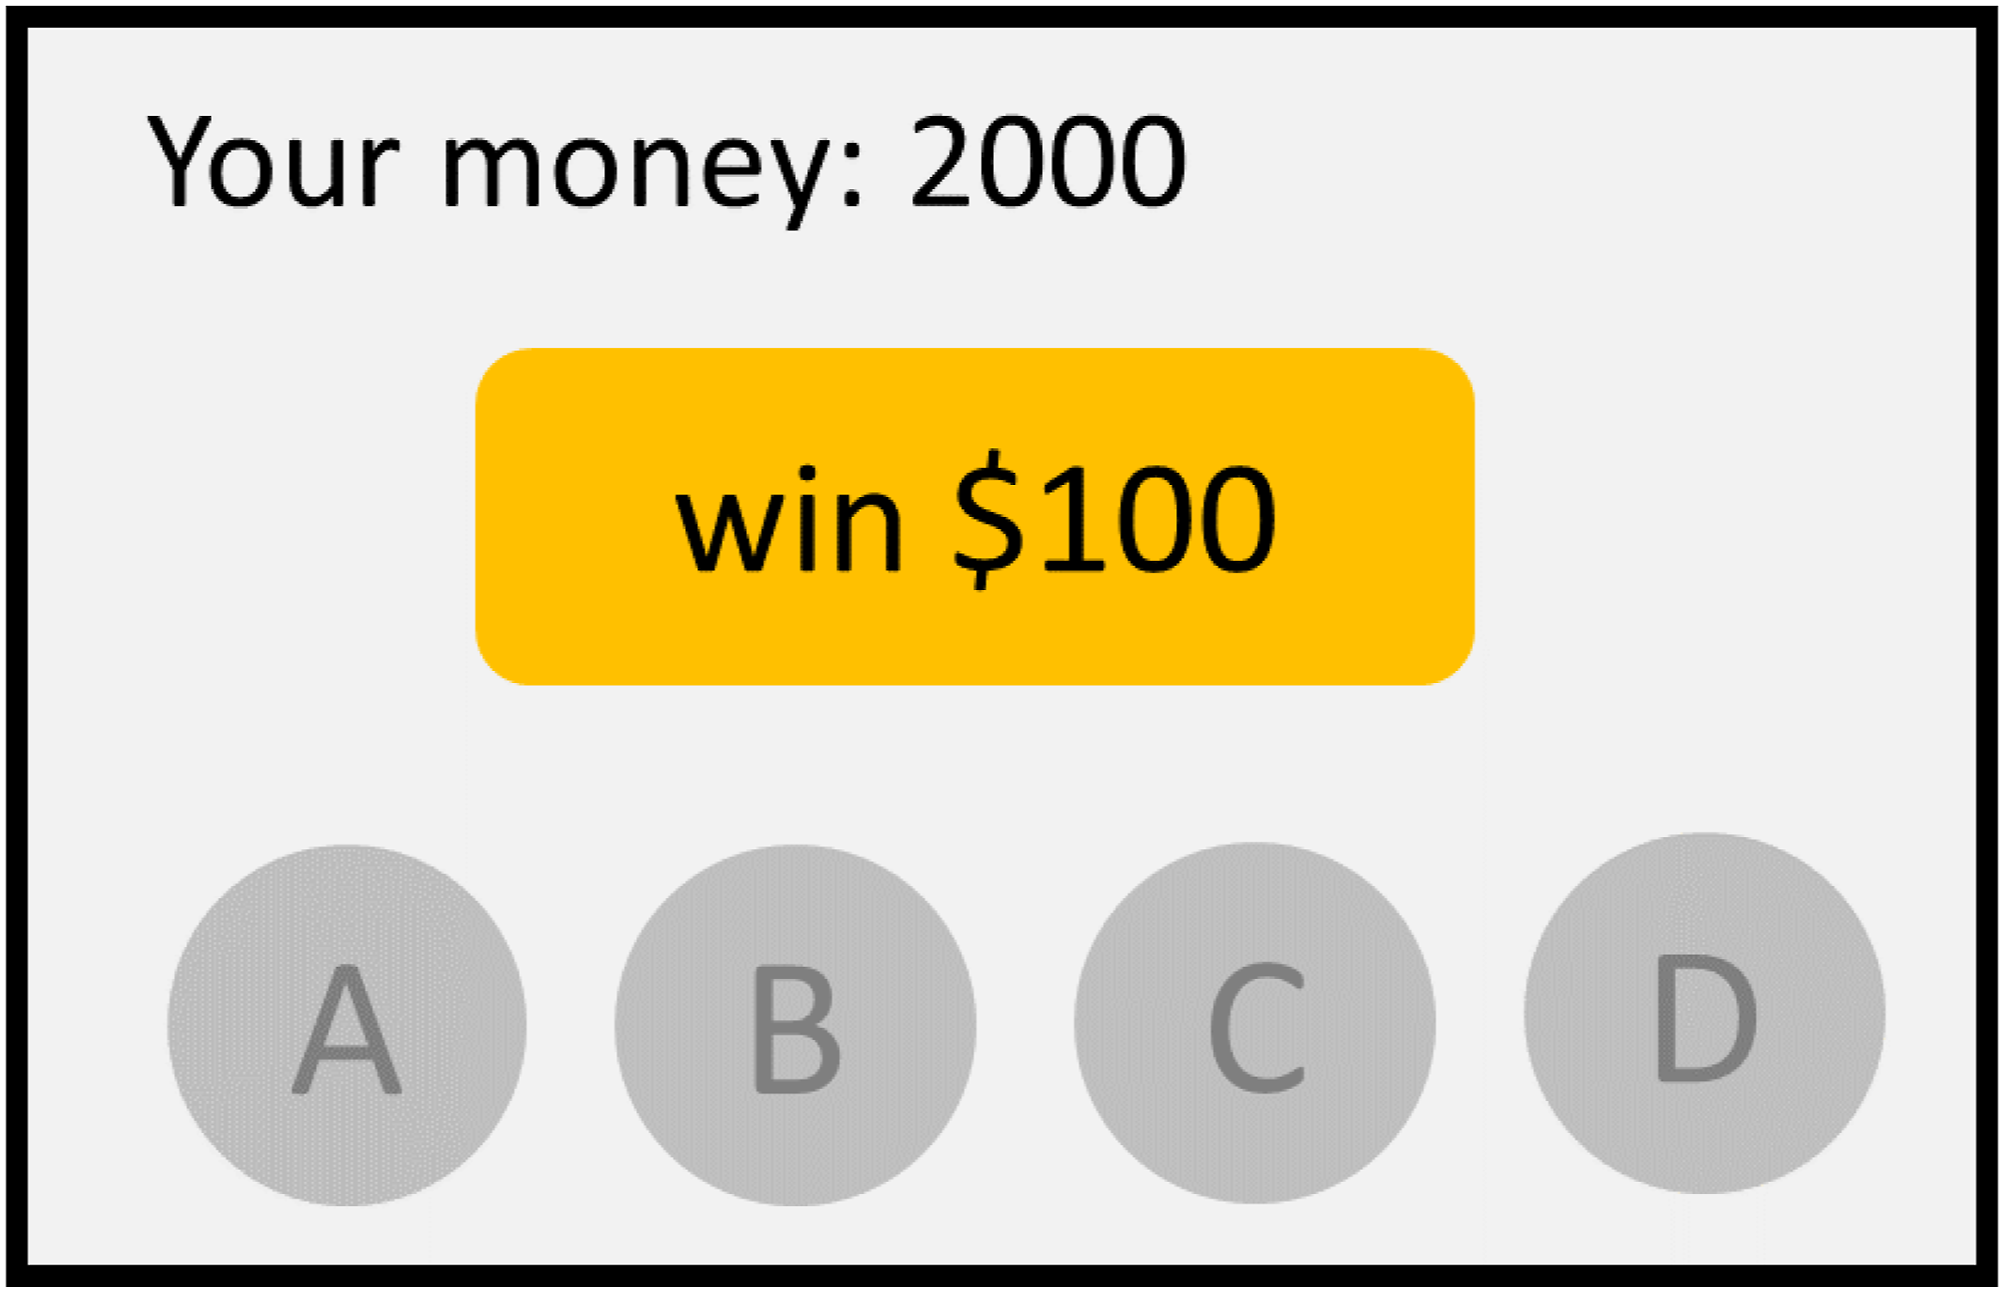
Data Analyses
We performed Pearson correlation analyses between driving performance and the participants’ scores on executive functioning tests. To investigate whether participants’ driving frequency was related to their driving performance in the driving simulator, we divided participants into two groups based on their driving frequency and conducted independent samples t-tests to judge significant group differences. The independent variable was group membership (low vs. high driving frequency) and the dependent variables were the driving performance measures (e.g., SDLP, speed limit violations, brake pedal position, etc.). Furthermore, we performed separate Pearson correlation analyses between driving performance and behavioral indices of executive tasks in the low and high driving frequency groups, respectively.
Results
Correlations Between Driving Performance and Executive Functioning Tasks
Scenario 1
To investigate whether scores on executive functioning were significantly correlated with driving performance, we conducted Pearson correlation analyses between driving performance measures and scores on executive functioning tasks. We observed three significant correlations. The percentage of speed limit violations and brake pedal position were positively correlated with SSRT [speed limit violation: r = .569, p = .001; brake pedal position: r = .705, p < .001]. Furthermore, the percentage of speed limit violations was also correlated with the participants’ score on the IGT [r = −.475, p = .008]. The task-switching task was not correlated with any driving performance parameter (Figure 5, Scenario 1). Correlations of SSRT and IGT Score with Focused Driving (Scenario 1) and Distracted Driving (Scenario 2) Performance. Note. In both scenarios, SSRT was positively correlated with brake pedal position and the percentage of time in which speed limit was exceeded. IGT score was negatively correlated with the proportion of time of speed limit violations in Scenario 1 but not in Scenario 2.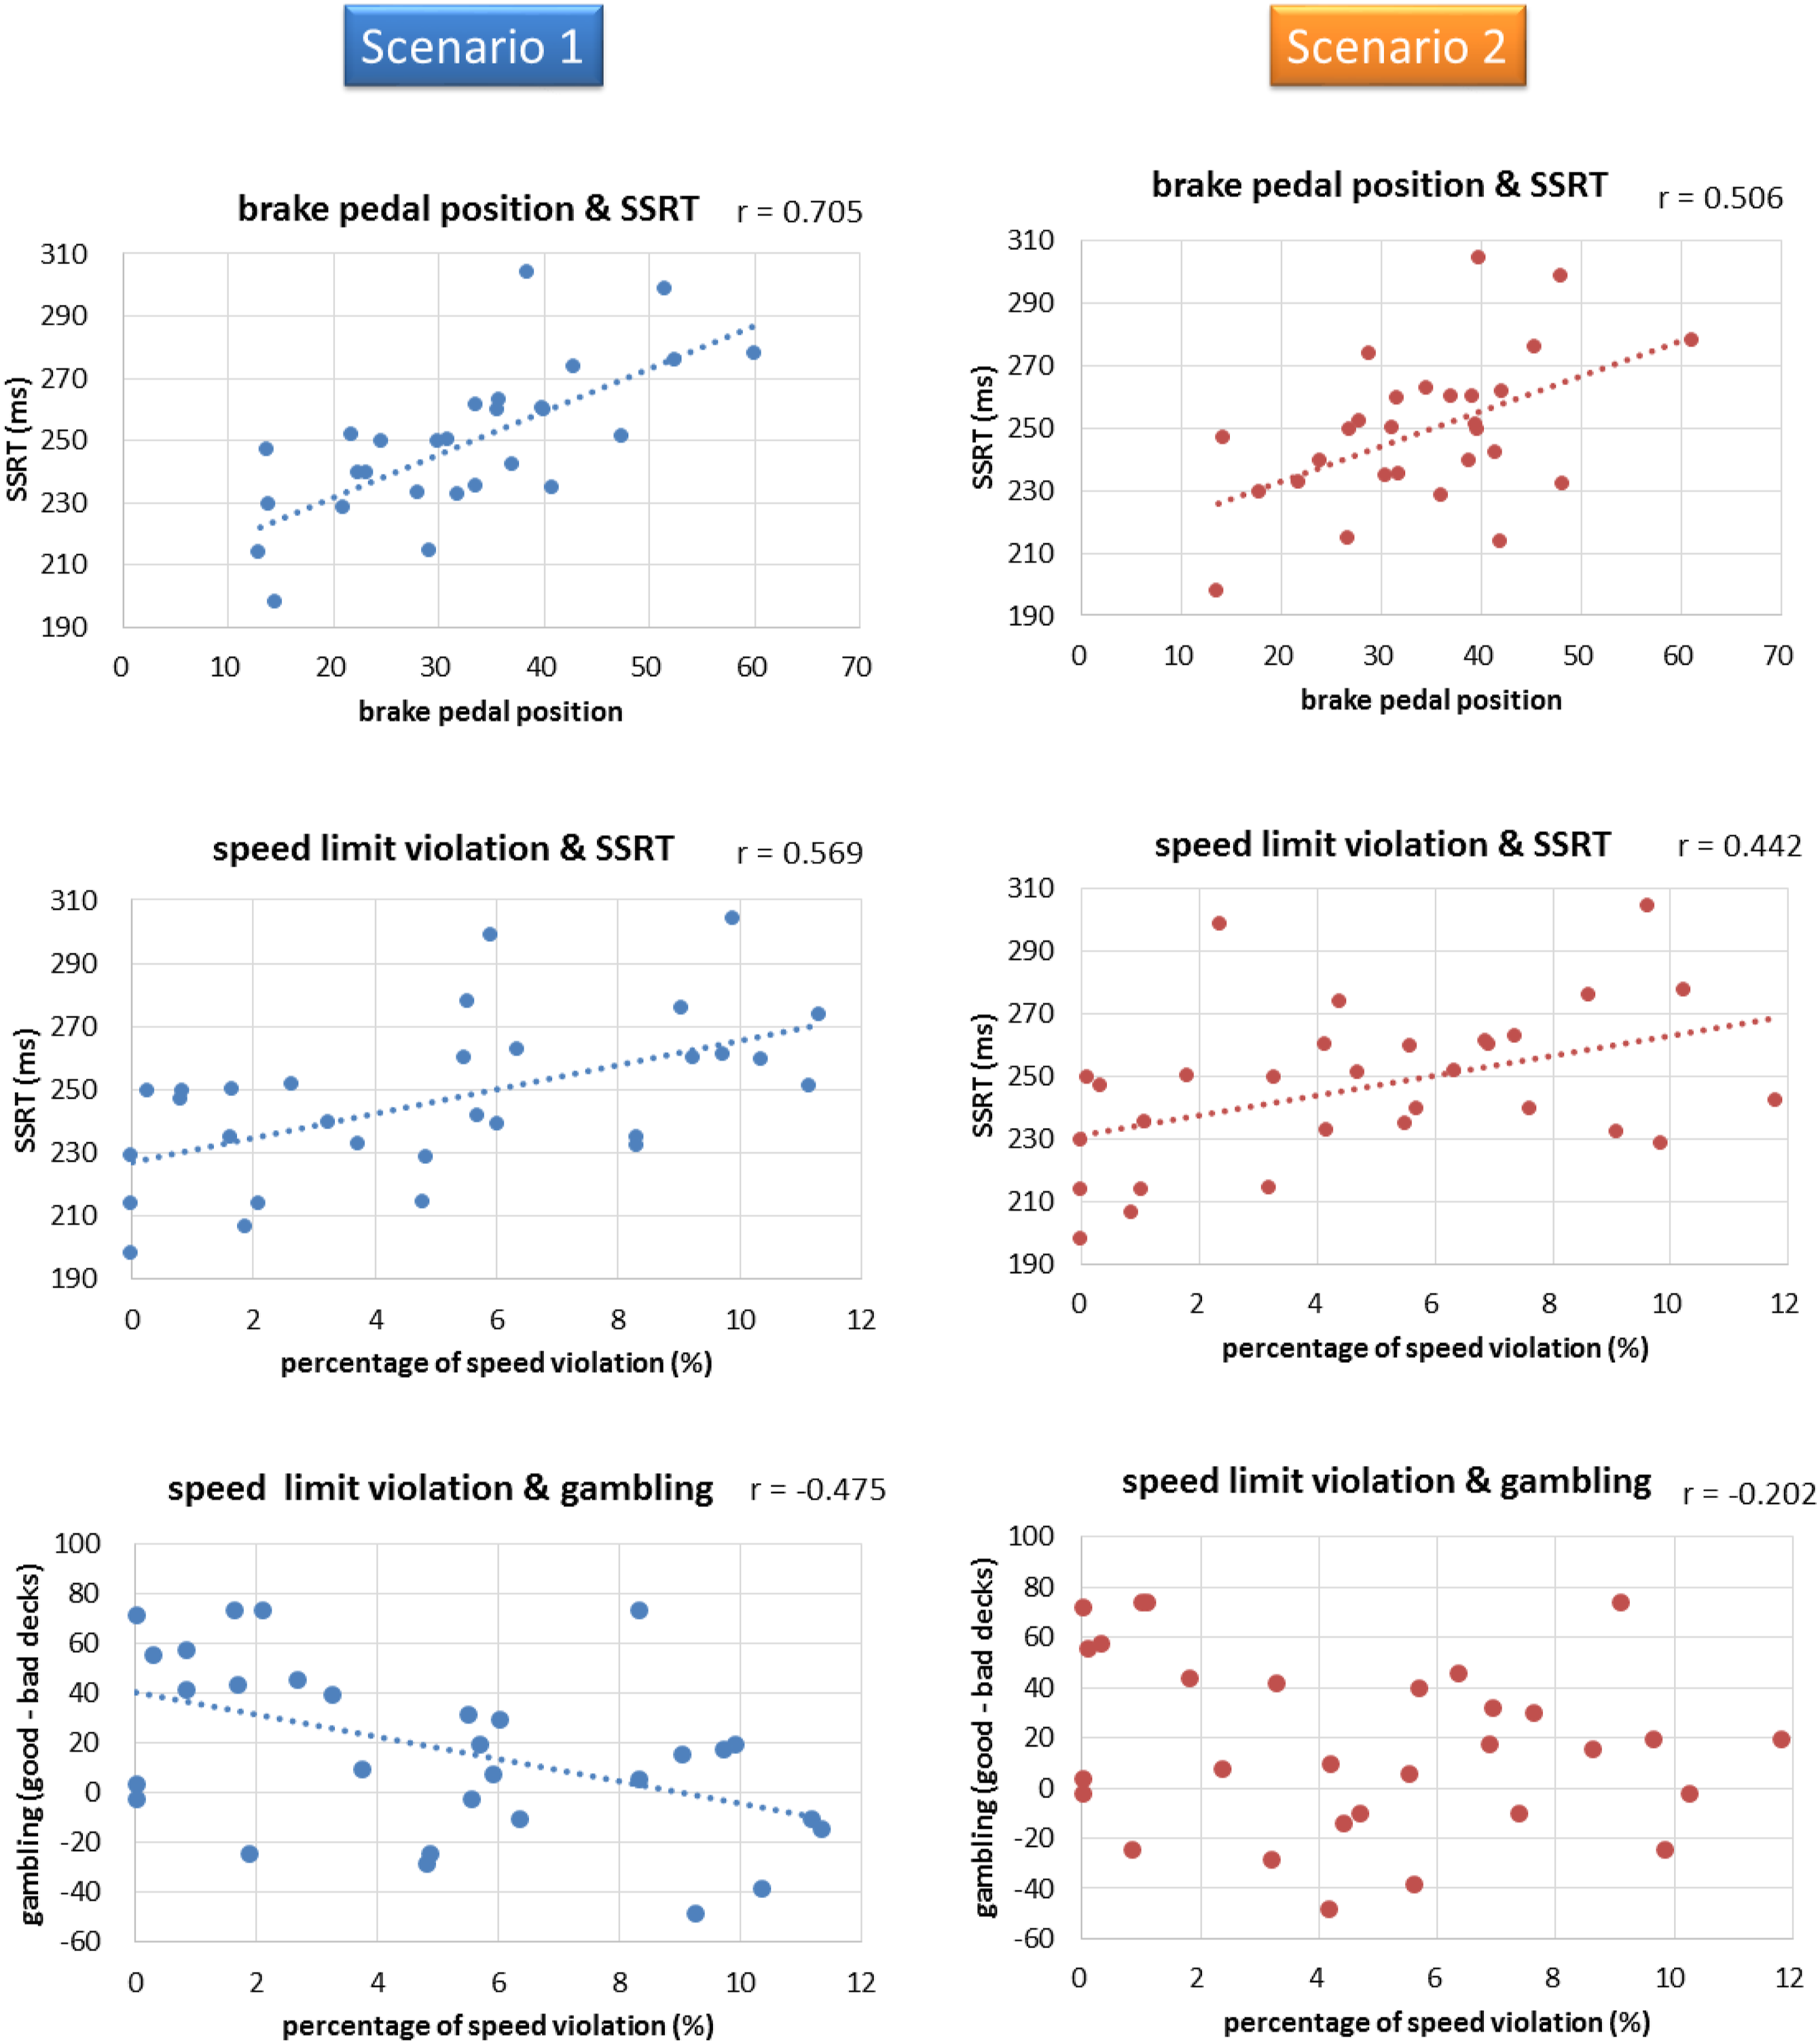
Scenario 2 (With a Secondary Detection Task)
Participants completed the follow-lead-car task with a concurrent secondary detection response task (i.e., pressing a button on the steering wheel as soon as they saw the red square appear on screen) in Scenario 2. Besides conducting the Pearson correlation analyses between driving performance measures and scores on executive functioning tasks, we also conducted Pearson correlation analyses between participants’ secondary task performance and scores on executive functioning tasks. We found participants’ RT and miss rate from the secondary detection response task didn’t correlate with their scores on any of the three executive tasks.
For the correlation between driving performance and executive tasks, we found that the percent time of speed limit violations and brake pedal position were still positively correlated with SSRT [speed limit violation: r = .442, p = .014; brake pedal position: r = .506, p = .006], but the behavioral score in the gambling task [speed limit violation: r = −.202, p = .285] from Scenario 2 was no longer correlated with speeding (Figure 5, Scenario 2). Although the percentage of speed limit violations and brake pedal position were correlated with SSRT in both scenarios, the correlation coefficient was slightly lower in Scenario 2 [comparison of the two correlation coefficients using Pearson and Filon’s z: z = 1.646, p = .10].
Comparison of Driving Performance in Scenario 1 and Scenario 2
Scenarios 1 and 2 were identical except for the secondary detection task, which only Scenario 2 included. To investigate whether the driver’s attention was influenced by the secondary detection task and how it affected their driving performance, we conducted a paired t test to compare the driving performance parameters in both scenarios. No major differences were found in our main driving indices, except for the percentage of time the vehicle crossed the left line (t (29) = 3.261, p = .031), which was significantly lower in Scenario 2 (M = 15.76, SD = 34.80) than in Scenario 1 (M = 32.39, SD = 64.12). This result was probably due to the participants completing Scenario 1 before Scenario 2.
Modulatory Effects of Driving Frequency
To test our hypothesis that driving frequency (the amount of “practice” one has) modulates the correlation between executive performance and driving performance, we divided the participants into high-frequency and low-frequency drivers. The mean scores and standard deviations for the driving performance of the high- and low-frequency drivers are shown in Table 1. The only significant difference between the two groups was in SDLP [t (28) = 2.648, p = .016]. The high-frequency drivers outperformed their low-frequency counterparts in lane keeping. Additionally, the intervehicle distance differed marginally between the two groups [intervehicle distance: t (28) = 1.804, p = .085], demonstrating that SDLP is a sensitive measure of driving experience (Table 1).
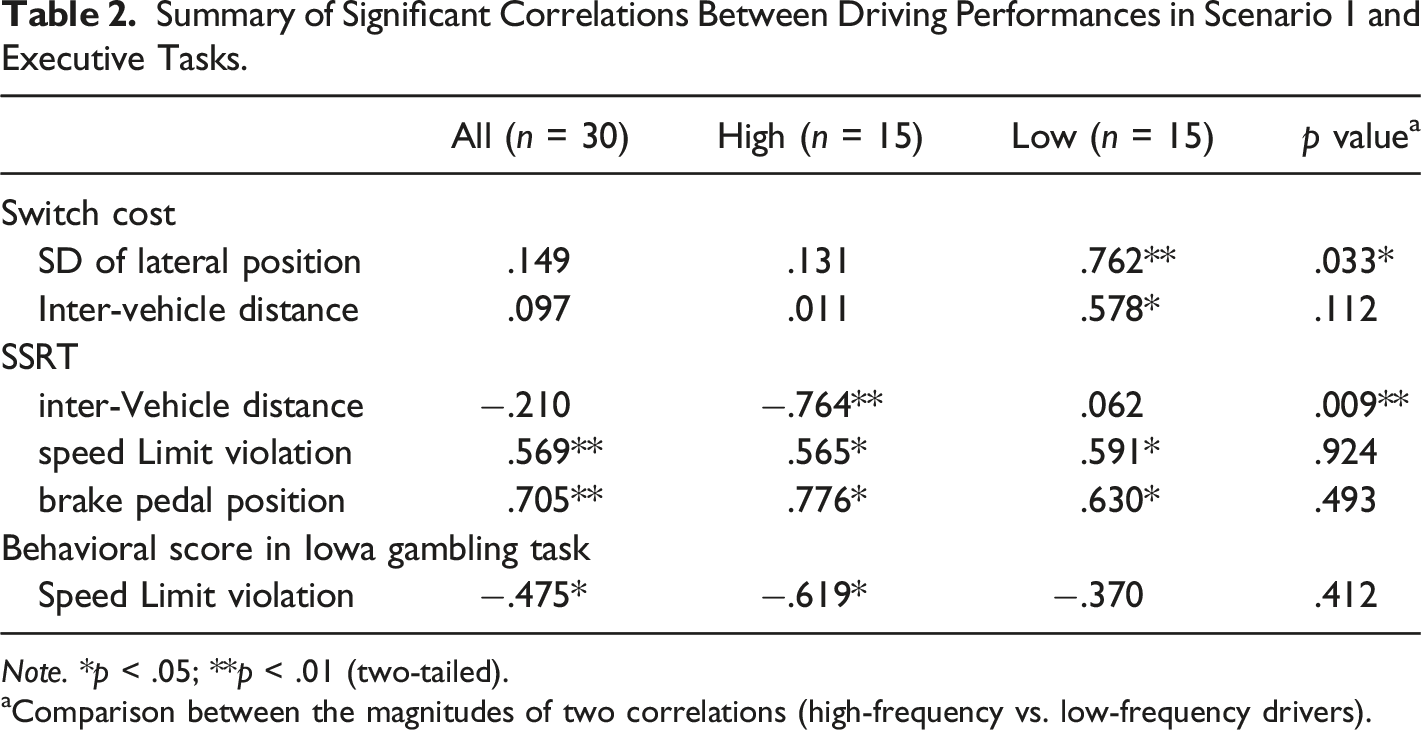
We performed Pearson correlation analysis of the driving performance in Scenario 1 and behavioral scores on executive functioning tasks of the low- and high-frequency groups (Figure 6 Correlations Between Behavioral Scores and Driving Performance by Driving Frequency. Note. (a) Correlation between SDLP and task-switching cost in low-frequency group. (b) Correlation between intervehicle distance and task-switching cost in low-frequency group. (c) Correlation between intervehicle distance and SSRT in high-frequency group. (d) Correlation between speed limit violation (percent time) and IGT scores in high-frequency group. Summary of Significant Correlations Between Driving Performances in Scenario 1 and Executive Tasks. Note. *p < .05; **p < .01 (two-tailed). aComparison between the magnitudes of two correlations (high-frequency vs. low-frequency drivers).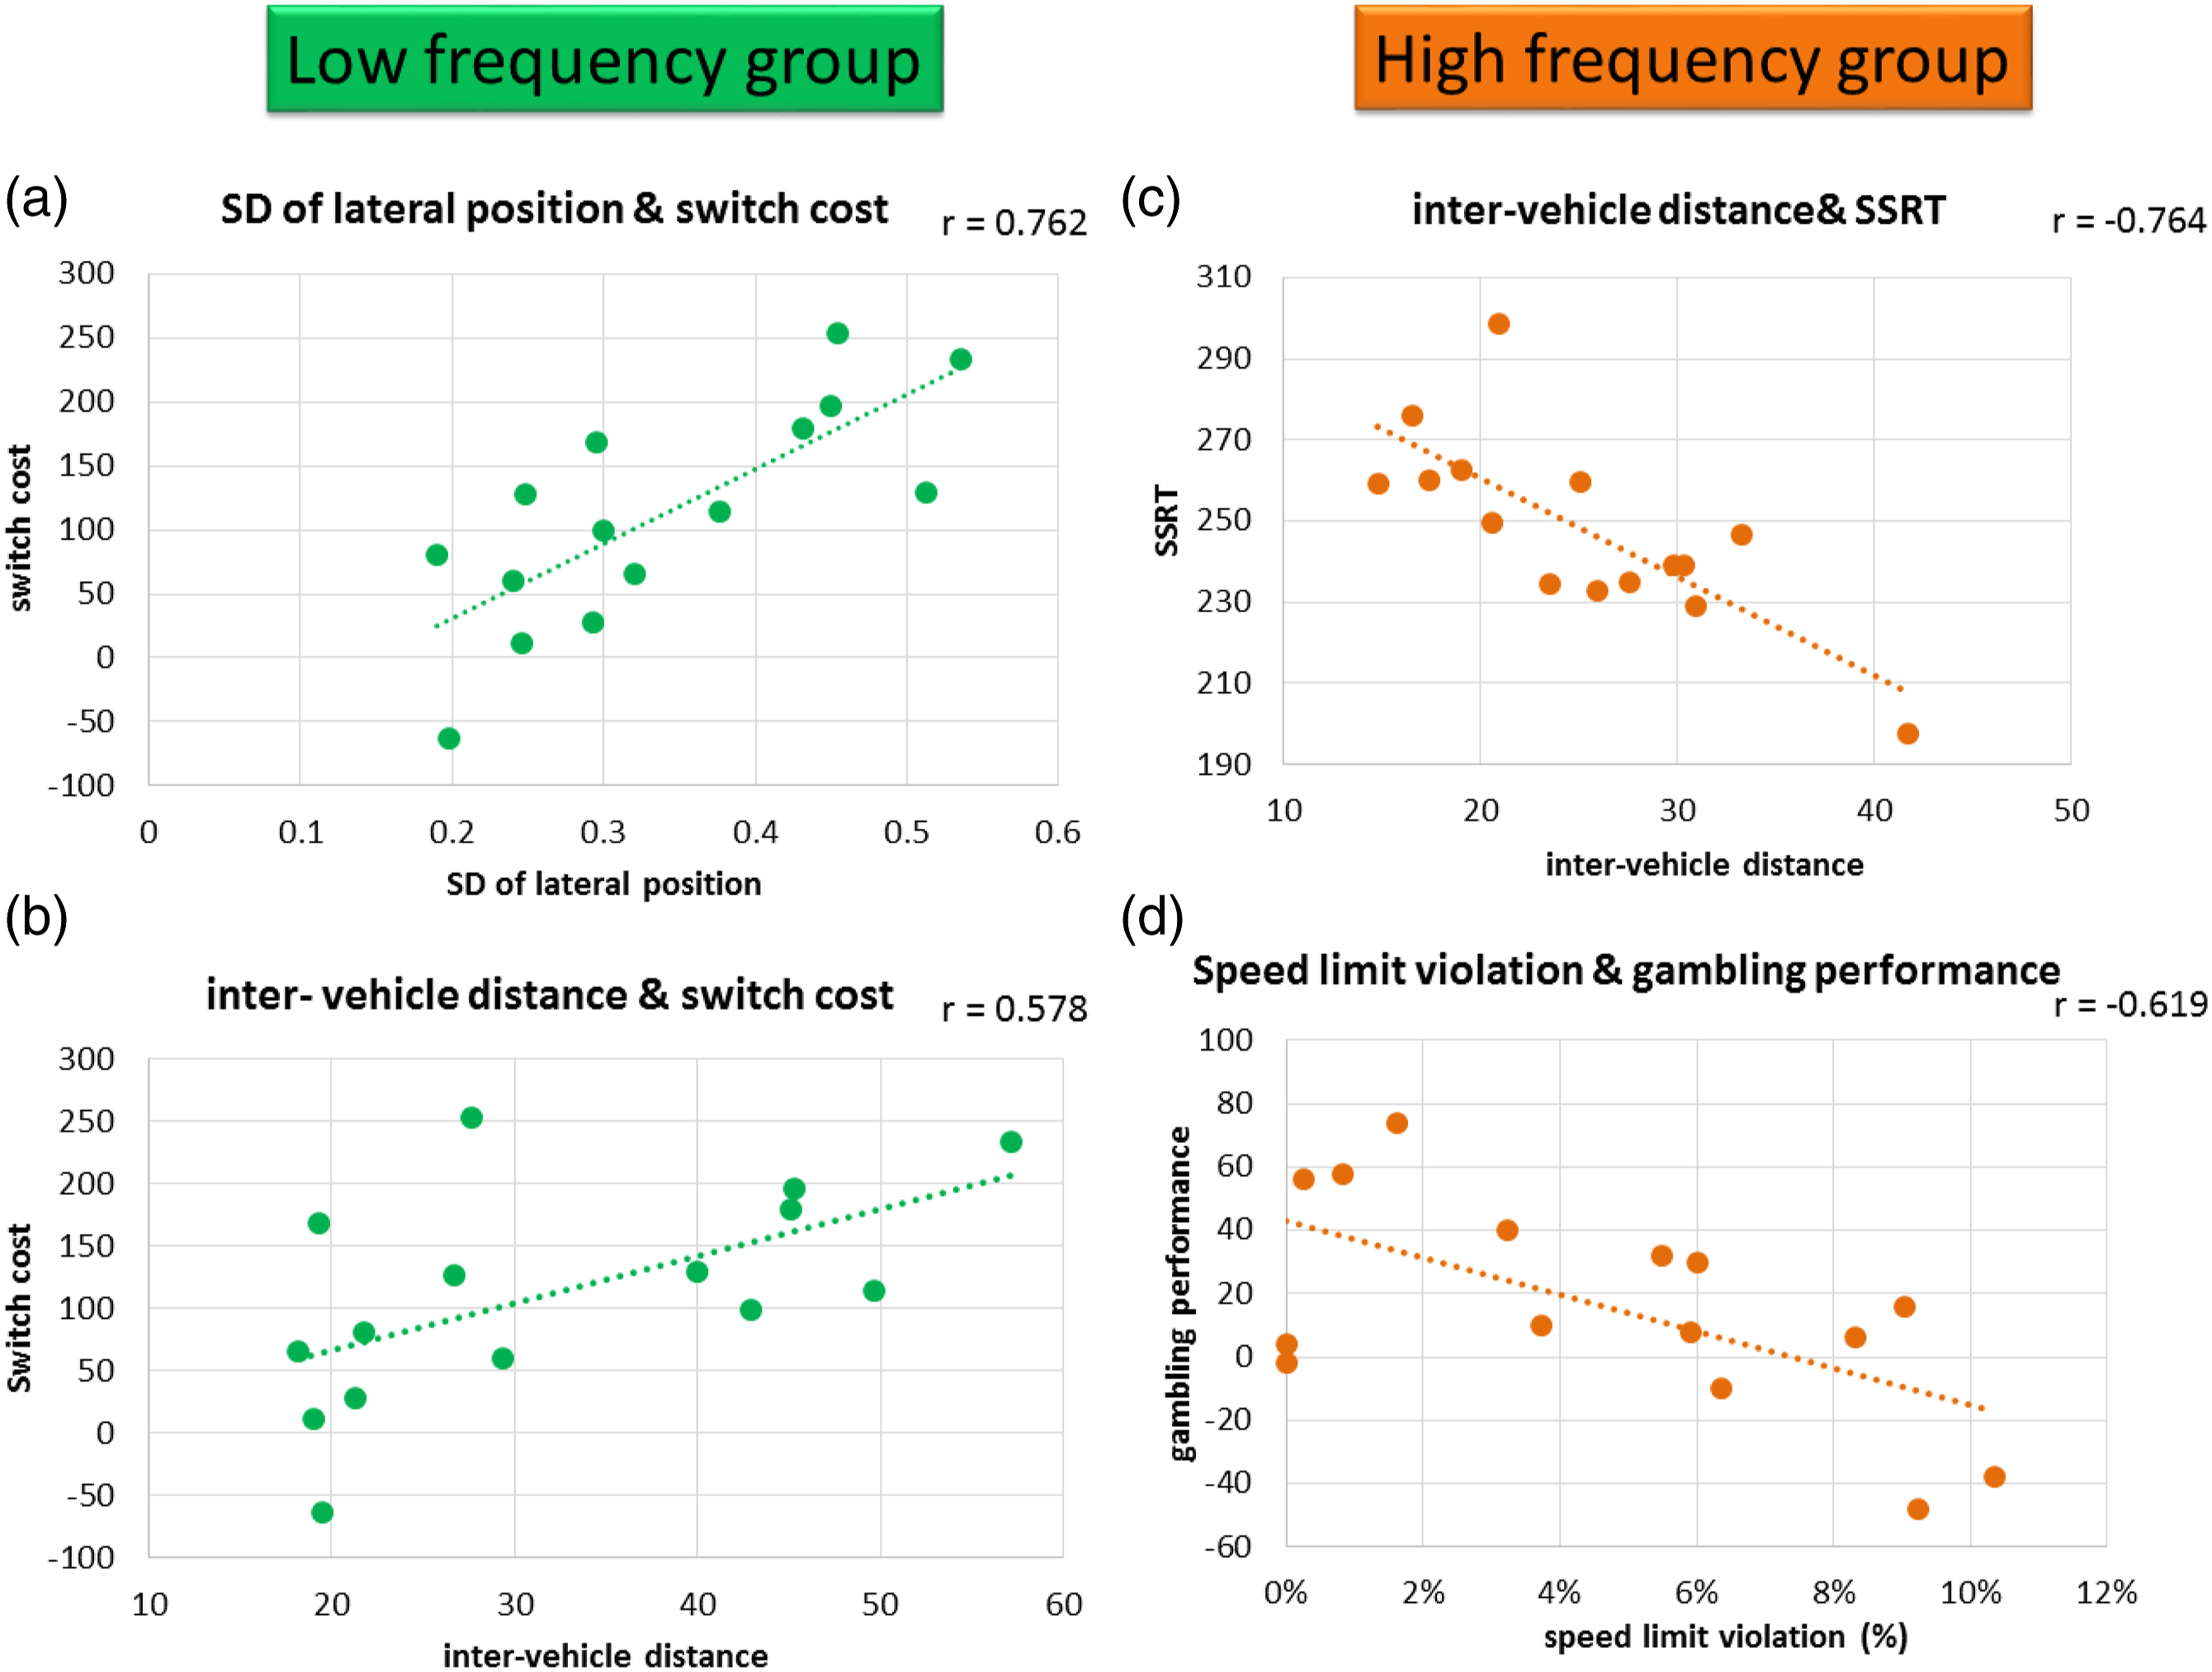
Discussion
We investigated the executive correlates of driving behaviors and whether driving frequency is a modulating factor. SSRT and IGT score were significantly correlated with speed limit violations during focused driving. During distracted driving, however, only SSRT was significantly correlated with speed limit violations. Task-switching cost was positively correlated with lane-keeping deviations (i.e., SDLP) and intervehicle distance among low-frequency drivers; among high-frequency drivers, SSRT and IGT score were correlated negatively with intervehicle distance and speed limit violations, respectively.
Based on these findings, we highlight one practical and one theoretical implication worth considering. First, the correlations between different executive measures (e.g., task-switching cost) and their corresponding driving index (e.g., lane-keeping deviations) possibly suggest that complex driving behaviors may be considered as the summation of many building blocks of executive functioning. Therefore, despite the simplicity of lab-based executive tasks, a good collection of them that is representative of the core abilities of driving may be useful in predicting one’s performance on the road. This practical application can be particularly useful as most cognitive and executive tasks can be easily administered online on any mobile device. Second, our results demonstrate an important role for driving frequency in some of these correlations. This is consistent with the long-standing automatic processing theory in cognitive psychology (Hasher & Zacks, 1984), which states that processing for, as well as responses to, frequently encountered/rehearsed information can be encoded implicitly to reduce cognitive processing demand and facilitate automatic processing (e.g., Tseng et al., 2011). Thus, driving frequency may be an important covariate to consider for predictive modeling of driving performance.
Effects of Driver Distraction
Driver distraction results in impaired performance (Stutts et al., 2001; Wang et al., 1996). In Scenario 1 (i.e., no distraction) SSRT and speed limit violations were significantly correlated with brake pedal position, and IGT score was significantly correlated with speed limit violations. In Scenario 2 (i.e., distraction), the addition of a distractor task (a) weakened the predictive power of SSRT for brake position and speed limit violations (remained significant) and (b) eliminated the significant correlation between IGT score and speed limit violations. These results suggest that although SSRT and IGT score were both correlated with speed limit violations, the two relationships probably differ fundamentally; and, thus, their susceptibility to the influence of distraction also differs. Although SSRT is often considered an impulse control measure, it is a motor inhibition control measure (Logan, 2015; Logan et al., 1984). Therefore, the correlations of SSRT with both speed limit violations and brake pedal position are logical. By contrast, IGT score may be more closely related to impulse control in the domain of risk-taking and decision-making rather than motor inhibition (Almy et al., 2018; Bechara et al., 1994) because higher order executive attributes such as decision-making may be more prone to attentional distraction. These results suggest that SSRT may be an accurate predictor of driving performance because it is a robust measure and not influenced by attentional distraction.
Modulating Effect of Driving Frequency
Driving performance, particularly SDLP, differed among high- and low-frequency drivers when we grouped participants on their driving frequency. This suggests that SDLP is a sensitive measure of driving ability and that high-frequency drivers are more skilled; however, a causal relationship cannot be inferred from our data.
In both groups, participants with poorer motor inhibition (i.e., longer SSRT) and greater risk-taking behavior (i.e., lower IGT score) had a higher percentage of speed limit violations. This correlation was consistent across all 30 participants stratified by driving frequency. Combined with our results on driver distraction, these data suggest that SSRT is a robust predictor of speed limit violations regardless of driver distraction and driver expertise (i.e., frequency). Future studies aiming to predict real-world driving behavior should consider SSRT as a major executive functioning predictor.
Among low-frequency drivers, task-switching cost was positively correlated with SDLP and intervehicle distance. The task-switching test places multitasking demand that requires participants to be conscious of two sets of rules and able to switch between them quickly depending on the situation. SDLP is related to controlling the steering wheel, whereas maintaining a consistent intervehicle distance is mostly related to foot control (i.e., brake pedal use). This may explain why driving performance measures were correlated with task-switching cost only for low-frequency drivers—because they have not automated the various executive processes of vehicle control. Driving may feel like multitasking to individuals without sufficient practice but not to high-frequency drivers with procedural memory of driving tasks.
Among high-frequency drivers, SSRT was correlated with intervehicle distance, and IGT score was correlated with speed limit violations. The IGT measures higher order impulse control in the decision-making domain. Therefore, the correlation of IGT scores with speed limit violations probably indicates a relationship based on impulsivity, in which drivers who take risks are more likely to drive quickly and dangerously. Additionally, SSRT was negatively correlated with intervehicle distance. This suggests that poor inhibition (i.e., higher SSRT) is associated with impulsive driving choices (i.e., shorter intervehicle distance) in high-frequency drivers. While a positive correlation might be expected because individuals with better inhibition (i.e., shorter SSRT) are the ones who can afford to drive closer to cars ahead, this was not the case in our data. We assume that the negative correlation between SSRT and intervehicle distance reflects cautious individuals being likely to brake quickly and maintain a safer distance from the car ahead. Therefore, paradoxically, people with poorer inhibition (i.e., longer SSRT) were more likely to be tailgaters.
Ability or Attitude?
Among high-frequency drivers, both correlations (i.e., SSRT with intervehicle distance and IGT scores with speed limit violations) ostensibly reflect conscious driver choices, such as risk-taking or cautiousness, rather than inherent ability in lane keeping or braking. Such drivers may have a low cognitive
Limitations and Directions for Further Research
Although we employed several tasks to predict different aspects of driving performance and behavior, the tasks can only reflect one’s executive functioning, and do not cover the entire spectrum of one’s cognitive functioning (e.g., perception, attention, memory). Therefore, we cannot speak for the role of driving frequency in other domains of cognition. Additionally, due to the correlational nature of the current study, the directionality and structure of the relationship between executive functioning and driving abilities also requires more research. That is, it is intuitive to think that people who possess better executive functions can also drive better, but whether such a relationship is directly causal, or mediated by other variables, remains unclear at this time. One approach to delineate the nature of such a relationship is to provide participants with cognitive/executive training that might directly alter their performance on the executive functioning tests. If such improvement in executive functioning is also observed in the form of enhanced driving performance, then we may be more confident about the cause and directionality between executive functioning and driving. As of now, the present data cannot shed light on whether driving performance is modifiable via executive training.
Conclusion
We investigated the executive functioning correlates of driving behavior and whether driving frequency modulated these relationships. SSRT was the most accurate predictor of driving performance and was not influenced by the presence of distraction or driving frequency. The IGT score predicted the driving choices of high-frequency drivers, whereas task-switching cost predicted the driving ability of low-frequency drivers. Together, these results highlight the importance of considering driving frequency in investigations of the executive correlates of driving performance (e.g., lane keeping ability) and behavior (e.g., aggressive driving, tailgating).
Footnotes
Declaration of Conflicting Interests
The author(s) declared no potential conflicts of interest with respect to the research, authorship, and/or publication of this article.
Funding
The author(s) disclosed receipt of the following financial support for the research, authorship, and/or publication of this article: This study is supported by National Science and Technology Council, Taiwan; 109-2423-H-002-004-MY4, 112-2410-H-002-252.