
Abstract
Speeding is dangerous and contributes significantly to traffic safety. Despite that, speeding is not perceived as serious crime, and has been a relatively neglected topic in criminology. The purpose of this study is to analyse the effects of different temporal characteristics and weather conditions on speeding sanction rates in automatic traffic enforcement. The analysis focuses on two major highways in Finland. Generalized additive models are used to analyse factors influencing the sanction rates. The findings indicate e.g., that high temperatures are associated with higher rates of speeding, and the converse is true for rainfall.
Introduction
Despite improvements in car safety technology, the relationship between speed and traffic safety remains strong (Elvik et al., 2019; Holocher and Holte, 2019). There is clear evidence (e.g., Elvik, 2014; Kallberg et al., 2014) that speeding is dangerous, but little acceptance of this fact among drivers (Cunningham, 2008). Unlike the dangers of driving under the influence and the benefits of seat belts, about which there is a near-consensus, people’s perceptions of the relationship between speed and crashes are quite varied (Shinar, 2017: 238). Although the relationship between speeding and traffic safety is very complex (see Shinar, 2017: 238–239), excessive speed has been found to contribute to a substantial number of crashes (Wilson et al., 2010). According to the Finnish Crash Data Institute OTI (2020), some human risk factor influenced 94 per cent of all fatal motor-vehicle crashes studied by the road accident investigation teams in Finland in 2018. A risk factor related to the condition of the driver, such as alcohol, illness, fatigue or state of mind, was involved in 73 per cent of the crashes. Risk factors related to driving speed (e.g., speeding) were present in 37 per cent of the crashes.
Criminology has failed to engage thoroughly with road policing/offending, despite the fact that road policing constitutes the most common police-initiated contact with citizens (Corbett, 2008; Wells, 2017: 7–8). Speeding is relatively commonplace (Glendon, 2007) and is associated with a general social acceptability, particularly when it is perceived to not be excessive (Fleiter et al., 2010; Hatfield and Job, 2006). Many people do not see speeding as a ‘real’ crime (Corbett et al., 1998; see also Henni et al., 2017; Hutson, 2020). People drive deliberately at excessive speed out of habit (De Pelsmacker and Janssens, 2007). In the survey of the ESRA (E-Survey of Road users’ Attitudes) (Holocher and Holte, 2019), less than one-thirds of respondents indicate that they do accept driving faster than the speed limit. However, as declared by the European Commission (2018), nearly half of drivers drive faster than the speed limit and 10–20% exceed the speed limit by more than 10 km/h.
In the ESRA survey (Holocher and Holte, 2019) up to two-thirds of respondents in the European countries reported speed violations. Finnish respondents reported the highest speed violation rates. In the survey, when respondents were asked whether they personally accept driving faster than the speed limit outside built-up areas (but not on motorways/freeways), in the European region, the proportion of those who find it acceptable was one of the highest in Finland. The percentage rates were also high in Finland when respondents were asked to report how often they drove faster than the speed limit in different areas in the last 30 days. Over half (57%) of drivers who responded to the survey by the Finnish Road Safety Council (Liikenneturva, 2020) told that slight excess of speed limits has become a habit. Three quarters of the respondents felt that people who drive below the speed limit are annoying. On the other hand, every other respondent felt that other traffic often forces them to drive faster than they would like to drive. Driving with the rhythm of traffic was considered important. Nearly 60% of the respondents agreed that it is safer to keep up with other traffic than to comply with speed limits (Liikenneturva, 2020).
The aim of automatic traffic enforcement is to promote compliance with speed limits and, through decreasing both average driving speeds and variability of speeds, to reduce the number of traffic crashes and mitigate their consequences, and thus improve traffic safety (Reimi, 2018: 11). Research indicates that traffic safety cameras have positive impact on traffic safety, i.e. to the extent that they reduce the number of serious crashes (see De Pauw et al., 2014a). Automatic speed cameras (or traffic safety cameras) are generally classified as fixed speed cameras (pole mounted) and mobile speed cameras (police vehicles). Fixed speed cameras measure speed in one fixed position. If the speed is too high, the vehicle, licence number and driver are photographed and the police imposes a sanction.
From a research perspective, an important by-product of automatic traffic enforcement is the data generated by the traffic safety cameras. So far, such data has been underutilized in criminological research on traffic crimes. Unlike data based on human observations that depend on factors such as police patrolling frequency and citizens’ reporting propensity, data generated by the traffic safety cameras are less sensitive to such influences, and can thus provide an important additional source for studying the determinants of speeding.
The purpose of this study is to analyse the effects of different temporal characteristics, weather conditions and traffic volume on speeding sanction rates in automatic traffic enforcement in Finland during 2017–2018. In addition, we examine whether the speeding sanction rates are affected by the duration of active speed enforcement in a given location. We also present descriptive information on the characteristics of drivers sentenced for speeding in automatic traffic enforcement.
We start by reviewing existing research on automatic traffic enforcement and factors influencing speeding sanction rates, focusing particularly on the effects of weather conditions, and also present some contextual information and statistics about speeding and its enforcement in Finland. We then describe the data and the generalized additive models (GAM) that we use to examine the conditional non-linear associations between our focal variables (temperature, rainfall and the duration of active speed enforcement) and speeding sanction rates. We end the article by discussing the key implications of our results, and also discuss other potential ways of utilizing automatic traffic enforcement data in criminological research.
Literature review
Automatic traffic enforcement and traffic safety
The police are an important stakeholder for enhancing speed compliance and reducing average speeds. Visible police presence in traffic is important, as a measure for reducing average speeds, as well as for the enforcing of minor offences (Vadeby et al., 2018; see also Bogdan et al., 2014; Stanojević et al., 2018). Speed enforcement is one of the most important ways for police to maintain and improve traffic safety. Traffic enforcement creates an objective risk of getting caught. Control experiences (detection of surveillance and traffic violations) and information on the enforcement in turn create subjective risk of punishment (Mäkinen, 1990). With sanctions, even lenient ones, it is possible to decrease speeds and increase subjective risk of punishment (Rajalin, 1998: 14).
Results from numerous studies indicate that it is possible to influence speeding behaviour, high speeds in particular, with automatic traffic enforcement (Elvik et al., 2009; Jones et al., 2008; Peltola and Rajamäki, 2009). Numerous reports have testified to speed camera effectiveness (see, for example, Corbett, 1995; Gains et al., 2005; Hirst et al., 2005; Wilson et al., 2010). Driving speeds seems to reduce the most in places where the baseline level of speed has been high (e.g., SRA, 2009). Research shows that average driving speeds have reduced 2–3 km/h in Finland and 4–8 km/h in other countries, on average, as a result of fixed automatic enforcement of speed. This comparison suggests that the effects are little weaker in Finland than in other countries, but these differences can be explained by, e.g. different baseline speed levels, general traffic safety situation, research designs, data, methods and different traffic cultures across countries (Reimi, 2018). There is also some variation in the effects in the different directions of traffic flow (Ragnøy, 2002).
The mechanism through which fixed speed enforcement is thought to influence traffic safety is based on the idea that the driver chooses to maintain a reduced speed after having passed the camera. However, several studies have shown that there are changes in driver behaviour near the speed cameras. De Pauw et al. (2014b) analysed average speed, the odds of drivers exceeding the speed limit and the odds of drivers exceeding the speed limit by more than 10%. Speeds decreased on average by 6.4 km/h at the camera locations. Both the odds of drivers exceeding the speed limit (−80%) and the odds of drivers exceeding the speed limit by more than 10% (−86%) decreased considerably. However, before and beyond the cameras the speeds hardly, if at all, reduced. The analyses of the speed profiles before and beyond the cameras showed that drivers do slow down quite abruptly before the camera and speed up again after passing the camera. They concluded that a V-profile was found in the spatial speed distribution for both locations. In contrast, some studies indicate that a reduced speed can be maintained for up to 2–3 km after passing a camera (Ragnøy, 2011). A study by Liu et al. (2011), the influence area was found be less than 1 km. Nordic studies suggest that driving speeds also reduce the most at the camera pole and effects of automatic traffic enforcement weaken gradually as the distance from the camera pole increases so that speed effects are the largest after 1 km from the pole (e.g., Høye, 2015; Peltola and Rajamäki, 2009; Peltola et al., 2017; SRA, 2009). Because the effects of enforcement weaken as the distance from the camera post increases, it is important, according to Norwegian research results, to place cameras at 2–3 km intervals on the automatically controlled road section (Ragnøy, 2011).
The traffic safety effect of automatic traffic enforcement system on certain road section is expected to be influenced by how much speed is reduced both at and between cameras. The number of cameras may be assumed to be of critical importance for the way speed is affected over the entire section. It is also likely that effect of the automatic traffic safety camera system is influenced by, e.g. traffic volume and the speed limit. For various reasons, the effects may vary over time. Road users may also change their speed behaviour the more experience they have of the cameras (SRA, 2009: 13–14).
Effects of automatic traffic enforcement on traffic safety may be the most positive on busy roads (Peltola and Rajamäki, 2009). On the other hand, at weekends and during night hours effectiveness is also larger compared to weekdays and busy hours (SRA, 2009) because traffic volume influences the possibilities to adjust a single driver’s own driving speed. Driving speeds of free vehicles are higher than those who tail back. Automatic traffic enforcement reduces higher speeds and improves traffic safety during hours with low traffic volume (Reimi, 2018).
If human behaviour is wanted to be influenced, it has to be understood why they are behaving the way they do (Säteri, 2020). Being in a hurry, closely connected with the behavioural belief that exceeding the speed limits makes one arrive quicker, largely contribute to drivers exceeding the speed limits, on a general level (Wallén Warner, 2006; see also Bogdan et al., 2014). In a Finnish study, most of the drivers reported that they drive at high speed because of a hurry (Mäkinen, 1990). Mostly only deterrent effect of punishment prevents drivers from driving even faster if they already have excessive speed more than 10 km/h. However, driving at slower speed is perceived as boring. There is also an assumption that they would slow down the flow of other traffic. Under 10 km/h speeding drivers are scared of increasing risk of crash and that is why they do not drive at even higher speed (Rajalin, 1998). As Figure 1 shows, at least the risk of high enough fines (petty fine of €200 or day-fine) appears to deter drivers to drive at seriously high speed.
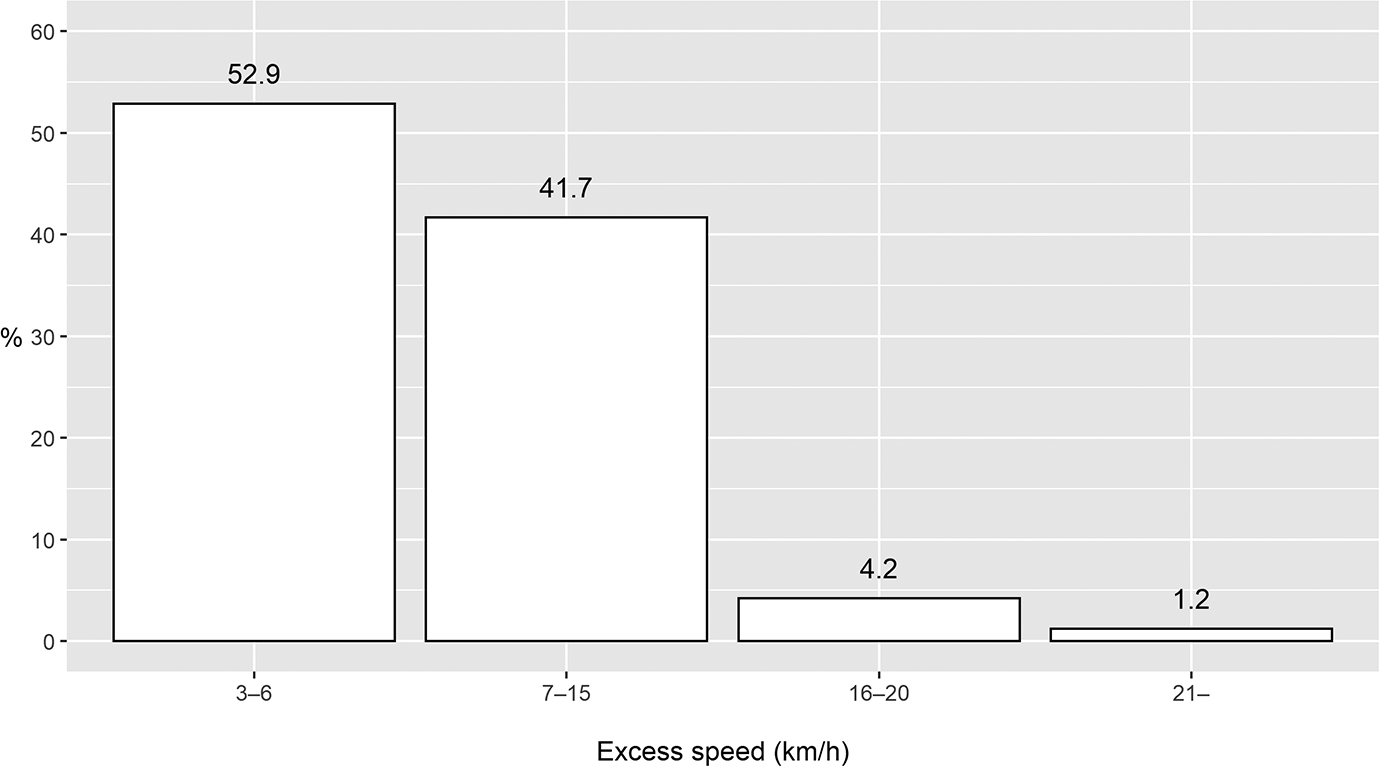
Percentage of excessive speed on Ring Road I and III in 2017–2018. Numbers are based on cases in which either caution or fine has been imposed. The excessive speed is based on speed after police’s technical (certainty) deduction. (Statistical figures and analyses of this article have been created and conducted with R and its various packages, see Baptiste, 2017; Breheny and Burchett, 2017; R Core Team, 2019; Wickham, 2016).
Weather conditions, traffic and aggression
Crank and Jacoby (2015) believe that the environment, including daily weather and temperature, play an underrecognised role in the production of crime. Weather carries part of the blame for crime. Weather creates lifestyle opportunities for criminal behaviour (Crank and Jacoby, 2015: 14–15). Junger et al. (2001) found that persons who displayed risky behaviour in traffic, leading to the crash, had rather high odds ratios having a police record for different crimes. The results were consistent with the idea of a common factor underlying criminal behaviour and risk behaviour in traffic.
A common assumption in criminological literature is that weather conditions can precipitate negative or positive emotional responses (Badiora et al., 2017). Negative effects (irritation, annoyance, or discomfort) increase as temperature increases up to a certain inflection point but after exceeding this inflection point, these effects decrease as temperature increases because a person’s escape motives (avoiding the heat) will override their aggressive motives (see e.g. Bell, 1992). According to a German study, emotions rise with the temperature, people are more irritable to others, they get tired more easily, lose their concentration, and their reaction time increases (DVR, 2000).
Schinasi and Hamra (2017) states that crime is an overlooked phenomenon when considering the public health impacts of rising ambient temperatures. According to international research, weather and crime have been found to have a significant correlation. ‘Pleasant’ weather will naturally tend to increase time people spend outside their homes (Field, 1992). Empirical findings suggest that meteorological and climatological variations are linked to crime, but, however, the effects are different in different locations and microclimates (Tompson and Bowers, 2015). Frustration and a wide variety of unpleasant feelings can give rise to anger and aggression. High temperatures can create considerable irritation, and even anger. They can heighten the hostility displayed, or the aggression (Berkowitz, 1990). A common belief is that hot temperatures increase aggressive behaviour, and this belief has even crept into the English language, as indicated by common phrases such as ‘hot-headed’, and ‘my blood is boiling’ (for example see DeWall and Bushman, 2009). Fox (2010) has stated that violent crime levels are highest when the temperature reaches about 85°F (29°C). The results of the study by Jacob et al. (2007) gave evidence that short-term weather changes impact weekly or daily rates of criminal activity. However, according to Baryshnikova et al. (2019), daily observations overestimates the effect of temperature on crime. After all, it is reasonable to conclude that temperature has a strong positive effect on criminal behaviour, with little evidence of lagged impacts (e.g., Ranson, 2014; Tiihonen et al., 2017).
Weather conditions partly determine the road conditions and also influence the driver’s behaviour. High temperatures can have both psychological and physiological effects on drivers. Speeding can be seen as a good example of criminal activity on which short-term weather changes and hot temperatures, in particular, can affect. In speeding law enforcement, however, there might not be some daily weather effects even if there might be some hourly and monthly effects (see Liu and Sharma, 2019), According to Persinger (1980), weather changes the day or days before could be more highly correlated with the human response than present weather. According to Ashby and Tompson (2018), after controlling for other situational factors (such as public holidays and special events) and for the frequency of street crime, increasing temperatures are associated with small increases in police stops, while rain and snow are associated with substantial decreases. The study by Ryan (2020) is the first one examining the relationship between temperature and the enforcement of the law. Ryan suggests that police officers are more likely to issue traffic citations when temperatures are warmer while holding constant driving behaviour (Ryan, 2020).
According to Cui et al. (2013), warm uncomfortable environments have a negative effect on both performance and motivation. Uncomfortable warm temperature may have a negative effect on drivers’ performance in traffic. Many stressors have the potential to impact safe vehicle driving behaviour (Matthews et al., 1996), and temperature can be one of them. Vehicle cabins can become extreme hot or cold microenvironments depending on the climate and season (Grundstein et al., 2009). Of course, nowadays there is air conditioning in all new cars and that helps with cabin temperature. Chowdhury (2015) found significant temperature effect on speed variability for high temperature (22–27°C/71–80°F) over lower temperatures, i.e. speed variability was larger in high temperatures than in lower ones.
Hogema (1996) states that on days with heavy rain, one could expect that, e.g. driver may change their driving behaviour because of the reduced visibility caused by rain. Drivers do adjust their behaviour to rain and reduce their speed (Hogema, 1996; see also Rämä, 2001). Agarwal et al. (2005) found that heavy rains (more than 7 mm/h/0.25 inch/hour) showed speed reductions of 4–7%. The effect of rainy night is larger than rainy day while the effect of snowy day and night is similar in terms of speed reduction (Oh et al., 2002). It appears that when drivers slowdown response to marginal weather, such as fog or variable message advisory signs once they pass the signs and the weather changes, they tend to compensate for the lost time by increasing their speed to levels above those that they maintained before they felt forced to slow down (Boyle and Mannering, 2004).
Cold environments negatively impact physical and cognitive performance that is critical to safe vehicle operation through physiological and psychological stress (Hancock et al., 2007). Morris and Pilcher (2016) found that participants of their study who had higher subjective ratings of cold followed lead vehicles closer and started to brake later. Participants in the cold condition followed the lead car 22% (0.82 s) closer and started braking 20% (2.35 s) later when approaching a stop sign during the car-following task. No change in attention, psychomotor vigilance, or dexterity was observed. The current results suggest that cold environmental conditions can contribute to dangerous driving behaviours (Morris and Pilcher, 2016).
Kilpeläinen and Summala (2007) addressed the effects of adverse weather and traffic weather forecasts on driver behaviour in Finland. Drivers had reported various kinds of compensatory behaviour during adverse conditions, including a 6–7 km/h target speed decrement. This corresponded to traffic flow speed measurements. The results suggest that the on-road driving behaviour is predominantly affected by the prevailing observable conditions, rather than traffic weather forecasts.
The effect of weather conditions on traffic safety has been examined in many studies. However, there is little research focusing on the effects of environmental temperature on driving ability although thermal stressors are commonly faced by drivers. Most studies into the relation between weather and traffic safety are about the situation during rainfall. However, many other weather conditions are serious influences: fog, snow and black ice, low sun, hard wind, and high temperatures (SWOV, 2012). The traffic safety impact of weather conditions has been actively studied in the Nordic countries (see Malin et al., 2019). Malin et al. (2019) investigated the relative crash risk of different road weather conditions and combinations of conditions. The relative crash risks were increased for poor road weather conditions. However, they were highest for icy rain and slippery and very slippery road conditions (Malin et al., 2019). Peltola (2015) found that there was rainfall in up to 20% of the traffic crashes. Winter weather, slippery and snow, sleet or hail occur most typically in November–March. Winter weather conditions reduce driving speeds by about 4 km/h (Peltola, 2015). Perrels et al. (2015) assessed how the variation in daily winter crash rates associates with weather conditions in Finland. They found that on some days, bad weather can raise the number of crashes significantly, by 20% or more over the base rate. Weekend traffic seems to be less sensitive to bad weather than working day traffic, in particular Fridays (Perrels et al., 2015).
Results of the study by Lajunen and Parker (2001) indicate that aggressive driver behaviour is a complex phenomenon affected by a range of psychological causes. They found, e.g. that age was negatively related to both driver anger and aggression among men whereas annual mileage was negatively related to aggression among women. Aggression may manifest itself in several dangerous behaviours, such as hard braking and speeding (Habtemichael and Picado Santos, 2014; Harris et al., 2014).
Prior research shows that younger drivers are more likely to speed (e.g. NHTSA, 2019; Stradling et al., 2008). Many young drivers believe that speeding is socially acceptable and that avoiding detection by law enforcement is a breeze (Hoekstra and Wegman, 2011). In the analysis by NHTSA (2019), male gender was a characteristic of speeding behaviour in addition to young age. Tay (2005) concluded that many young male drivers do not consider speeding as an unsafe behaviour. Fernandes et al. (2010) examined systematically a range of relevant demographic, personality and attitudinal factors in the prediction of speeding in a student sample of young drivers. Results demonstrate that significant predictors differed between risky driving behaviours. Speeding was significantly predicted by male gender, sensation seeking, driver anger, road-unrelated perceived relative risk, general perceived susceptibility and specific perceived susceptibility (Fernandes et al., 2010). According to Rajalin (1998) cars of the drivers who drive with high speed are newer, sportier and more expensive than others’. They also drive more often with a company-owned car than other drivers. Among high speed drivers, there are more male and under 30 years old people than among other drivers. Moreover, they are drivers who drive a lot.
Risk taking has evolutionary roots and is thus emotionally driven (Nell, 2002). International statistics of traffic behaviour and crashes show that young men are the most risky drivers in virtually every country. This group of drivers with superior perceptual-motor skills seems to be the riskiest driver group, paradoxically. Masculinity acts as a predictor of e.g. aggressive violations and offences (Özkan and Lajunen, 2005).
Speeding limits, sanctions and automatic traffic enforcement in Finland
In Finland, a written caution maybe be issued by the police for driving 3–6 km/h over the speed limit in all speed limit areas. A caution will not cause any further sanctions, and no record of the offence will be made. The speed threshold for a petty fine is 7 km/h. A petty fine is imposed for 7 km/h or more over the speed limit in all speed limit areas. In practice, the police reduce the measured speed based on a possible measurement error of 3 km/h, which means that the speed recorded on the caution or fine is lower than the measured speed. For example, if one drives at a speed of 70 km/h in a 60 km/h area, he or she will be issued with a petty fine on which the speed will be recorded as 67 km/h. If one drives at 69 km/h in the area, after the reduction by the margin of error, the final excessive speed would be 6 km/h. If the excessive speed after the deduction is 7–15 km/h, the amount of a petty fine is €170 (if the speed limit >60 km/h, a petty fine is €140). If excessive speed 16–20 km/h, the amount will be €200. A day-fine is imposed if the excessive speed is more than 20 km/h after the deduction. The amount of one day-fine is calculated on the basis of the convicted person’s daily net income. The more blameworthy the act, the more day-fines are imposed. According to the Criminal Code of Finland, the minimum number of day-fines is 1 and the maximum number is 120 (Chapter 2a, Section 1), a joint fine (for several offences) may be at most 240 day-fines (Chapter 7, Section 3). The minimum amount of a day-fine is €6.
In 2019, Finland’s automatic traffic control system covered approximately 3,500 km and included thousand fixed camera poles (Police of Finland, 2019a). Police has, however, only about 130 cameras in use. Thus, not more than 14% of poles have a camera inside. Not all of the cameras are in use simultaneously. Importantly, drivers do not know in which poles the cameras are located or which cameras are on. Speed cameras are mainly placed in locations where the number of road crashes are relatively high, drivers tend to exceed the speed limits, and in places where an evident relation between the number of crashes and speed was found (Belin et al., 2010). While police does not currently make any decisions on camera pole locations, it has been argued that it would be important to consider views and wishes of the police when designing automatic traffic enforcement and selecting targets in the future (Malin, 2019).
In 2018, approximately 14% of all actual working hours per person-year in traffic control of the police were allocated to automatic speed control (Police of Finland, 2019b). Percentage of vehicles photographed by fixed traffic safety cameras as a proportion of the total number of vehicles that have passed the control points was 0.52%, while in 2016 the corresponding number was 0.75%. Respectively, percentage of vehicles photographed by mobile traffic safety cameras as a proportion of the total number of vehicles that have passed the control car was 6.4%, while in 2016 the corresponding number was 7.6% (Police of Finland, 2019a). Thus, fewer vehicles passing the fixed automatic traffic control point were photographed when compared to the control cars. The ratio gives an indication of the prevalence of speeding, and also shows that drivers respond to visible fixed camera poles, but less often detect the mobile control cars. On Ring Road I, the percentage of vehicles photographed by fixed traffic safety cameras as a proportion of the total number of vehicles that have passed the control points were 0.45% in 2017 and 0.31% in 2018, and on Ring Road III 0.60% in 2017 and 0.42% in 2018, respectively (Police of Finland, 2019a). On the Ring Road I, between period of years 2013–15 and 2016–18 speed variance has slightly decreased, i.e. speed differences have reduced, based on data of the Finnish Transport Infrastructure Agency. In addition, percentage of over 10 km/h excessive speeds has reduced from 4.1% to 0.8% (FTIA, 2019b).
Figure 1 shows the distribution of excessive speeds on Ring Roads I and III in 2017–2018. Over half of all excessive speeds on Ring Road I and III were 3–6 km/h. Really high excessive speeds, more than 20 km/h, are very rare. In practice, traditional speed enforcement by the police catch serious speedings and traffic safety cameras more minor speedings.
In Finland, automatic traffic enforcement has had huge effects on the caseload of the criminal sanction system. Amount of petty fines has increased since 2004 (Figure 2(a)). In the beginning of September 2015 the amount of the petty fines was doubled, and the consequences can be seen in huge growth of total monetary value of petty fines (Figure 2(b)) (Tilastokeskus, 2019). Average speed decreased after the fine raise by about 0.4 km/h and speeds exceeding the speed limit by more than 10 km/h reduced by 9% (Aaltonen and Virtanen, 2017a, 2017b). In October 2016 the threshold for petty fines was lowered from 8 km/h to 7 km/h. Threshold for a petty fine have been found to influence driving speed, which in turn is reflected in the level of traffic safety (Reimi, 2018). Under previous 2 years (2017–2018), on average, over 200,000 petty fines and approximately 9,400 day-fines have been imposed annually with the help of fixed speed cameras (Police of Finland, 2019b).
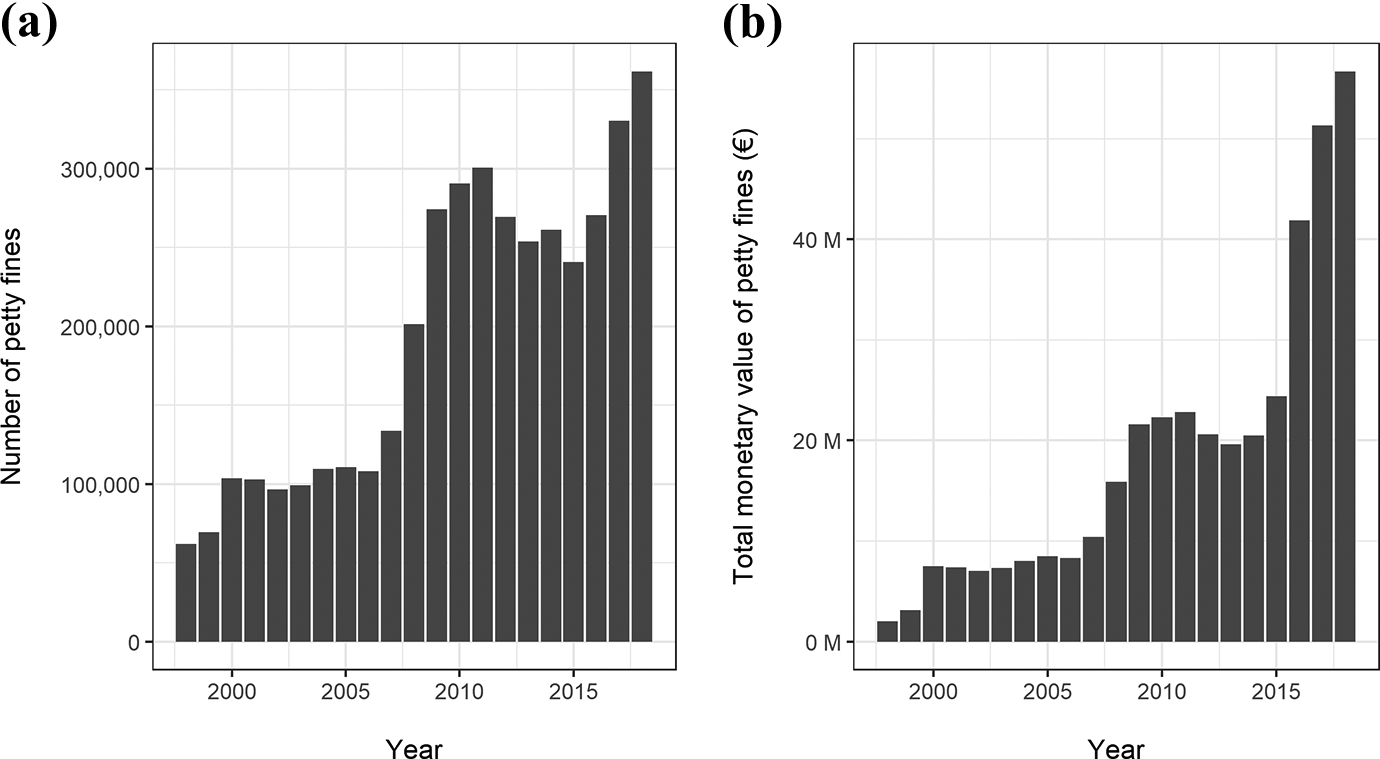
(a) Number of petty fines and (b) total monetary value of petty fines in 1998–2018.
According to Elvik (2016), increases in fixed penalties, i.e. traffic fines, are associated with small changes in the rate of traffic violations and, moreover, a small reduction of the number of crashes. For example, in European context, recent studies by Moolenaar (2014), Elvik (2015) and Killias et al. (2016) have analysed the question whether increases in traffic fines are associated with a reduction in the number of traffic crimes and crashes. Based on Elvik’s (2016) meta-regression it is possible to say that the relationship between increase in fixed penalties and reduction in the rate of traffic violations is non-linear and has a tipping point for very large increases in fixed penalties. When fixed penalties increase more than 100%, there is no further reduction of violations. By increasing objective risk of punishment, i.e. traffic control, it is possible to increase subjective risk of punishment, which is the only way to increase it when the goal is to change people’s behaviour permanently (Mäkinen, 1990).
Current study
The current study is based on two years of observational data on automatic traffic enforcement from two major roads in Finland. We use multivariate models to examine temporal changes in speeding sanction rates and how weather conditions affect these rates. Additionally, we examine how the length of active enforcement period affects the proportion of cars speeding. Based on prior research, we hypothesize that high temperatures increase speeding sanction rates. Heavy rainfall, on the other hand, is expected to decrease speeding sanction rates. Regarding the effect of enforcement period length, we expect speeding sanction rates to decrease as daily commuters learn the locations of active traffic safety cameras and reduce their speeds accordingly.
Data and methods
Research data
In this study, examination has been restricted to the Highway 101 (Ring Road I) and the National Road 50 (Ring Road III) that are two major highways in Finland (see Figure 3). Those roads encircle the capital city Helsinki and are among the most highly trafficked roads in the country. The Ring Road I goes from Tapiola to Itäkeskus (the lighter grey in Figure 3) and the Ring Road III from Masala to Itäsalmi (the darker grey ring in Figure 3). Traffic volume can reach up to 100,000 vehicles per weekday. Most of the drivers on the Ring Road I are daily commuters, but on the Ring Road III there are more sporadic drivers from the other parts of the country. In total 36 fixed traffic safety cameras have been installed to those roads. The cameras were introduced on the Ring Road III in February 2011, five years before the Ring Road I in February 2016.
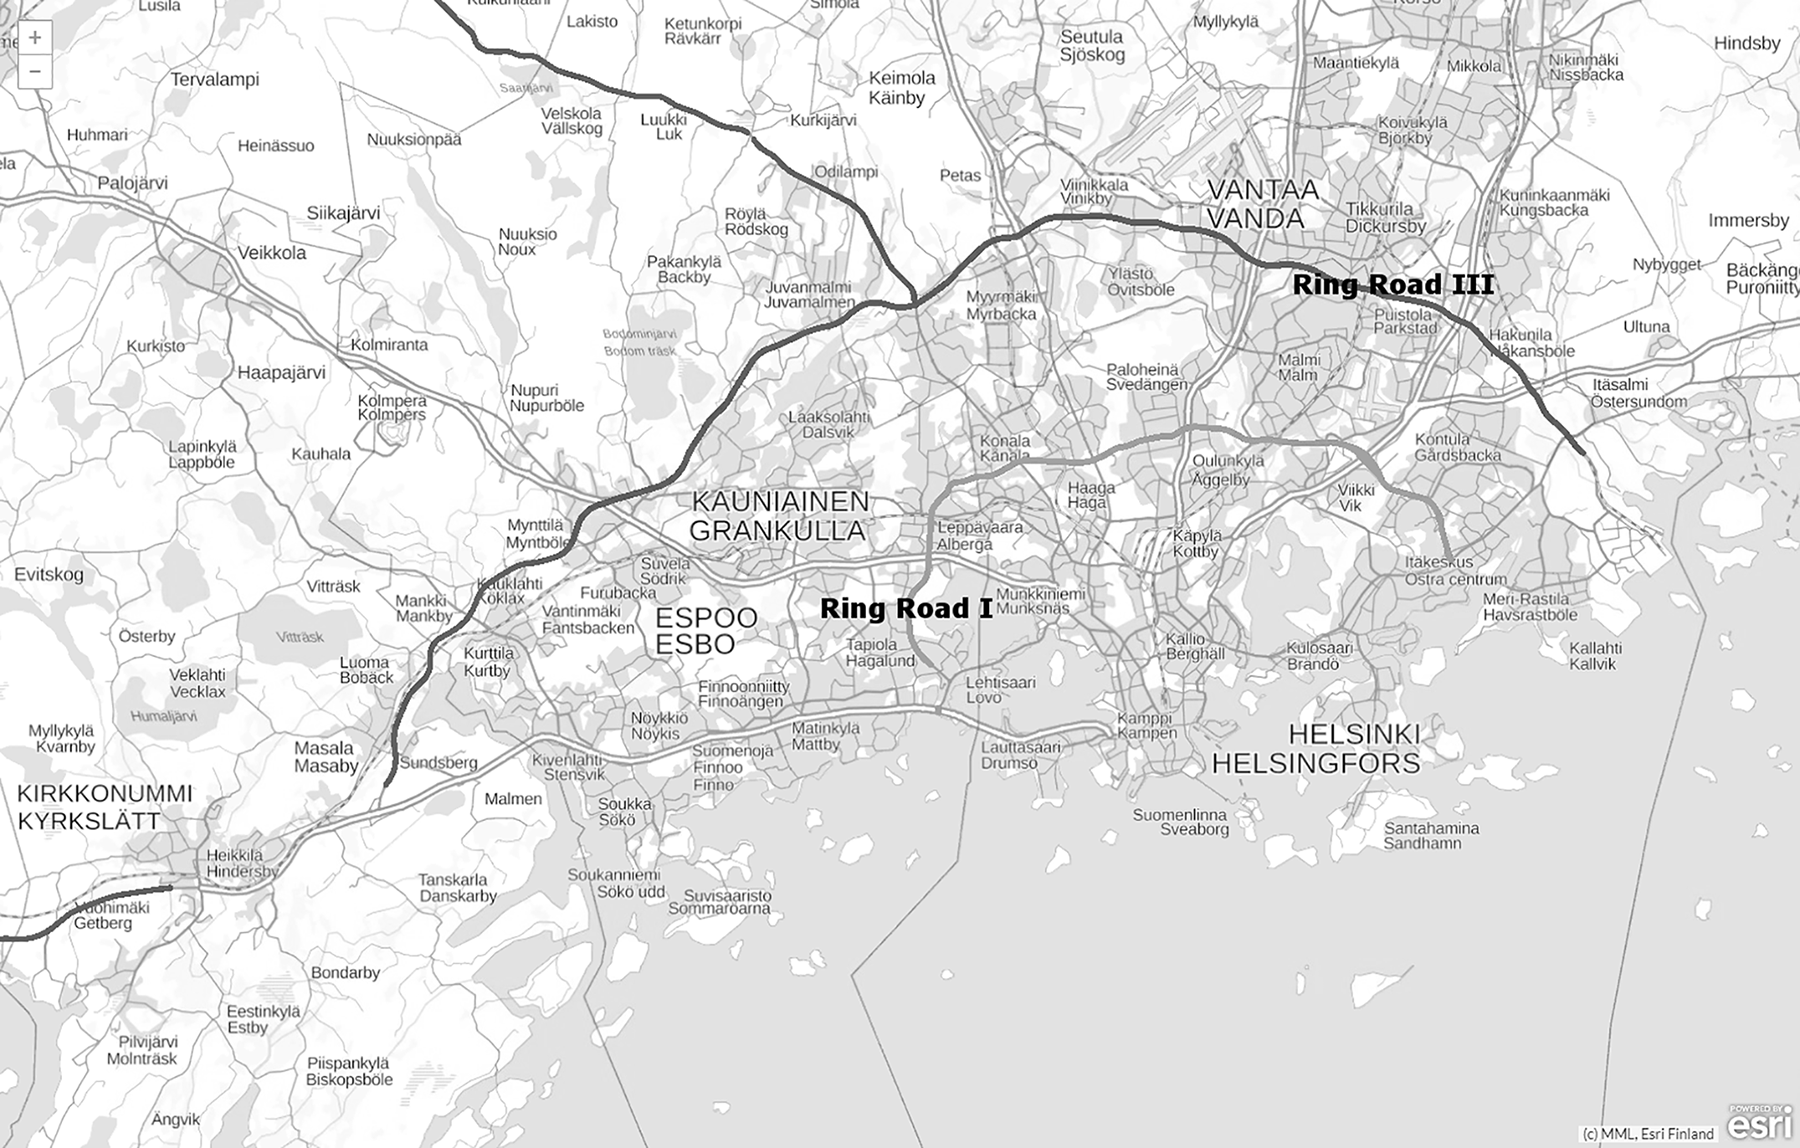
Map of the automatic traffic enforcement zones (incl. the Ring Roads) and the capital area of Finland (Väylävirasto, 2020).
The research data consists of data collected from Finnish police’s device and control point register (Pauli) (Police of Finland, 2019a), and the operation information system (PolStat) (Police of Finland, 2019b), the information services system (Tiira) of the Finnish Transport Infrastructure Agency (FTIA, 2019b) and the open access weather observation download service of the Finnish Meteorological Institute (2019). The weather information is based on observations from Vantaa Helsinki-Vantaa airport observation station, which is located rather near the examined roads.
Number of observations in the data is 3,727 (= N). Data from each measurement point is aggregated to daily level, and consists of nine variables, which are: rate of speeding sanctions (caution, petty fine, and fine) per 1,000 vehicles, year (2017 and 2018), month (Jan–Dec), weekday (Mon–Sun), traffic direction (east and west), number of active traffic safety cameras on the same road, number of days camera has been switched on, deleted cases (%), temperature (degree Celsius) and rainfall (mm).
Traffic volumes and traffic direction were obtained from the FTIA’s LAM point data, in total 17 LAM points (7 on the Ring Road I, 10 on the Ring Road III). The LAM point consists of two induction loops and data acquisition units in each lane. The function of the LAM point is based on the electromagnetic induction of a loop embedded inside the coating, whereby the metallic mass of the vehicle causes a change in the magnetic field of the loop. The LAM registers vehicles that cross the point, providing time of the pass, driving direction, lane, speed, vehicle length, time difference between subsequent vehicles and the vehicle category of each vehicle. There are about 500 active LAM points in Finland at the moment (FTIA, 2019a).
Traffic volume indicator describes the traffic volume at the nearest LAM point to the camera pole while driving towards same direction. Number of active traffic safety cameras on the same road describes how many cameras were in use on either on the Ring Road I or III simultaneously with the certain (observed) camera on the same road.
Deleted cases measures the proportion of photos deleted from systems of the police before photos are handled for passing sanctions. The proportion depends on many factors. Photos of motorbikes and emergency vehicles, for example, are deleted. Moreover, if there is heavy rain or snowing outside, many photos are removed due to bad picture quality. Many written cautions are also deleted, e.g. if there are lots of more severe cases waiting for a fine sanction. The maximum daily percent of deleted cases is almost 90 (Table 1), whereas the average proportion is around one-fourth.
Descriptive statistics on the variables.
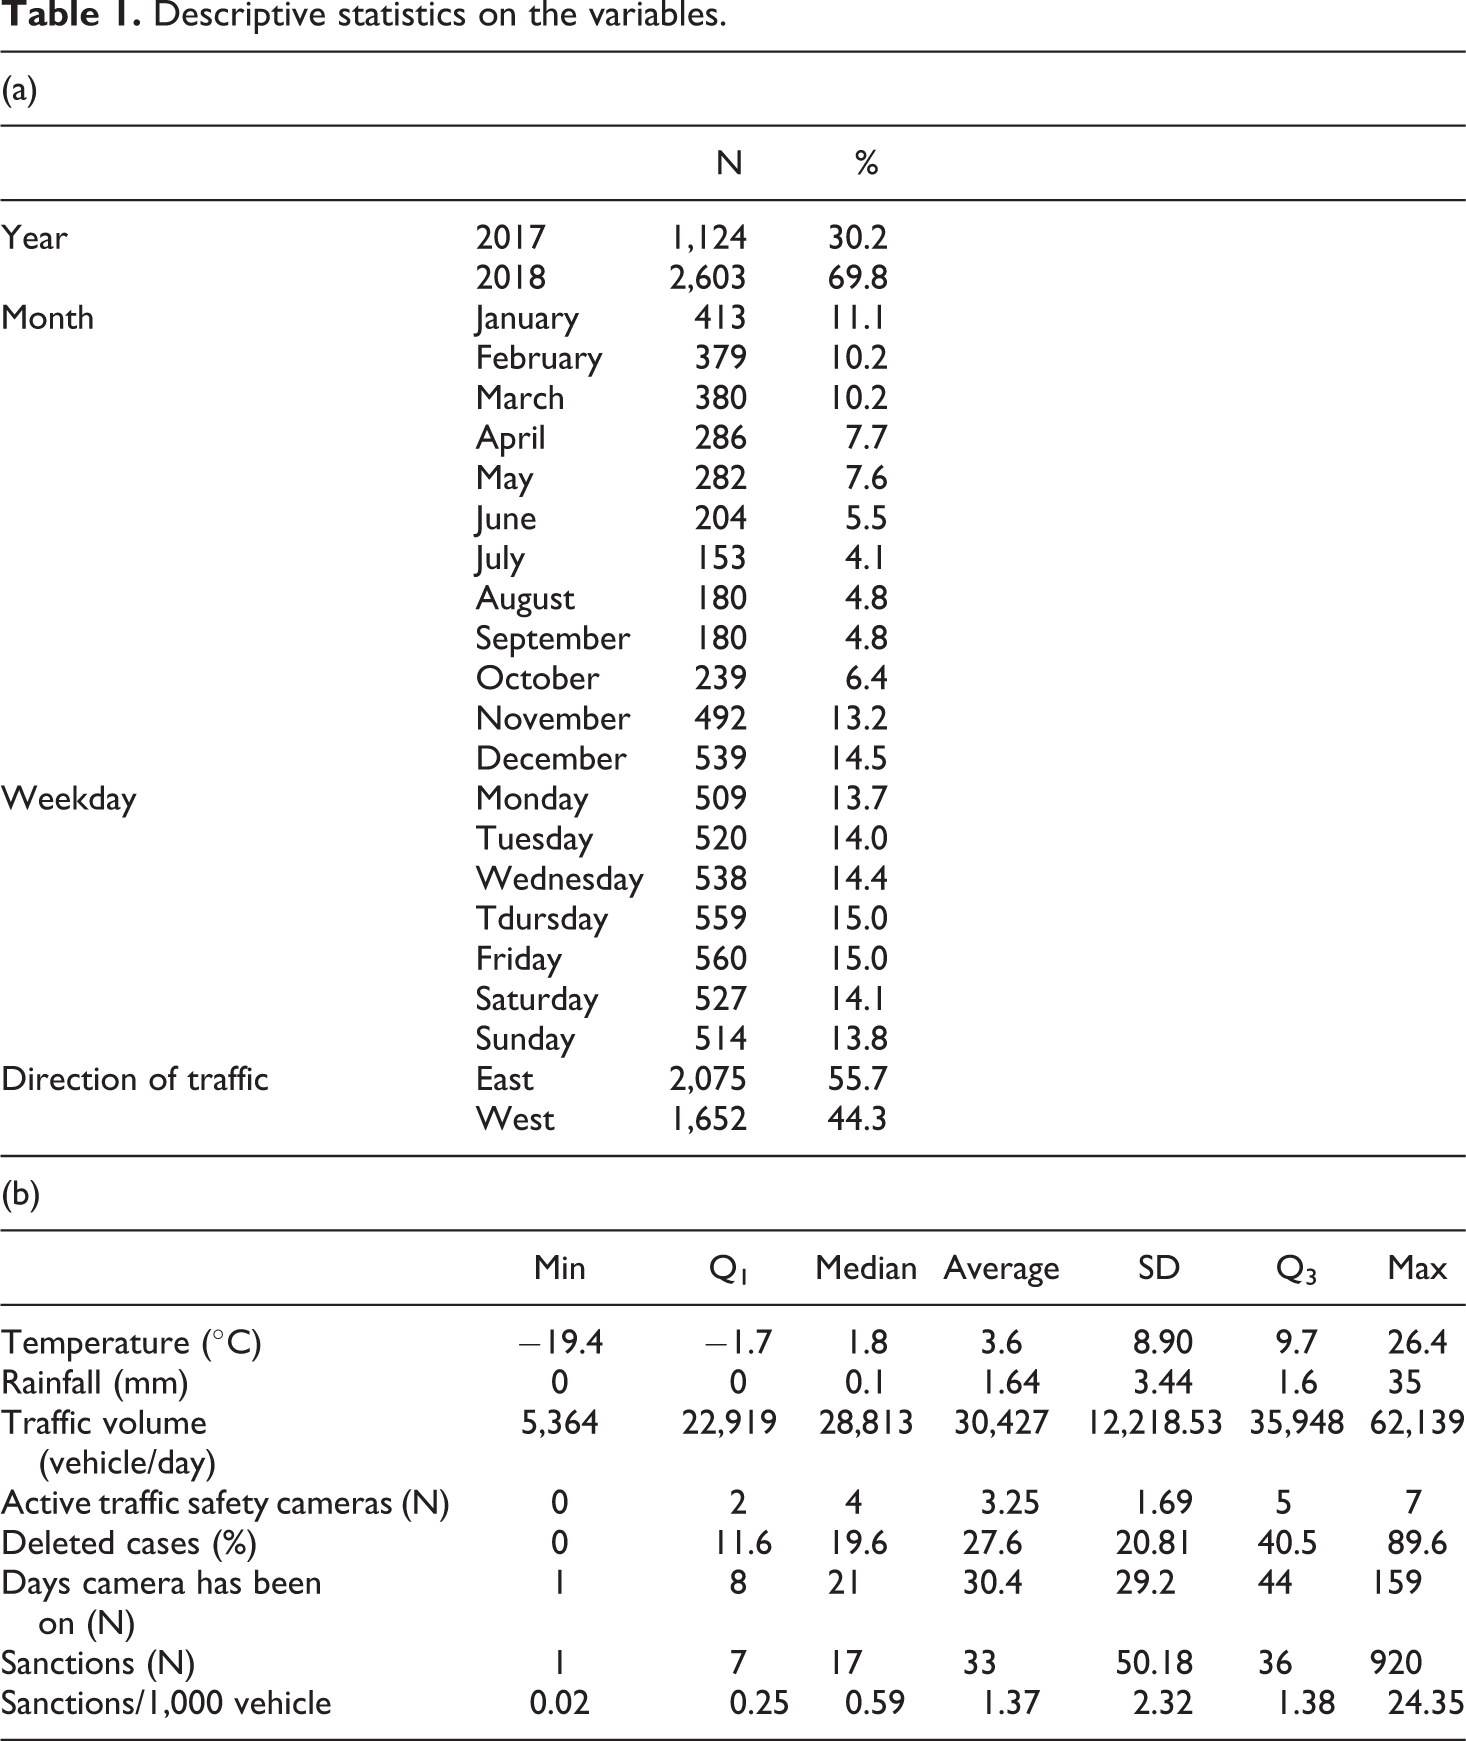
The median number of days a camera has been consecutively switched on in one location is 3 weeks. Median daily number of speeding sanctions based on photos taken by one enforcement camera is 17. Distribution of the speeding sanctions, and also in proportion to the traffic volume, is heavily skewed to the right. For this reason a logarithmic transformation of the variable on the rate of speeding sanctions per 1,000 vehicles is used in the modelling to mitigate the skewness.
Generalized additive model
Because many of our key variables of interest are continuous, we wish to maintain some flexibility in modelling their association with the outcome without imposing too rigid functional form. General additive models (GAM, Wood, 2017) offer a middle ground between simple models, e.g. linear regression, and more complex machine learning models (Ross, 2019). GAMs can be fit to complex, nonlinear relationships and avoid overfitting in these cases. With a GAM we can fit data with smooths which are functions that can take on a wide variety of shapes. We fit the GAM-model using the gam() function from the mgcv package (Wood, 2017) in R.
We use thin plate regression splines (Wood, 2017) to model the nonlinear associations between the focal continuous variables and the outcome. For each smooth term effective degrees of freedom (edf) are calculated. With those edf’s it is possible to make inference on the linearity of a term. If the edf would equal 1, the association between the two variables would be linear, and a smooth function would not needed.
In addition to the smoothed coefficient estimates for continuous variables that we present as figures, GAMs can also incorporate conventional linear terms and categorical variables like standard regression models. In our models, the variables modelled with smooth functions are temperature, rainfall and number of days the camera has been switched on, whereas the other variables in the model are included in the conventional way. In addition to the coefficients and standard errors of these variables, we also present these results on the original scale of the log-transformed outcome variable, which denote percentage changes in speeding sanctions rates by one-unit increase in the covariate.
Results
Some descriptive statistics on sanctioned speeding cases on Ring Roads are presented in Figure 4. Nearly 70% of sanctioned drivers were male. Age distribution was quite normal while the peak was from age of 35 to 54. The most typically time for speeding was between 11 am and 3 pm. Drivers being caught between 10 am and 4 pm are the oldest (average age 46–48 years). At night time (1–7 am) among speeding drivers the proportion of male drivers are slightly higher (75.4%) than otherwise (70%).
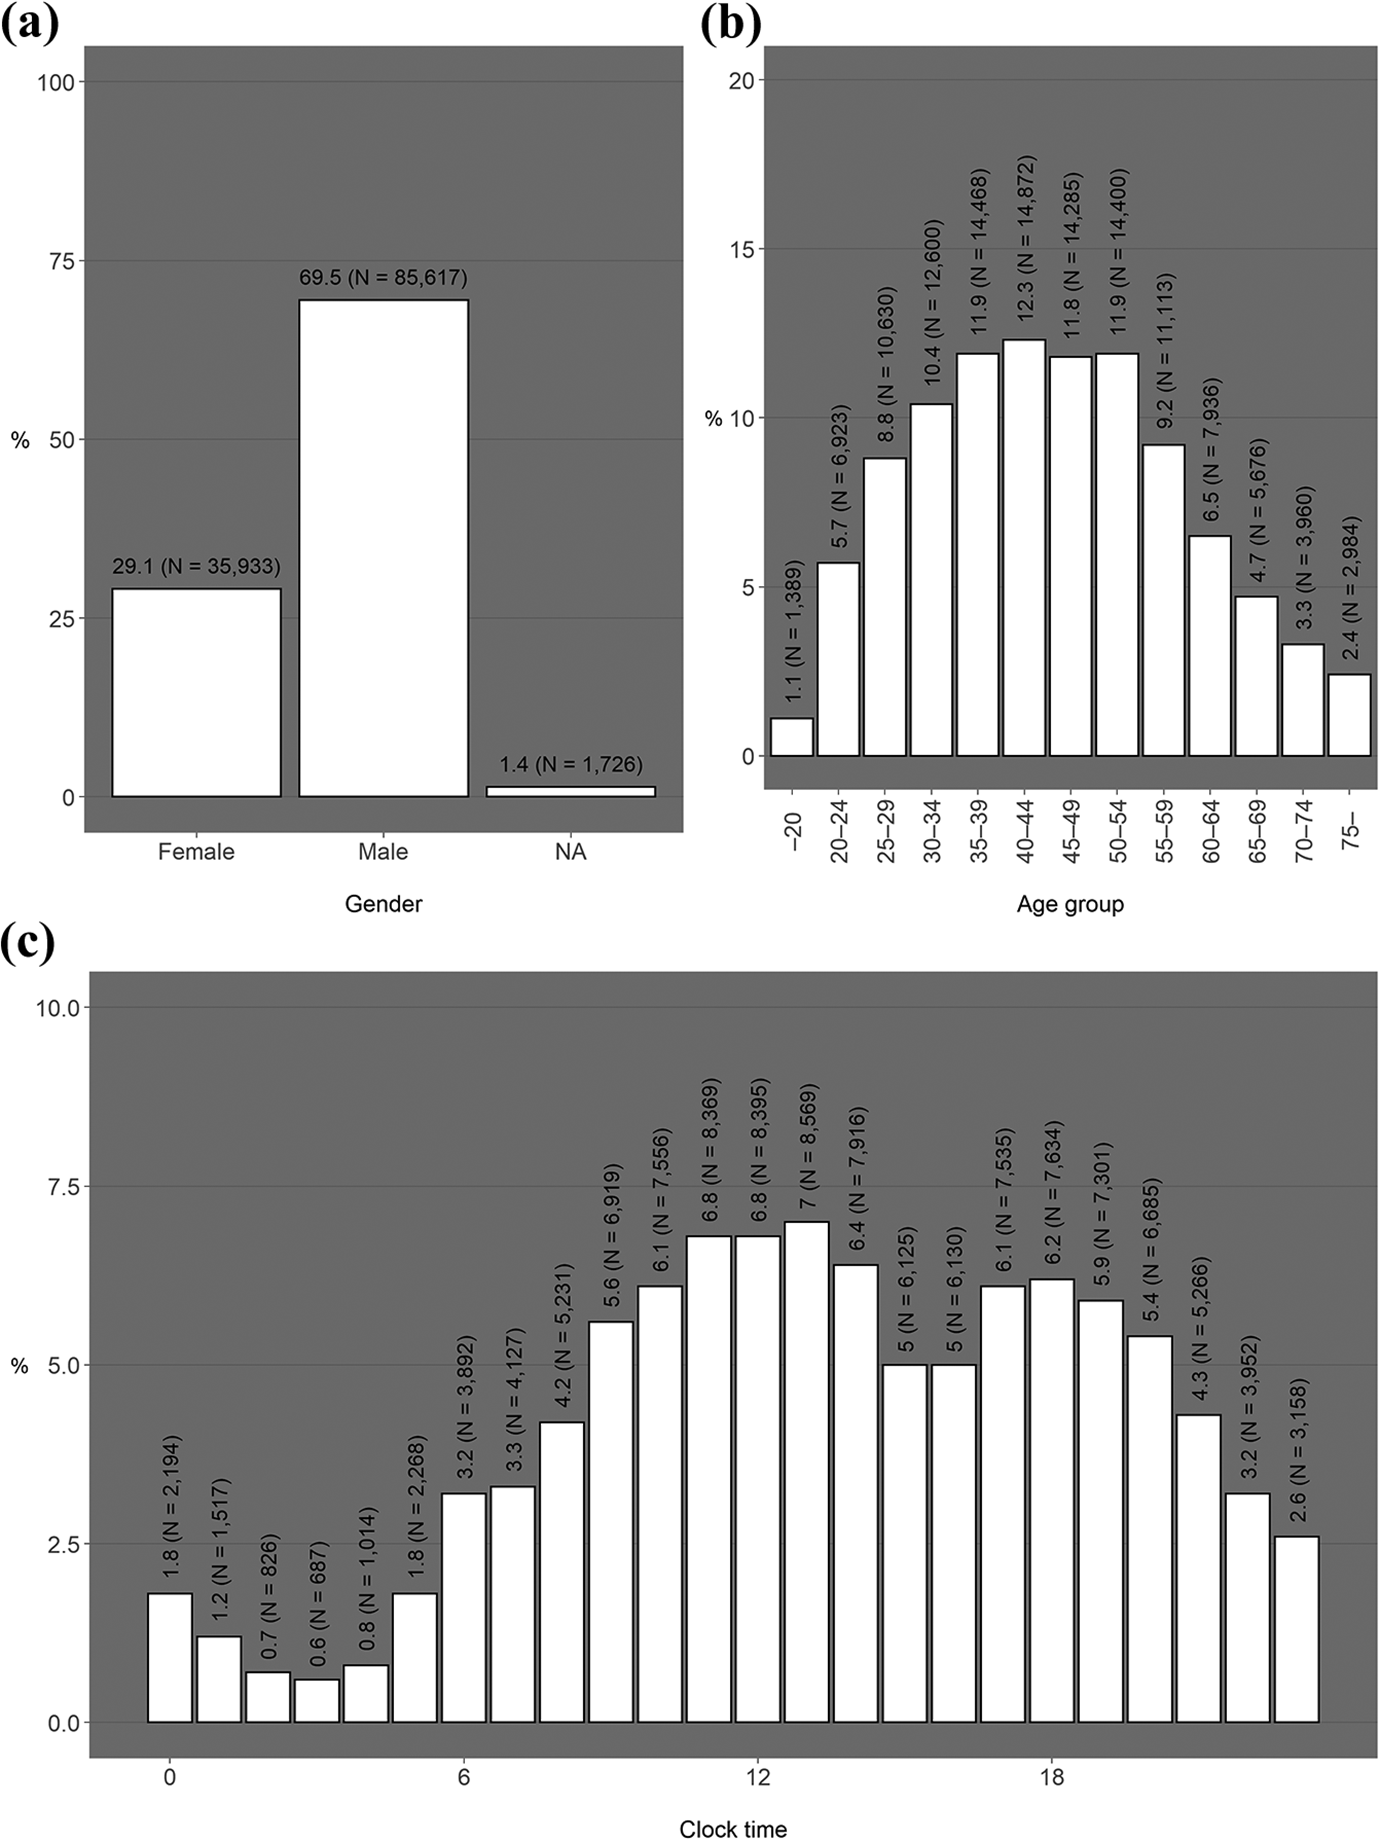
Proportional distributions of (a) gender and (b) age of drivers and (c) clock time of speeding on Ring Roads I and III in 2017–2018.
The results of the GAM models on factors affecting speeding sanction rates are presented in Table 2 and the plots of the smooth terms in Figure 5. The results indicate a declining trend in proportion of cars speeding between years 2017–18. Monthly variation in sanctions is relatively limited, decreasing slightly during latter part of the year. April seems to be an exception. Conditional on traffic volume, sanctioned speeding is less common during the beginning of the week than at any other day.
Results of the GAM model.
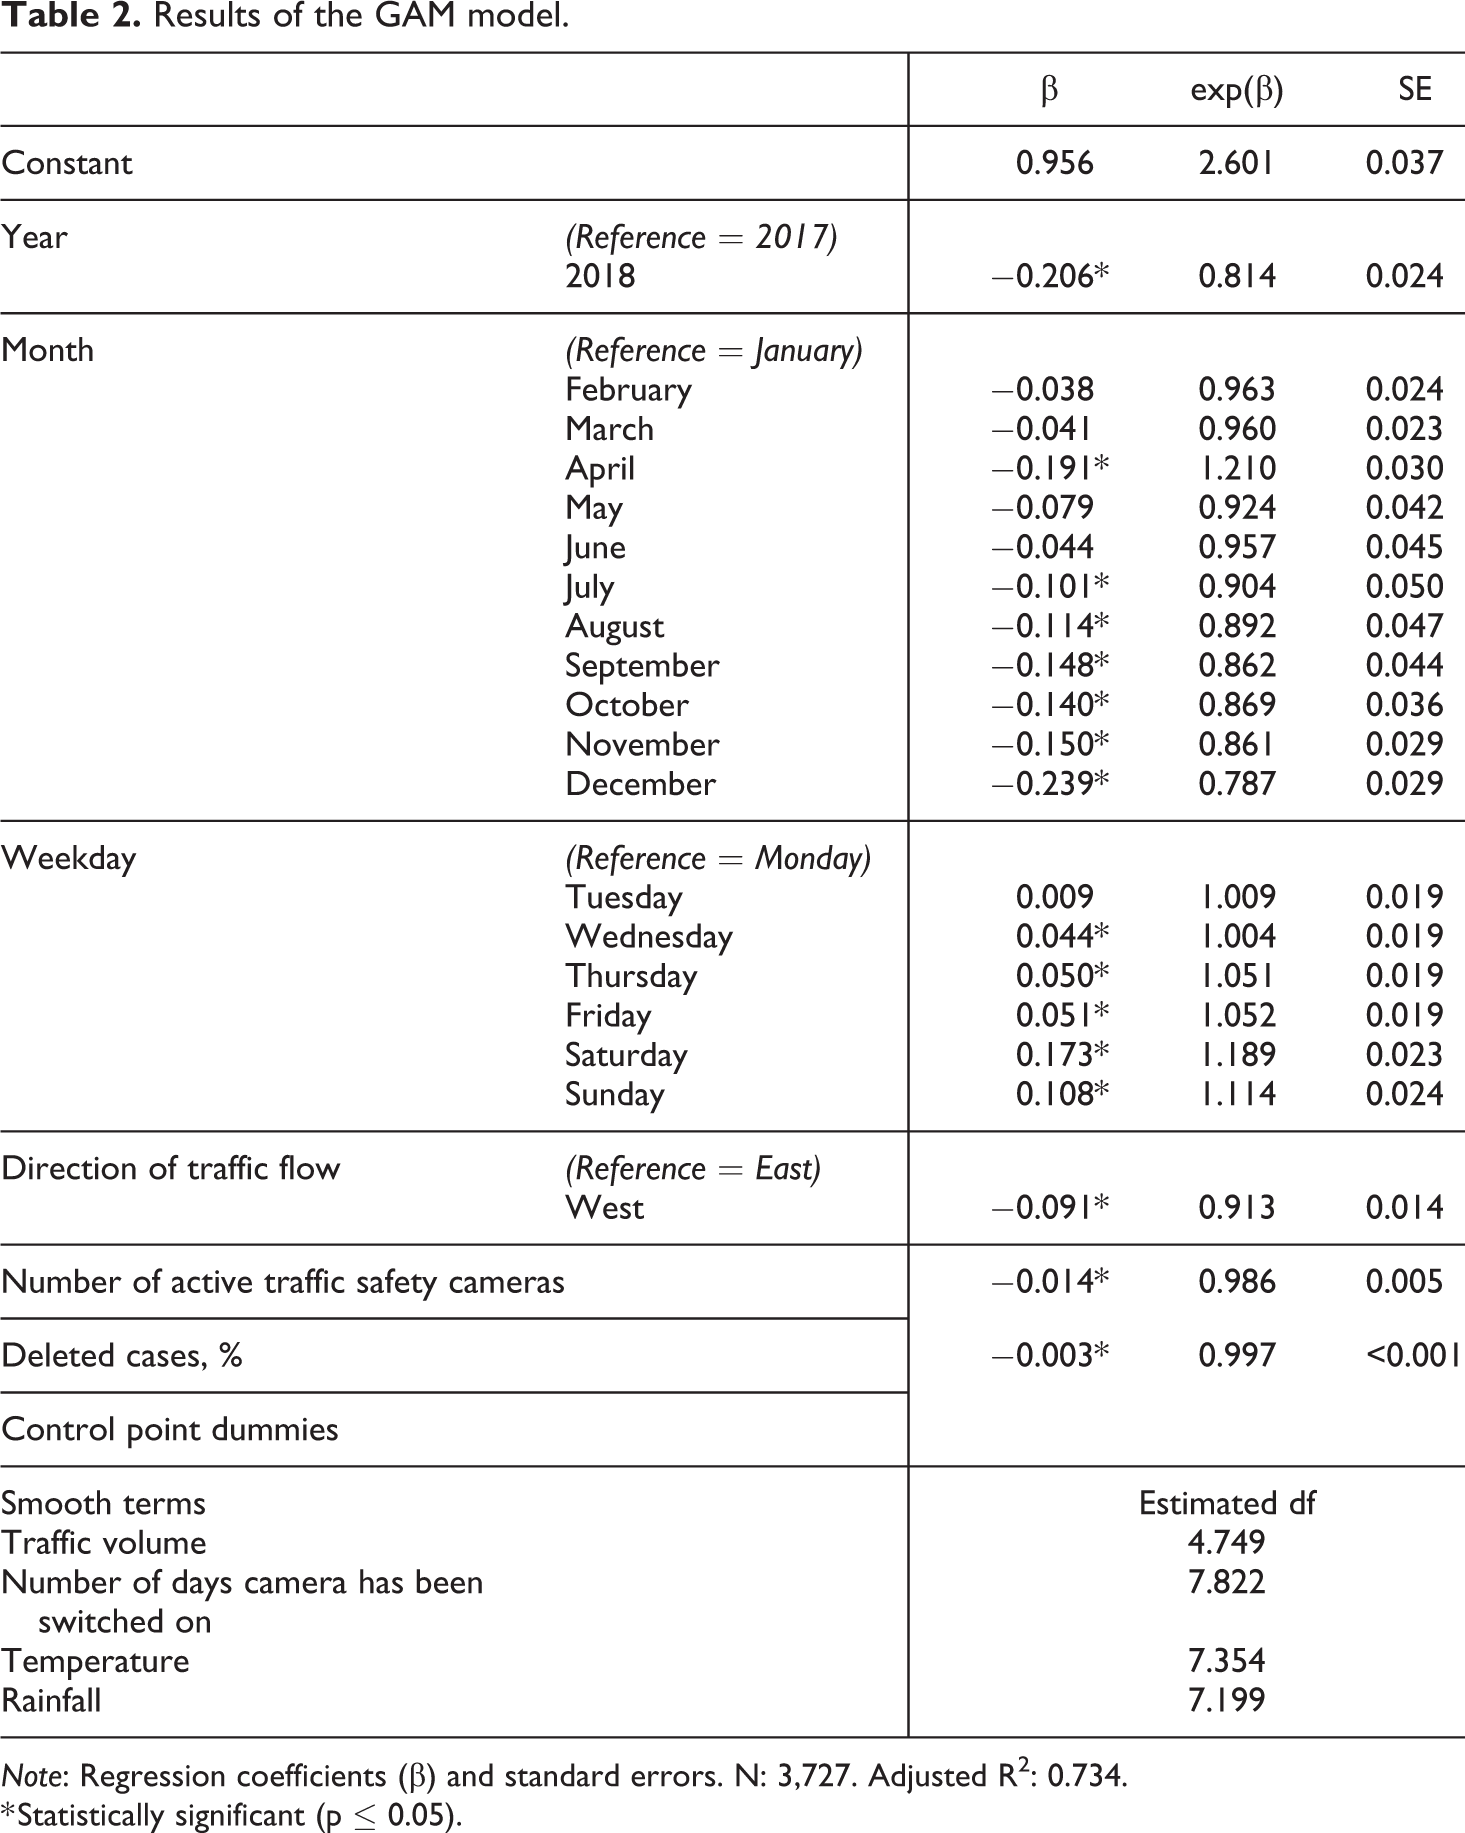
Note: Regression coefficients (β) and standard errors. N: 3,727. Adjusted R2: 0.734.
* Statistically significant (p ≤ 0.05).
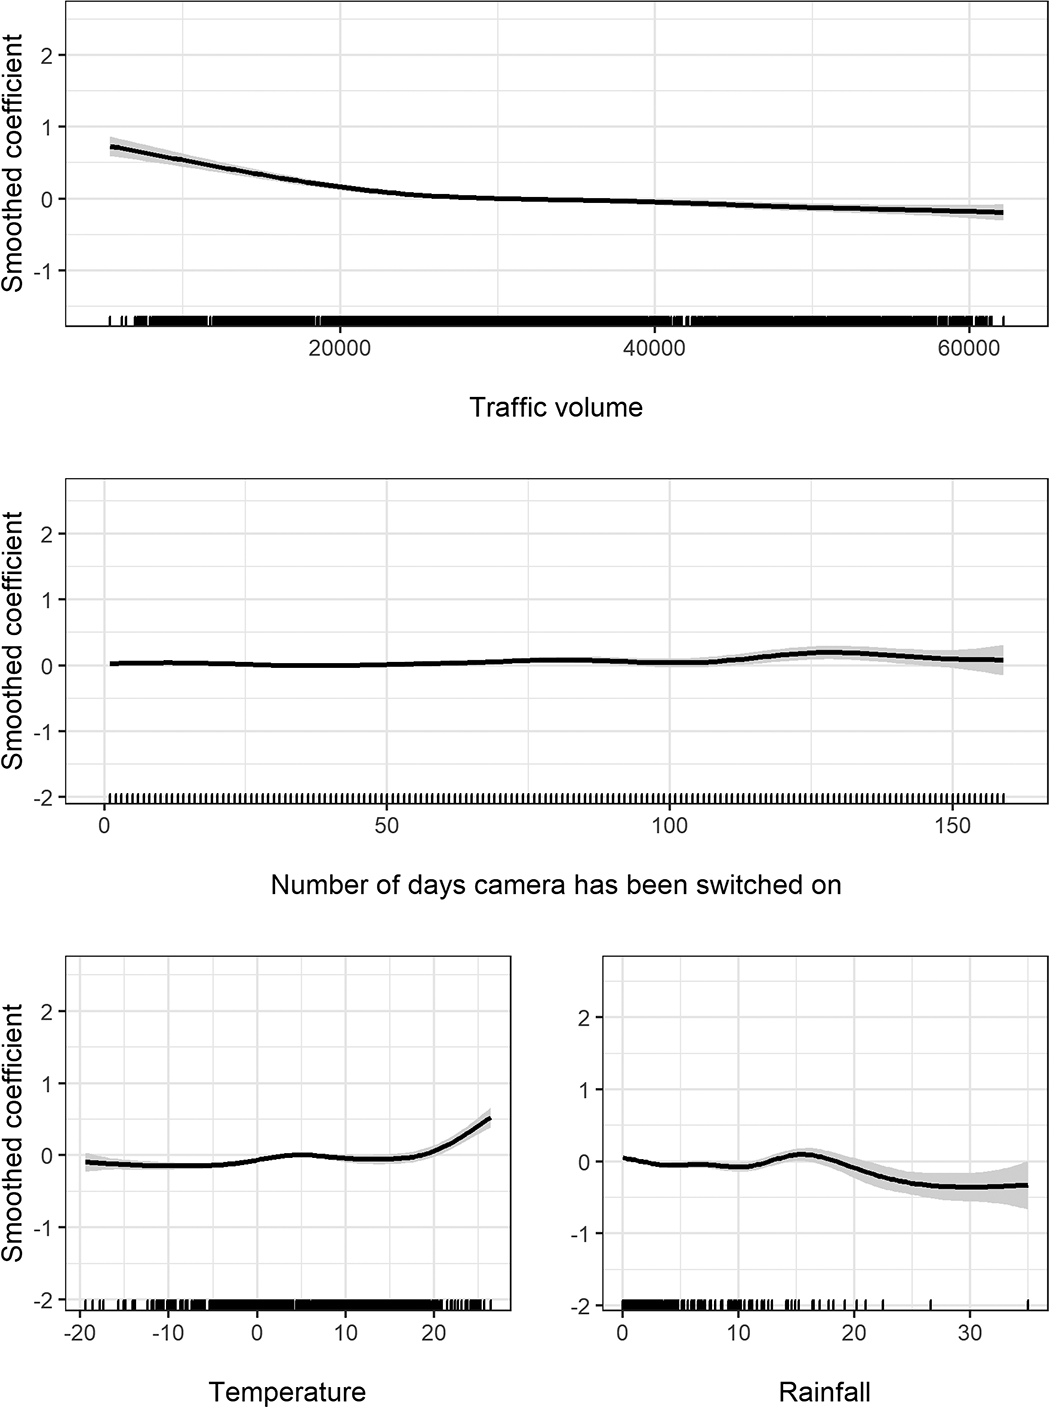
The associations of traffic volume, temperature, rainfall and number of days the camera has been switched with speeding sanction rates. Smooth terms and confidence intervals from the fully adjusted GAM model.
Speeding seems to be less common (−8%) while driving towards west than east on the Ring Roads. The more cameras are on and active on the road, the fewer sanctions are passed in a single control point. In other words, this finding indicates that more intensive speed control influences general speed limit compliance. One mechanism may be that when drivers see a flash of a camera, their perceived risk of getting caught for speeding at the next camera increases, which in turn leads to lowering of driving speeds. Results also show that, naturally, fewer sanctions are passed if more cases are deleted. The estimates of the single control point dummies are not displayed in the tables but are available upon request.
Sanction rates have a decreasing trend as traffic volume increases. The decreasing trend is strong up to about 25,000 vehicles per day, after which the increases in traffic volume no longer affect sanction rates. Duration of the active enforcement period in a single control point does not seem to affect speeding sanction rates much. The rates are stable up to about 1.5 months duration, after which the rates increase very slightly. Overall, however, the speeding sanction rates remain surprisingly constant irrespective of control period length.
Changes in temperature do not seem to influence sanction rates that much until temperature reaches about 20°C, after which sanction rates start to clearly increase (Figure 5). The inverse is true of rainfall. Speeding sanctions are less common during days with heavy rainfall (>15 mm), but the confidence intervals are also rather wide as the number of observation days with very heavy rainfall are relatively rare. (Rare) high temperatures seem to have a quite strong positive effect on risky speeding behaviour.
Discussion
Using data from Finnish automatic traffic enforcement, the aim of this study was to examine variation in speeding sanction rates by temporal characteristics and weather conditions. The results indicate that high temperatures are associated with higher rates of speeding, while heavy rainfall decreases the proportion of speeding cars. Conditional on traffic volume, speeding is less common in the beginning of the week, and generally during the latter part of the year. However, monthly variation in speeding sanction rates is relatively limited.
Almost 70 percent of observations were from the year 2018, suggesting increasing automatic traffic enforcement on these roads. However, according to the model, rate of speeding was lower in 2018 when compared to the year before. This finding supports the general observed decreasing percentages of vehicles photographed by mobile traffic safety cameras. The results also indicate that the total number of active control points on the same road affects the speeding sanction rates at a single control point, and the rates are lower when more cameras are active. One mechanism causing this effect may be the visible flashes from cameras when photos are taken, which may have both instantaneous and longer-term effects on daily commuters by affecting the perception of intensity of control.
There has been a lack of studies examining the influence of individual speed enforcement period to speeding. What would be the optimal period of time to control speed in one location and even perhaps change the location of the camera after that? Our findings support the idea that merely seeing the camera poles have an effect on driving behaviour, but overall it seems that the proportion of drivers speeding is largely unresponsive to the length of the enforcement. When drivers see a camera pole, they change their driving behaviour whether or not there is a camera inside the pole, and if so, whether it is on or not. As Nummenmaa (2019) states, the mere fear of being caught and economical and, in particular, social and moral deterrents guide people’s behaviour. They resemble a conscience that prevents you from engaging in forbidden acts (Nummenmaa, 2019). When drivers see a camera pole, the fear of being caught and also other deterrents guide them to drive within legal limits.
Weather conditions seem to partly determine drivers’ behaviour in traffic. The prevailing observable weather conditions influence driving behaviour, especially in higher temperatures and heavy rain. Drivers reduce their speed in heavy rain. People may become more irritable and lose their self-control easier when temperature becomes high enough, and uncomfortable warm temperature may have negative effects on drivers’ performance in traffic. It will be interesting to see whether prolongation of thermal summer and warmer air temperatures in Finland in the future has any effects on road traffic and people’s traffic behaviour (see Ruosteenoja et al., 2019). Scientific research and information on the effects of weather on crime has the potential to improve short-term allocation of police resources.
Age distribution of the sanctioned drivers was quite normal while the peak was from age of 35 to 54. This is interesting finding because according to Regev et al. (2018), more attention should be allocated towards crash involvement among under 40 years old drivers. The most common time for being caught for speeding by the camera was lunch time from 11 am to 3 pm.
Different means should be sought to try to influence speeding behaviour. To tackle speeding, there is a need for multiple intervention tools (Hankonen, 2019; Hoekstra and Wegman, 2011), of which speed enforcement is only one tool. Driver beliefs and attitudes may be the most suitable focus when designing future traffic safety interventions as they are among the strongest predictors of risky driving (Fernandes et al., 2010; see also Ward et al., 2019).
Police practices and decisions, and policing as a whole, should be as evidence-based as possible. Policing research and analysis can make policing more effective (Cordner, 2019: 232). According to sociologist Robert Sampson, criminologists should dedicate more of their time to studying the effects of law-enforcement policies and spend less time trying to figure out what causes crime (see Hutson, 2020). In similar vein, there is clear need for wider focus on traffic offences and behaviour in criminology.
The current study did not examine how other forms of criminal offending relate to the measured speeding offences. Self-selection policing (SSP) is an approach by which minor traffic offences can act as trigger offences, which can be used by the police to identify other crimes, even serious ones, that the offenders in the minor offences are involved in (see Roach, 2007a, 2007b, 2019; Roach and Pease, 2016). According to the approach, those who do serious, infrequent bad things also do little, more detectable bad things, such as minor traffic offences, more frequently (Roach, 2007a, 2019). This approach would be good to explore in the future. Even though our study looked at only few individual-level attributes of the drivers caught speeding, it would be possible to combine data from various sources to this automatic traffic enforcement data, and examine a wider array of variables measuring e.g. criminal background, employment, education and health of these drivers. Such research could provide a more comprehensive picture of the riskiest drivers.
We could also expand the scope of roads involved in the analysis, as some of the patterns detected in this study might be different on smaller roads in rural areas. While interpreting the findings of this study it is worth keeping in mind the analyses have focused on two beltways in rather small geographical area in the capital region. The whole traffic environment, for example, traffic volumes and number of traffic safety cameras per control period are different for the most part elsewhere.
The new, revised Road Traffic Act of Finland (tieliikennelaki 728/2018) enter into force on 1 June 2020. The Act reforms the penal system applied to traffic offences. It introduces provisions on the traffic penalty fee. The fee will be used as a sanction for minor traffic offences. For example, speeding at excessive speed up to 20 km/h is going to be sanctioned with the traffic penalty fee. The overarching aims of the Act are to improve traffic safety, flow of traffic and consideration of environmental aspects. For example, according to the Act’s Section 5, vehicle’s speed and distance to another road user must be adapted to the requirements of traffic safety, taking into account, e.g. weather, visibility and other conditions. Due to the reform, about half of all offences and infractions in Finnish crime statistics will disappear because of the minor traffic offences are no longer considered as crime.
Footnotes
Authors' note
Mikko Aaltonen is now affiliated with University of Eastern Finland Law School, Joensuu, Finland.
Declaration of conflicting interests
The author(s) declared no potential conflicts of interest with respect to the research, authorship, and/or publication of this article.
Funding
The author(s) received no financial support for the research, authorship, and/or publication of this article.