



Abstract
This article aims to further our understanding of the nature of the UK Independence Party. Our approach differs from much of the existing literature on party families, by analysing public attitudes towards the UK Independence Party in comparison with other parties. Multidimensional unfolding is utilised to map UK Independence Party’s place in the British party system, Tobit regressions are employed to compare UK Independence Party’s support base with that of the British National Party and the Conservatives and, finally, latent class analysis is used to assess the heterogeneity in UK Independence Party’s support base. The conclusion is that, with increasing success, the UK Independence Party has established itself as the only viable electoral option for British extreme right voters while also making serious inroads into more traditional conservative circles, who are Eurosceptic but not extreme. This bridging position between the mainstream and the extreme makes the UK Independence Party distinctive from other British parties and has parallels with the positions of anti-establishment, European Union sceptical and immigration-critical parties elsewhere in Europe.
Single-Issue, Mainstream or Extreme Right?
Despite considerable electoral impact, the UK Independence Party (UKIP) has been largely overlooked in the comparative literature. It is striking how much more attention has been paid to the much smaller British National Party (BNP), as a quick check on Google Scholar would show. The most plausible reason is that BNP has been treated as the only British extreme right party of interest, with UKIP brushed aside as a single-issue oddity. An illustrative example is Roger Griffin (2007: 246), who notes that UKIP has made manifesto statements about immigration which ‘would not be out of place’ in continental neo-populist parties, but still argues that the single-issue anti-European Union (EU) nature means that it cannot be classified into the same category as BNP (compare also John and Margetts, 2009). More in-depth studies of UKIP also tend to play down its degree of radicalism. Ford and Goodwin (2014: 7), for example, argue that BNP and UKIP ‘are very different parties’ in terms of ideology and origin. To this can be added different patterns of international co-operation (e.g. McGowan, 2014), and the fact that BNP is quite often labelled as ‘fascist’ in serious scholarly work (e.g. Copsey, 2008; Goodwin, 2011), which is not the case with UKIP.
That there are important differences between UKIP and BNP is quite clear. This, however, leaves the question about the nature of the former party unanswered. On its own, the distinctiveness from BNP does not preclude UKIP from being treated as a member of the broader, quite diverse, family of European far right parties. That the party cannot be dismissed as an irrelevance, or as a transitional phenomenon, is increasingly clear. It has been represented in the EU parliament since 1999, it was the biggest UK party in the 2014 EU election and it received the third highest number of votes in the 2015 General Election. Even though the EU membership referendum on 23 June 2016 resulted in a majority for ‘Brexit’, it cannot be assumed that UKIP will disappear.
To treat UKIP as a single-issue party may have been justifiable in its early years but has become increasingly questionable. In the 2015 General Election, UKIP produced a 76-page manifesto, covering a wide range of areas. Of course, EU opposition is a key priority, but in addition, the party wants to reduce taxes, repeal the Climate Change Act, increase the number of grammar schools, increase resources to the police, increase prison capacity, make convicted criminals serve their full sentences, introduce citizen initiatives, recall votes for Members of Parliament (MPs) and so on. Not least important, UKIP wants to tighten control of immigration and rejects multiculturalism (UKIP, 2015).
The main purpose of this article is to add to the rather sketchy knowledge about the nature of UKIP. The analysis will be conducted with two main points of reference. One is the view of UKIP as a somewhat more radical but non-extreme, extension of mainstream conservatism. There is much to suggest that this is the preferred self-image in large parts of the party. Indeed, several leading UKIP representatives, including its two MPs elected in 2014–2015, were defectors from the Conservative Party. It is, of course, true that UKIP has also targeted disgruntled Labour voters, but they have not done so with left-leaning economic rhetoric or policies. Rather, the attempts to woo former Labour voters have highlighted immigration and how money saved from leaving the EU can be used for health care, education and so on. A second approach is to view UKIP as a member of the broader European extreme right party family. The vociferous EU criticism, and the increasingly negative stance on immigration, means that UKIP has at least as much in common with, for example, the Swiss People’s Party and Lega Nord – at a stretch even the ‘de-demonised’ French Front National – as with the British Tories.
What we, thus, aim to investigate is which of two models fits UKIP best – the Tory model or the European Extreme Right (EER) model (the label Extreme Right will be used in full awareness that other designations exist). Our approach will be different to the existing literature on party classification and party families. Instead of looking at party history and documents (compare Mair and Mudde, 1998), focus will be on perceptions in the electorate. Employing like–dislike scales as the main variable, the public perception of UKIP will be investigated and compared with the other main British parties plus BNP. The main aim is to locate and characterise the groups who like, and dislike, UKIP and compare them with the groups liking, and not liking, other British parties.
Three questions will be given particular attention. First, where does UKIP fit into the British party system, in terms of sympathies/antipathies? Are they mostly like BNP, that is, marginalised if not ostracised, or have they moved closer towards the mainstream of UK politics? Second, how similar are the support patterns of UKIP in comparison with what is known about the EER? The EER support patterns will be referred to as the Extreme Right Template, and presented below. The question we aim to answer is whether UKIP, when the template is applied, is more similar to BNP or the Conservatives. Third, where do UKIP votes come from? How homogeneous or heterogeneous is their support? Are they single-issue Eurosceptics, do they fit better with the Extreme Right template – or are they also taking votes from traditional Tory or Labour support?
The analysis covers two time points using data from the 2010 and 2015 British election studies (BES). This will allow us to assess whether the standing of UKIP among British voters remained stable during a period when the party went from being an outside irritant to becoming a major threat against the mainstream parties. Despite being punished by the electoral system used in Westminster elections, its share of the vote has become big enough to affect the strategies of other parties. BNP, meanwhile, seemed on the verge of a breakthrough after winning two seats in the 2009 EU election but soon succumbed to internal splits. The party still existed in 2017 but was in serious decline. This also means that the 2015 BES data could be the last opportunity to include BNP in a comparison of British parties.
The Extreme Right Template
There is a vast literature on voting for extreme right parties (e.g. Givens, 2005; Rydgren, 2008; Van Der Brug and Fennema, 2007), but a brief summary should be sufficient here. Beginning with socio-demographic characteristics, the extreme right vote is predominantly male (Mudde, 2007: 111–118). Extreme right voters also tend to be young and working or lower middle class (Givens, 2005: 60–66; Hainsworth, 2008: 95–104, 60–66). The unemployed tend to be overrepresented (Givens, 2005: Chap. 4; Norris, 2005: 143). Comparative studies on employment sector are scarce, but country-specific studies suggest that extreme right votes tend to come from the private sector (e.g. Andersen and Andersen, 2007: 214f; De Weert and De Witte, 2007; Oscarsson and Holmberg, 2013: 139). Extreme right voters tend, finally, to have comparatively low levels of education (Hainsworth, 2008: 95f; Norris, 2005: 141f, 95f) and not to be religious (Lubbers et al., 2002).
Regarding attitudinal factors, it is almost too obvious to mention that extreme right voters are against immigration. This is not to say that they necessarily hold outright racist views (Rydgren, 2008), but immigration has become a more or less universal factor behind extreme right voting (Lubbers et al., 2002; Stockemer, 2016). Extreme right voters are also unhappy with the political establishment, even though the notion of an empty protest vote meets with little support in the literature (e.g. Oesch, 2008; Van der Brug and Fennema, 2007). Other possible attitudinal factors include authoritarian views about law and order, and obedience to authority, which is a key part of the extreme right message (Mudde, 2007). EU criticism is a core value for the vast majority of extreme right parties in Europe, although this was not always the case historically (Müller, 2002). Regarding the economy, most extreme right parties have adopted a pro-welfare stance, referred to as welfare chauvinism (Mudde, 2000).
A third set of variables is to do with the personal characteristics of extreme right voters. Findings by Wilcox et al. (2003), based on macro-level data, suggest that extreme right parties tend to perform better in countries with low levels of social capital. An individual-level analysis by Rydgren (2009), spanning six West European countries, does not find evidence to support any crude generalisations of extreme right voters as isolated and socially inept, but the exact results vary according to the indicators used, and also across different countries. Despite the ambiguities, social capital is a factor that cannot be overlooked and will be included in our analysis.
The final group of factors will be media consumption. Research evidence indicates that levels of support for an extreme right party are not primarily affected by the reporting about the party itself, but rather the treatment of the party’s prioritised issues. An obvious example is immigration – it plays into the hands of an extreme right party if the media frequently report immigration as a problem, such as immigrant crime or difficulties with integration (Walgrave and de Swert, 2004). In a similar vein, media outlets that frequently provide negative reports about the EU can be expected to benefit an EU critical party. We will, therefore, test the impact of reading different newspapers with varying perspectives on immigration and the EU.
Data
The data used will be from the last two British election studies (BES), namely, the 2010 Campaign Internet Panel Survey (CIPS; Clarke et al., 2011) and the 2014–2017 British Election Study Internet Panel (BESIP; Fieldhouse et al., 2015). This provides large numbers of respondents sympathising with even relatively minor parties, like BNP or UKIP (as the latter still were in 2010). A disadvantage is that some of the variables discussed above do not appear in the most straightforward form. Also, since both are Internet surveys, they suffer from under-representation of certain social groups which in our case may be of particular interest, given the social composition of extreme right party support. However, it has been found that the Internet-based YouGov surveys used for the BES compare quite well with face-to-face surveys, and CIPS and BESIP provide weight variables. For the following analyses, we have used data from the pre-campaign wave of the CIPS panel (the only survey asking like/dislike questions about all parties of interest, including BNP) and from the fourth wave of BESIP (the pre-campaign wave in 2015). For all analyses, we are using the standard weight variable for the full sample.
Our main variable of interest is not voting or vote intention, but the following question: ‘On a scale that runs from 0 to 10, where 0 means strongly dislike and 10 means strongly like, how to you feel about party x?’ In BESIP, a split sample design was employed where half of the sample was asked this like/dislike question, while the other half was asked a propensity to vote (PTV) question: ‘How likely is it that you would ever vote for each of the following parties?’ The PTV question tends to be more discriminating in the responses it elicits, but otherwise the trends are very comparable. In all our analyses, here, we focus on the measure that is comparable across studies, the like/dislike scale. 1
In contrast to vote choice, this variable allows for a more nuanced analysis. A comparison of vote choice models, including BNP, also becomes impossible to estimate due to the very small N for BNP in 2015 (around 50 out of a sample of over 30,000). The independent variables for the second part of our analysis include socio-demographics, attitudinal variables and media consumption in order to compare each party’s support with the above-discussed ‘extreme right template’. There are some differences with regard to measurement and availability of variables across the two panels, which are discussed below. The BES started to include like/dislike scales for both UKIP and BNP only in 2010, which means that 2010–2015 is the only period where a detailed analysis of attitudes towards parties, including BNP and UKIP, is possible.
The Position of UKIP in the British Party System
The starting point of this research was the simple observation that when like/dislike scores were correlated among all available pairs of British parties 2 in 2010, the largest positive correlation was between UKIP and BNP (see Table 1). It was only matched by the negative correlation between Labour and the Conservatives – the dominant partisan divide in British politics. To our knowledge, it is unprecedented to find a positive association in attitudes towards two British parties coming so close to emulating the negative association between the two main players in British party politics.
Correlations Between Party Feeling Thermometer Scores in 2010.

Source: British Election Study Internet Panels 2010 (Clarke et al., 2011).
BNP: British National Party; UKIP: The UK Independence Party.
Correlation significant at 0.001. Bold entries indicate the strongest positive and negative correlation.
Perhaps surprisingly, we continue to observe a large positive correlation between UKIP and BNP in 2015 (see Table 2), despite the widely diverging electoral fortunes of the two parties – UKIP securing more than 3.8 million votes and BNP reduced to 1667 votes.
Correlations Between Party Feeling Thermometer Scores in 2015.
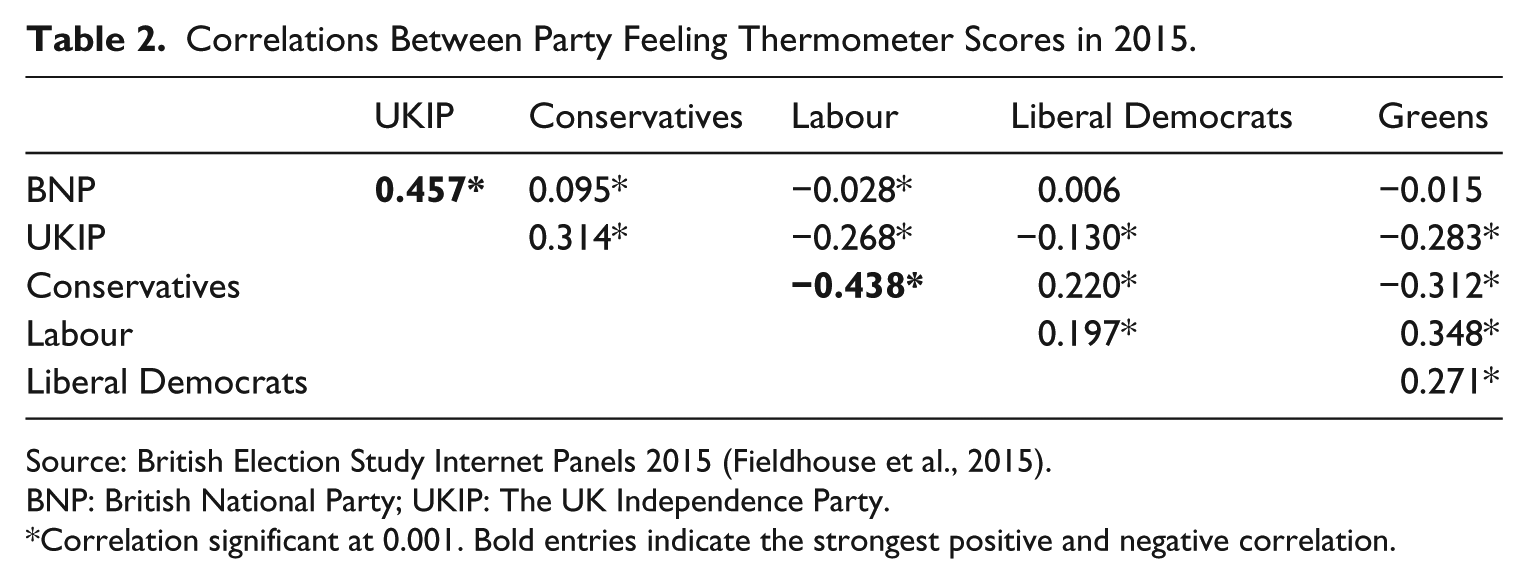
Source: British Election Study Internet Panels 2015 (Fieldhouse et al., 2015).
BNP: British National Party; UKIP: The UK Independence Party.
Correlation significant at 0.001. Bold entries indicate the strongest positive and negative correlation.
Seen in isolation, the correlations reported in Tables 1 and 2 imply some systematic co-occurrence of antipathy, as well as sympathy towards both parties. For example, a majority of remaining BNP sympathisers become UKIP voters by 2015. At the opposite end, almost everyone who scored UKIP zero on the like/dislike scale also gave BNP a zero. But the correlation, while strong, is far from perfect. It does not mean that every supporter of UKIP also likes BNP or that everyone who despises BNP is equally dismissive of UKIP. We should, indeed, not just look at this relationship in isolation. Tables 1 and 2 show a complex, but not unstructured, pattern of positive and negative associations across British parties. Attitudes towards parties that are traditionally understood to be on the right of the political spectrum (Conservatives, UKIP and BNP) are all positively correlated, as are attitudes towards all three parties traditionally located to the left or centre-left (Labour, Liberal Democrats and Greens), while across the left-right divide correlations are negative. The only real exceptions to this pattern are (a) the Tory–LibDem coalition partners becoming positively associated by 2015 and (b) weak negative correlations between BNP, LibDems and Greens losing significance in 2015, a consequence of almost universal disapproval, and increasing irrelevance, of BNP.
But, importantly, the patterns of negative and positive correlations do not imply a straightforward unidimensional party preference space that runs from the far right to the far left. Remember that the strongest negative correlation is between two non-extreme parties, Labour and the Conservatives.
A better way to illustrate where UKIP as a political party fits into the British party system, how systematically similar to the BNP it is perceived and whether it has made any inroads into the mainstream of British politics, is multidimensional unfolding (Busing, 2010; Coombs, 1950). This is a technique that jointly maps row (in our case, respondents) and column entities (in our case, political parties) from either ranking or rating data in a low-dimensional common space. The already utilised 0–10 like–dislike scales will be used as data input. Mapping respondents and parties from these input data results in a representation of party preference rank orderings, where the distance between a respondent and a party is inversely related to how highly the respondent rates that party compared with all other parties. 3 As already mentioned, there are good reasons to argue that a unidimensional representation of the latent preference space is not an option – a simple left-right dimension is not sufficient to map all the variation in party preference orders across individuals. However, a two-dimensional solution proves easily sufficient, not just conceptually but also in terms of model diagnostics.
Including only respondents who answered the like–dislike question for all six parties, we arrive at sample sizes of N = 13,923 for 2010 and N = 13,596 for 2015. We are using PREFSCAL, 4 one of the few algorithms for multidimensional unfolding that guarantees avoiding degenerative solutions (Busing, 2010). The unfolding analysis maps over 13,000 row items (respondents) and six column items (parties) in a two-dimensional space, with proximities defined as similarities and ties being kept (i.e. identical scores for two parties translate into equidistance from the respondent). The arrived solutions show no degeneracy, account in each case for 93% of dispersion in the original data, for 73% of variance in 2010 and for 72% in 2015. The left panel in Figure 1 presents the latent party preference space in 2010 and the right panel the preference space in 2015.
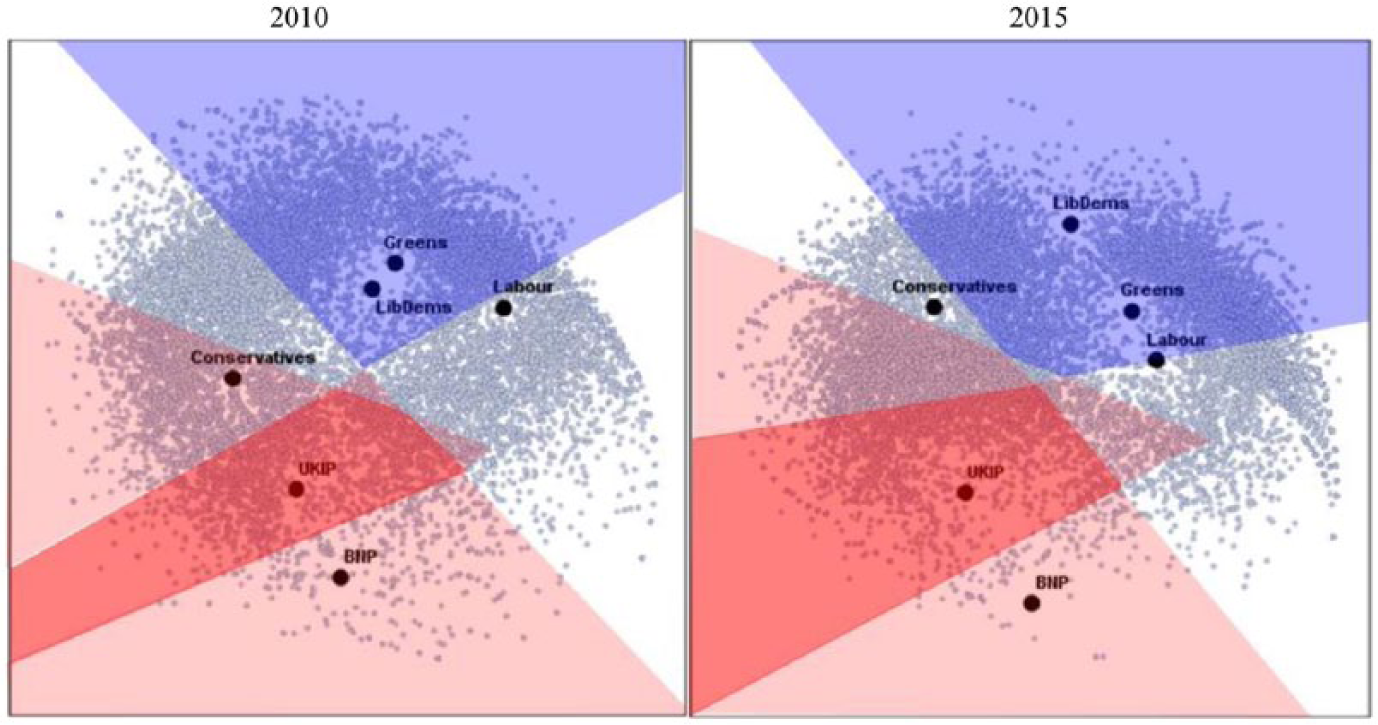
Unfolding Analysis: UKIP in Relation to Other Parties and Voters in the Latent Party Preference Space.
Two important caveats are in order before interpreting these unfolding graphs: first, this should not be misunderstood as a latent policy space. While the latent preference space may be informed by left-right or other ideological dimensions, the two dimensions of our unfolding map do not directly translate into those. Hence, any movement of a party between 2010 and 2015 only implies that its relative popularity vis-à-vis other parties has altered. Second, while the unfolding algorithm used here retains object rankings, it does not retain precise object ratings. The closest party in the latent policy space revealed by unfolding is simply the highest ranked of that respondent, the second-closest the second-highest ranked and so on. This would remain the case also if, for example, a respondent put all parties below the mid-point of the 0–10 scale.
Since the main focus here is on the relative standing of UKIP within this party preference space, the data in Figure 1 are presented in the form of a ‘heat map’ with reference to UKIP. The red-shaded (warmest) area contains respondents who rank UKIP highest in their preference order. The pink-shaded area contains those who rank UKIP within the top two of their preference order, while the blue-shaded (coldest) area contains those ranking UKIP and BNP at the bottom of their preference orders.
Primarily, the maps illustrate how UKIP remains at the margins of the British party system and is, by far, the party closest to BNP. In contrast to BNP, however, UKIP bridges the space between the extreme right fringe and the political mainstream. Almost all BNP supporters (of which few are left in 2015) have UKIP as their second choice, 5 and about half of UKIP supporters rank BNP second. 6 By 2015, UKIP have certainly expanded their reach into the extreme right, becoming the primary choice of most of those with any sympathies for BNP.
The expansion of UKIP’s electoral reach in 2015 is also evident on other fronts. While in 2010, UKIP was outside the top two in an overwhelming majority of preference orders (blue- and white-shaded areas combined), by 2015 the red- and pink-shaded areas have both expanded considerably, indicating that UKIP has become competitive among a much larger portion of the electorate. At the same time, UKIP has become a more polarising force. The blue-shaded area, containing those who reject UKIP and pigeonhole them together with BNP, has also expanded. This segment is almost exclusively populated by those favouring Liberal Democrats, Greens and Labour. There is little indifference (white areas) left in the 2015 map.
UKIP has expanded in terms of both outright support and competitiveness. The red-shaded area has increased and is also more populated in 2015, implying that more respondents favour the party above all others. This growth comes from taking away outright support from both BNP and the Conservatives. But, perhaps more importantly, the lighter pink-shaded area (respondents who rank them within their top two) has increased considerably, implying that UKIP is much more competitive. On that front, they are encroaching considerably on Conservative and to a lesser extent on Labour territory. UKIP has become more competitive, and perhaps electable, in some parts of the electorate at the same time as having become more maligned and pigeonholed as an extreme right party in other parts. The party has soaked up more far right support in 2015, with BNP being ever more marginalised, but at least as much of the growth in popularity has been through expansion into the mainstream of British party politics.
Critically, the ‘warm’ areas in the heat map from unfolding analysis show UKIP as nested between BNP and the Conservatives. About half of those who rank UKIP top have BNP as the second preference; the other half has the Conservatives second. UKIP is much more likely to be second-ranked to the Conservatives than to Labour in anyone’s preference order – which is evident from the pink-shaded area next to the Conservatives comfortably exceeding the size of the corresponding area closest to Labour. So if, in terms of preference orders, UKIP shares about as much with BNP as with the Conservatives, how does that translate into the nature of their support base? Does UKIP support follow the Extreme Right Template, meaning that it has links not only to BNP but also to a broader European extreme right party family, or does it have more in common with more traditional centre-right support of a party like the Conservatives? That question is what we turn to next.
Comparing UKIP’s Support Base with that of BNP and the Conservatives
The preceding analysis implies that UKIP are deriving support and sympathies from the extreme right fringe, as well as some section of the British population that falls into the political mainstream. To understand this bridging position of the party a bit better, we aim in our second step to test the extent to which UKIP fits the earlier described Extreme Right Template. In order to test that overall relationship as well as its evolution over a period in which UKIP became significantly more popular, while BNP almost disappeared as an electoral option, we ran regressions on data from again both 2010 and 2015. Most of the independent variables in the models presented below are straightforward, but changes in the questionnaires mean that it is not possible to replicate the analysis exactly across the two time points. The 2015 survey lacks information about, for example, sector employment, prospective personal finances and social capital. On the other hand, it includes items from which we could construct an authoritarianism scale which was missing in the 2010 panel. In some cases, question wordings and response options have been altered. Nevertheless, there is enough similarity between the two time points to allow meaningful comparison (see online Appendix S1 for a summary of how variables were measured in both surveys).
The nature of our dependent variables (feeling thermometer scores for UKIP, BNP and the Conservatives) makes the choice of an adequate model for analysis anything but straightforward, however. The more general question of whether a 0–10 scale is better understood as a continuous or ordinal variable is not at the heart of our problem, since thermometer scales, just as PTV scores, tend to meet the fundamental requirements for treating an ordinal scale as though it were continuous (Kim, 1975). 7 Our main problem lies not in the measurement but in the frequency distribution of our dependent variables. These are shown in Figure 2, and it becomes quite clear that our dependent variables deviate considerably from a normal distribution. In particular, they consistently expose a severe floor effect, with respondents clustering at 0 (=extreme dislike of the party in question); more so in case of BNP than UKIP or the Conservatives, and much more so in 2015 than earlier across all three parties.
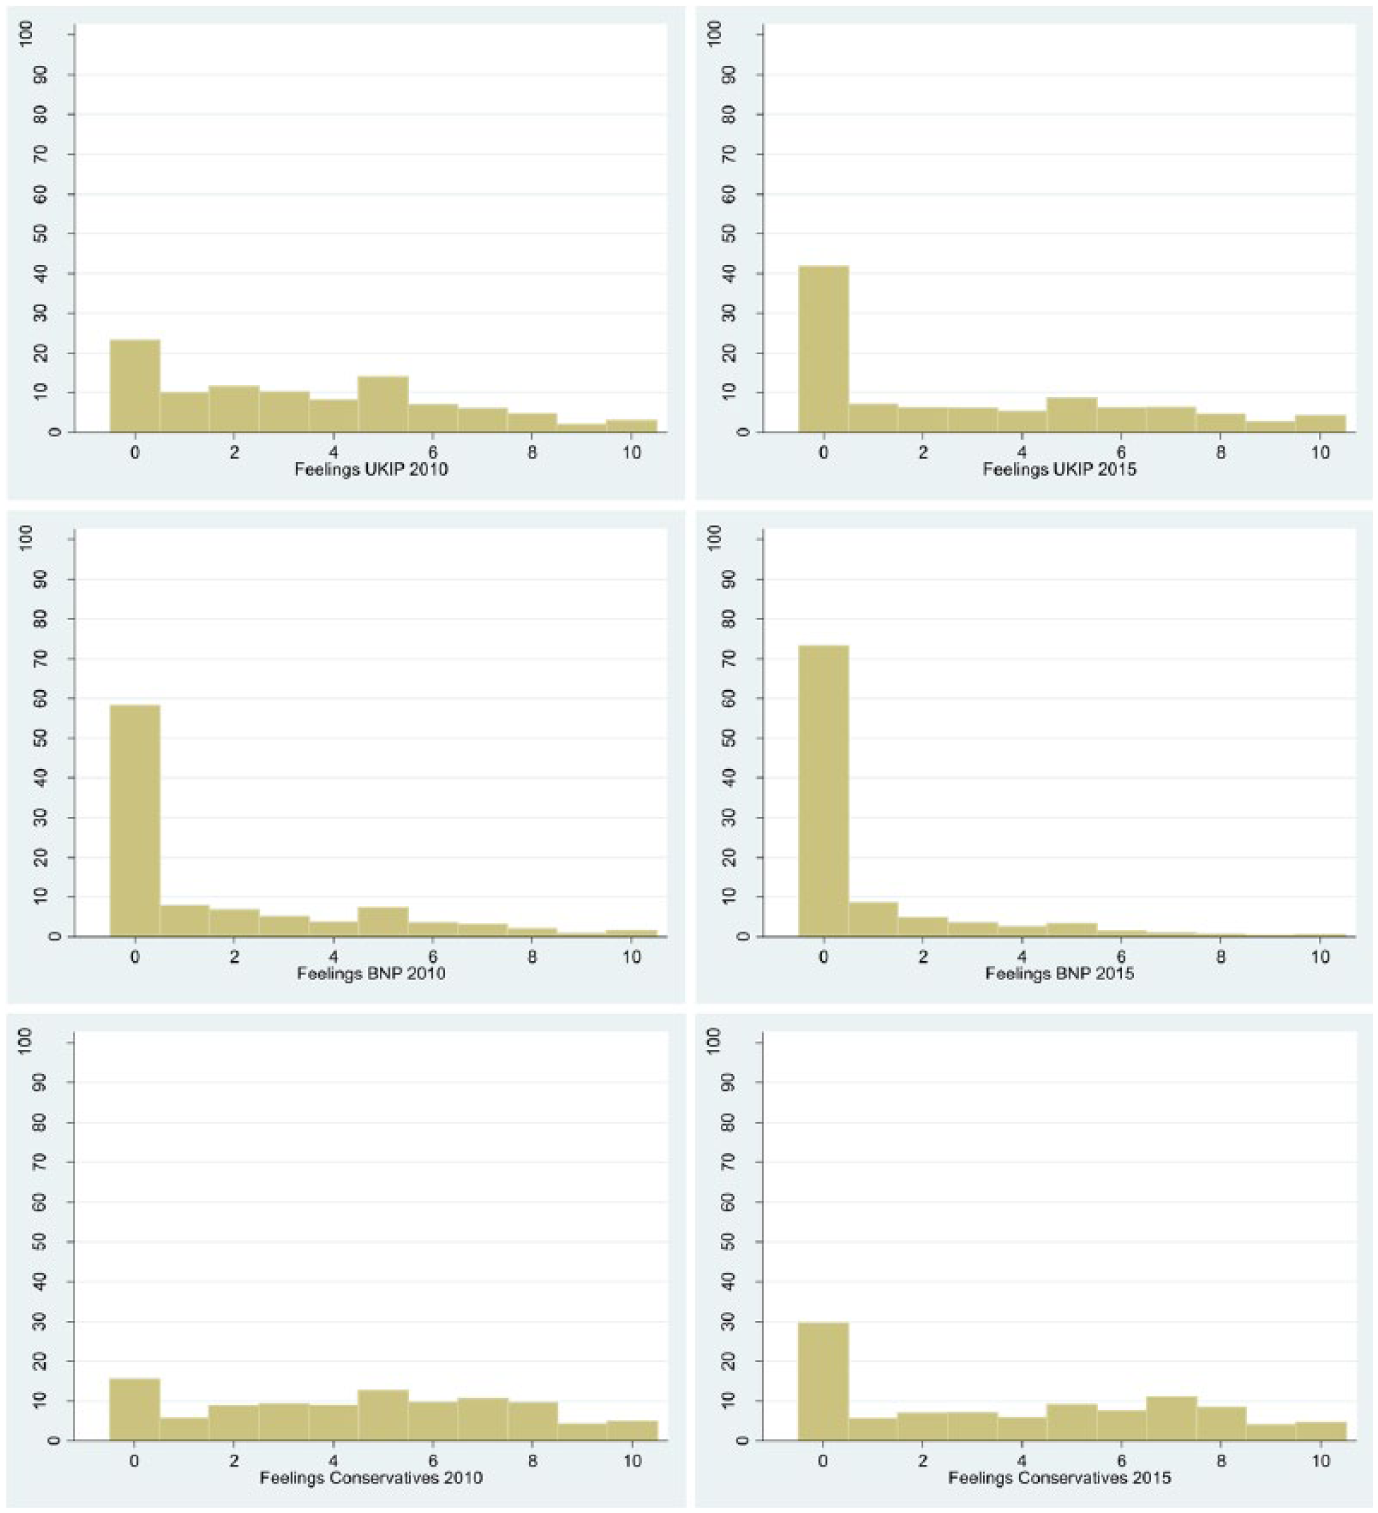
Frequency Distributions, Dependent Variables 2010 and 2015.
The problem of a dependent variable which is constrained, and exposes severe clustering at the constraint, can be tackled with a Tobit or censored regression model (Cameron and Trivedi, 2009; Long, 1997). If there is severe clustering at zero using ordinary least squares (OLS) regressions will result in an underestimated intercept and overestimated slope, because ‘the censored observations on the left pull down that end of the regression line’ (Long, 1997: 189). Tobit models deal with this problem by estimating the effects on a latent variable that is not censored, that is, can take on values below the constraint. 8 More specifically, Tobit models work through maximum-likelihood estimation that combines a probit and a linear regression element modelling, first, the impact of the independent variables on the probability of a score being above zero and, second, combining this with their linear impact on variation in values above zero. 9 Tobit models are particularly useful for our purposes insofar as they allow to calculate standardised coefficients – albeit less straightforward than in OLS (Long, 1997: 207f). This provides us with a suitable tool to analyse and visualise the extent to which the support base of UKIP resembles that of either of the other two parties. Results are reported in Figures 3 and 4 for the 2010 and 2015 models, respectively. 10 Full model specifications can be found in the online Appendices S2 and S3.
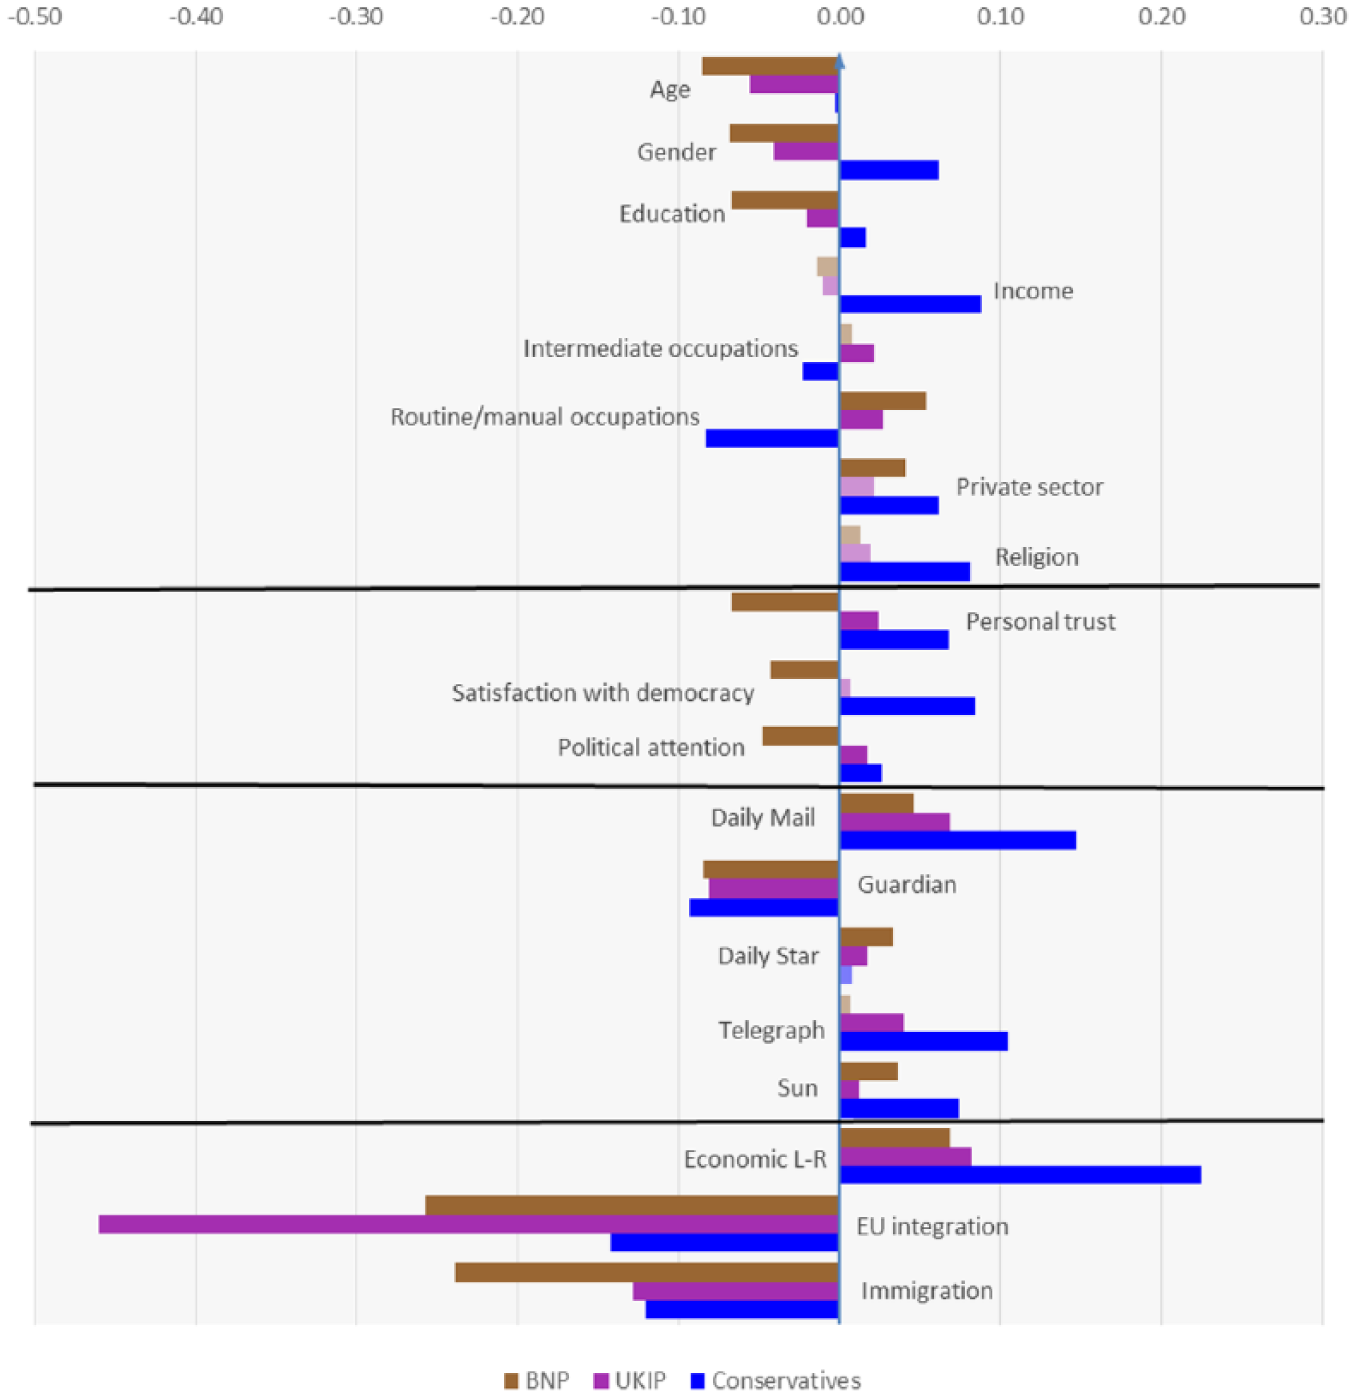
Predictors of Conservative/UKIP/BNP Feelings in 2010 (Standardized Coefficients).
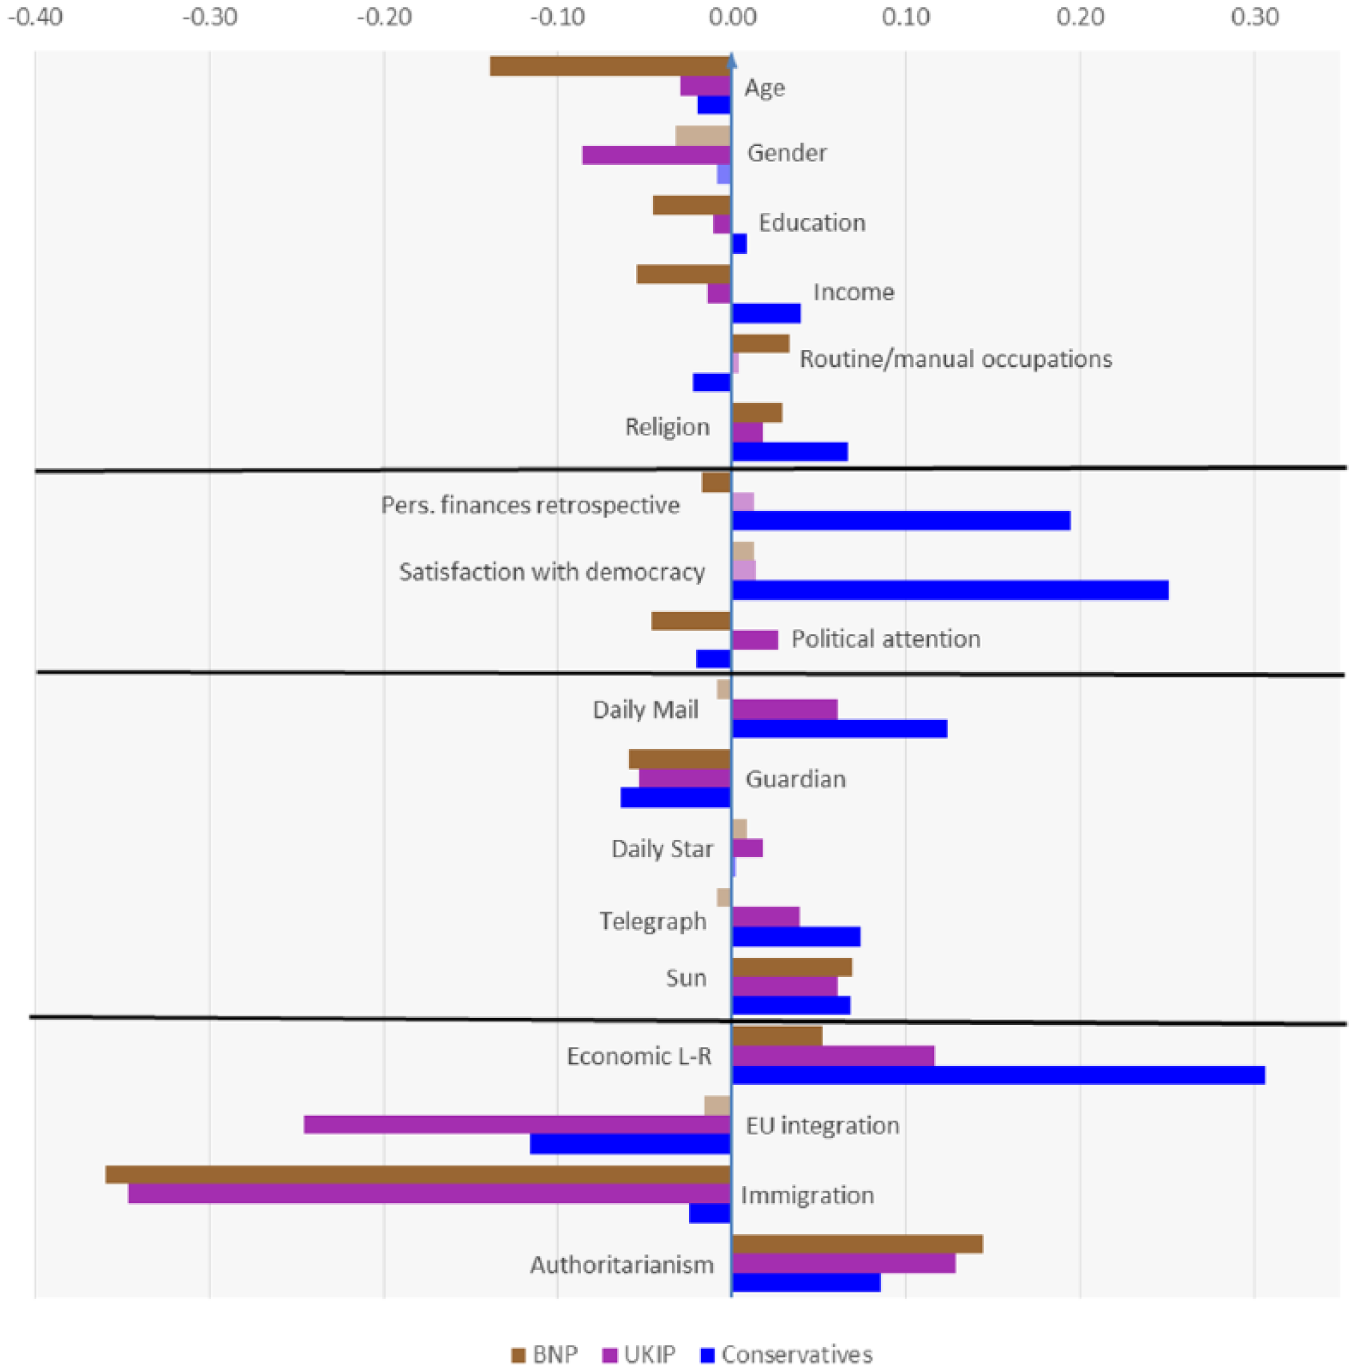
Predictors of Conservative/UKIP/BNP Feelings in 2015 (Standardized Coefficients).
The findings from both years, but particularly from 2010, are quite remarkable. Almost without exception, the same socio-economic indicators are significant and pull attitudes towards both BNP and UKIP in the same direction. In contrast, the effects of most socio-economic variables point in the opposite direction when it comes to the Conservatives. Evaluations of both UKIP and BNP improve among young, 11 male, working-class respondents on low incomes and with low levels of education, and in 2010 (when measured) particularly among those working in the private sector. All of these are socio-demographic characteristics that fit the extreme right template. The only socio-demographic factor that clearly goes against the extreme right template is religion, which was insignificant for both parties in 2010, and had a positive effect on both parties in 2015. Tentatively, this could be related to both parties’ intensifying criticism of Islam. In 2010, evaluations of the Conservatives are higher among females, high income earners and private sector employees, while they go down among respondents with routine and manual occupations. In 2015, we find less impact of gender. Income and class still matter, while there are no data on sector employment. Not unexpectedly, religion has a positive effect on attitudes to the Conservatives on both occasions.
Things look different when it comes to political efficacy or political integration. Here, UKIP support is much more similar to that of the Conservatives. BNP support maximises among those with low levels of trust, satisfaction with democracy and political attention. At least in 2010, the opposite is the case for both UKIP and the Conservatives – the impact is much stronger for the Conservatives. By 2015, UKIP becomes a little more located between the other two. Political attention now only has a positive effect on what respondents think of UKIP. And while satisfaction with democracy has a much larger impact on what you make of the Conservatives (a clear incumbency effect), it continues to be insignificant for UKIP and has become insignificant for BNP.
Newspaper readership tends to pull largely in the same direction for all three parties but more frequently so for UKIP and Conservatives than for BNP. All three parties are unpopular among Guardian readers but popular among Daily Mail readers in 2010, and Sun readers in 2015. The Mail effect disappears for BNP in 2015, while Sun readers actually take more to all three parties in 2015 than in 2010. The Telegraph consistently pulls readers towards UKIP and, especially, the Conservatives, but not BNP.
When it comes to attitudes, some marked differences are apparent. Being economically right wing, while pulling in the same direction throughout, has, by far, the strongest effect on Conservative support and the least impact on what you think of BNP, with UKIP in between. Interesting changes over time occur with regard to attitudes towards immigration and EU integration. The EU consistently matters most for UKIP but disappears as a factor for BNP in 2015. For the Conservatives, the EU issue remains significant but has consistently much less impact than on UKIP. Immigration has a comparatively limited effect on Conservative support. Unsurprisingly, the effect is much stronger for BNP, with UKIP in between. In 2015, however, the effect of immigration on UKIP support has almost caught up with that of BNP. Authoritarian attitudes (only available in 2015) also maximise BNP, as well as UKIP support almost equally, while they matter a lot less for attitudes towards the Conservatives.
Overall, then, the picture is mixed. As far as socio-demographics and attitudes are concerned, the basis of UKIP support comes across as much more similar to that of BNP than of the Conservatives. On the other hand, the analysis indicates that UKIP supporters are more politically integrated than their BNP counterparts; in that respect being more Tory than extreme right. However, the analysis presented in this section averages effects across entire survey samples and combines factors, explaining sympathies as well as antipathies. The unfolding plot from the previous section implies that while BNP supporters come across as relatively homogeneous in their – largely positive – evaluations of UKIP, not all UKIP supporters seem to reciprocate. There could, therefore, be significant variations in how they relate to both the extreme right and the moderate centre-right neighbour. In addition, although some UKIP supporters share demographic and attitudinal characteristics with BNP supporters, others may not. The appropriate method to disentangle such potential heterogeneity in UKIP support is latent class analysis (LCA), which is what we move to in the final step of the analysis.
The Heterogeneity of UKIP Support
In order to investigate in more detail whether, and to what extent, support for right-wing parties and mutual appreciation among supporters of such parties is heterogeneous across societal groups, we conduct a LCA. 12 This is a method that seeks to locate groups, or sub-types of cases (latent classes), in multivariate categorical data. In our case, the aim is to find sub-groups in the British electorate that are characterised by within-group homogeneity and between-group heterogeneity in how they assess UKIP, BNP and the Conservatives. The main purpose is to disaggregate patterns of UKIP support: does the party have different types of supporters, and can we estimate the extent to which UKIP attracts extreme right voters compared with its competitiveness among more mainstream voters?
For these purposes, we created dummy variables from like–dislike scores for all three parties of interest – UKIP, BNP and the Conservatives. Given that 0 is the modal category for each party, we kept scoring a party 0, that is, rejecting it, as a separate category. We then simplified in order not to have 11 dummy variables per party and created three further categories, summarising negative (1–3), neutral (4–6) and positive (7–10) evaluations. Only including respondents who answered the like–dislike question for all of our studied parties, we arrive at 12 items per respondent, with each respondent providing three responses (1) and nine non-responses (0). In the LCA plugin, parameters are estimated by maximum-likelihood, with Gamma (γ) parameters expressing correspondence between observed items and latent classes and Rho (ρ) parameters expressing item-response probabilities conditional on latent class membership. We ultimately arrived at a model with seven latent classes on the basis of both model fit and theoretical fit. Evaluating model fit, we found that neither Akaike Information Criterion (AIC) nor Bayesian Information Criterion (BIC) improved beyond a seven-class solution, while entropy, that is, classification uncertainty, only tended to reduce up to that point. On the theoretical side, while more parsimonious solutions (three- or four-class models) were possible, only with seven latent classes were we able to distinguish key subgroups. It was, in addition, found that a model with seven latent classes produces persuasively similar patterns for both the 2010 and the 2015 data. Figures 5 and 6 graphically illustrate the item-response probabilities (Rho (ρ) parameters) for the party dummies derived from the like–dislike scales across the seven classes. We are using a similar colour coding to the earlier ‘heat map’ – red indicates supporting and blue indicates rejecting a party.

Probability of Party Evaluation by Latent Class Membership, 2010.
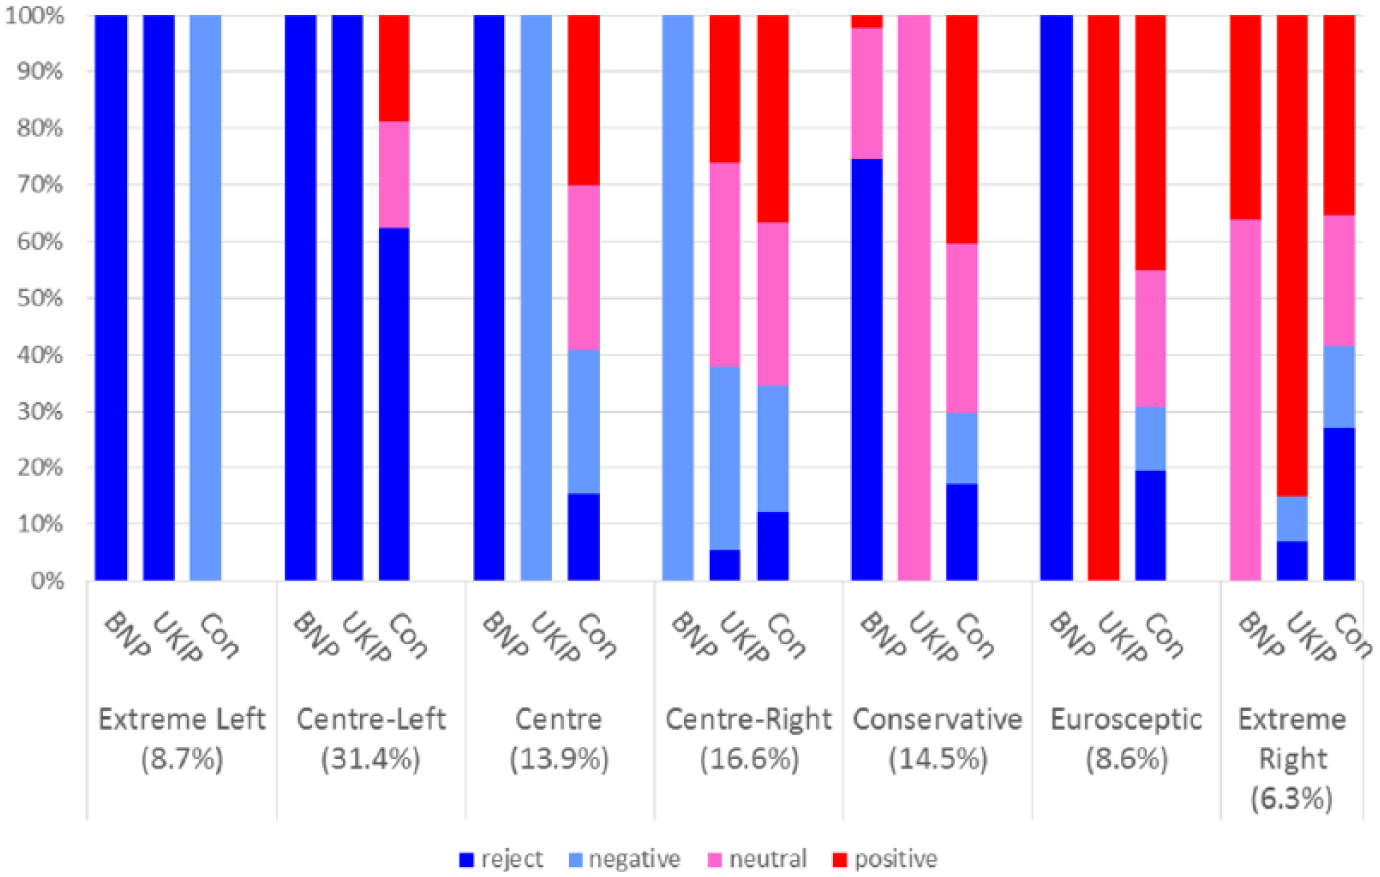
Probability of Party Evaluation by Latent Class Membership, 2015.
The latent classes can be meaningfully labelled – the first class as the ‘Extreme Left’, characterised by joint rejection of all three parties: the probability of rejecting BNP (0) is 0.97 in 2010 and approaches 1.0 in 2015. In fact, in 2015, probability of rejecting both UKIP and BNP approaches 1.0 while giving the Conservatives a negative score (1–3) equally approaches certainty. There is slightly more variation in 2010 but not much. The second class, labelled ‘Centre-Left’, is characterised by large-scale rejection of both UKIP and BNP, while the probability of giving the Conservatives a neutral (4–6) or positive (7–10) score is less than 0.5. The picture becomes more mixed moving through classes 3 (‘Centre’), 4 (‘Centre-Right’) and 5 (‘Conservative’). The probability of giving the Conservatives a neutral or positive score stabilises at 0.6 or higher, while BNP remains largely rejected by the ‘Centre’ and negatively evaluated by the ‘Centre-Right’ and ‘Conservative’ groups.
UKIP received exclusively negative scores by the ‘Centre’ and ‘Centre-Right’ groups and neutral scores by ‘Conservatives’ in 2010, while faring slightly better in the ‘Centre-Right’ class in 2015. BNP fared much better among the sixth and seventh classes, ‘Eurosceptics’ and ‘Extreme Right’ in 2010 than in 2015. In 2010, the odds of BNP being rejected or receiving negative or neutral scores by ‘Eurosceptics’ were roughly even, but in 2015, they were outright rejected. While, furthermore, the probability of positive scores for BNP from the ‘Extreme Right’ class was approaching 1.0 in 2010, it changed to a 0.65 probability of neutral and a 0.35 probability of positive scores in 2015. For UKIP, the ‘Eurosceptic’ group is a secure source of positive evaluations, while the probability of positive scores from the ‘Extreme Right’ class increased from 0.55 in 2010 to 0.85 in 2015.
While the patterns look remarkably similar when comparing 2010 and 2015, the relative sizes of the latent classes differ, in some cases considerably, between the two time points. The three latent classes to the right (‘Conservatives’, ‘Eurosceptics’ and ‘Extreme Right’) have all declined in size by 2015, while the ‘Centre-Right’ and ‘Centre-Left’ groups have both roughly doubled (see percentages reported below each class). The ‘Extreme Left’ class has declined to almost half its size from 2010.
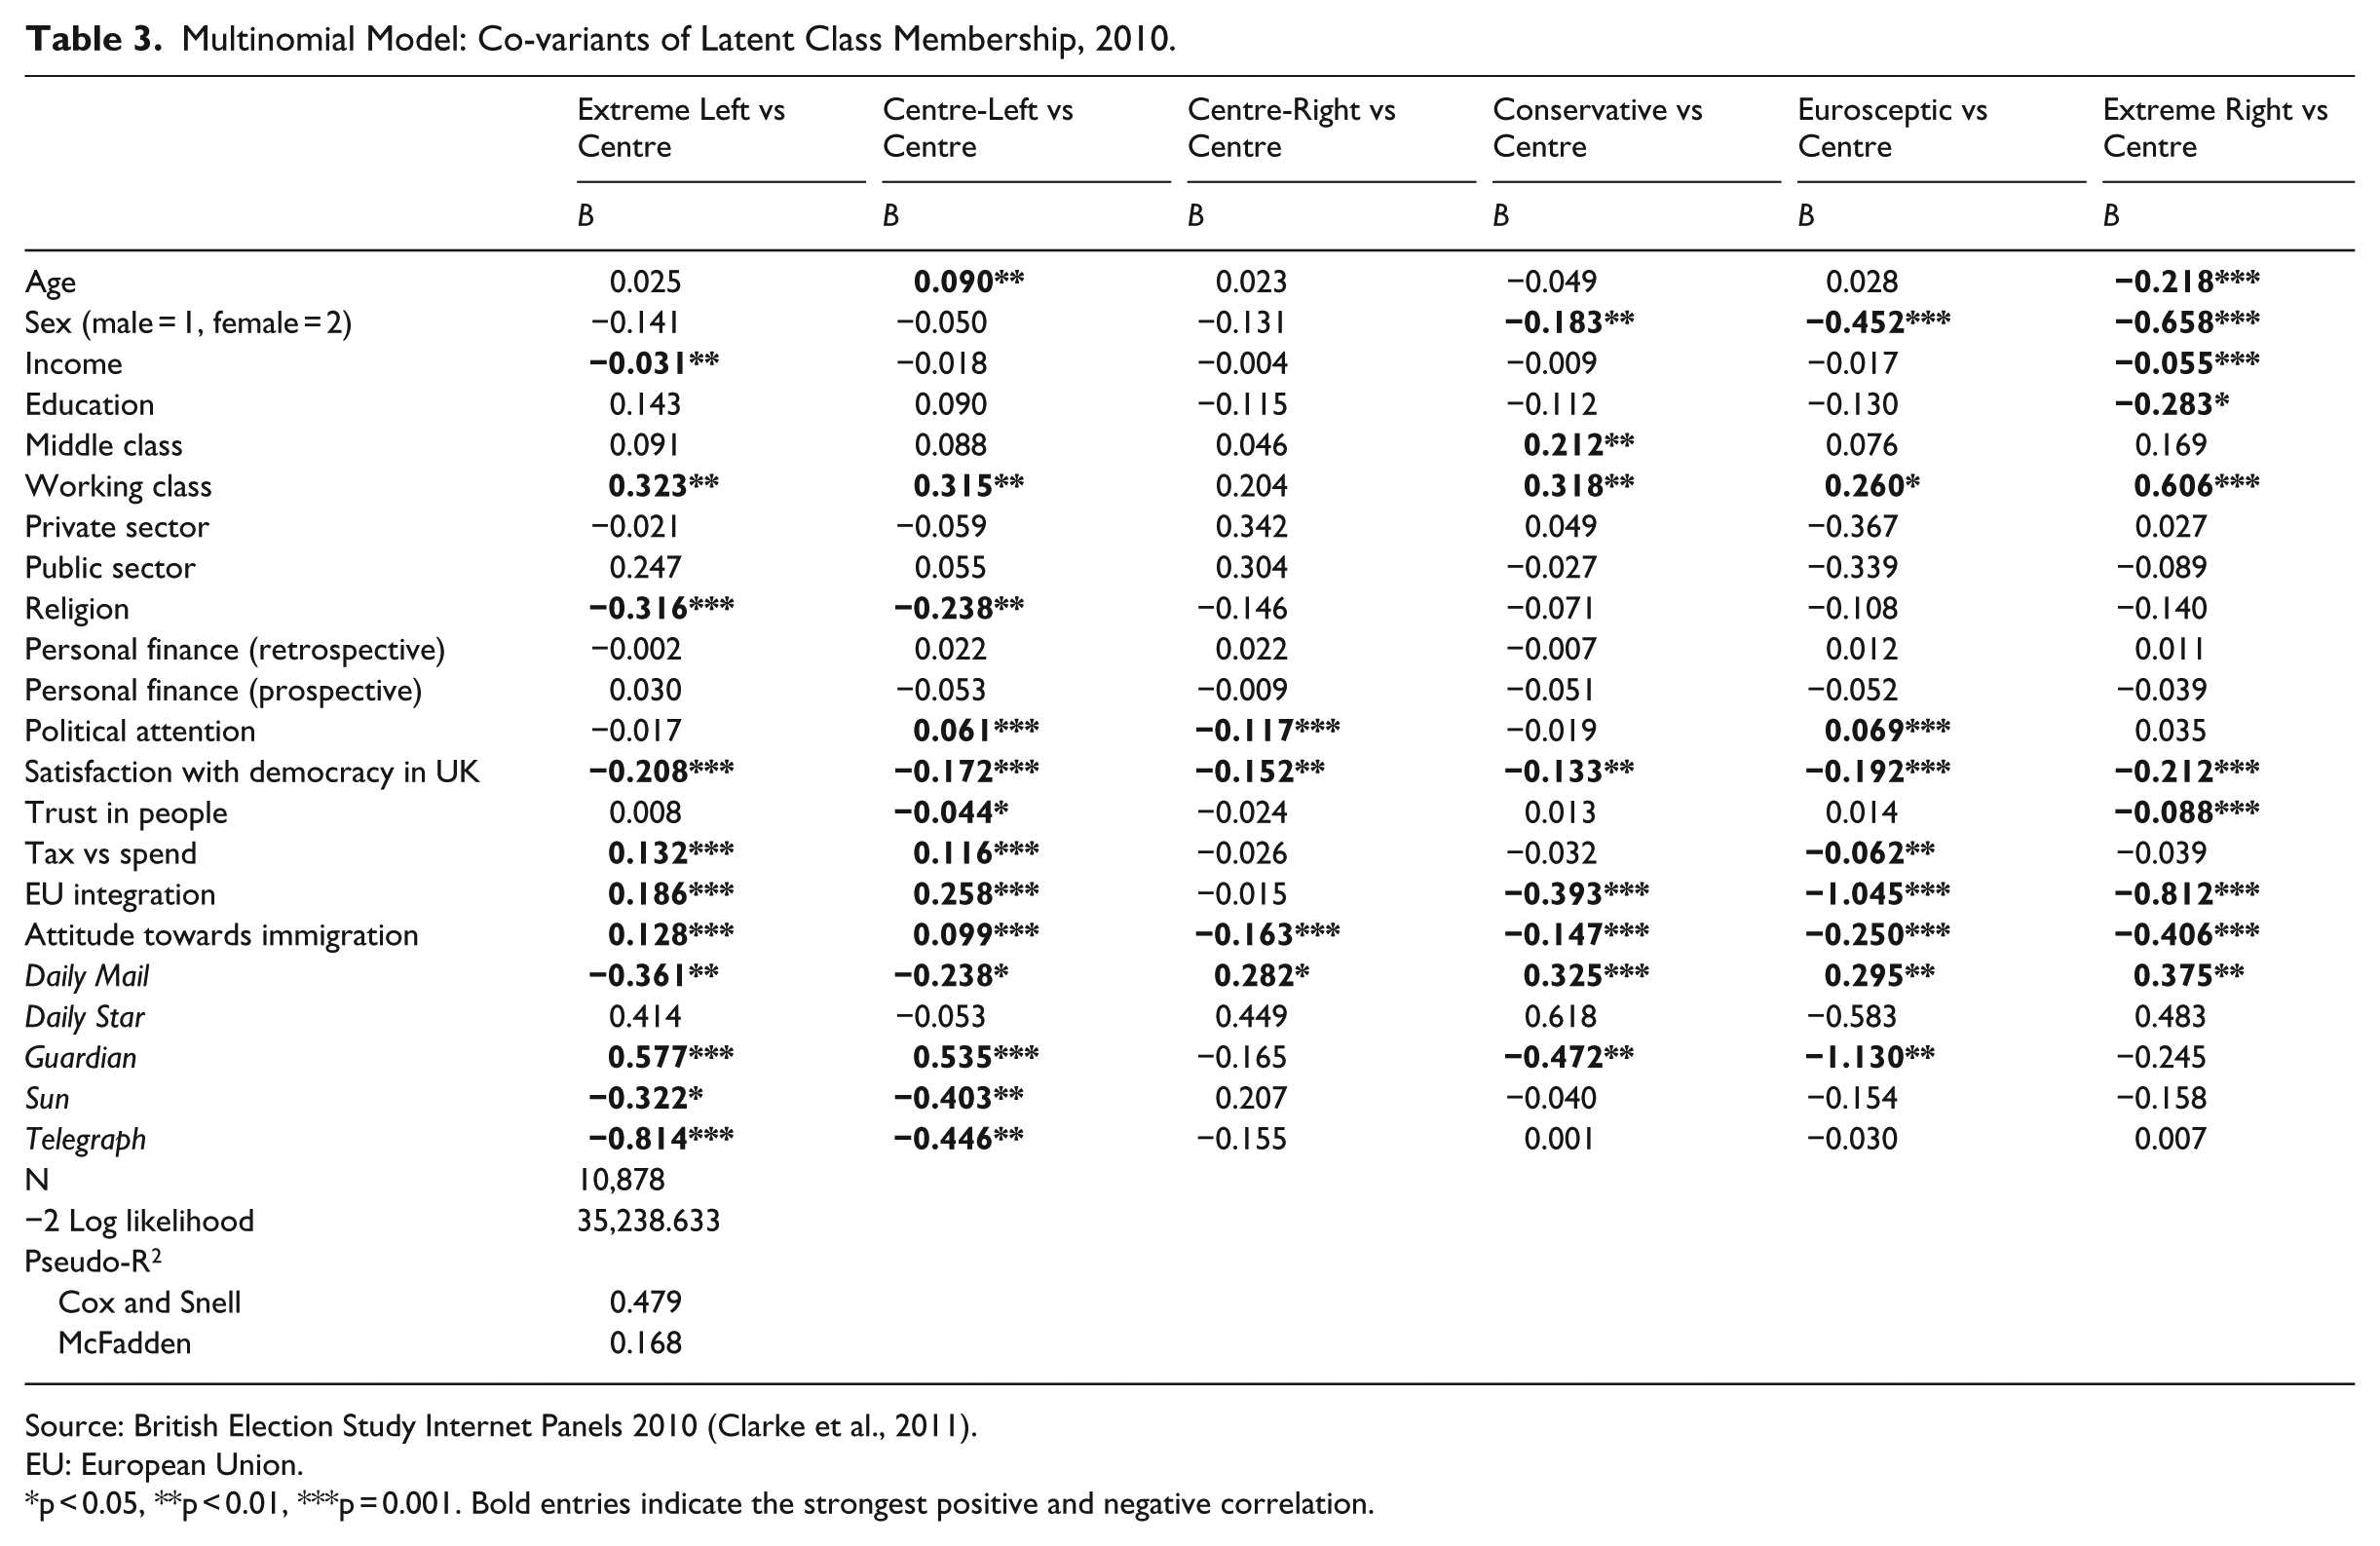
In order to externally validate the substantive meaning of these latent classes, the ‘best index’ variable that LCA creates (an indicator of which latent class is the best match for each individual based on posterior probabilities) is merged back into the 2010 and 2015 BESIP datasets. It can then be estimated how well socio-demographic and attitudinal factors explain latent class membership. Differently put: how much more likely does a certain individual characteristic make it for a respondent to be assigned to one of the seven classes? We ran multinomial regressions, separately for each year, using the ‘Centre’ latent class as the reference category. Tables 3 and 4 report the unstandardised B coefficients from multinomial regressions.
Multinomial Model: Co-variants of Latent Class Membership, 2010.
Source: British Election Study Internet Panels 2010 (Clarke et al., 2011).
EU: European Union.
p < 0.05, **p < 0.01, ***p = 0.001. Bold entries indicate the strongest positive and negative correlation.
Multinomial Model: Co-variants of Latent Class Membership, 2015.

Source: British Election Study Internet Panels 2015 (Fieldhouse et al., 2015).
EU: European Union.
p < 0.05, **p < 0.01, ***p = 0.001. Bold entries indicate the strongest positive and negative correlation.
Age matters little and only insofar as the ‘Extreme Right’ is typically younger. Gender matters much more – the further to the right, the more likely respondents are to be male. Education matters much more in 2015 than in 2010. In the former year, only respondents in the ‘Extreme Right’ group were significantly less likely to have a degree than those in the ‘Centre’. In 2015, almost all other groups, apart from the ‘Extreme Left’, showed lower levels of education than the ‘Centre’. On the other hand, class mattered more in 2010, with the working-class flocking to the extremes – everyone but the ‘Centre-Right’ were more likely to be of working-class background than those in the ‘Centre’. In 2015, this had disappeared. In terms of social composition the now smaller ‘Extreme Left’ group has changed considerably. In 2010, this group was made up by members of the working class, secular and with low incomes. In 2015, it is over-proportionally female, financially well-off (i.e. not significantly different from the ‘Centre’ class which is significantly better off financially than everyone to the right of the spectrum), with high levels of education but low levels of political attention.
Dissatisfaction with democracy is characteristic of those at both extremes in the political spectrum. Our changing economic left-right variables (tax-v-spend in 2010, redistribution scale in 2015) show similar patterns: the two classes on the left are considerably more to the left economically than those in the ‘Centre’, while everyone from the ‘Centre’ to the ‘Extreme Right’ is economically right wing to an almost equal extent. Differences emerge instead with regard to attitudes towards the EU, immigration and, in 2015, authoritarianism. The further to the right, the more extreme respondents are on all of these. Notably, however, anti-European attitudes maximise within the ‘Eurosceptic’ class, while anti-immigration and authoritarian attitudes maximise strongly in the ‘Extreme Right’ class. Newspaper readership is related to latent class membership largely as expected, but it is interesting to note that, in 2015, reading the Sun is increasingly becoming an indicator of being further to the right in the spectrum. The Daily Mail is rejected by ‘Extreme left’ and ‘Centre-Left’, but almost equally likely to be read among all other groups from ‘Centre’ to ‘Extreme Right’.
The model works marginally better in 2015 than in 2010 – but, overall, this nicely confirms the socio-demographic and attitudinal coherence within groups, and the meaningful contrasts between groups, produced by the LCA. It is important to remember that these co-variates were not used in any form to initially identify latent classes; the latter were entirely based on analysis of like–dislike scales vis-à-vis our three parties of interest. But the analysis shows that there is a clear social and attitudinal basis to how party ratings among respondents relate to each other.
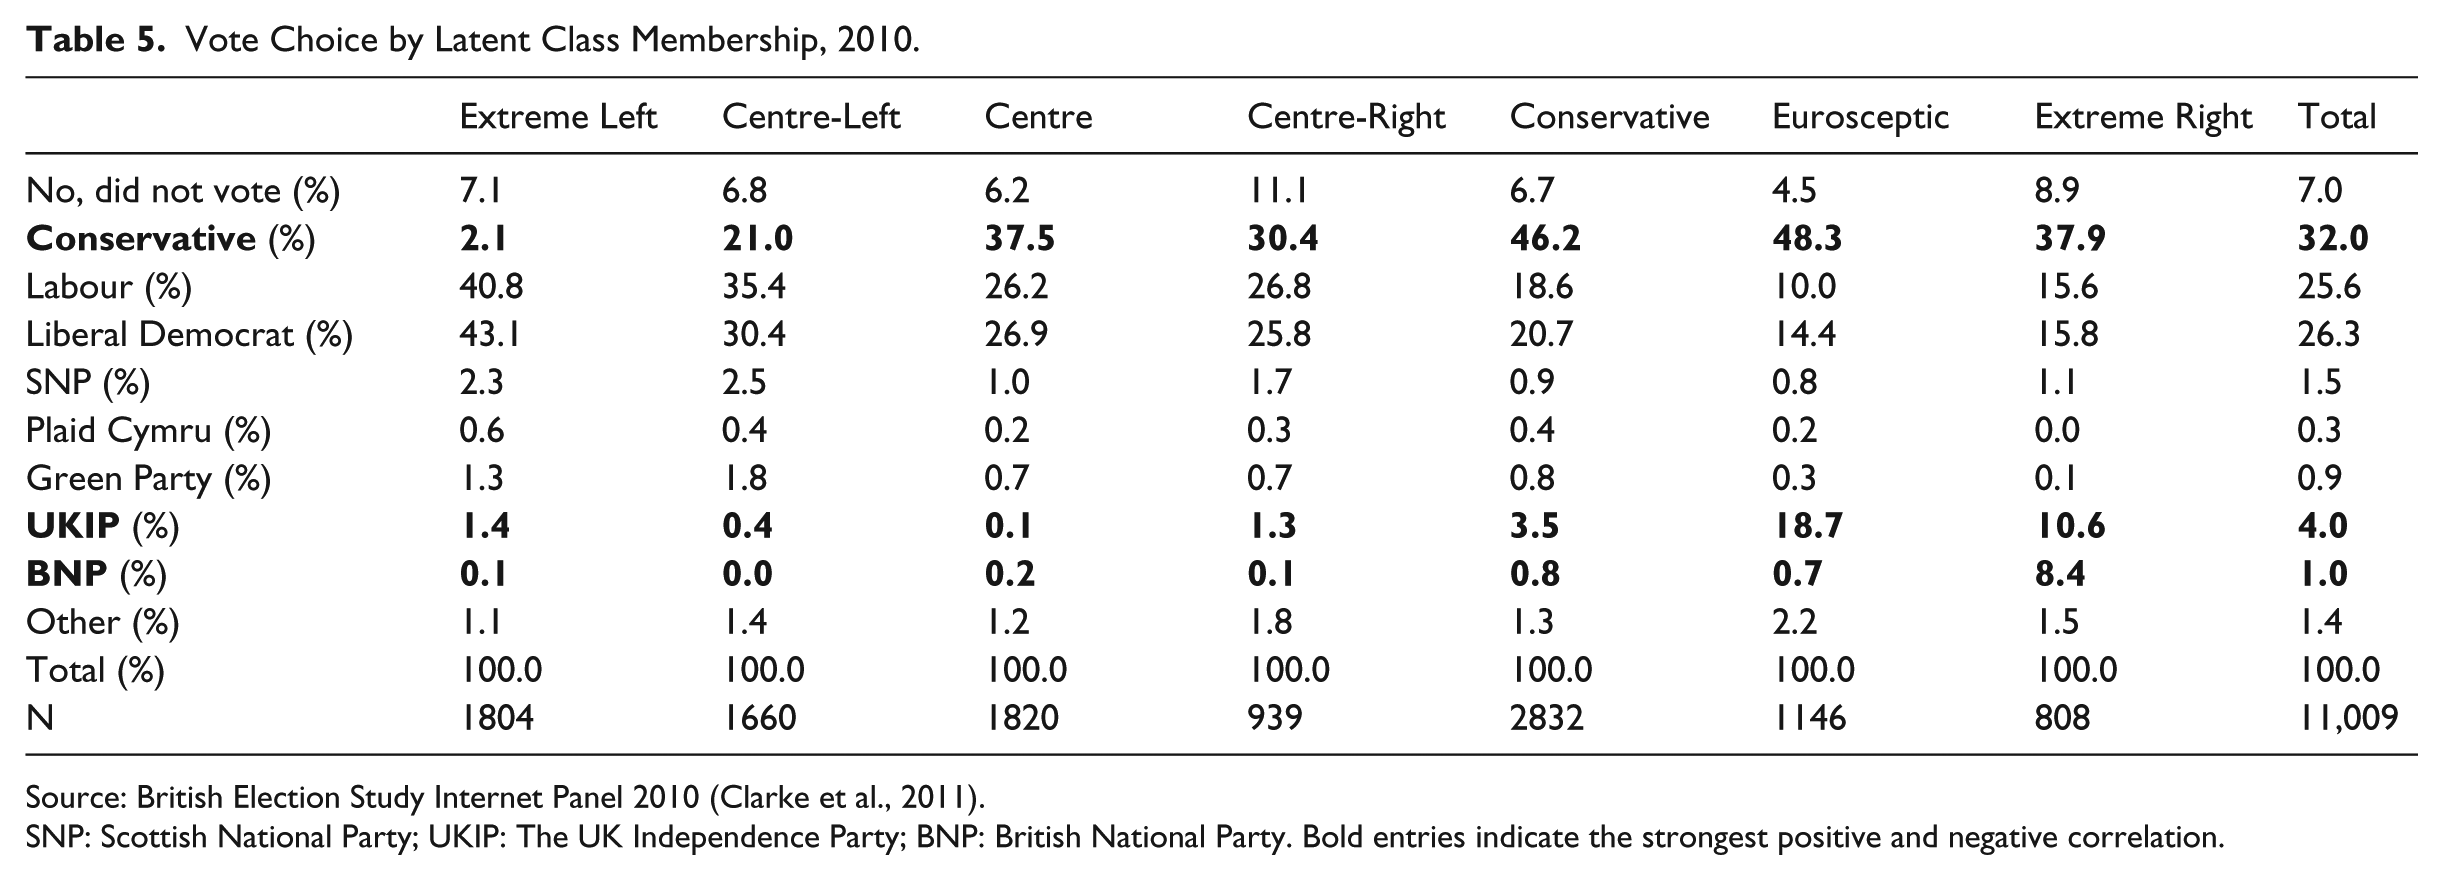
Finally, we can use the LCA ‘best index’ variable to estimate vote shares of all parties across latent classes. And indeed, as can been seen from Tables 5 and 6, voting behaviour has changed considerably in some instances between 2010 and 2015. Not so much in case of the ‘Extreme Left’ class, which continues to reject UKIP, BNP and Conservatives alike at the ballot box. The ‘Centre-Left’ also rejects UKIP and BNP, but the Conservatives come out second or third strongest party in both elections. In 2010, the Conservatives had the largest vote share among all five remaining latent classes from ‘Centre’ to ‘Extreme Right’, while UKIP only gained a serious vote share among ‘Eurosceptic’ and ‘Extreme Right’ voters. In 2015, however, we see how UKIP soars and does so from the Centre-Right group onwards. Among ‘Eurosceptics’ and ‘Extreme Right’, it almost exactly matches the vote share of the Conservative Party. So, while in 2010 having the largest probability (even a certainty) to receive high scores did not translate into largest vote shares for either UKIP among ‘Eurosceptics’ nor for BNP among the ‘Extreme Right’, by 2015 UKIP managed to translate appreciation into votes.
Vote Choice by Latent Class Membership, 2010.
Source: British Election Study Internet Panel 2010 (Clarke et al., 2011).
SNP: Scottish National Party; UKIP: The UK Independence Party; BNP: British National Party. Bold entries indicate the strongest positive and negative correlation.
Vote Choice by Latent Class Membership, 2015.
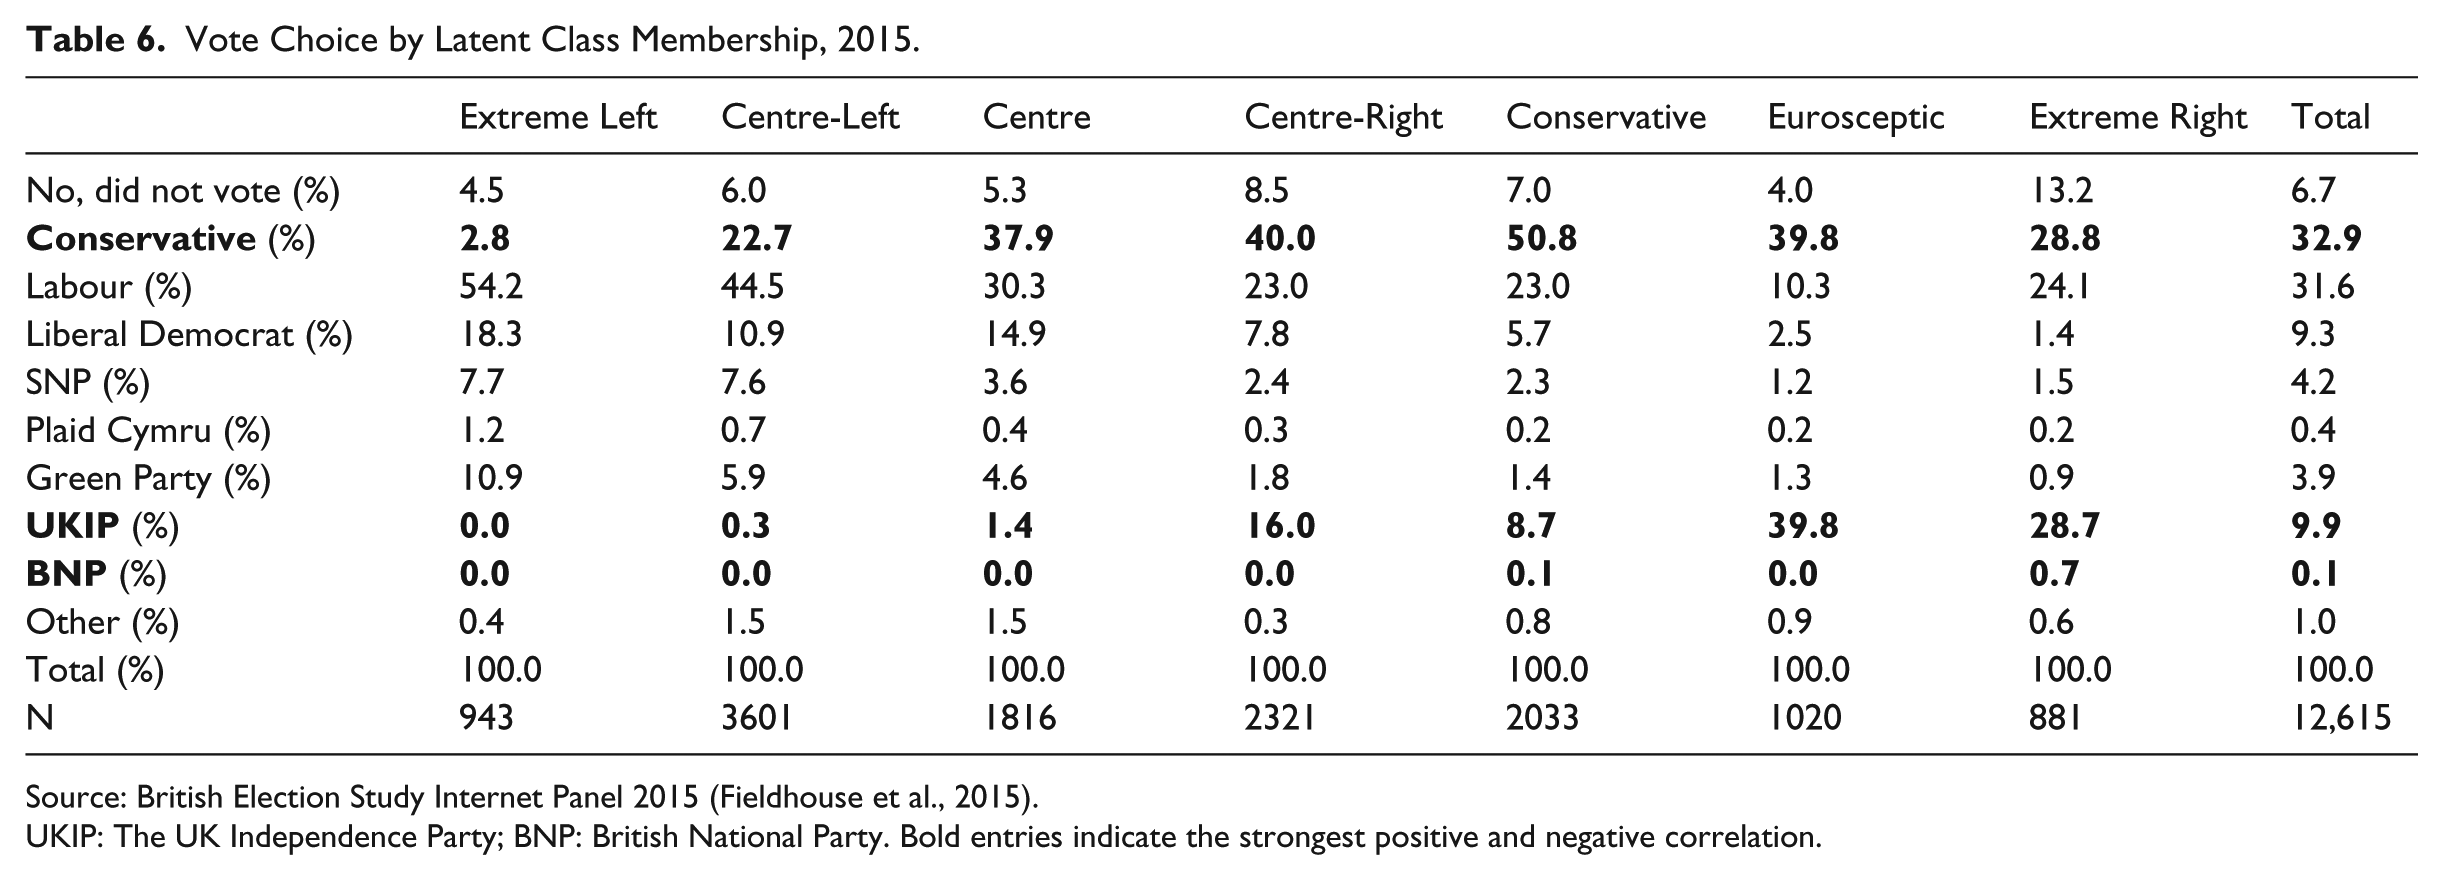
Source: British Election Study Internet Panel 2015 (Fieldhouse et al., 2015).
UKIP: The UK Independence Party; BNP: British National Party. Bold entries indicate the strongest positive and negative correlation.
As was already indicated by the earlier unfolding analysis, UKIP has at the same time become a core electoral option for ‘Extreme Right’ voters, as well as for ‘Eurosceptics’. Both groups already had strong sympathies for UKIP in 2010 but did not yet vote for them in large numbers. By 2015, both groups were equally likely to vote UKIP or Conservative. That is a remarkable finding, indicating the growing reach and electoral competitiveness of UKIP on different fronts. In addition, UKIP made inroads among more traditional Tories not obsessed with the EU, not authoritarian and not strongly anti-immigration. They had established themselves as an alternative centre-right party while having converted many extreme right supporters into voting for them. The picture is, thus, one of remarkable heterogeneity in UKIP support.
One can tentatively go one step further and use the figures from Table 6 to compare the relative importance of the divergent groups (the latent classes) for UKIP’s overall electoral performance. In 2015, the ‘Extreme Right’ contributed about 20% of UKIP voters, while ‘Eurosceptics’ accounted for roughly a third. The rest came from the ‘Conservative’ (14%) and ‘Centre Right’ (30%) classes. This is, indeed, a varied mix which raises important questions about what kind of party UKIP wants to be in the long run. At the extremes, it already emulates the vote share of the Conservative Party, but almost half of the UKIP votes in 2015 came from moderates who remain much more likely to vote Conservative. These centrist classes are much more populated than the ‘Eurosceptics’ and ‘Extreme Right’, and hence, offer more potential for growth. The question then is whether UKIP wants to grow into a mainstream party or solidify its position as the party of choice for the more extreme parts of the electorate. An important additional question will, of course, be what becomes of ‘Eurosceptics’ post-Brexit. They could fall back into the centre-right fold or become more immigration-obsessed – much depends on what ‘Brexit’ will mean in practice.
Conclusion
The research presented above has been guided by three main questions. The first, where UKIP fits into the British party system, was answered with unfolding analysis. The results were not unequivocal. On one hand, UKIP was, by far, the closest party to BNP in both 2010 and 2015. Thus, it is not unreasonable to argue that UKIP has been located at the margins of the British party preference space at both time points. On the other hand, the outreach of UKIP expanded between 2010 and 2015. In the latter year, the party had taken over almost all latent BNP support, but at the same time become much more competitive among Tory and, to a lesser extent, Labour supporters. Thus, while there is a clear element of UKIP having moved towards the mainstream, it has not abandoned the fringes.
The second question was how similar the support patterns of UKIP were in comparison to the European Extreme Right template. Using Tobit regression analysis, the comparison also involved the Conservative Party and BNP. The overall impression is that both BNP and UKIP fit the Extreme Right template rather well, the main difference being social and political integration where UKIP comes across as more mainstream. The Tories also display some similarities to the template, but if the relative strengths of the effects are taken into account, BNP and UKIP display a better fit.
The third question, tackled with LCA, was how UKIP support can be characterised. The results here are complex, but, in essence, they reinforce the indications provided by the unfolding analysis, namely that UKIP draws on two main sources of support: one quite extreme with the closest links to BNP and one more moderately Eurosceptic, closer to the Conservatives. In both 2010 and 2015, the biggest contribution to UKIP voting comes from the ‘Eurosceptic’ class, ahead of the ‘Extreme Right’. Of course, UKIP support is more diverse than that, with sizeable minority contributions from the ‘Conservative’ and, in 2015 especially, ‘Centre-Right’ classes. Still, the most appropriate summary is that UKIP support is primarily a mix of non-extreme Euroscepticism and more extreme right-wing radicalism.
Perhaps surprisingly, our analysis does not seem to show UKIP in direct competition with Labour. Ford and Goodwin (2014, 2016) argue that the growth of UKIP in the 2010s to a significant extent was the consequence of disillusioned working-class voters abandoning Labour. Evans and Mellon (2016a, 2016b) disagree, arguing that the disgruntled working-class voters had abandoned Labour before UKIP was a serious political force (Evans and Mellon, 2016a: 477), and that the second preferences of UKIP supporters place the Tories well ahead of Labour (Evans and Mellon, 2016b: 494f). Our findings lend more support to Evans and Mellon; the unfolding analysis shows UKIP and Labour far apart in the preference orders of most respondents. The contrast to the Conservative Party is striking. This does not necessarily mean that UKIP has not taken Labour support. Rather, in line with Evans and Mellon, it seems that the shift from the Conservatives to UKIP is a comparatively smooth process, where some feelings remain for the former favourite party, but that the shift from Labour to UKIP seems conflictual, breeding resentment towards the previously preferred party. It may also be a longer process, with moves to other parties, or abstention, between departure from Labour and arrival at UKIP.
Thus, the classification of UKIP is far from straightforward. There are elements of radicalism and also with more mainstream right-of-centre traits. Arguably, the latter dominate. If BNP is the sole point of reference, the near consensus in the literature about UKIP being a non-extreme party is supported. This said, there are also links to BNP. These should not be overstated, but nor are they trivial. If, furthermore, the frame of reference is extended, parallels can be detected with at least some members of the broader European extreme right party family. The impact of immigration on UKIP support is unequivocal, in 2015, close to that of BNP (see Figures 3 and 4). The most striking difference to BNP, social and political integration, does not make UKIP distinctive from several other European extreme right parties.
The argument is not that UKIP can be conclusively classified as extreme right. For that, more comparative research is needed. But while not straightforwardly extreme, nor is UKIP straightforwardly mainstream. As shown by the unfolding and LCA, the position of UKIP in the British party system can be described as a link between the mainstream and the extreme. This makes UKIP distinctive from other British parties, a distinctiveness with parallels to the positions of anti-establishment, EU sceptical and immigration-critical parties elsewhere in Europe. These parallels are hardly negated by the distinctiveness from the now almost defunct BNP.
Footnotes
Funding
The author(s) received no financial support for the research, authorship and/or publication of this article.
Supplementary Information
Additional supplementary information may be found with the online version of this article.
Appendix S1: Details of variables used in the multivariate analysis Appendix S2: Tobit regression – explaining feelings towards Conservatives, UKIP and BNP, 2010 Appendix S3: Tobit regression – explaining feelings towards Conservatives, UKIP and BNP, 2015
Notes
Author Biographies
 ).
).
References
Supplementary Material
Please find the following supplemental material available below.
For Open Access articles published under a Creative Commons License, all supplemental material carries the same license as the article it is associated with.
For non-Open Access articles published, all supplemental material carries a non-exclusive license, and permission requests for re-use of supplemental material or any part of supplemental material shall be sent directly to the copyright owner as specified in the copyright notice associated with the article.
