
Abstract
There is a substantial literature on the impact of having voting for an electorally victorious party on individual voters’ satisfaction with democracy. Yet, there have been few evaluations as to temporally salient are elections to the satisfaction levels for those who voted for a “winning” party and those who voted for a “losing” party. Using rounds 1–8 of the European Social Surveys, I find evidence from 92 elections in 27 European countries that both the levels of and the difference between satisfaction levels of “winners” and “losers” do not attenuate quickly but rather last almost 5 years. That is, it appears that “winners” are more satisfied with democracy and stay that way. While this confirms earlier, smaller studies, the absence of a causal connection between the time from election and satisfaction levels poses a significant challenge to the current literature about the electoral mechanism of this relationship.
Introduction
Citizens may respond to the outcome of a national election with feelings of euphoria or sadness predicated largely on whether their preferred party won or not. Such feelings may extend to the electoral process itself. These responses to electoral outcomes are prominent in the literature on individuals’ satisfaction with democracy. This literature consistently finds that citizens who voted for the winning party in the last election—commonly referred to as “winners” in the literature—report higher levels of satisfaction with national democracy than those who voted for a party that did not enter the governing coalition—commonly, if unpleasantly, referred to as “losers.” And while a great deal of attention has been given to potential mechanisms linking electoral outcomes to individuals’ satisfaction with democracy, the duration of the electoral effect on satisfaction has thus far escaped broad international investigation.
To test the duration of this effect, I identified “winners” and “losers” for each election using the European Social Survey (ESS; Rounds 1–8) to produce 161,489 individual observations following 92 elections in 27 European countries over the period of 2002–2017. 1 Exploiting the survey completion dates available in these data, I precisely measure the time elapsed between previous elections and respondents’ satisfaction levels and thus estimate the duration of electoral salience on voters’ satisfaction levels. I find that both the levels of and the difference between satisfaction levels of “winners” and “losers” do not attenuate quickly but rather last almost 5 years (more than 1750 days). While these findings serve to confirm the previously observed durability of this difference in satisfaction (see Dahlberg and Linde, 2017), I further exploit the “as if” random interview dates as a causal identification strategy to show that time does not causally affect levels of satisfaction with democracy for winners (and losers) after an election.
The finding that winners’ (and losers’) levels of satisfaction, and the gap between them, are quite durable is a challenge to the literature. In particular, this suggests that voters’ satisfaction levels are less responsive to electoral outcomes than previously assumed. If electoral outcomes are not the primary origin of satisfaction in the post-election period, having voted for a winning (or losing) party may just be a smaller part of a larger, unexamined link between individuals’ satisfaction with democracy and elections. In search of potential solutions, I draw from existing work to propose two directions in which theory may seek to improve our conceptualization of the relationship between individuals’ attitudinal responses to electoral outcomes. The first is to place “winning” in the larger political experience of voters. The second is to take more seriously the experience of losing, in particular, the experience of serial losing.
The Satisfaction Gap: Winners and Losers
We know that a potent source of individuals’ satisfaction with democracy has been theorized to originate directly from a primary activity of democracy, elections. The literature on the determinants of citizens’ democratic satisfaction is substantial and includes the extent individuals are supporters of the winners or losers of recent elections (Blais and Gélineau, 2007; Singh et al., 2012; Van der Meer and Steenvoorden, 2018). The foundational article for this literature demonstrated that, in Western Europe, winners of democratic competition show higher levels of satisfaction than do those in the losing minority (Anderson and Guillory, 1997). Works building on this tradition have searched for mediating effects at the individual level and have found that, for example, the intensity of winning—in which “optimal victory winners” derive greater enjoyment as first preference party choice (vs strategic voting)—increases this impact of victory on satisfaction (Singh, 2014). Among losers, previous experience of victory attenuated dissatisfaction with democracy and ideological proximity to the current government increased political support (“quasi-winners,” Curini et al., 2012; Kim, 2009; Mayne and Hakhverdian, 2017). While these works have sought to identify potential mechanisms of the relationship between electoral choices in the previous election and satisfaction levels, investigations into the how long this “winning” effect lasts are sparse.
Previous work has identified gaps in satisfaction over time, yet do not explicitly theorize on the dynamic elements of such observations. Anderson et al. (2005) identify a stable gap between winners and losers in the United Kingdom, Germany, and Spain and attribute this to the disappointing impact of losing, rather than winning, in an election. Using data from Canada, Blais and Gélineau (2007) compare the satisfaction gap across elections (pre/post) to show that, previous to the election, winners were already more satisfied and simply enjoyed a greater post-electoral boost than losers (similar to Van der Meer and Steenvoorden, 2018, using Dutch panel data over a single election). Dahlberg and Linde (2017) use four panels of Swedish electoral data to show that the difference in satisfaction levels between winners and losers is stable over time. They are also the most explicit in developing hypotheses to investigate the durability of the satisfaction gap. They assert the “stability hypothesis” in which winning (and losing) is not a temporary experience of disappointment but a lasting experience (Dahlberg and Linde, 2017: 628) and the “rational response hypothesis” in which the satisfaction gap will converge (Dahlberg and Linde, 2017: 629). They find strong evidence for their stability hypothesis and attribute the durability of the difference in satisfaction levels to an unobserved process beyond discrete elections.
At the same time, research on related political attributes and attitudes suggest that any post-electoral boost to individuals’ orientations to politics is likely to be brief. Individuals’ satisfaction with other outputs of government appears to wane over time (e.g. US Supreme Court decisions, Gibson and Nelson, 2015). The electoral boost of elections on partisanship, as another example, has been shown to be a short-lived phenomenon (Singh and Thornton, 2018). And while satisfaction is not partisanship, one might expect that any downstream attitudes to partisanship—such as satisfaction with democracy—would be likely to resonate diminishing partisanship. Earlier work leads us to suspect that those who voted for the incumbent government tend to become more disillusioned with the incumbent government over time (“coalition of minorities,” Mueller, 1970). And like partisanship, it is not difficult to imagine that this disillusionment might spill over (negatively) into satisfaction. Our own intuition suggests that the “thrill of victory,” the short-run emotional impact of winning, gives way to the rough and tumble of intra-electoral politics as well as the expectations surrounding the next elections in which one’s preferred parties’ electoral circumstances could change. Thus, and similar to Dahlberg and Linde (2017), this leaves us with competing—if not formal—expectations about the duration of the impact of electoral outcomes on winner and losers’ satisfaction with democracy.
Methodology
To directly test the duration of party vote on individuals’ levels of satisfaction with democracy, I merged Rounds 1–8 (run biennially from 2002 to 2016) of the ESS (2019). 2 There are three variables crucial to this investigation: (1) which party did the respondent vote for in the previous election, (2) their level of satisfaction with democracy, and (3) how much time has elapsed between having voted and being asked about their satisfaction.
To measure the first, I match individuals’ most recent vote in national parliamentary elections with the party composition in government following each election (Comparative Political Data Set (CPDS), Armingeon et al., 2018). 3 For any theory of “winning” and satisfaction, the mechanism is voting. Therefore, in this analysis, “winners” are those who voted for parties in the governing coalition, and “losers” are those who (1) reported voting and (2) voted for a party that was not in the subsequent governing coalition. 4 While this does not address any possible variation associated with, for example, abstaining, it does provide the essential theoretical mechanism by clearly specifying individuals’ vote decisions.
I note that attaching winning and losing to each individual was, in the vast majority of cases, straightforward. Two conditions required additional effort. One was addressing “between election composition changes” to governing coalitions, for example, the change to a caretaker government, coalition dissolution, or realignments. That is, government composition between elections realigns which respondents are winners and losers. When this fell between survey waves, winners and losers were updated to reflect this change in coalitional participation status (this coding choice is revisited in the Discussion). The second case was the rare limitation of the ESS such that mainstream parties were not included on party lists from which respondents could choose. Excluding these cases does not change the results (see the Online Appendix, Table 4, Model 2).
I also keep with the literature by including “ideological” winners (also referred to as “quasi-winners”). These are voters who did not vote for a winning party but have ideological proximity to the current government (see the Online Appendix, Table 3). Matching these provides some ideological congruence between voters and current government composition as well as policy positions (Kim, 2009). I grouped individuals’ self-reported ideological positions into three categories (0–3: Left; 4–6: Center; 7–10: Right) and matched them to CPDS Government Position: “Hegemony of left parties” and “Dominance of left parties”; “Balance of power between left and right”; and “Dominance of right/center parties” and “Hegemony of right/center parties.” This produces 71,614 “winners,” 20,879 “quasi-/ideological winners,” and 68,996 “losers.”
Second, for the dependent variable—satisfaction with democracy—I use the survey question, “And on the whole, how satisfied are you with the way democracy works in [country]?” (Anderson, 2005). Citizens’ satisfaction with democracy is an important measure of national-level democracy. While some have argued that citizens’ satisfaction with democracy problematically takes on several facets of the relationship between citizens and government (Linde and Ekman, 2003; also Canache et al., 2001), Anderson (2005) emphasizes how citizens’ orientations to and subsequent evaluations of their (own) democracy must correspond to what they consider to be “democratic” (Easton, 1975). This includes, in Estonian language, both diffuse (what an object is or represents) and specific (what a system produces) support. The former is the generic and positive orientation to the democratic process (i.e. “I like democracy”), whereas specific support is an “experiential,” performance assessment (i.e. “I like my democracy”). Both are meaningful and very often correlated and, as Anderson (2005: 4) points out, “the object of a citizen’s support does not have to be—and probably cannot be—reliably separated in terms of the system and the system’s outputs.” Satisfaction with democracy is normally distributed, with a range of 0 “very dissatisfied” to 10 “very satisfied,” with a mean of 5.41 (SD: 2.41). I also note that although the impact of survey timing on survey responses within the electoral cycle has been argued to be potentially problematic (Banducci and Stevens, 2015), individuals’ satisfaction is not included in the survey elements affected.
For the third key variable, we need to measure the duration of the effect of “winning” on respondents’ satisfaction levels. To do so, I exploit the dates of survey completion date included in the ESS surveys by country interview teams. I add that while the ESS releases its data by “round” and associated year, the survey completion dates can be drawn from observations in other, albeit proximate, years. The time elapsed is simply the number of days between the previous election in the respondent’s country and the date that respondent completed survey with a mean of 752 days (SD: 450). 5
In addition to these key variables, the standard model for explaining variation in individuals’ satisfaction with democracy is a multi-level model with both individual- and macro-level variables determining individual satisfaction levels. Experiences with democratic institutions play an important role (Rohrschneider, 1999, 2005) and I use an additive indicator of the number of “democratic activities” including saying “yes” to contacting a politician or government official, working in political party or action group, working in another organization or association, wearing or displaying campaign badge/sticker, signing petitions, or taking part in lawful public demonstration in the last 12 months (N = 6; α: 0.630). For “outputs of democratic institutions” such as its capacity for managing both the national economy and its effects on personal economic conditions (Lewis-Beck, 1986), and “the problem-solving capabilities of democracy” (Sarsfield and Echegaray, 2006: 169), I use the question, “On the whole how satisfied are you with the present state of the economy in country?” Socio-demographic and socio-economic controls for gender, age, education, and income are also included.
To account for cross-national variation, I include determinants of variation in satisfaction with democracy at the macro-level model. This includes yearly data from the World Bank for gross domestic product (GDP) per capita growth an additive variable for government performance from the Worldwide Governance Indicators (2017), and an age of democracy (from 2016). Finally, I include a set of dummy variables for the trifold distinction of single-member/simple plurality (reference case), modified proportional representation, and proportional representation systems (Aarts and Thomassen, 2008; Anderson and Guillory, 1997). I also include a post-Communist dummy variable as citizens’ satisfaction with democracy is higher in well-established democracies for both winners and losers (Birch, 2008; Singh et al., 2012), a function of the longer history of the peaceful transition of power (Norris, 2018; see also Chang et al., 2014; Moehler and Lindberg, 2009). All variables and their descriptions can be found in Appendix 1.
Having specified the individual- and macro-level model as completely as is possible, we are able to analyze 161,489 individual-level observations following 92 elections across 27 European countries from 2002 to 2017. The resultant three-level model (individuals in elections in countries) is a random intercept/fixed slope model. Individual-level variation is fixed across elections and elections within countries but election and country means are allowed to vary by the included macro-level variables.
Results
Table 1 presents the three-level models showing the effect of winning on satisfaction (Model 1), the individual-level model (Model 2), and the fully specified model (Model 3). The observed differentiating effect on one’s level of satisfaction with democracy of winning—that is, having voting for one of the winning parties in the national parliamentary—confirms the previous literature. Winners provide higher levels of satisfaction with democracy than those who voted for parties that did not become part of the governing coalition in parliament.
Satisfaction with Democracy: Time from Election.

Source: European Social Survey, Waves 1–8; coefficient (t scores).
GDP: gross domestic product.
Bold: *p < 0.05; **p < 0.01; ***p < 0.001.
Crucially, the time from the election to the date of the survey does not appear to have a statistically significant effect on satisfaction levels. Neither is the interaction between this measure and “winning” significant. The marginal effects for this interaction (Figure 1) show that not only do winners have statistically significant higher levels of satisfaction with democracy than losers but also that the gap is durable over time. Although slightly decreasing over time, the pattern in Figure 1 shows that the gap between winners and losers satisfaction levels is stable both in level and over time. More precisely, winners have statistically higher satisfaction levels than losers for more than 1750 days, or roughly 4.5 years with no statistically significant effect for time. These results initially appear to support the notion of a durable impact of electoral outcomes on individuals’ levels of satisfaction with democracy.
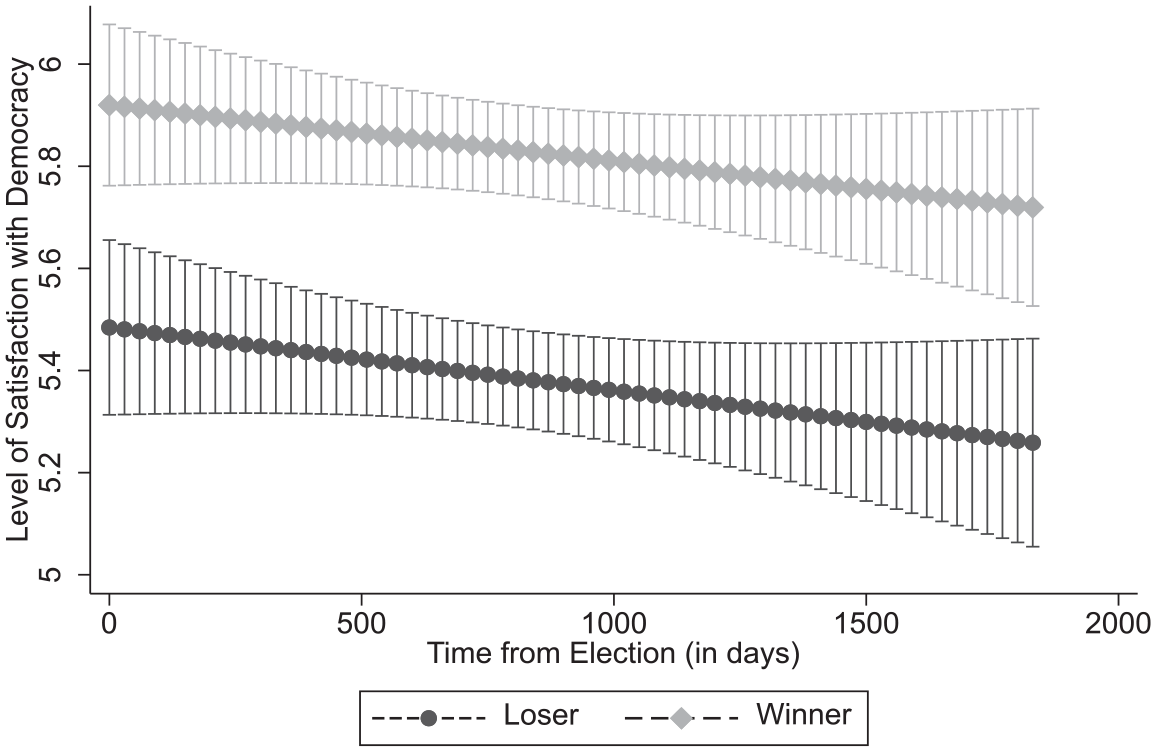
Duration of Satisfaction with Democracy.
Robustness
Central to the literature, individuals’ satisfaction with democracy can also be sensitive to variations in economic performance. Support for incumbent democratic governments can often be explained by sociotropic economic issues and the perception of government economic performance (see also Anderson, 1998; Kinder and Roderick Kiewiet, 1981). More recent work suggests that economic performance may be less important than the performance of democratic institutions themselves. Using aggregated time-series data (Eurobarometers: 1990–2000), Wagner et al. (2009) examine time-varying economic factors and institutional quality determine the macro-trends of satisfaction with democracy in Europe. Controlling for a wide array of economic and political measures, 6 they find that political institutional capabilities (rule of law, lower corruption, a smaller shadow economy, less regulated political executive recruitment, less regulation of political participation, and better checks and balances) move with higher degrees of satisfaction with democracy (in the aggregate). I interact the main interaction—the time from election and winner dummy—with national performance variables, including both Government Performance and GDP per capita (see Table 2, Models 1 and 2). For the “economic” model, I also added other macro-economic performance variables including the Gini Index of income inequality and measures of both inflation and unemployment rates. For each of the above estimations, the statistical significances for “winner” satisfaction, days from elections, and their interaction remain the same as the main model.
Satisfaction with Democracy: Time from Election—Robustness.

Source: European Social Survey Waves 1–8; coefficient (t scores).
GDP: gross domestic product.
Bold: *p < 0.05; **p < 0.01; ***p < 0.001.
Second, although secondary to the study here and far from a comprehensive examination, I confront the idea that winning may be part of a larger experience that takes place between voter and the electoral process. The winner/loser satisfaction hypothesis is based on actual voting for a party and potentially an even stronger partisan attachment evident from having made the effort to turn out and “pull the lever” for their preferred party. It is plausible that such active partisanship may differ from the passive identification with particular parties (Bankert et al., 2017; Barnes et al., 1979). Thus, winning or losing at election time becomes a direct—even emotional—experience with the political process, providing citizens a concrete, personal result as well as a perception of how electoral institutions function. If the mechanism that engenders satisfaction with democracy for winners is policy- or performance-based, we would expect that singling out voters who change from winner to loser or loser to winner between elections would produce significant change—negative or positive, respectively—in their satisfaction levels. If, on the other hand, the mechanism of “winning” the election is affective or emotional (i.e. the thrill of victory), then these groups should show produce no significant effect; that is, between election realignments do not generate the euphoria or sadness of “election night.”
To provide some preliminary evidence to this question, I re-estimate the final model with dummy variables for each group of “between election” winners and loser and find no significant deviation from the overall model (Table 2, Model 3). That is, switching from an electoral winner or loser (or vice versa) between elections does not appear to have an effect on levels of satisfaction. Again, these “legislature winners and loser” are a secondary to this investigation as the actual number of these is quite low (new losers, N = 685; new winners, N = 997) and this does not constitute comprehensive test. However, as a potential piece of the puzzle, it does indicate that the impact of winning on satisfaction with democracy might be related to an emotive facet of elections that comprise a larger process. That is, the process of winning may need greater individual context—with particular attention to the emotive impact of outcomes and role of individuals’ expectations about future electoral outcomes.
Third, the operationalization of the key individual- and national-level variables used here correspond to the literature and the results are robust to different modeling strategies. However, in broadening the study of satisfaction to a wide array of countries and times, some limitations are inevitable. I was unable to find a satisfactory measure for individuals’ normative attachments to democracy as a system of governance (Anderson and Tverdova, 2003). While several proxies were tried, they were ultimately excluded to avoid the conceptual stretch necessary to include them (see Online Appendix, Table 4, Model 3).
Finally, while the durability of this satisfaction gap is long, I have not accounted for the time period between the election and the formation of the new government. While reasonable expectations about a party’s potential membership in the subsequent governing coalition can often be made by citizens given the electoral outcomes (Van der Meer and Steenvoorden, 2018), the final membership of the governing coalition is not complete until it is. Based on the timing of coalition formation (Martin and Vanberg, 2003) and availability of recent data (Andersson et al., 2019), 7 the mean time for government formation in the EU-28 member states is between 30 and 40 days. For the 161,489 respondents included in the analysis here, those with elapsed time between election and interview of 30 days (60 days) represent less than 1.3% (3.1%) of the entire sample. Dropping these groups from the estimation does not change the results (see Online Appendix, Table 4, Models 4 and 5).
Confronting the Identifying Assumption
The ESS survey series was chosen for the availability of interview completion dates as well as attention to the survey specification and sampling methodology. Crucial to the analysis here, the ESS data are designed—and assumed—to be randomly sampled. The ESS guidelines insist on, among a number of other key principles, “Individuals are selected by strict random probability methods at every stage” and “Quota sampling is not permitted at any stage.” 8 Exploiting the “as if” random nature of interview dates in surveys not only limits omitted variable bias but, more importantly, can serve as a causal identification strategy. The intuition is that because interviewing dates are “as if” random, we can use them to evaluate the causal effect of time between election and interview, assuming that all of the things that happen between election and interview are nearly constant for respondents of the same country-year (Munoz et al., 2019).
I provide an explicit test of the identifying assumption of random assignment. As Singh and Thornton (2018: 4) point out, it is crucial to assess the plausibility of this identifying assumption; that is, to determine whether the treatment process requires control for potential confounders. To test the validity of the assumption that time between election and interview is sufficiently random, a regression including the time elapsed between election and interview should—at a minimum—include any controls for potential confounders or, ideally, show that the time elapsed between election and interview do not correlate with potentially related variables. Therefore, I have regressed potential variables most likely to correlate with the time elapsed between election and interview available in the ESS data set. These include a set of socio-economic variables (gender, age, education level, and income), respondents’ level of political interest, and year. As the ESS data are assumed to be random samples at the country level, I have run these by country.
A set of 29 coefficient plots help us identify any significant results (see the Online Appendix, Figure 8(a)–(g)). In terms of reasonably coordinated statistically significant findings, there are almost no significant findings for the individual-level socio-economic variables. However, in Austria, Spain, and Hungary, those who report being more interested in politics are slightly more likely to be interviewed earlier than other levels of political interest. 9 To account for this, I estimated two models: the main model presented in the article controlling for political interest (as the socio-demographic variables are already included, Table 3, Model 2) and the main model presented in the article excluding Austria, Spain, and Hungary (Table 3, Model 3). The results of the main model are unchanged (Model 1 is the main model for reference).
Satisfaction with Democracy and Time from Election: Exclusions.

Source: European Social Survey 2002–2016.
GDP: gross domestic product.
Bold: *p < 0.05; **p < 0.01; ***p < 0.001.
We can conclude that the ESS interview timing is “as if” random and we are able to corroborate the validity of the identifying assumption and offset the obvious threats to validity. Thus, the time from elections appears to have no causal impact on satisfaction levels. That is, winners are more satisfied than losers and stay that way. This challenges the expectation that winners’ satisfaction levels retreat from their post-electoral high. If this is in fact the case, this challenges the expectation that winners’ satisfaction levels retreat from their post-electoral high. It would also force us to confront the central mechanism of this literature, namely, how elections affect individuals’ levels of satisfaction with democracy.
Discussion
The literature has a well-developed theoretical understanding of the electoral effects of “winning” on individuals’ satisfaction levels. It does not however provide an intuition for the durability of winners’ and losers’ satisfaction with democracy. Previous work by Dahlberg and Linde (2017: 638) provide an excellent guide for beginning to examine this durability; however, they ultimately do not theorize for why we observe such stability other than to suggest that it most likely represents a “. . . long-lasting aspect of how voters regard the functioning of the democratic system.” In other words, they conclude that the stability of winners’ satisfaction and the gap with losers’ satisfaction reflects a deeper orientation to the functioning of democracy than a direct relation to discrete electoral outcomes. The results here appear to align with this and extend the challenge to existing theories to reconsider on what we think winning (and losing) means to citizens. This offers an opportunity for theory building.
I propose two directions in which a theory seeking to explain this durability might best proceed. First is a revised theory of the effect of “winning.” Work in political psychology has suggested that having voted for an electorally successful party is not an isolated political experience. Research has shown that while having supported a party that won is important, citizens with stronger ideological affiliations with their party (Curini et al., 2012), greater alignment with the party’s goals (Plescia, 2019), or citizens who voted for their party with more confidence (Van der Meer and Steenvoorden, 2018) are likely to derive more from the winning experience. That is, winning is one facet of a deeper attachment between parties and their constituents and, subsequently, the relationship between elections and voters’ satisfaction levels.
The observed pattern of durable satisfaction also suggests a possible interactive effect of previous and subsequent elections on satisfaction levels. It is intuitive to think that however pleasing electoral outcomes may be, such feelings are likely to give way to expectations with upcoming elections, thus lessening the salience of past victories or defeats. Imagining one’s party moving in or out of an eventual governing coalition is likely to update the residual satisfaction level of the previous election. Underpinning their “rational response hypothesis,” in which the satisfaction gap converges before the next election, Dahlberg and Linde (2017) imply that this takes place as voters are increasing their attention on the upcoming election. Blais and Gélineau (2007) use panel data to demonstrate that eventual winners go into elections with greater satisfaction with the way democracy works than the eventual losers. Presumably, this is because their satisfaction reflects reasonable expectations of winning prior to the election (Van der Meer and Steenvoorden, 2018). In the aggregate, this may mitigate the suspension bridge pattern; however, in order to examine this potential interaction at the individual level, we need respondents’ expectations of the likelihood or probability that her preferred party will win/lose in the following election. In the absence of subjective expectations data (or non-trivial proxies), we unable to investigate this potential effect. 10
The second direction for a possible theory is a reconsideration of the plight of the losers. As Dahlberg and Linde (2017: 626) write, “[f]or democratic legitimacy, the way people react to political loss is critical.” Anderson et al. (2005) investigate the gap between winner and loser satisfaction with democracy levels over time and observe a tenacious satisfaction gap. They argue that the depressive effect of losing on satisfaction is in fact where the mechanism linking election outcomes and satisfaction may potentially reside (see also Esaiasson, 2011). That is, losing weakens satisfaction for democracy rather than winning serving to increase it and that serial losing—that is, losing in successive elections—may be even more potent in depressing satisfaction levels (Chang et al., 2014; an effect already noted for winners, Curini et al., 2012). Dissatisfaction with democracy is likely to drive voters into the waiting arms of increasingly radical parties, left or right, as a means to “make something happen” or “upset the status quo” (March, 2011; Mudde, 2007; Rooduijn et al., 2017). These parties, however strongly supported, are less likely to be electoral winners than mainstream parties and thus transition dissatisfied voters into dissatisfied losers once again (Hooghe and Dassonneville, 2018).
Thus, rather than considering the winners as unique appropriators of the benefits of democratic elections, we should re-evaluate the effect of losing, and in particular, serial losing. Concurrent with increased political polarization, there has been a rise of “disruptive” parties, returns to power of Eurosceptic establishment parties, Brexit, as well as attempts, referenda, and calls for regional autonomy in several European Union member states. Public support for democracy is strongly linked with the endurance of democracy (Claassen, 2020); thus, renewed attention to those failing to reap the benefits of democracy may prove both timely and crucial as the losers may be trying to communicate.
Our analysis here is aimed at bringing evidence to bear on the question of how durable are electoral outcomes on voters’ levels of satisfaction with democracy. While these are the most comprehensive data brought to bear on the impact of winning/losing on satisfaction hypothesis, there are several important limitations of the approach taken here. Most notably, in order to directly analyze and make stronger claims about the impact of winning (or losing) over time, we would need panel data on the same individuals over several elections—ideally, both winning and losing (see country studies: Dahlberg and Linde, 2017; Van der Meer and Steenvoorden, 2018). The limitation being that the observed duration can be confused with individual satisfaction as winners and losers rather the durability of the winning effect on satisfaction. This also limits our ability to account for the serial winning and losing effect (Chang et al., 2014; Curini et al., 2012) which holds great potential for future work. However, the data used here exploit responses at random periods from previous elections across 27 different countries, over 15 years, with controls accounting for individual- and national-level variation. The number of observations provides substantial control for theorized differences in individual respondents’ satisfaction levels at both the individual and national levels. While each respondent is asked once, the variables that have been argued to explain variation in satisfaction are included with a large degree of freedom.
Another potential limitation to this analysis is recall bias, the small but non-zero probability that voters misreport for whom they voted in the previous election (Bernstein et al., 2001; Karp and Brockington, 2005). It is not unreasonable to suspect that some proportion of the respondents may report they have voted for the “winner” because they would like to believe that they did, make others think they did, genuinely forgot how they voted, or are rationalizing their vote via the survey response to avoid cognitive dissonance. There are not adequate controls for these here. 11
However, in the list of why voters may misreport their vote above, I note that three of the four of these reasons assume that respondents want to be “on the winning side” (i.e. believe that they did, make others think they did, or rationalizing). It is reasonable to argue, although largely unexamined in the literature, that some of those who voted for the current government might also try to distance themselves from the current government, particularly with the recent rise of more extreme parties with more extreme agendas. That is, some voters may not want to admit having voted for a party that has pursued, for example, individually desired but socially unacceptable policies (i.e. harsher restriction on immigration, curtailing of women’s rights, anti-climate change actions) or simply because of the governments’ perceived poor performance. I would argue, that taken together, the majority of the variation in “misreporting” comes down to those who genuinely have forgotten, and while we may be tempted to assume they want to be “on the winning side,” this may have become an untenable assumption. Thus, I suggest any potential misreporting by respondents can be considered, for this analysis, functionally random. This does not resolve the issue of potential misreporting itself—the extent to which cannot be known here—but does address the distribution of potential recall bias as an increase in the “noise” of the unknown responses rather than the provision of a post hoc “signal” (or having voted for the winner).
Finally, electoral cycles can matter in a variety of ways for individuals’ levels of satisfaction. Similar to the expectations of upcoming elections mentioned above, another source may originate from the winning parties themselves. The electoral business cycles literature clearly shows that incumbent governments often try to create an economic boost as elections approach with the specific intent of raising performance evaluations and in turn, satisfaction levels (Alesina et al., 1993; Bovea et al., 2017). Thus, previous winners (i.e. supporters of the incumbent party) will be more likely to attribute credit to that party for improved economic performance and therefore report more satisfaction. One could devise a more refined means to position voters within the election cycle itself. For example, in addition to days from previous election—as used here—one might incorporate forthcoming election dates in some manner. While outside the scope of this study, there are several ways to approach this and given the findings here, the electoral cycle is a fertile avenue for future research on the relationship between elections and satisfaction.
Conclusion
Elections continue to hold our attention as intuitive sources of satisfaction with democracy. As the central act of a democratic citizen, voting is widely considered a source of citizen’s satisfaction with democratic performance and thus crucial to long-term legitimacy in Europe (Van Ham et al., 2017). And while a number of theories have been offered as to why voting for an electorally victorious party may shape individual voters’ assessments of governance quality, we would benefit from knowing more about the seemingly more complex nature of this relationship. The analysis of Waves 1–8 of the ESS here shows that, from 92 elections across 27 European countries for the period 2002–2017, those who voted for a “winning” party have higher levels of satisfaction than those who voted for a “losing” party and that this effect does not attenuate quickly, lasting almost 5 years. As importantly, the time from election appears to have no causal impact on satisfaction levels. That is, it appears that when you win, nothing hurts, as winners are more satisfied with democracy and appear to stay that way. However, this durable effect of winning in an election on satisfaction opens up more questions than it answers. If we accept that the winning effect of elections is so strong, that time does not matter, we must also accept that the literature is failing to capture a key—and currently unobserved—process in this relationship.
Supplemental Material
Supplementary_material – Supplemental material for When You Win, Nothing Hurts: The Durability of Electoral Salience on Individuals’ Satisfaction with Democracy
Supplemental material, Supplementary_material for When You Win, Nothing Hurts: The Durability of Electoral Salience on Individuals’ Satisfaction with Democracy by Matthew Loveless in Political Studies
Footnotes
Appendix 1
Declaration of Conflicting Interests
The author(s) declared no potential conflicts of interest with respect to the research, authorship, and/or publication of this article.
Funding
The author(s) received no financial support for the research, authorship, and/or publication of this article.
Supplemental Material
Supplementary material for this article is available online.
Notes
Author Biography
References
Supplementary Material
Please find the following supplemental material available below.
For Open Access articles published under a Creative Commons License, all supplemental material carries the same license as the article it is associated with.
For non-Open Access articles published, all supplemental material carries a non-exclusive license, and permission requests for re-use of supplemental material or any part of supplemental material shall be sent directly to the copyright owner as specified in the copyright notice associated with the article.