
Abstract
Trust in civil servants is essential for effective governance, enabling policy implementation, public service delivery, and compliance. However, the lack of comparable cross-national data on trust in bureaucracy has limited our ability to systematically examine these relationships. To address this gap, we develop the Trust in Civil Servants (TCS) dataset with an advanced latent-variable modeling technique, using 123 national and cross-national surveys from 98 countries (1986–2022). Our measures reveal variations in trust both within and between countries. We find that economic performance and public security enhance trust in the short term, whereas government quality and effectiveness have more enduring, long-term impacts on trust in civil service. The TCS dataset opens new avenues for examining connections between trust, governance quality, and complex policy challenges across different contexts.
Political trust is a foundation of regime support, democratic legitimacy, and governance (Easton, 1975; Norris, 2002; Wuttke et al., 2020). It is also associated with civic duty and policy compliance (Bargain and Aminjonov, 2020; Valgarsson et al., 2021), as well as individuals’ well-being during crises (Devine et al., 2021; Zaki et al., 2022). For these reasons, political trust’s dynamics, determinants, and consequences have been a leading issue in political science and public administration.
Yet despite its importance, empirical findings about whether and how political trust matters remain mixed. While examining redistribution policies, Devine (2025) found negligible effects of political trust on policy preferences in the United Kingdom and Switzerland, contrasting with Macdonald’s (2020) evidence of trust shaping redistribution support in the United States. When the focus shifts to trust in administrative and implementing institutions, the evidence is also mixed: Harring (2018) detected no effect of trust in administrative institutions on environmental policy support, while Bergquist et al. (2022) demonstrated that public trust in implementing institutions has a stronger effect on supporting climate change policies than other institutional trust.
This mixed evidence underscores a central empirical limitation: comparative research on trust is hindered by the lack of comparable cross-national time-series measures (Tai, 2026). Existing surveys often use different trust items and provide inconsistent country–year coverage, which makes results difficult to compare across studies. As a result, it is hard to evaluate competing claims across governance contexts and over time, or to distinguish whether conflicting results reflect real contextual heterogeneity or differences in measurement and coverage.
This limitation is particularly consequential for research on trust in civil servants. For public sectors, public trust is not only a fundamental element of governance (Blind, 2007) but also a central normative objective of public administration (Goodsell, 2006). For policy studies, trust in civil servants deserves particular attention because these officials directly interact with citizens, deliver public services, and translate policies into practice (Morelock, 2021). With adequate trust, the public more readily accepts services and complies with policy directives (Kim, 2005: 611). Conversely, low trust can impede officials’ ability to implement policies effectively and secure public cooperation (Van Ryzin, 2011; Yates, 1982).
Despite this salience, existing research on trust in civil servants remains geographically and temporally constrained (Choi, 2018; Houston et al., 2016; Morelock, 2021; Van de Walle and Migchelbrink, 2022), limiting our ability to understand how trust dynamics shape the policy process across different governance contexts. In addition, limited cross-nationally comparable data makes it challenging to test competing theories about the factors influencing trust in bureaucracy, whether it is government performance, governance quality, or other factors (Bouckaert, 2012; Kettl, 2000; Morelock, 2021; Van de Walle and Migchelbrink, 2022).
To address this gap, we introduce the Trust in Civil Servants (TCS) dataset. It draws on 123 national and cross-national surveys covering 98 countries over 37 years (1986–2022) and applies recent advances in latent-variable modeling of public opinion (Solt, 2020c). We validate the TCS data by demonstrating strong correlations with individual survey items and related measures, such as perceived corruption and trust in other political institutions.
Using the TCS data, we conduct a cross-national time-series analysis to examine competing theories on trust in civil servants, focusing on government outcomes versus government quality. We find that government outcomes, such as economic performance and public security, have short-term effects on trust, while government quality including effectiveness exerts more significant, enduring effects. This underscores that while both factors are important, the quality of governance plays a long-term role in fostering trust in civil servants.
Our study contributes to comparative public administration and public policy by providing valid, comparable longitudinal data on trust in civil servants. Recent research underscores the need to explore how trust in public institutions influences complex policy challenges like climate change and environmental mitigation support, CO2 emissions, and decarbonization in comparative context (Cole et al., 2025; Davidovic, 2025). By enabling comparable cross-national analyses, TCS supports research on whether and how trust interacts with governance quality and public-sector performance, and how institutional trust shapes policy preferences across diverse contexts.
Debates on the causes of trust in civil servants
A long-standing puzzle in public administration is understanding what explains trust in bureaucracy. One dominant theme is the belief that higher levels of government performance lead to greater trust in civil servants, based on the assumption that better performance correlates with higher trust and that lower trust toward bureaucrats reflects dissatisfaction with government performance (Yang and Holzer, 2006). A common approach to measuring performance is through macroeconomic outcomes, such as economic growth, unemployment rate, economic inequality, and inflation. However, the results from studies on macroeconomic outcomes are mixed. For example, Choi (2018) found that GDP per capita positively affects trust in bureaucracies, while Houston et al. (2016) did not find significant effects of GDP per capita or inflation rate on trust in civil servants. Instead, they reported that the unemployment rate negatively influences trust in civil servants. Contrary to previous studies that offered some evidence for the role of government outcomes, Morelock (2021) reported that none of the outcome indicators, including GDP per capita, inflation rate, unemployment, and the Gini index, had a significant effect on trust in civil servants.
Amid these mixed results regarding macroeconomic outcomes, a growing body of literature emphasizes the role of government quality or process in explaining trust in bureaucracy. Van Ryzin (2011) showed that the quality of government, measured by the World Bank’s Worldwide Governance Indicators, plays a more crucial role than government outcomes measured by the UN’s Human Development Index, which had a negative effect in his model. Morelock (2021) also highlighted the positive role of government effectiveness, although Houston et al. (2016) showed an inconsistent role of government effectiveness. One relatively consistent result across studies is the significant role of corruption. Van de Walle and Migchelbrink (2022) concluded that the perceived absence of corruption is more impactful on trust in bureaucracy than performance evaluations. The critical influence of perceived corruption and corruption control on public trust in civil servants is also supported by Houston et al. (2016) and Morelock (2021). Beyond these studies, recent research has explored dimensions of government performance, including transparency, agency reputation, and the integration of input, process, and output measures. Studies show that both public and private elite actors’ trust in agencies is strongly influenced by performance (Kappler et al., 2024). Moreover, transparency and perceived organizational reliability have been identified as key factors in shaping public trust (Schmidthuber et al., 2023). Despite these advancements, variations in measures and modeling strategies, such as whether both outcomes and quality indicators are included in the same model, leave uncertainty about the consistency of these results. A more standardized approach is needed to clarify these relationships.
These mixed results also reflect limitations in comparative data, including limited country coverage, reliance on cross-sectional rather than dynamic analysis, and the absence of comparable measures across countries or regions (Choi, 2018; Houston et al., 2016; Morelock, 2021; Van de Walle and Migchelbrink, 2022; Van Ryzin, 2011). These shortcomings hinder a deeper understanding of the relationship between government outcomes, quality, and trust in bureaucracy.
To address these challenges, we developed the Trust in Civil Servants (TCS) dataset, a dynamic, cross-national measure that enables rigorous testing of competing theories about the sources of trust in civil servants.
Examining the source data on trust in civil servants
Over the past half-century, many national and cross-national surveys have asked questions on trust attitudes toward public administrations. Our goal is not to draw a sample of surveys, but to compile as large a feasible set of relevant survey items as possible and then synthesize them into a comparable country–year series.
We first defined the target construct as public trust in civil servants or public administration based on previous trust in civil servants studies. We then undertook an extensive effort to collect and compile relevant survey questions. This involved a systematic review of survey documentation and raw data files to identify items that reference civil servants, government administrators, or public administration, and we recorded the corresponding question identifiers, response scales, fieldwork dates, and survey weights when available. Candidate items were then cross-checked by two authors to resolve construct mismatches. This process finally included 132 unique survey projects including both cross-national global surveys and single country surveys and spanning 125 countries over 49 years to maximize broad geographic and temporal coverage and 27 unique candidate questions. 1
We then processed raw files using DCPOtools (Solt et al., 2019). To minimize the noise from the sparse data and increase comparability, we followed a common approach (Woo et al., 2023) and identified 17 survey items drawn from the raw data that were asked in no fewer than five country-years in countries surveyed at least three times, leaving 123 of the 132 survey projects in the final source data. DCPOtools standardizes formats, applies consistent recoding and weighting, and outputs analysis data for model estimation.
Together, the survey items in this source data were asked in 98 different countries over 37 years from 1986 to 2022, yielding a total of 1814 country-year-item observations. If all of these countries were surveyed in all of these years, we would have 3626 country-year observations and a total of 61,642 country-year-item observations. However, the actual dataset is far more limited, with only 1344 country-years containing at least some data on trust in civil servants. This accounts for 54% of the 2475 country-years spanned by our dataset. Moreover, the many different survey items employed render these data incomparable and difficult to use together.
Consider the most frequently asked item in the data we collected, which asks respondents whether they strongly agree, agree, disagree, or strongly disagree with the statement I am going to name a number of institutions. For each one, could you tell me how much trust you have in them. Is it a great deal of trust, some trust, not very much trust or none at all? Civil service.
2
Employed by the Arab Barometer, the Asia Europe Survey, the Asian Barometer, the British Social Attitudes Survey, the Latinobarómetro, the East Asian Social Survey, the European Values Study, the Italian National Election Study, the South Asian Barometer, and the World Values Survey, this question was asked in a total of 614 different country-years. However, this represents only 25% of the country-years spanned by our data, despite being the most common survey item. This again underscores the sparse and often incomparable nature of the available public opinion data on this topic.
The distribution of country-year-item observations further highlights the limitations of the raw dataset. As depicted in the upper left panel of Figure 1, Germany, with 50 country-year-item observations, is the most represented country, followed by Spain, Finland, the United Kingdom, and Sweden. The upper right panel expands on this by listing the 12 countries with the highest number of years observed, revealing overlaps and differences from the previous group; Ireland, Italy, Austria, and Bulgaria join the list, replacing Sweden, Slovenia, Netherlands, and France. The bottom panel counts the countries observed in each year and reveals just how few relevant survey items were asked before 1996. Country coverage reached its peak in 2001, when respondents in 70 countries were asked items about trust in civil servants.
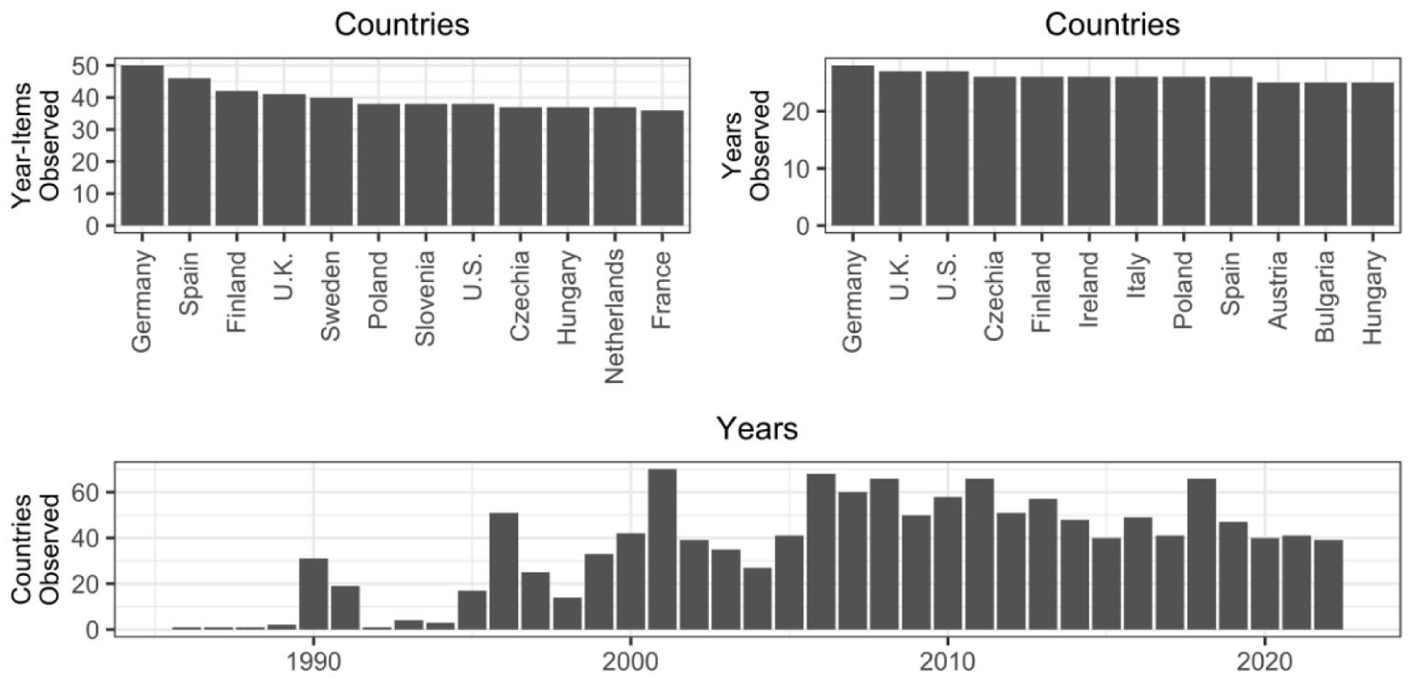
Countries and years with the most observations in the source data.
In the next section, we describe how we leveraged this sparse and incomparable survey data to generate complete, comparable time-series TCS scores using a latent variable model.
Estimating trust in civil servants
To estimate trust in civil servants across countries and over time, we employ a suitable method for handling data that is both incomparable and sparse: the Dynamic Comparative Public Opinion (DCPO) model developed by Solt (2020c). 3 DCPO treats trust in civil servants as a latent trait that is not directly observable but can be inferred from respondents’ answers to multiple relevant survey questions, accounting for differences in question wording and response scales. DCPO has been applied in recent peer-reviewed work to produce comparable public-opinion time series from sparse and incomparable cross-national surveys (e.g. Hu and Solt, 2025; Tai et al., 2024; Woo et al., 2023). Formally, DCPO is a population-level two-parameter ordinal logistic item response theory (IRT) model with country-specific item-bias terms, addressing the two principal challenges posed by our source data: incomparability and sparsity.
DCPO models the total number of survey responses expressing at least as much trust in civil servants as response category


where
This expected probability,
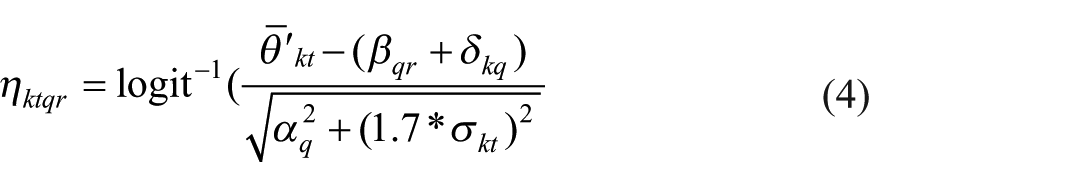
Here,
To address sparsity over time, DCPO places random-walk priors on the latent country–year parameters and estimates are therefore smoother in data-rich periods and more uncertain in data-sparse periods. Together, DCPO estimates latent trust and smooths estimates simultaneously in a single Bayesian model, with a random-walk evolution prior providing parsimonious regularization across sparse time series and naturally expanding uncertainty where coverage is thin. For additional details, see online Appendix B and Solt (2020c: 3–8).
Intuitively, DCPO addresses item incomparability through the difficulty and dispersion parameters. Difficulty captures how much trust in civil servants is indicated by a given response. For example, strongly agreeing with the statement “Most government administrators (civil servants) can be trusted to do what is best for the country” exhibits more trust in civil servants than simply agreeing, which shows more trust than responding “disagree,” which in turn is a more trusting response than “strongly disagree.” The same logic also applies across questions. Expressing “great trust” in civil servants “to look after your interests” likely expresses even more trust than just strongly agreeing that civil servants can be trusted to do what is right. Dispersion captures how tightly a question’s responses map onto the latent trait: questions with lower dispersion provide a stronger signal of changes in trust, while noisier questions contribute weaker information. Together, by estimating difficulty and dispersion, DCPO maps responses from different questions and surveys onto a single latent scale, yielding comparable country–year estimates.
Finally, the random-walk priors smooth trust estimates over time within each country. A given year’s trust level is modeled as the previous year’s estimate plus a random shock. This approach allows the generation of estimates even for years with little or no data, with uncertainty increasing as the time gap between observed years grows. We incorporate this uncertainty in downstream analyses as described below.
We estimated the model using the DCPOtools package for R (Solt, 2020a), running four chains for 1000 iterations each and discarding the first half as warmup, which left us with 2000 samples. The
The result is estimates, in all 2475 country-years spanned by the source data, of public trust in civil servants, what we call TCS scores. Figure 2 displays the most recent available TCS score for each of the 98 countries and territories in the dataset.
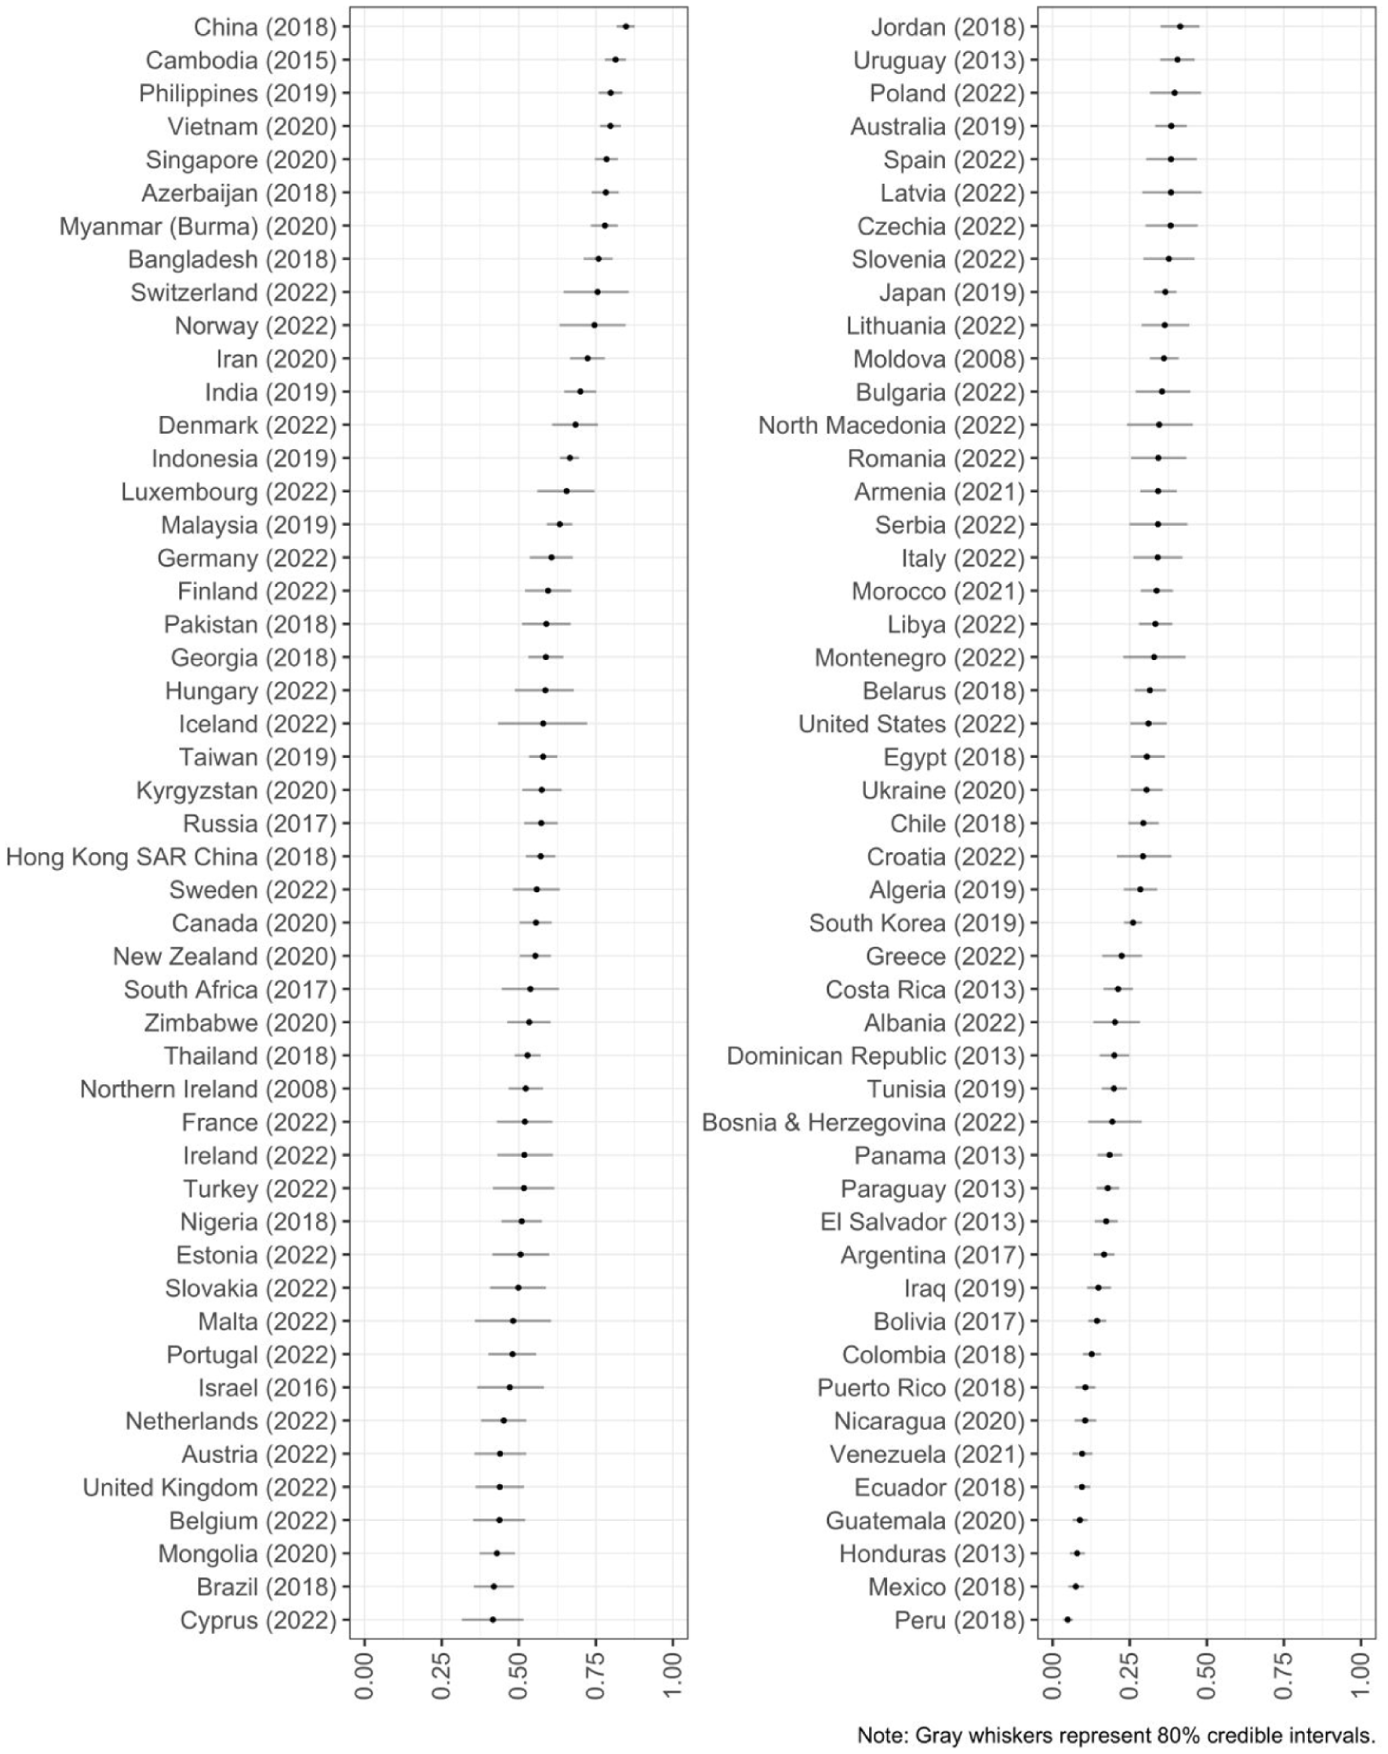
TCS scores, most recent available year.
Several Asian countries, such as China and Singapore, dominate the top of the list. Some Southeast Asian countries also rank highly. This pattern aligns with OECD/ADB reports documenting high self-reported satisfaction with core public services in the region in recent years (OECD and Asian Development Bank, 2019, 2025). A number of democracies, such as Switzerland, Norway, Denmark, and Finland, also rank highly. On the other hand, the latest scores for Peru, Mexico, Honduras, Guatemala, and Ecuador have them as the places where the public has the lowest trust toward civil servants.
For transparency, we release the full set of country–year estimates and associated uncertainty. We treat unexpected estimates as prompts for further inquiry rather than definitive substantive claims, and we suggest that scholars interpret cross-national differences cautiously, especially for countries with sparse item coverage, where uncertainty is larger.
We then show the changes of TCS over time in 16 countries in Figure 3. As displayed in Figure 3, the dataset covers a wide geographic breadth, allowing comparative studies of countries and regions too often neglected (see Wilson and Knutsen, 2022). Figure 3 also shows that trust in civil servants has risen prominently in some countries, such as Germany and New Zealand, while remaining fairly constant over time in others, like Greece and Australia. In contrast, TCS scores have fallen steadily in countries such as South Korea and the United States. Some countries exhibit fluctuations, as seen in the United Kingdom, where trust has advanced and retreated, or the Philippines, where trust has declined and later recovered. Together, the differences within countries over time and the differences across countries present a challenge to theories on the causes and consequences of trust in civil servants.
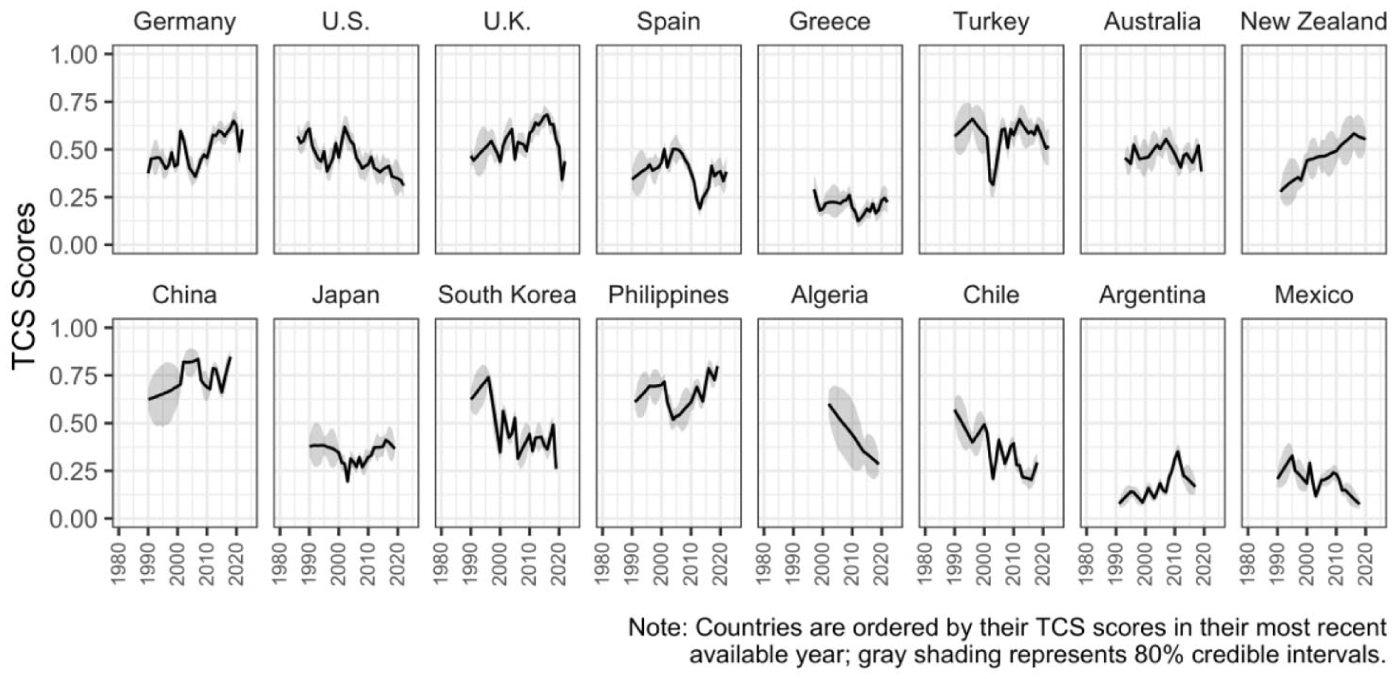
TCS scores over time within selected countries.
Validating trust in civil servants
Before using these estimates in analysis, we validate our TCS score through convergent validation and construct validation, since validation tests of cross-national latent variables are crucially important (see, e.g. Hu et al., 2025). Figure 4 shows the measure’s validity in tests of convergent validation, which assess whether a measure is empirically associated with alternative indicators of the same concept (Adcock and Collier, 2001: 540). We started with an “internal” convergent validation test (see, for example, Caughey et al., 2019: 689; Solt, 2020c: 10) by comparing our TCS scores with individual items from the source data used to generate them.
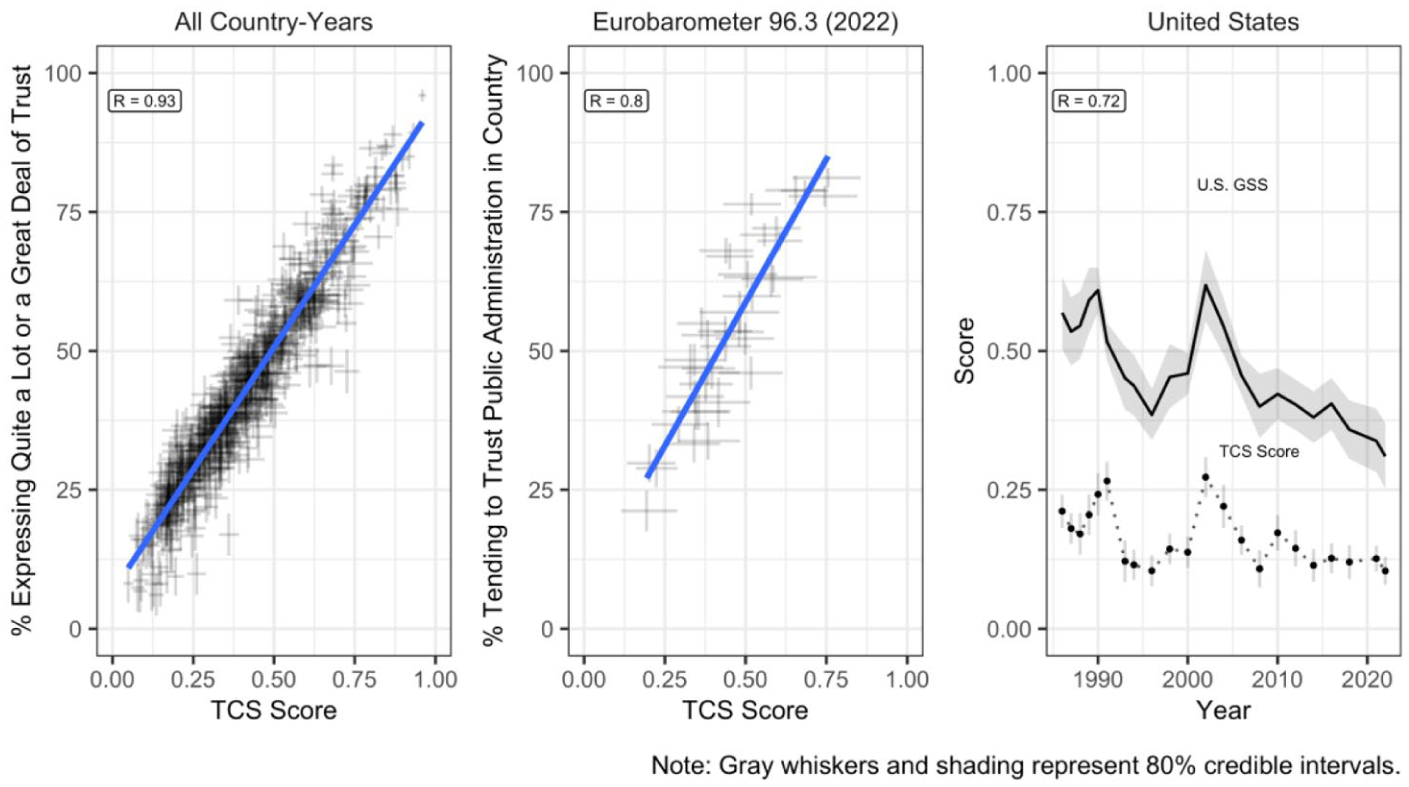
Convergent validation: correlations between TCS scores and individual TCS source-data survey items.
The left panel in Figure 4 shows a scatterplot of country-years in which the TCS scores are plotted against the percentage of respondents who expressed “quite a lot” or “a great deal” of trust in response to the question: I am going to name a number of institutions. For each one, could you tell me how much trust you have in them. Is it a great deal of trust, some trust, not very much trust or none at all? Civil service.
The strong correlation (R = 0.93) indicates that TCS scores effectively capture variations in trust in civil service across country-years.
The middle panel plots our TCS score against the percentage who responded “Tend to trust” to the question, I would like to ask you a question about how much trust you have in certain institutions. For each of the following institutions, please tell me if you tend to trust it or tend not to trust it: Public administration in (OUR COUNTRY)
in the Eurobarometer 96.3 January–February 2022 module. This question is asked in the most countries, and the strong correlation demonstrates the broad applicability of the TCS scores in capturing trust across diverse contexts.
Finally, the right panel compares the trend of the longest item that has been asked since 1973 in the US General Social Survey, I am going to name some institutions in this country. As far as the people running these institutions are concerned, would you say you have a great deal of confidence, only some confidence, or hardly any confidence at all in them? Executive branch of the federal government.
to the trend of the TCS scores. The TCS scores align with trends in trust in the executive branch over time, effectively capturing historical changes.
Figure 5 presents three “external” convergent validation tests, comparing TCS scores to responses to survey items that were not included in the source data: items that asked respondents’ confidence and trust in national government, parliament, and judiciary in their countries. In the left panel, we plot TCS scores against data from seven rounds of the World Values Survey, which asked respondents how much they trust their national government. The center plot shows data from the European Values Study asking respondents’ confidence in parliament. The right panel presents the percentage of respondents who expressed at least some trust in the judiciary in their country in Latinobarómetro. Our measure is positively correlated with all of them, with a stronger correlation with trust in national government and a mild correlation with trust in parliament and the judiciary.
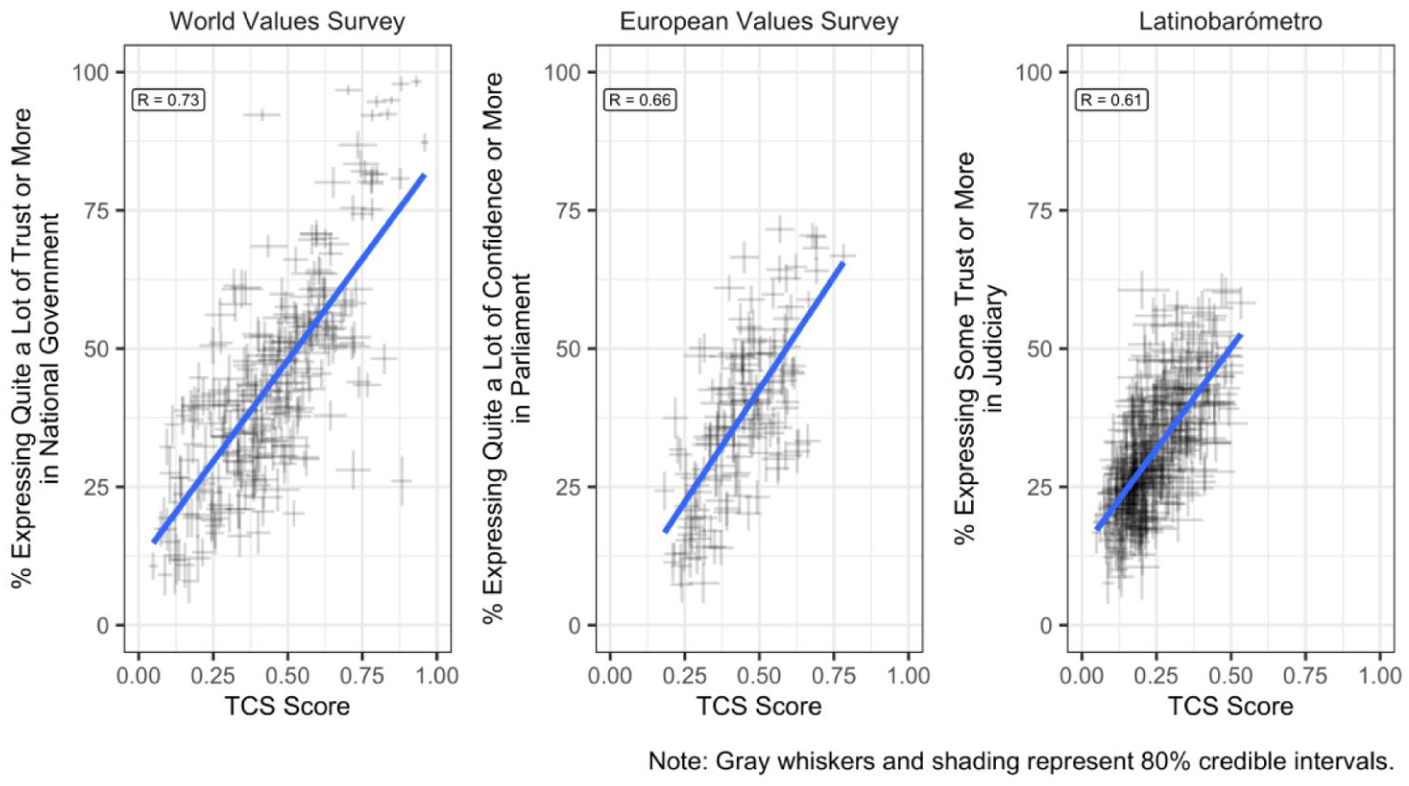
Convergent validation: correlations between TCS scores and trust in institutions survey items.
There is a long-standing debate about the dimensionality of political trust (Easton, 1965; Marien and Hooghe, 2011; Norris, 2011; Rothstein and Stolle, 2008; Tai, 2022). Trust in civil servants has been theoretically grouped within the same dimension as all three types of institutional trust (Hooghe, 2011; Marien and Hooghe, 2011), or one of them (Norris, 2011; Rothstein and Stolle, 2008; Tai, 2022). However, the variation in correlations between TCS scores and trust in institutions requires empirical analysis of trust’s dimensions.
We next conduct tests of construct validation in Figure 6. Construct validation assesses whether a given indicator is empirically correlated with other indicators in a way that conforms to theoretical expectations (Adcock and Collier, 2001: 542). Corruption is often argued to be a likely contributor to distrust in civil servants and public administration (see, for example, Anderson and Tverdova, 2003; Van de Walle and Migchelbrink, 2022; Van Ryzin, 2011).
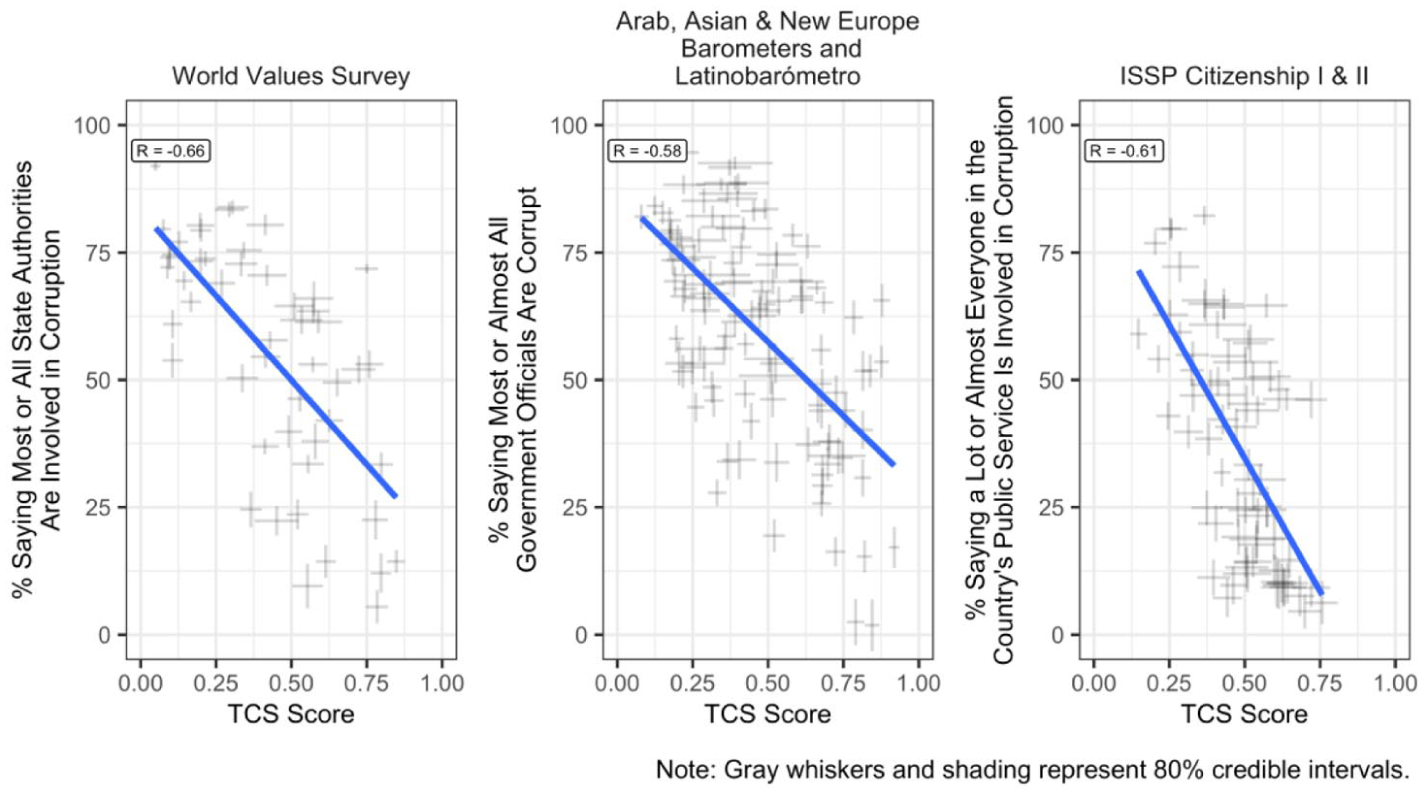
Construct validation: correlations between TCS scores and corruption of public servants survey items.
The left panel compares the perceived pervasiveness of corruption, measured as the percentage of those saying most or all state authorities are involved in corruption in seven waves of the WVS, with the TCS scores. As anticipated, there is a clear negative relationship between the spread of perceived corruption and the TCS scores: when there is widespread perception of corruption in authorities, the public tends to distrust civil servants. The similar negative correlations between TCS scores and perceived corruption among government officials are also seen in the center and right panels of Figure 6, which used data from different regions. The center panel shows the data in developing or newly democratic countries surveyed in the Arab Barometer, the Asian Barometer, the New Europe Barometer, and the Latinobarómetro, and the right panel displays the data in countries surveyed in the International Social Survey Programme Citizenship module (2004, 2014).
To sum up, the evidence of construct validation of TCS scores against the perceived extent of corruption in Figure 6, together with the evidence of external validation in Figure 5 and convergent validation in Figure 4, demonstrates the validity of the TCS scores as measures of the public’s trust in civil servants.
Explaining trust in civil servants
With our time-series cross-national data on trust in civil servants, we are able to reexamine and perform a conceptual replication and generalization (see Walker et al., 2017: 1225–1226) of the literature debating the causes of trust in bureaucracy that we describe above. That is, we investigate the same hypotheses as previous work using different measurement and analysis. With many more country-years observed, we are able to combine a wide range of contextual indicators of both outcome and quality in a single analysis to examine the factors influencing trust; previous studies, looking at smaller samples, are constrained to look at these indicators just one or a few at a time.
For ease of interpretation, we rescaled TCS from 0–1 to 0–100 in regression analyses. For outcome indicators, we employed GDP per capita, inflation, unemployment, and income inequality from 1986 to 2022 as measures of macroeconomic performance (Morelock, 2021) as well as public safety with regard to physical insecurity (see Uddin, 2025). GDP per capita and inflation data were sourced from the International Monetary Fund, while unemployment data were collected from the World Bank, which uses modeled International Labour Organization estimates. Regarding income inequality, we relied on the Standardized World Income Inequality Database presented in Solt (2020b), specifically the Gini index of inequality in disposable income. To measure physical insecurity, we collected the number of intentional homicides at the country-year level from the United Nations Office on Drugs and Crime.
For the process-oriented quality of government, we included corruption perceptions, government effectiveness, and democracy (Choi, 2018; see, for example, Houston et al., 2016; Morelock, 2021). To capture the perceived level of corruption, we used the Corruption Perceptions Index from Transparency International, covering the years 1995 to 2022. The World Bank’s Worldwide Governance Indicators provides its measure of Government Effectiveness, which reflects the overall quality of public services, the civil service, and policy formulation and implementation. And to account for the effect of democratic development on trust, we included the Liberal Democracy Index from the V-Dem dataset (Coppedge et al., 2023; Pemstein et al., 2023).
We adopted a Bayesian multilevel model with varying intercepts for each country and each year. The varying intercepts for each country account for unobserved differences across countries, while those for each year account for “time shocks” that impact all countries simultaneously (Shor et al., 2007). To differentiate between short-term and historical effects, we used the “within-between random effects” specification as described by Bell and Jones (2015; see also Woo et al., 2023). This approach models, for each time-varying predictor, the time-invariant country mean alongside the time-varying difference from this mean for each country-year.
Finally, we addressed measurement uncertainty in the data for trust in bureaucracy, income inequality, and the Corruption Perceptions Index by incorporating it into the analysis (see Tai et al., 2024). The model was estimated using the brms R package (Bürkner, 2017).
The results are presented in Figure 7. In terms of economic outcomes, an increase in GDP per capita is associated with a higher level of trust in civil servants in the short term. A two-standard-deviation year-to-year change in per capita income increases trust by 1 (95% CI: 0 to 1.9) point. This significant but relatively small effect suggests that GDP growth alone may not be sufficient to sustain high levels of trust in civil servants, given that economic growth may not transfer to effective resource management and service delivery. Still, it indicates that the null findings of the literature are the consequence of underpowered analyses: Houston et al. (2016) examined only 21 country-year contexts and Morelock (2021) just 23, compared to the 1411 country-years that we are able to examine using the new TCS dataset.
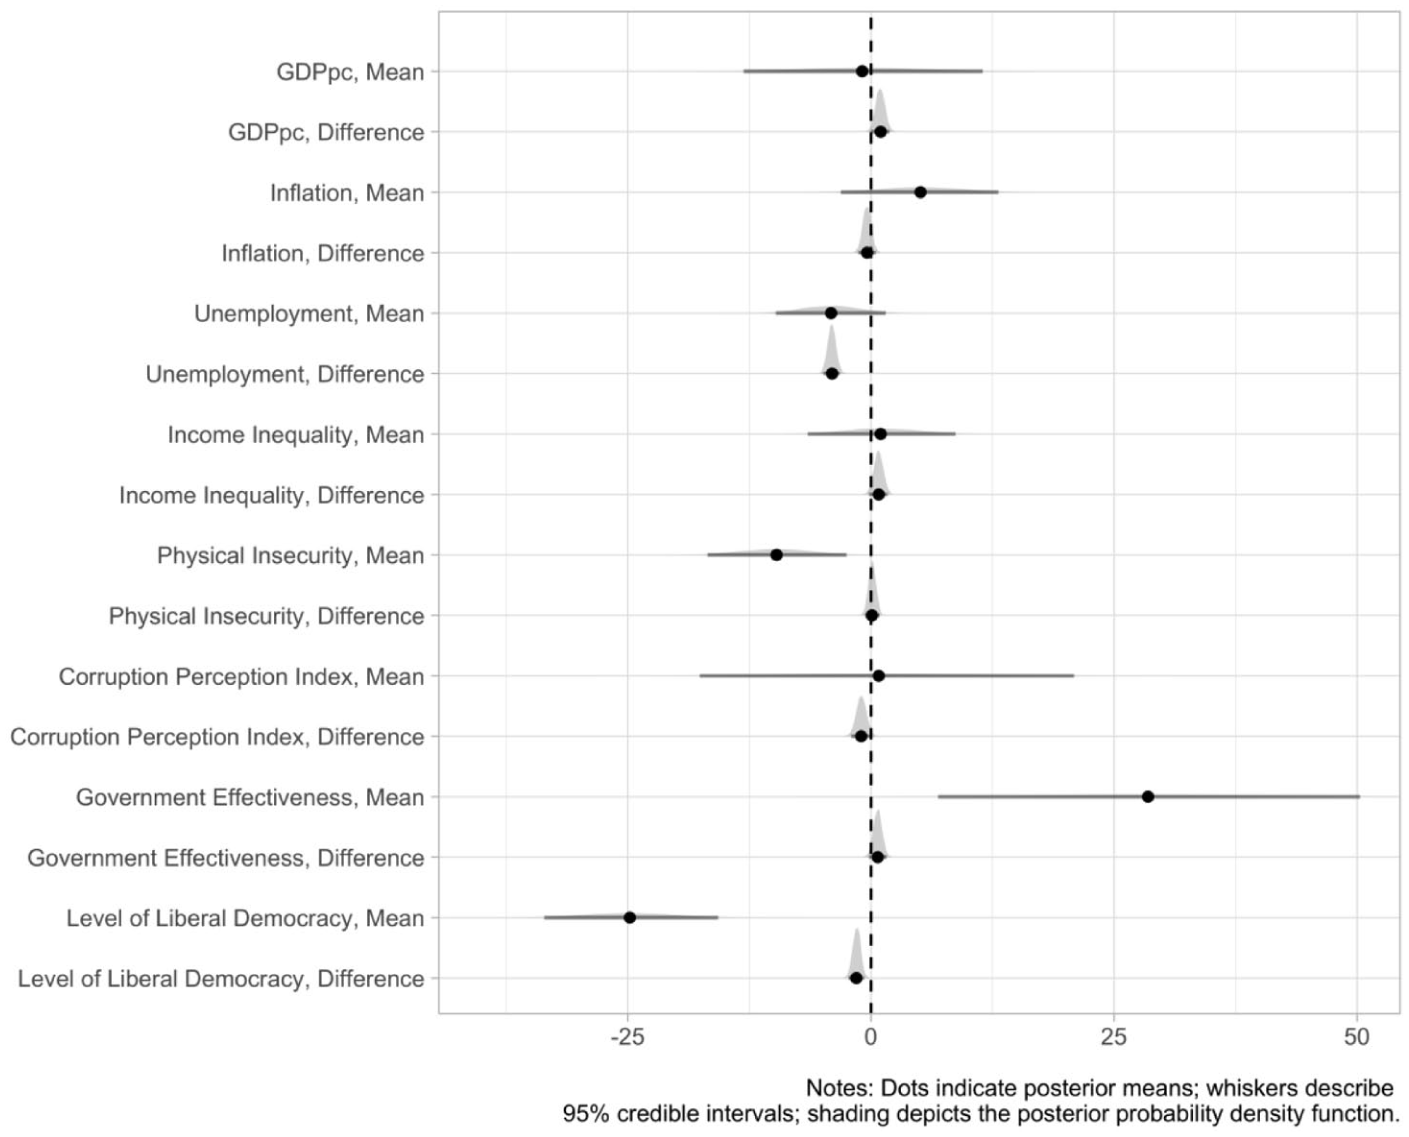
Predicting trust in civil servants across countries over time.
Unemployment exhibits a strong negative effect on trust in civil servants, with a two-standard-deviation year-to-year increase in unemployment decreasing trust in civil servants by 4 (95% CI: −4.9 to −3.2) points. As Houston et al. (2016) concluded—and contrary to null findings elsewhere (see, e.g. Morelock, 2021)—high unemployment rates can signal government inefficiency or failure to address critical economic challenges, eroding trust in civil servants (see also Choi, 2018: 124).
In terms of physical insecurity, the mean number of intentional homicides has a long-term negative impact on trust in civil servants. A two-standard-deviation increase in a country’s mean number of homicides is associated with 9.7 (95% CI: −16.8 to −2.5) points less trust. This result bolsters confidence that the finding of Uddin (2025), made in the context of Bangladesh, is generalizable across countries: high levels of violence and insecurity undermine public confidence in the administration’s competence to uphold law and order, diminishing trust in its civil service.
This analysis provides no evidence that either inflation or income inequality significantly affects trust in civil servants in the short or long term when other factors are controlled, reinforcing conclusions of, for example, Houston et al. (2016) and Morelock (2021).
Regarding process, these results show that a higher government effectiveness score has a strong positive long-term effect on trust in civil servants. A two-standard-deviation increase in a country’s mean effectiveness score is associated with 28.5 (95% CI: 6.9 to 50.3) points more trust across countries. This result suggests that improving the perceived quality of public services and policy formulation can lead to a sustained increase in trust, replicating the findings of Houston et al. (2016) and Morelock (2021). Coproduction of public value provides a compelling explanation, emphasizing how involving individuals in policy-making processes can strengthen trust in the public sector (Schmidthuber et al., 2021).
Although democratic capacity is found to mediate the relationship between government openness and public trust (Schmidthuber et al., 2021), we find the development of democracy is associated with less trust in civil servants, both in the long run and in the short term. This is contrary to the positive result in Choi (2018). Critical citizens in more democratic countries may trust civil servants only critically and have higher expectations of them (Norris, 1999). However, perceived corruption is not consistently associated with trust in civil servants in either the long term or short run when controlling for the other factors in our model; contrary to the smaller studies in this literature, which test single variables at a time, the estimates presented here are close to zero.
This conceptual replication of the literature on the causes of trust in civil servants sheds new light on some debates and reinforces some conclusions. It finds evidence for arguments on both government outcomes and government quality. However, government quality, measured by mean government effectiveness, exerts larger effects in the long term than economic and public security outcomes like GDP per capita, unemployment, and homicide rates. These findings suggest that to sustain trust in civil servants, policymakers and practitioners should prioritize institutional reforms that enhance effectiveness and inclusiveness.
Discussion
Research on trust in civil servants has long been constrained by the lack of comparable measures across countries and over time. This limitation has hindered efforts to evaluate competing explanations and has contributed to mixed findings about when and how trust shapes policy support and implementation.
Using a state-of-the-art latent-variable model (Solt, 2020c), we develop a dynamic, comparative measure of trust in civil servants that uncovers significant variations both within and across countries. Our analysis reveals that while economic performance and public security influence trust in the short term, government quality and effectiveness in service delivery and policy implementation have more enduring effects.
While this study focuses on the sources of trust in civil servants, the publicly accessible TCS dataset also offers new opportunities to examine critical policy questions. Researchers can investigate how varying levels of trust affect policy implementation, citizen compliance with regulations, and public acceptance of policy interventions. The dataset’s longitudinal nature enables analysis of how changes in trust relate to policy reforms, implementation strategies, and policy outcomes. These applications are particularly relevant for complex policy challenges that require sustained public cooperation and support.
TCS is a useful resource for studying trust in civil servants, but it also has limitations. As a country–year aggregate, it can mask case-specific dynamics that are better interpreted with country expertise. In addition, the model-based smoothing needed to address sparse coverage implies measurement uncertainty; treating point estimates as error-free can distort downstream inferences (Tai et al., 2024). To support appropriate use, we release full posterior draws so researchers can incorporate uncertainty directly in subsequent analyses using established approaches (e.g. Caughey and Warshaw, 2018; Tai et al., 2024; Woo et al., 2025).
Despite these limitations, TCS advances research on trust and governance by enabling more comprehensive comparative analyses of the levels, trends, and correlates of trust in civil servants across countries and over time than has been feasible with prior data.
Supplemental Material
sj-docx-1-psx-10.1177_00323217261450953 – Supplemental material for Trust in civil servants: A cross-national dataset for public policy research, 1986–2022
Supplemental material, sj-docx-1-psx-10.1177_00323217261450953 for Trust in civil servants: A cross-national dataset for public policy research, 1986–2022 by Yuehong Cassandra Tai and Frederick Solt in Political Studies
Footnotes
Funding
The authors received no financial support for the research, authorship, and/or publication of this article.
Declaration of conflicting interests
The authors declared no potential conflicts of interest with respect to the research, authorship, and/or publication of this article.
Data availability statement
Supplemental material
Supplemental material for this article is available online.
Notes
Author biographies
References
Supplementary Material
Please find the following supplemental material available below.
For Open Access articles published under a Creative Commons License, all supplemental material carries the same license as the article it is associated with.
For non-Open Access articles published, all supplemental material carries a non-exclusive license, and permission requests for re-use of supplemental material or any part of supplemental material shall be sent directly to the copyright owner as specified in the copyright notice associated with the article.