



Abstract
Ethnic violence in Gujarat in 2002 killed at least a thousand Muslims. Compiling data from the Times of India, we investigate variation across 216 towns and rural areas. Analysis reveals the political logic of violence. Killing was less likely where the Hindu nationalist Bharatiya Janata Party (BJP) was weakest, but was even less likely where the BJP was strong; it was most likely where the party faced the greatest electoral competition. Underemployment and Muslim in-migration also increased violence. The political logic is confirmed by analysis of the subsequent election: the BJP’s vote increased most in districts with the worst violence. Police chiefs in districts where violence was severe were more likely to be promoted.
The Partition violence between Hindus and Muslims, which claimed 200,000 lives, marked the beginning of what was to become a pervasive phenomenon in independent India. Since 1950, Hindu-Muslim violence has claimed more than 10,000 lives. 1 A systematic causal analysis of these events becomes a challenge in the absence of reliable data, assuming that government data tends to be biased. 2 That could be one reason why much of the study of ethnic violence in India has followed two approaches: First, the culturalist approach construes the context of violence rather than the cause. Culturalists focus on a “post-riot” narrative to identify the processes that generated the riot and its interpretations (and their manipulation) after it has occurred. 3 The second approach identifies causation qualitatively, through anecdotal evidence, historical narratives, and field reports of human rights groups. 4 Both approaches converge on two conclusions: that the typical ethnic riot is (i) a multicausal phenomenon emerging from a context of social tensions that are strengthened by historical distortions and myths, and (ii) often a state-sponsored “pogrom” against ethnic minorities for electoral benefits. 5 Establishing causation is problematic because qualitative evidence does not control for other socioeconomic factors and, more significantly, these studies focus only on places where riots have occurred, generating a selection bias and the danger of theoretical overgeneralization. 6 Among these contributions, Brass uses the post-riot interpretation approach to understand spatial variations, suggesting the presence or absence of “institutionalized riot systems” as the principal factor in predicting occurrence of riots over time and space. 7 However, this explanation cannot control for other socioeconomic factors, even as it attempts to decipher the cause of violence from its consequences.
Recent studies have attempted to overcome previous limitations. Key proponents include Varshney and Wilkinson, who pioneered a dataset of Hindu-Muslim violence in the period 1950 to 1995 in India. 8 Varshney proposed a theory founded on the contact hypothesis. He argues for the presence or absence of inter-ethnic civic and associational networks as the key variable for variations in occurrence of violence, assuming that the elected state would act in a politically strategic manner. 9 Using the same dataset, Wilkinson offered a more testable theory that posits the ethnic riot in the same framework of political logic as many culturalists do, but with considerable predictive power. Wilkinson argues that ethnic riots “are best thought of as a solution to the problem of how to change the salience of ethnic issues and identities among the electorate in order to build a winning political coalition.” 10 Violence that is precipitated as a result of this ethnic mobilization is either allowed to continue or stopped, depending on the will of the government that controls local law and order. His theory is based on an analysis of 167 towns in Uttar Pradesh (north India) for the period 1970 to 1995 and, more recently, of districts in Gujarat for the 2002 Hindu-Muslim violence where he finds violence to have broken out in the most competitive seats. 11
The Gujarat violence of 2002 is significant for recording the highest annual death toll in any event of Hindu-Muslim violence in a single state in the history of independent India: 984 people, predominantly Muslims, were killed following the death of 59 Hindu passengers on a train near Godhra on February 27. The “post-Godhra” violence, as it is called, continued unceasingly for four months and then, intermittently, for another six months. Most shocking was the spread of large-scale violence to rural areas. This was unique and contrary to established literature that treated ethnic violence “an urban phenomenon rooted among the petty bourgeoisie.” 12 Massacres of rural Muslims by thousands of villagers—many neighbors—were rampant and reported widely. 13 People belonging to the Scheduled Tribes in the eastern tribal belt of Gujarat mobilized by the thousands to set upon Muslim people and their properties with an unprecedented fury. 14 Among the manifold consequences of the violence, is the biggest string of Islamic terror attacks on India in the past decade; members of terrorist organizations have cited retaliation for the Gujarat riots as one of the key reasons for the attacks. 15
Like its predecessors, the anti-Muslim violence was termed a “pogrom” that the Sangh Parivar planned and executed—with support of the Bharatiya Janata Party (BJP) government in the state—for electoral benefits in the subsequent assembly elections. 16 The Sangh Parivar (Family of the Sangh or network of Hindutva associations), is a Hindu nationalist organization in India, whose principal affiliates are the BJP, the political wing; the Rashtriya Swayamsevak Sangh (RSS), a paramilitary social body for Hindu males; and the Vishwa Hindu Parishad (VHP), a religious body for the consolidation and service of Hinduism. Although BJP complicity would explain the high scale of violence, it does not without further refinement, explain the uneven distribution of violence across Gujarat. Our paper investigates various economic, social, and political factors that could account for variations in violence. It also examines whether the violence influenced the BJP’s subsequent electoral performance.
1. Violence in Gujarat in 2002
Gujarat did not experience extreme Hindu-Muslim violence during Partition in 1947. 17 Since then, however, it holds the dubious distinction of being the Indian state with the highest per capita rate of deaths in Hindu-Muslim violence. 18 One plausible explanation is the amorphous nature of caste, which promotes the integration of upper and middle castes. Caste stratification is more pronounced in other states, which experience more caste violence but less ethnic violence. 19
The first large-scale Hindu-Muslim violence in Gujarat occurred in 1969, in Ahmedabad city, following an argument over cows disrupting a Muslim religious procession. It claimed around 600 lives in five days. 20 The violence is usually explained as the result of communal propaganda by the BJP (then called the Bharatiya Jana Sangh) and two other parties, dominated by upper-caste Patidars (or Patels) and Vaniyas. 21 In the 1970s, the Congress faced a serious challenge to its power in the state, but it eventually established a stable coalition of caste and religion known as ‘KHAM’: Kshatriyas (a political alliance of upper-caste Rajputs and lower-caste Kolis), Harijans (Scheduled Castes), Adivasis (Scheduled Tribes), and Muslims. In 1981 and then in 1985, violence occurred in Ahmedabad city between upper-caste Hindus and Scheduled Castes. Although the first was entirely a caste-based conflict, the anti-reservation riots of 1985 transformed into a Hindu-Muslim conflict within one month. 22 The transformation has again been explained as an attempt by the Hindu nationalist parties to politically unify Hindu caste groups.
The 1990s saw a shift from Congress to the BJP in Gujarat. By 1991, the BJP awarded 30 percent of its district-level leadership positions to the backward castes, which formed their “junior” partners. 23 In 1995, the BJP first came to power, winning 42.5 percent of votes in the state election, though it continued to be in the opposition in Parliament. Within this tumultuous political situation, the national-level BJP launched a campaign to construct a temple in Ayodhya city of Uttar Pradesh in the honor of Lord Ram, whom some Hindus believe was born on the exact place occupied by the Babri Mosque, dating from the sixteenth century. 24 The campaign triggered around 300 Hindu-Muslim riots across India, eventually culminating in the demolition of the Babri Mosque in December 1992. Between September 1990 and January 1993, riots in Gujarat’s urban areas killed 500 people. 25 For the first time, violence involved active participation by Hindu upper-caste and middle-class men and even women. In 1969 and 1985, by contrast, members of the Scheduled Castes generally perpetrated violence.
The continuing Ayodhya campaign also sparked the violence in 2002. On February 27, the VHP resolved to begin construction of the Ram Temple. To celebrate the occasion, thousands of karsevaks—Hindu volunteers—converged at the site, including many from Gujarat. Returning back to Ahmedabad, around 2,000 boarded the Sabarmati Express train. As the train reached Godhra railway station in Gujarat, on the morning of February 27, a fierce fire engulfed one coach of the train. The fire claimed fifty-nine lives, mainly karsevaks. Without any investigation, the BJP government immediately issued a press release calling the fire a “pre-planned terrorist attack”; subsequently the government labeled it “inhuman genocide” or “inhuman carnage.” 26 In a state where trivial incidents had previously triggered large-scale violence, this was a trigger of immense magnitude, its impact further heightened by inflammatory headlines in the vernacular press. Later investigation refuted the claim of terrorism. The central government’s Ministry of Railways concluded that the fire was accidental. 27 Alternatively, and more plausibly, the incident began with an altercation between the karsevaks and Muslim tea vendors at the station, and then escalated when passengers attempted to abduct a Muslim girl; a Muslim crowd then attacked the train. 28
After the fire, violence began in Godhra town, but police immediately controlled it; however, violence spread rapidly to villages and towns that seemed to fall on the train route, leaving a trail of massacres. On February 28, the government brought the fifty-nine corpses to Ahmedabad railway station, further inciting angry Hindu crowds. 29 On that day, the VHP declared a Gujarat bandh (strike), which the BJP endorsed. People were forced to remain indoors, which made their homes and closed shops easy targets. On February 28 alone, 248 Muslims were killed. In three days, the death toll reached 495. Pogrom-like violence, almost entirely against Muslims, spread on an unprecedented scale in villages across the state with sporadic killings continuing until December that year. Qualitative evidence in media and academic reports suggests that the violence was the product of a well-organized “riot system.” even though the BJP presented it as spontaneous. In a speech made on March 1, the state’s Chief Minister, Narendra Modi, was reported to have cited Newton’s third law—“Every action has an equal and opposite reaction”—to justify the killings of Muslims. 30 The government referred to the massacres as “disturbances.” There is evidence of police complicity in the violence in many places. In the aftermath, moreover, the police failed to properly investigate and prosecute. The Supreme Court of India has since ordered the police to review and reopen 2,000 cases of violence that they had closed.
2. Theory
Hindu-Muslim violence in India is usually described as “communal,” with the term “ethnic” reserved for racially and linguistically distinct groups. However, we prefer the theoretical distinction made by Gupta. Conflict among castes is properly communal because the opponent’s national identity is not questioned; upper-caste Hindus accept backward-caste Hindus as legitimate members of the nation. “Ethnic” mobilization, by contrast, reasserts national identity and defines the opponent as foreign; Hindus thus associate Muslims with Pakistan. 31 We will describe Hindu-Muslim conflict as ethnic or religious, as distinct from conflict among castes.
With the bloody Partition riots, the Gandhian ethic receded as ethnic and caste violence became ingrained in postcolonial Indian society. Mobilization around these identities increased from the 1980s onwards; religious identities (Hindu-Muslim in particular) have generated more violence than those of caste. 32 The worst episodes in India include Hindu-Sikh violence in Delhi (around 3,000 dead in four days) in 1984, and Hindu-Muslim violence in Maharashtra in 1984 (109 dead in twelve days), Bihar in 1989 (396 dead in two months), Ahmedabad in 1969 (600 dead in five days, mentioned above), and across India in 1992-93 (around 2,000 killed in five months). 33 The intensity of the 2002 violence in Gujarat—at least 495 killed in just three days—means that it should be called the worst event of Hindu-Muslim violence in the country. Rarely do such large-scale killings take place in a democratic polity, absent civil war. A comparative example would be the 1983 ethnic violence in Sri Lanka, when an estimated 2,000 Tamils were killed in two weeks. 34
Ethnic violence is assumed to be endemic in India, particularly in Gujarat. Maya Kodnani, a BJP leader, described the post-Godhra violence at the time as “part of Gujarat’s nature (prakruti). It is a natural part of life, and should be accepted as such.” 35 This primordial explanation of ethnic violence assumes that human beings are inherently bound by common myths and symbols associated with their ancestry. 36 Although this approach has an instrumental utility, in that “ties of blood” can explain the creation of a collective identity in building feelings of nationalism, they cannot explain why resentment occurs between two “inherently” antagonistic groups in one place and not another. 37 The manipulation of ethnic identities could be successful in the context of preexisting antagonism, but people are unlikely to kill or attack each other only because of ancestral animosities. If this were true, riots between Malays and Chinese in Malaysia in 1969 would not have occurred in Kuala Lumpur and elsewhere in Selangor state alone but in all states with a similar ethnic mix and voting patterns. 38 Similarly, on the Zambia-Malawi border, the Chewas and Tumbukas engage in violence on the Malawi side, but are peaceful on the Zambian side. 39 In short, essentialized identities do not explain why violence breaks out in particular places at particular times, while other places and times remain peaceful.
Rejecting primordialism, many scholars have investigated in ethnographic detail the processes and repertoires that produce a riot. Brass conceptualizes an “institutionalized riot system”: a network of actors and organization whose objective is to keep a town or city in a permanent state of awareness of religious conflict. The cultural construction of fear is a subsequent progression that leads to the demonization of Muslims. It eventually culminates into violence that is framed as legitimate self-defense, by a “weak” state, against minority aggression. 40 Similarly, Tambiah expounds on the recurring phases and ritual-like patterns within a “spontaneous” riot, the consequences of which could become the revenge motivation for a subsequent riot. 41 Although understanding how these elements operate is a real contribution, postulating a riot system makes it hard to explain why violence varies across space and time. Or does the system itself vary? If so, under what conditions? Brass later identifies three (albeit “unstable”) contextual factors that produce a riot: the numerical strength of the Hindu and Muslim populations—if the Muslims are substantially higher, they could tilt the balance in favor of a rival political party; the presence or absence of political space and political opportunity; the presence or absence of political will to prevent and control riots. 42 However, without explaining the emergence of an institutionalized riot system, which is a key component in a place where Hindu-Muslim riots are endemic, these conditions are not very useful for explaining variation or change.
We will focus on theories that can potentially explain variation in violence across Gujarat’s towns and rural areas in 2002. These theories are able to be tested with information on political, demographic, and economic characteristics before violence occurred. It is crucial to compare all places, including those without violence, rather than focusing exclusively on places with the most violence. 43
Analyzing Hindu-Muslim violence over the period 1950-1995, Wilkinson theorizes its political logic: “The most effective method for elite-dominated ethnic parties to mobilize those target voters who are at risk of voting for the main rival parties will be to use ethnic wedge issues to increase—albeit in the short term—the salience of ethnic issues that will favor their party.” 44 This holds especially in close electoral races, where political parties can win votes by raising divisive symbolic issues related to ethnic identity. The resulting violence is either allowed to continue or is stopped, depending on the will of the government controlling local law and order. The decision depends on the risk of the governing party losing votes, on the electoral strength of minorities, and on party competition. Bipolar party competition, which has existed in Gujarat since separation from Bombay in 1960, is particularly conducive to ethnic conflict, because one party gains from exploiting antiminority sentiment. 45 When this antiminority party controls the state, violence is a tempting political strategy.
Multiethnic societies provide a wider scope of changing the salience of ethnic issues to suit political elites. In the United States, the government did not prevent antiminority violence in the South after 1877 when it looked for support from white Southerners, whereas it did restrain violence after 1945 when votes of blacks mattered. 46 Similarly, the Rwandan genocide revealed less of antagonistic ties than individual struggles for political power. 47 Relative to material goods, the immutability of ascriptive ethnic identities such as caste, religion and, to some extent, language, tend to heighten the success of using divisive issues during elections; people are less willing to compromise on what they see as fixed (caste, color) or sacred (religion), which undermines utilitarian bargaining. 48 By serving as a “focal point” that facilitates convergence of individual expectations, ethnic identity is useful as a mobilization strategy. 49 In addition, for the political party, the cost of mobilizing voters on an issue that is symbolic is lower than if the voter is mobilized on a material issue, such as employment of an ethnic group wherein the party needs to deliver results if victorious. In India, the cost is lower also because the state institutionally privileges some forms of mobilization, particularly “traditional” religious ceremonies and processions, which cannot be banned by the local administration. These occasions often provoke countermobilization by the minority group, which can then be interpreted as “illegitimate provocation.” 50
The political logic articulated by Wilkinson is clearly relevant to violence in 2002. The BJP’s grip on the state had begun to wane. The party had fared poorly in civic and district panchayat elections in 2000. After widespread criticism of its response to a massive earthquake, the BJP lost two by-elections in September 2001: one for the State Assembly, and one for the Parliament in Delhi. The Chief Minister resigned, to be replaced by Modi. Under Modi, however, the BJP lost two further Assembly seats in three by-elections in February 2002. In those four by-elections for the State Assembly, its vote fell on an average by 14 percentage points from 1998. A complete revival of the Gujarat BJP was vital, particularly for the new Chief Minister, before state elections scheduled for the end of 2002. Several accounts directly blame elected BJP politicians—Members of the Legislative Assembly (MLA), particularly those who were cabinet ministers or ministers of state—for fomenting the riots. 51 Maya Kodnani, for example, continues to face legal charges for inciting attackers in her constituency (Naroda Road, in Ahmedabad city), where around 100 persons were killed.
Hypothesis 1a: Muslims were more likely to be killed where the BJP had the greatest electoral support.
Hypothesis 1b: Muslims were more likely to be killed where the BJP faced greatest electoral competition.
Hypothesis 1c: Muslims were more likely to be killed where the elected MLA was from the BJP
Varshney makes a compelling argument for inter-ethnic civic networks. 52 From an investigation of six cities in India, he argues that strong civic and associational ties between Hindus and Muslims prevent riots. The difficulty lies in testing this theory systematically across many cases. His quantitative analysis of Hindu-Muslim violence in the period 1950-1995 uses literacy, Muslim population, and city area, but does not measure civic networks. We also lack any measure of civic networks, and so are not able to test the applicability of Varshney’s theory. Other scholars suggest that desegregation, rather than the absence of integration, causes ethnic conflict. Olzak analyzes seventy-seven American cities from 1877 and 1914, and argues that riots are more likely when segregation in the labor market breaks down. 53 In a recent study of Ahmedabad city, Field et al. suggest that violence occurred in heterogeneous working-class neighborhoods where archaic tenancy rights made it impossible for residents to relocate to their respective segregated areas. 54 Unfortunately, the distribution of Muslim and Hindu populations within towns is not publicly released by the Census and therefore we cannot measure segregation.
More basically, the size of the minority group can increase the majority’s perception of threat—whether economic, political, or cultural. 55 Radical Hindu leaders commonly argue that high Muslim growth rates will lead to Hindus being outnumbered. 56 Indeed, areas with high in-migration of Muslims have been notable targets of previous violence, such as Aligarh city in Uttar Pradesh in 1990-91 and Surat city in Gujarat in 1992-93. 57
Hypothesis 2a: Muslims were more likely to be killed where they were a larger minority.
Hypothesis 2b: Muslims were more likely to be killed where Muslim in-migration was high.
Cultural threat is likely to be assuaged with high levels of education. Modernization theorists argue that education weakens traditional, ascriptive attachments, including those based on ethnicity. Education is associated with greater tolerance even of groups perceived as a threat. 58 Cross-national analyses find a strong inverse relationship between education and expressions of ethnic prejudice or support for the extreme right. 59 Urdal finds literacy to have a moderately inhibiting effect on riots in 13 states of India. 60
Hypothesis 3: Muslims were more likely to be killed where literacy was low.
A minority is most likely to be perceived as an economic threat by groups suffering deprivation, such as unemployment.
Hypothesis 4: Muslims were more likely to be killed where unemployment was high.
Related to economic deprivation, recent literature highlights the importance of young people being most likely to participate in violence. 61 “Youth bulges”—unusually high proportions of people in their teens and twenties in relation to the adult population– have been historically associated with political violence. 62 The English Revolution of the seventeenth century, the French revolution of the eighteenth century, Paris in 1968, Dhaka in 1971, Tehran in the late 1970s, Manila in 1986, in Tiananmen Square in 1989, and Jakarta in 1998 have all seen youth movements challenge regimes. As Huntington says, “Young people are the protagonists of protest, instability, reform and revolution.” 63 In India, youths are closely linked to student agitations on campuses. There have been many significant student protest movements, such as the agitations in Gwalior, Indore, Calcutta, Allahabad, and Jaipur in the 1950s; the Navnirman Movement in Gujarat in 1974 that led to the overthrow of the incumbent Congress government; and the antireservation movements in 1985 in Gujarat and in India in the 1990s. The agitation in Gujarat in 1985 began as an antireservation movement against Scheduled Castes, and then turned into a Hindu versus Muslim clash, claiming 150 lives. 64 Urdal’s study of Indian states finds that a youth bulge increased the risk of Hindu-Muslim rioting in the period 1956-2002.
Hypothesis 5: Muslims were more likely to be killed where there was a surplus of young adults.
3. Data and Method
Dependent variable
The dependent variable is the number of killings in Hindu-Muslim violence in Gujarat from February 28 to December 31, 2002. We choose to count fatalities rather than “riots.” Indian law defines a riot as an unlawful assembly of five or more people. 65 Countless riots occurred in this period, and many did not lead to killing. Killings have greater theoretical significance—and worse social ramifications—than damage to property. Deaths also have a methodological advantage. In the first few days of the violence, when hundreds of incidents were occurring across the state, nonlethal riots were likely to have gone unreported.
Figures provided by the government are obviously suspect. Only in 2005 did the Gujarat government, under pressure from an Indian Member of Parliament, provide an official death toll in the post-Godhra violence. 66 The official death toll (excluding the fifty-nine passengers who died in the train fire) was then 1,044: 790 Muslims and 254 Hindus. But this excluded many victims whose bodies had not yet been discovered. In 2009, after the legal period of seven years, 228 missing during the violence were officially declared dead. The final official death toll was publicized as 1,180 (again excluding the passengers). The sum (1,044 + 228) should be 1,272, but the anomaly is unexplained. The state government has admitted destroying many relevant records. 67 Advocates for victims have compiled their own figures, though these may be suspected of exaggeration. Nongovernmental organizations tend to claim a death toll of around 2,000, mostly Muslims. 68 Wilkinson and Haid take figures from the Concerned Citizens’ Tribunal, published soon after the violence. 69 We have discovered several inaccuracies. For example, the Tribunal lists “over 200 deaths” in Naroda Patiya and Gam areas in Ahmedabad city. Combing through newspaper reports, we can enumerate only 91 deaths. 70
We compile original data from the Times of India (ToI), following the procedures used by Varshney and Wilkinson to compile data on Hindu-Muslim violence in India from 1950 to 1995. 71 They chose ToI in part because “unlike several other newspapers, many a time [it] refused to run unchecked rumors about communal violence.” 72 Aside from the advantage of comparability, ToI had a wider network of reporters across Gujarat than any other English newspaper, and it checked information from the police against deaths reported in local hospitals. Indeed, ToI’s Ahmedabad edition won the nationally renowned Prem Bhatia Award for the most objective coverage of the Gujarat violence. Reading the ToI’s Ahmedabad edition from February 28 to December 31, 2002, we record all deaths resulting from Hindu-Muslim violence. (Varshney and Wilkinson use the Mumbai edition, but we found that that edition reported 9 percent fewer deaths than the Ahmedabad edition.) In addition, we update the number of deaths following subsequent legal investigations, as reported in ToI’s Ahmedabad edition, to the end of 2011. For example, twenty-seven deaths were reported in Sardarpura village of Mehsana district at the time. In 2009, this figure was revised to thirty-three. 73 If the number of deaths is not exact, we follow Varshney and Wilkinson in using the lowest number. They exclude killings where personal rivalry is the trigger. In this episode of violence, however, this distinction is impossible to draw, because the Godhra train burning overshadowed all other triggers.
Our figures are compared with others in Table 1. The first measure is used in our quantitative analysis of towns and rural areas (detailed in Appendix Table A1). The second incorporates 228 missing persons legally declared dead in 2009. This information is available only at the district level, but it is very highly correlated with the first. Our combined total of 984 is lower than the government death count of 1,180, because we always take the minimum number reported. Our measure of killings is fairly highly correlated with Concerned Citizens’ Tribunal. It is even more highly correlated with the number of Muslims killed compiled by the State Intelligence Bureau, covering the period February 27 to August 7. The Bureau was headed by a police officer who abhorred the complicity of the state government. The triangulation of our figures with the Bureau’s and the Tribunal’s increases our confidence in their reliability. Most crucially, our figures can be disaggregated below the district level, to locate violence in towns and villages. Fatalities can be compared with properties destroyed by arson, also from the Bureau. The correlation is fairly high, showing a correspondence between attacks on property and on persons.
Measures of violence in Gujarat, 2002

Correlation across 29 police districts, excluding Westpol Vadodara
Muslim population in 2001 used as denominator
Previous literature finds that Hindu-Muslim violence tends to recur in the same places over time. 74 We can compare the number of killings in each district in 2002 with the number in the violence during the Ayodhya campaign and subsequent demolition of the Babri Mosque (1990-93), the previous peak of violence in Gujarat. 75 There is a positive correlation (r = .64). 76 But this simply reflects the large number of killings in Ahmedabad in both waves of violence, which in turn reflects the fact that the city has a far higher Muslim population than anywhere else. Controlling for the Muslim population, the correlation is minimal (r = .14) and far from statistical significance (p = .49).
Method
The primary administrative unit of governance is the district, which has become the standard unit in quantitative analyses of violence in India. 77 But there were only twenty-five districts in Gujarat in 2002. Such a small number of cases poses the danger of more inferences than observations. 78 Districts are enormous, with an average population of two million, and combine rural and urban areas. Therefore we conduct analyses at the level of the town, which is the basic administrative unit for urban areas. The 2001 Census provides data on 191 towns, ranging in population from 338 to 4.4 million. Unfortunately the Census provides no detailed data on the equivalent rural unit, the village, but only on the rural population of each district. Therefore we can analyze twenty-five rural areas, ranging from 187,000 to 2.2 million. 79 These ecological units are large enough to encompass perpetrators and their victims. Although people sometimes blame violence on outsiders, this does not mean that the perpetrators traveled far. Considering Hindus convicted of killing Muslims in 2002, all thirty-two in the urban areas came from the same town as their victims; in the countryside, thirty-one of forty-two came from the same village as their victims, while eleven came from a neighboring village (in the same district). 80
The dependent variable is extremely skewed (see Appendix Table A1). Four-fifths of towns and rural areas had no killings. Ahmedabad had 279 fatalities, while rural Panchmahals had 164. We use negative binomial regression to estimate the number of deaths in each place:

where Xk are independent variables and δ is the error term, drawn from the Gamma distribution with mean of 1 and variance of α. We pool the 191 towns and twenty-five rural areas because there are no compelling theoretical reasons to expect the causes of violence to have operated differently in urban and rural areas (this assumption will be tested below). Social and economic variables, such as the proportion of agricultural laborers, measure many of the differences between town and country. (Appendix Tables A2 and A3 provide summary statistics and correlations.) Any remaining differences are captured by a binary variable coded 1 for town and 0 for rural. Muslim population is used to capture, to put it crudely, the potential number of victims. The variable is transformed by taking the logarithm, like an exposure term (though its coefficient is not constrained to one). Needless to say, this variable is strongly correlated with the logarithm of the Hindu population (r = .83).
Independent variables
To test Hypothesis 1, we examine the prior election to the Gujarat State Assembly in 1998. 81 The 182 constituencies of the State Assembly do not correspond with towns. One solution is to aggregate constituencies by district, because constituencies like towns do not cross district boundaries. BJP vote at the district level ranges from 28 percent to 59 percent. Another solution is to painstakingly match towns to constituencies, using official delimitation data. 82 Most towns form part of a single constituency (which might include other towns as well as the surrounding countryside), and thus we use the constituency’s voting returns. Six cities encompass multiple constituencies, and so we total the votes across all constituencies. For each rural area, we add the votes in all the district’s constituencies, weighted by the rural proportion of the constituency. 83 This procedure yields estimates for BJP vote ranging from 7 percent to 73 percent. Figure 1 shows the distribution of BJP vote. Following Hypothesis 1a, we expect the number of deaths to increase with BJP vote. Following Hypothesis 1b, we expect the number of deaths to peak where the BJP vote is close to the threshold of electoral victory—around 39 percent in 1998—and then would fall where the BJP vote is high enough to assure victory. 84 This is tested by adding a quadratic term.
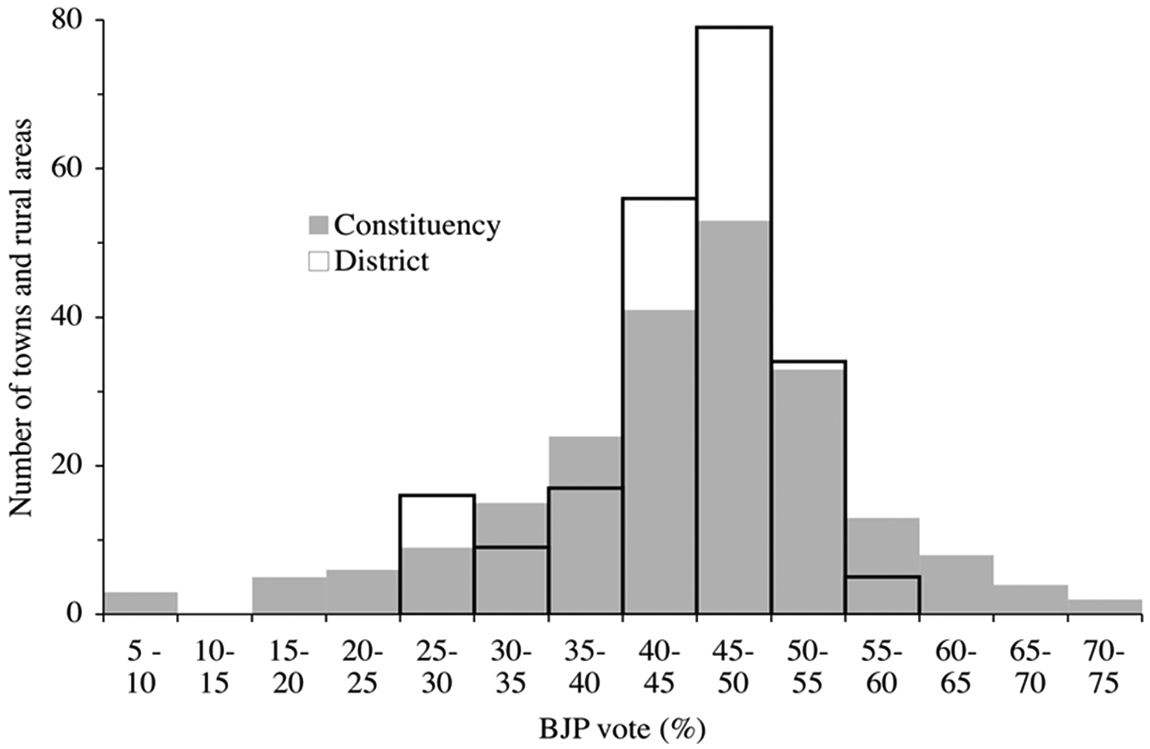
Distribution of BJP vote
In addition to voting, we also measure the presence of a BJP Member in the State Assembly in February 2002 (taking into account by-elections since the 1998 election); almost two-thirds of constituencies had a BJP Member. For most towns this variable is either zero or one. For large cities and rural areas, which spanned multiple constituencies, it is a fraction. There were nine BJP Members from Ahmedabad’s thirteen constituencies, for example, and so the variable takes the value .69. Following hypothesis 1c, we expect the presence of a BJP MLA to increase killings. 85
Hypothesis 2a is tested by the proportion of Muslims. We expect places with a higher proportion of Muslims to have more killings. Hypothesis 2b is tested using the proxy of Muslim males per 100 Muslim females, because an excess of males reveals high in-migration. 86 We expect places with high Muslim in-migration to have more killings. Hypothesis 3 is tested by the proportion of total population aged 7 and over that is literate. Hypothesis 4 is tested with the conventional division of the Indian population into two categories: “main” workers, who have worked for at least six months of the year, and “marginal” workers, who have worked for less. The reference category is nonworkers. We expect areas with more marginal workers to have more killings. The hypothesis is also tested using the four occupational categories provided by the Census. 87 Variables are entered for the proportion of cultivators (who own land), of agricultural laborers, and of household-industry workers. The reference category is “other workers,” encompassing all other occupations from factory workers to professionals. We expect a positive association between agricultural workers, the most disadvantaged occupation, and the number of killings. Hypothesis 5 is tested using the age range of 15-24 years, as conventionally used in the literature. 88 The denominator is the population aged 15 years and above, which Urdal argues is more appropriate than total population. 89 Combining Hypotheses 5 and 4, we also create a measure of youth unemployment. This is the proportion of people aged 15-24 years who are either marginal workers or nonworkers, and who are available for or seeking work. 90
The proportion of the population who are in Scheduled Tribes and in Scheduled Castes is obviously important to consider. There is no clear theoretical hypothesis, but commentators have emphasized the prominent role of both groups in this wave of violence, and so we expect a positive association. 91
All these political, social, and economic variables are far removed from the heightened emotions in the days after the Godhra incident. Seeking to measure this emotional impact, we take the initial report of karsevaks dying on the train, published by the state’s major vernacular newspaper on February 28, from information provided by the VHP. 92 Fifty victims were identified, from five districts (including Ahmedabad) concentrated in the center and east of Gujarat. We calculate the number of victims per million Hindus in each district. These districts had no higher BJP vote than average. If this variable captures the emotional impact of the triggering incident, then we expect a positive association with killings.
5. Results
Tables 2 and 3 show the results. The exponent of the coefficient is taken to yield the incidence-rate ratio. For independent variables measured as a percentage, this ratio estimates how much a change of one percentage point in the independent variable would multiply the predicted number of killings. Because observations within the same district are not necessarily independent, robust standard errors are estimated, clustering on district. Models can be compared using the corrected AIC, which is most appropriate for a modest number of observations. 93 The high value of α reveals pronounced overdispersion (compared to a Poisson distribution, which would be indicated by α = 0), even controlling for Muslim population. This is evidence for positive feedback: every killing increased the probability of further killings in the same place. 94
Deaths in Hindu-Muslim violence in Gujarat’s towns and rural areas, 2002 (N = 216)

irr: incidence-rate ratio; se: robust standard error (adjusted for clustering by district); p: p-value (two-tailed), ***p < .001, **p < .01, *p < .05
Deaths in Hindu-Muslim violence in Gujarat’s towns and rural areas, 2002 (N = 216)

irr: incidence-rate ratio; se: robust standard error (adjusted for clustering by district); p: p-value (two-tailed), *** p < .001, ** p < .01, * p < .05
Model 1 (in Table 2) begins with social and economic variables. Killings increased with the Muslim population, as would be expected. The increase was notably disproportionate. (A proportionate effect would mean an incidence-rate ratio of e1 = 2.7, which can be rejected at p < .001.) A tenfold increase in Muslim population multiplied the predicted number of killings by nineteen. Hypothesis 2a is not supported, as the proportion of Muslims had no effect. 95 Hypothesis 2b is strongly supported. Killings increased with inward migration, as indicated by the Muslim sex ratio. Hypothesis 3 is contradicted, as literacy actually increased the predicted number of killings. Hypothesis 4 is supported in one respect. The predicted number of killings increased where more people were marginal workers. The proportion of agricultural laborers, however, has no effect. 96 Hypothesis 5 is not supported, for the youth bulge had no discernible effect. Scheduled Tribes and Scheduled Castes defied expectations, because the presence of each reduced the predicted number of killings. These social and economic variables leave a large differential between urban and rural areas, revealed by the variable for towns. This binary variable is a partial effect, of course, which must be interpreted alongside the other variables. Rural areas generally had a higher proportion of marginal workers, which increased the number of killings. The overall death rate (per Muslim population) was almost identical between rural and urban Gujarat.
BJP vote in the 1998 election is added in Models 2 to 6. The results for social and economic variables remain broadly similar to Model 1. Two further variables emerge as statistically significant in some of the models. The proportion of youths increased the number of killings, supporting Hypothesis 5 (in Models 4 to 6). The proportion of workers in household industry reduced the number of killings (in Models 2, 3, 6).
Model 2 aggregates BJP vote at the district level, while Model 3 approximates the constituency. Measured either way, BJP vote has a powerful nonmonotonic effect, following Hypothesis 1b and contradicting Hypothesis 1a. Figures 2 and 3 compare the association between killings and the percentage voting for the BJP, controlling for social and economic factors. 97 The vertical axis on the left measures the incidence-rate ratio, calibrated to Gujarat’s overall BJP vote of 44.7 percent (where the rate is one, shown by the faint dotted line). The vertical axis on the right measures the predicted number of deaths, setting the Muslim population at 50,000 and all other variables at the median. Curves trace the observed range of BJP vote, which naturally is narrower for districts. Diamonds indicate values for districts (each comprising multiple observations) in Figure 2; vertical bars show values for constituencies in Figure 3. Where the BJP was weakest, fewer than average killings would be predicted, as expected. Where the BJP was strongest, however, even fewer killings would be predicted, in accordance with Hypothesis 1b. Muslims were most vulnerable in a district where the BJP gained about 36 percent of the vote or a constituency where it gained 33 percent. This is just under the threshold at which the party had a better than even chance of winning a State Assembly seat in 1998, which had been 39 percent. Note that the percentage voting for the BJP is not simply the inverse of the percentage voting for Congress (r = -.42), because one in five votes went to minor parties. A variable for Congress (whether alone or with a quadratic term) has no effect.

Association between BJP vote and killings (Model 2)

Association between BJP vote and killings (Model 3)
While BJP vote has a similar nonmonotonic effect whether measured at the district or constituency level, the former yields a better fit (the corrected AIC for Model 2 is lower—better—than for Model 3). This finding suggests that violence was orchestrated to target districts where the BJP anticipated fierce competition in the forthcoming election. Within Gujarat, the district is the basic division, and so is the natural unit of party administration; district boundaries also circumscribe police districts. Model 4 (in Table 3) augments Model 2 by adding a variable for the presence of a BJP Member of the Legislative Assembly. Hypothesis 1c is contradicted, because the presence of a Member reduced the predicted number of killings, by a factor of almost four. Violence was less likely to occur in constituencies already controlled by the BJP. This parallels the finding that killings were lowest where the BJP vote was highest.
Model 5 adds a variable indicating the emotional impact of the triggering event. Killings increased with the number of karsevaks from the district who died at Godhra. At maximum (5.7 per million Hindus), this would multiply the number of killings sixfold, compared to the majority of districts where no karsevaks had died. The addition of this variable does attenuate the effects of marginal workers, which are no longer statistically significant. Now the proportion of Muslims is statistically significant, though the direction contradicts Hypothesis 2a. Muslims were most vulnerable where they formed a smaller minority. The nonmonotonic effect of BJP vote is depicted in Figure 4. The vertical axis on the right measures the predicted number of deaths, setting the Muslim population at 50,000 and all other variables at the median (exactly comparable to Figure 2). The faint dotted line again marks the BJP’s vote in Gujarat. The two curves distinguish the effect of a Member from the BJP, though this is not quite statistically significant at the .05 level.

Association between BJP vote and killings (Model 5)
These results can be probed for robustness. Are they unduly influenced by Ahmedabad, which had by far the highest number of killings? Adding a binary variable for this city to Model 5 suggests that the city had four times more killings than otherwise predicted. The addition barely alters the other effects. Do results depend on inclusion of so many social and economic variables? We use stepwise backward negative binomial regression, removing variables from Model 5 if p > .10. This yields Model 6. The results are very similar. The proportion of main workers is now significantly negative, reinforcing Hypothesis 4. The proportion of workers in household industries also has a statistically significant and negative effect. We speculate that this might capture a particular caste configuration in the district of Bhavnagar, where a subcaste of Rajputs works with Muslims in household industries (this will be discussed further in the conclusion). 98 Did rural areas differ systematically from towns? We take Model 6 and add interaction terms between each variable and the binary variable for towns. Only one difference is statistically significant: the negative effect of Muslim percentage is still more pronounced in rural areas. This is the product of two observations, Panchmahals and Dahod, with a high rate of killing and a low proportion of Muslims.
Finally, we can use a hurdle model to differentiate two separate processes in Model 6. First, whether any deaths occurred, identical to logistic regression on a binary variable. Second, if deaths occurred, how many occurred, estimated with truncated negative binomial regression. 99 In the first process, BJP vote has the familiar nonmonotonic effect (the hypothesis that both coefficients are zero is rejected at p = .002). Killing was most likely to occur where the BJP vote was 35 percent: this multiplied the odds by 2.8 compared to the state average (44.7 percent). Where the vote reached its maximum, 59 percent, killing was least likely: this multiplied the odds by .006. The second process is estimated with only forty-six non-zero observations, which of course—given the first part of the model—do not span the full range of BJP vote (killings did not occur in any district with more than 50 percent voting for the BJP). We cannot reject the hypothesis that BJP vote had no effect in the second part (p = .43), and likewise cannot reject the hypothesis had it had the same effect in the second part as in the first (p = .40). Indeed, we cannot conclude that any single coefficient is different in the second part than in the first part of the model. Because the hurdle model doubles the number of parameters, the corrected AIC (421.6) reveals that it is inferior to negative binomial regression.
In sum, then, various models yield a consistent set of findings. The larger the concentration of Muslims, and the greater the flow of inward Muslim migration, the greater the violence (Hypothesis 2b). The greater the proportion of marginal workers, and the lower the proportion of main workers, the greater the violence (Hypothesis 4). A closer connection to the triggering event increased violence. Most importantly, violence was worst in districts or constituencies where the BJP faced the greatest electoral competition; paradoxically, Muslims were least vulnerable where the BJP was dominant (Hypothesis 1b).
6. Discussion
Before discussing our results, we should emphasize their limitations. Most importantly, the data are ecological, and the units of analysis are huge. The Census provides only a limited range of social and economic data. What is most frustrating is that we have no data to test Varshney’s theory of inter-ethnic associations. Despite these limitations, our quantitative analysis has the advantage of systematically comparing places where killings did not occur as well as where they did.
Our findings are unexpected in several respects. Violence was higher where Scheduled Castes and Tribes constituted a smaller proportion of the population. Yet literature on 2002 has emphasized the part played by “Hindutvaised” Scheduled Tribes in rural areas and Castes in urban areas. There is no necessary contradiction, but our results highlight the danger of implying that most Tribes and Castes participated in violence. 100 We suggest that the Sangh Parivar’s attempts at Hindutvaisation—branding Muslims as oppressors of Castes and Tribes—were most likely to succeed when these subordinated groups were too small a minority to forge their own class or clan interests. In a study of anti-Muslim violence in Bharuch district in 1993, Pinto suggests that numerically strong Tribes of Valia subdistrict did not participate in the violence, unlike their counterparts in Dediapada and Sagbara subdistricts, because of their strong class identity: they viewed Hindus and Muslims alike with suspicion. 101 Tribes in all these subdistricts abstained from violence in 2002. Although almost all the perpetrators of violence remain unidentified, recent convictions for murder in 2002 reveal the involvement of upper castes. Out of 74 Hindus convicted of killing Muslims in 2002, 53 are upper-caste Patidars. 102
Another unexpected finding is that literacy did not reduce violence and indeed possibly increased it. The impact of education in eroding ethnic prejudice has found immense cross-national empirical evidence in studies of race and prejudice. Of course, literacy indicates only a bare minimum of education. 103 Nevertheless, we suggest that this finding accords with the vast qualitative literature that highlights the ethnocentric content of schooling since the BJP came to power in Gujarat in 1995. Comparisons have even been made with the educational systems of Nazi Germany and Hutu-dominated Rwanda. 104 More broadly, recent research on less developed countries finds that increased human capital does not produce more secular attitudes; if anything, it strengthens ethnic identification. 105
Literacy can also be interpreted as a proxy for economic development. 106 There is no indication, then, that development reduces violence. Economic deprivation, however, does increase it. The greater the proportion of people who worked for less than six months, and the higher the unemployment rate among young adults, the worse the violence. This finding suggests that where competition for jobs is more severe, Hindus are more likely to blame Muslims for their plight. Even if the urban middle classes take the lead in planning and coordinating violence, they often depend on a reserve of unemployed and underemployed people to do the actual killing—perpetrators are often paid in money, liquor, or kerosene. 107
Our findings provide further evidence for the BJP’s crucial role in orchestrating the violence. This is not surprising, given the weight of qualitative evidence, and the arguments of scholars like Brass and Wilkinson. What is less obvious, however, is that violence was actually lowest in constituencies or districts where the BJP had won a majority of voters in 1998. By implication, the party had the power to prevent as well as inflame violence. Violence was highest in constituencies or districts where the BJP could expect to face the most intense competition in the forthcoming election. The party apparently anticipated benefitting from the violence, because in July the Chief Minister resigned and dissolved the State Assembly in an attempt to precipitate an early election—nine months before elections were scheduled. The Chief Election Commissioner imposed a delay, and the election was held in December 2002.
Did violence actually help the BJP? Opinion polls conducted after the election indicated that a quarter of BJP voters were influenced by the riots and security issues rather than livelihood and development. 108 We can investigate this systematically by investigating how the BJP’s vote share changed from 1998 to 2002. The unit of analysis is the district. Although thousands of Muslims had not returned to their homes by December, they generally remained within the same district, and thus electoral results should not have been affected by the exodus of refugees. The independent variable is the total number of killings expressed as death rate per 1,000 Muslim population. 109 Figure 5 shows a very strong positive correlation, with r = .81. 110 The regression coefficient predicts that moving from the median death rate (.023) to the 90th percentile (.600) would increase BJP vote by more than 12 percentage points. One district, Panchmahals, had a much higher death rate than any other, but removing it barely weakens the strength of the association (illustrated by the broken line). The result is not altered by adding the variable for karsevaks who died at Godhra, which had no effect. In short, there is strong quantitative evidence that violence did in fact yield electoral rewards for the BJP.
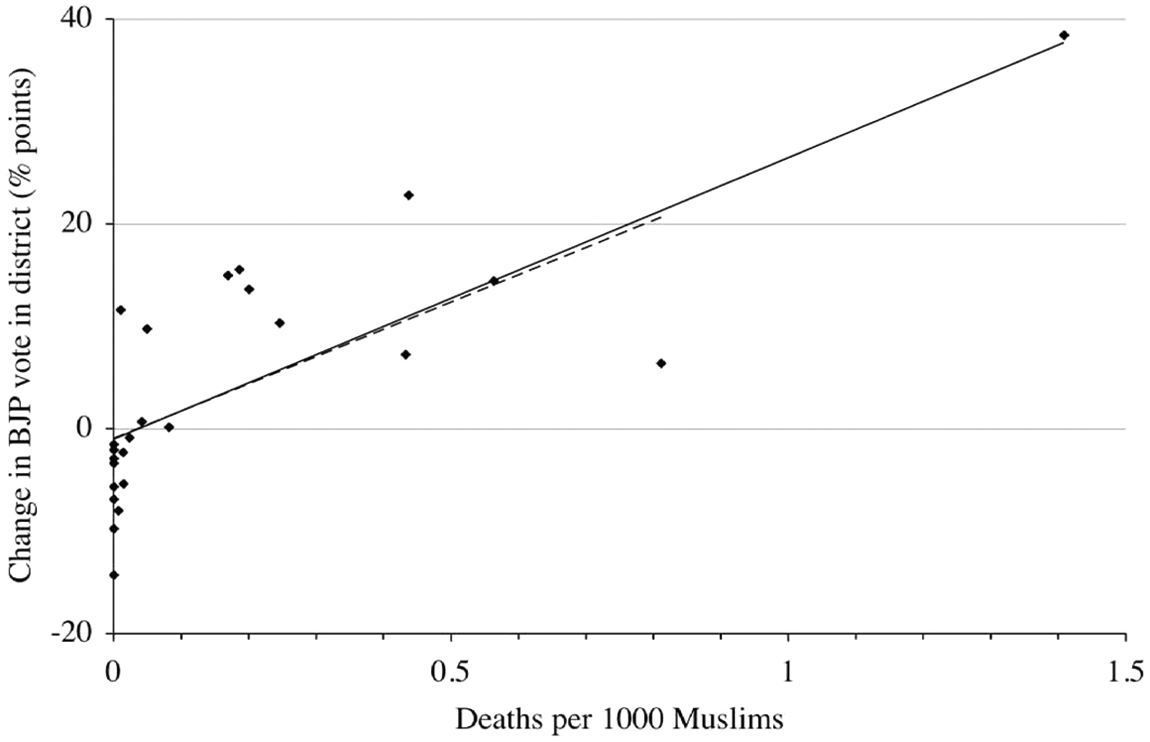
Association between killings and change in BJP vote, 1998 to 2002
One final effect of violence can be traced. There are many allegations that the state government rewarded police officials who had permitted violence, while punishing those who repressed it. This can be tested using an affidavit recently submitted by the former chief of the State Intelligence Bureau. 111 He provides detailed information on police chiefs who were promoted or demoted in the aftermath of the violence. 112 We use this to construct an ordinal variable for twenty-nine police districts: six with promotion, fifteen with no action, and eight with demotion. As above, the independent variable is the total number of killings expressed as death rate per Muslim population. Ordinal logistic regression reveals a strong association (p = .005). In a police district with no killings, the predicted probability of demotion is .43 and of promotion is .04. In a police district with a high death rate like Ahmedabad city (the third most violent), the predicted probabilities are .01 and .85 respectively.
7. Conclusion
The terrible violence that occurred in Gujarat in 2002 demands explanation, as one of the worst episodes of ethnic violence that has occurred under a democratic government. Although most observers argue that the state government was complicit—at least—in the killings, this does not explain why violence varied so widely across the state. Having compiled detailed data on the number of killings in each town and in the rural portions of each district, we can systematically investigate which social, economic, and political factors were associated with violence. Our findings provide an important corrective to studies that emphasize Scheduled Castes and Tribes as perpetrators of violence, because places with a higher proportion of these groups tended to have fewer killings. Violence increased with demographic threat, as indicated by the size of the Muslim population and the rate of Muslim in-migration. Violence also increased with the proportion of young people and with economic deprivation, specifically underemployment and youth unemployment. Places with higher literacy, however, were no less prone to violence. Above all, our findings reiterate the importance of political elites, while uncovering an implicit logic behind the BJP’s political strategy. The party did not foment violence in places where it had sufficient support to win the forthcoming election. Muslims were most vulnerable where the BJP had previously won around 33-36 percent of the vote, indicating that the party had to attract more voters to secure victory at the next election. We also demonstrate that violence did indeed boost the BJP’s vote in the subsequent election.
Our findings pertain to a particular context, of course. This context included an unusually troubled history of Hindu-Muslim relations, a governing party that could gain from accentuating ethnic identity, and a horrific triggering incident. These particularities must be taken into account when applying our findings to other Indian states and to other democratic polities. We hope that future investigations will analyze the magnitude of violence rather than simply the occurrence of a riot. Although the literature emphasizes how violence can be triggered by trivial incidents (as in 1969 in Ahmedabad city), not all cases conform to this pattern. Another example is the massacre of Sikhs in 1984 following the assassination of the Indian prime minister by Sikh bodyguards. In such cases it is crucial to take into account, as we have attempted here, how the emotional impact of the precipitating event varied across space.
Future research should analyze more subtle social indicators. One obvious task is to measure the strength of associational ties between Hindus and Muslims. Another is to incorporate some of the intricacies of caste identities, beyond the simple classification of Scheduled Castes and Tribes. It is notable that the peninsular region of Gujarat—Saurashtra—did not witness large-scale violence in 2002. Before 1948, this region was a mosaic of princely states dominated by Rajput families. They constructed political alliances that excluded upper-caste Hindus (Vaniyas and Brahmins) but often extended to powerful Muslim families, formerly Mughal nobles. 113 We conjecture that this historical legacy helped protect Muslims from violence in areas with a substantial presence of Rajputs. This seems true for Bhavnagar district where the Mahyavanshis, a Rajput subcaste notified as a Scheduled Caste, is found to dominate household industries. A horizontal alliance between Rajputs and Muslims can be speculated in this case. Future research could test this conjecture by mapping the detailed caste classifications provided by the 1931 Census (or the 2011 Census, when it becomes available).
Finally, the systematic analysis of spatial variation in violence should be extended to a local level. Ahmedabad is treated here as a single observation, with one of the highest rates of killing. 114 Across the city, however, there was enormous variation among neighborhoods. Some places were almost entirely peaceful, while others witnessed large-scale massacres. For example, within the electoral ward of Behrampura, the heterogeneous neighborhoods of Ram Rahimnagar and Santoshnagar behaved differently; one was peaceful, the other violent. In Naroda ward, the Muslim neighborhood of Naroda Patiya on one side of the main road was violent, whereas the same neighborhood located across the road was peaceful. Future research should investigate these local variations. At this scale, it will be feasible to combine quantitative analysis with ethnographic investigation. Certainly both methods are necessary to fully explain such outbreaks of savage violence, and thus to enhance our understanding of the threats to India’s multiethnic democracy.
Footnotes
Appendix
Correlation matrix
| Correlations |
|||||||||||||||||||||
|---|---|---|---|---|---|---|---|---|---|---|---|---|---|---|---|---|---|---|---|---|---|
| Variable | (1) | (2) | (3) | (4) | (5) | (6) | (7) | (8) | (9) | (10) | (11) | (12) | (13) | (14) | (15) | (16) | (17) | (18) | (19) | (20) | |
| (1) | Deaths in Hindu-Muslim violence | ||||||||||||||||||||
| (2) | Muslim population, logged | .23 | |||||||||||||||||||
| (3) | Muslims as % of population | −.07 | .35 | ||||||||||||||||||
| (4) | Muslim males per 100 Muslim females | .05 | −.28 | −.32 | |||||||||||||||||
| (5) | Literates as % of population aged 7 and over | −.03 | −.19 | −.06 | .19 | ||||||||||||||||
| (6) | Scheduled Castes as % of population | .01 | .09 | −.06 | −.14 | −.09 | |||||||||||||||
| (7) | Scheduled Tribes as % of population | .03 | .01 | −.17 | .17 | −.12 | −.29 | ||||||||||||||
| (8) | Main workers as % of population | .00 | −.22 | −.41 | .38 | −.08 | −.32 | .14 | |||||||||||||
| (9) | Marginal workers as % of population | .16 | .28 | −.21 | −.04 | −.54 | −.10 | .40 | .08 | ||||||||||||
| (10) | Agricultural laborers as % of population | .04 | .23 | −.20 | −.08 | −.40 | −.08 | .29 | .20 | .76 | |||||||||||
| (11) | Cultivators as % of population | .15 | .31 | −.26 | −.07 | −.55 | −.03 | .36 | .19 | .84 | .72 | ||||||||||
| (12) | Household-industry workers as % of population | −.03 | .00 | .10 | −.13 | −.09 | .03 | −.11 | −.18 | .06 | −.08 | −.09 | |||||||||
| (13) | Unemployed aged 15-24 as % of population aged 15-24 | .10 | −.04 | .00 | −.02 | −.01 | .09 | .03 | −.24 | .12 | −.01 | .00 | −.03 | ||||||||
| (14) | Aged 15-24 as % of population aged 15 and over | −.08 | −.07 | .09 | −.18 | −.08 | .26 | −.41 | −.18 | −.25 | −.25 | −.18 | .10 | −.31 | |||||||
| (15) | Town | −.14 | −.43 | .26 | .03 | .52 | .04 | −.39 | −.26 | −.77 | −.66 | −.85 | .10 | .04 | .29 | ||||||
| (16) | BJP % of vote in district | −.09 | −.01 | −.09 | −.09 | −.09 | .16 | −.24 | .15 | −.22 | −.12 | −.10 | .10 | −.35 | .20 | 0.08 | |||||
| (17) | BJP % of vote in district, squared | −.08 | −.01 | −.08 | −.10 | −.09 | .15 | −.22 | .14 | −.21 | −.11 | −.09 | .10 | −.35 | .19 | .07 | 1.00 | ||||
| (18) | BJP % of vote in constituency | −.03 | −.06 | −.18 | .08 | .07 | .07 | −.20 | .08 | −.22 | −.23 | −.13 | .06 | −.06 | .03 | .10 | .52 | .52 | |||
| (19) | BJP % of vote in constituency, squared | −.03 | −.08 | −.18 | .06 | .08 | .05 | −.21 | .08 | −.21 | −.22 | −.14 | .06 | −.05 | .04 | .12 | .50 | .51 | .97 | ||
| (20) | BJP member in constituency | −.05 | −.02 | −.12 | .08 | .02 | .03 | −.22 | .07 | −.16 | −.17 | −.11 | .05 | −.10 | .03 | .08 | .40 | .39 | .66 | .63 | |
| (21) | Deaths at Godhra per million Hindus in district | .18 | .05 | .01 | −.03 | .11 | .06 | −.16 | −.06 | .09 | .10 | −.03 | .03 | .32 | .03 | .00 | −.18 | −.20 | −.20 | −.19 | −.16 |

Acknowledgements
We are grateful to Ashutosh Varshney and Steven Wilkinson for providing their dataset for 1950-1995, R. B. Sreekumar for documents from the Gujarat Intelligence Bureau, the Election Commission of India (Gujarat) for constituency data, and Craig Finlay and Mark Janes for acquiring Census data. The Times of India (Mumbai and Ahmedabad) kindly gave access to their archives. Robin David, Manali Desai, Faisal Devji, Christina Fuhr, David Gellner, Heather Hamill, Anthony Heath, Alistair MacMillan, Lucia Michelutti, Colin Mills, and A. M. Shah provided valuable comments.
Declaration of Conflicting Interests
The author(s) declared no potential conflicts of interest with respect to the research, authorship, and/or publication of this article.
Funding
The authors declared the following financial support for the research, authorship, and/or publication of this article: The first author received the Sociology Doctoral Studentship from Nuffield College, Oxford.