



Abstract
This study tests hypotheses based on crime pattern theory: (a) There are associations between parolee recidivism and property, drug, and violent crime hotspots within 1,200 feet of their residences; (b) these effects are uneven, with smaller associations found closer to the parolee residence. Survival analysis was conducted on arrests for 1,632 parolees released from New Jersey prisons, between July 2007 and June 2009, and who spent time in Newark. The research provides some qualified support for an association between local crime hotspots and parolee recidivism, though significant associations were sparse. Associations close to home were entirely absent.
Introduction
Research on parolees has begun to examine the influence of geographical factors on recidivism. In particular, it has examined the role of neighborhood-level variables that draw on social disorganization theory and its descendents (Hipp, Petersilia, & Turner, 2010; Kubrin & Stewart, 2006; Morenoff, 2011). However, few studies have examined how local crime opportunities may influence parolee recidivism, such as those suggested by environmental criminology (Wortley & Mazerolle, 2008). A key exception is an earlier study by the current authors that examined whether particular kinds of places (including bars, liquor stores, restaurants, public transport hubs, drug markets) were associated with parolee recidivism—apparently they were not (Miller, Caplan, & Ostermann, 2016). The present study takes a different approach to measuring crime opportunities by examining the associations of local crime hotspots with parolee recidivism. Hotspots have been the focus of significant attention, particularly within environmental criminology and crime analysis (Clarke & Eck, 2005; Wortley & Mazerolle, 2008). However, research has been concerned primarily with explaining their causes and origins (Eck, Chainey, Cameron, Leitner, & Wilson, 2005) or their role in anticipating future crime (Chainey, Thompson, & Uhlig, 2008). Rarely have they been used to explain individual offending behavior. This article, however, considers whether crime hotspots, when located near parolees’ residences, may impact their offending patterns, using data on parolees in Newark, New Jersey.
Prior Literature
Geography and Offender Recidivism
As previously described in Miller et al. (2016), prior studies have examined the relationship between geography and the recidivism of offenders on community corrections supervision relying on neighborhood-based theories such as “social disorganization theory” (Shaw & McKay, 1931), “broken windows” theory (Kelling & Coles, 1998; Wilson & Kelling, 1982), and research on “collective efficacy” (Sampson, Raudenbush, & Earls, 1997). In line with these theories, parolee failure is variously predicted by measures such as disadvantage, residential stability, inequality, and social disorder (Hipp et al., 2010; Kubrin & Stewart, 2006; Morenoff, 2011). However, there has been limited consideration of the influence of localized crime opportunities. According to environmental criminology, opportunities arise from the pattern of victims’ and offenders’ routine activities (Cohen & Felson, 1979), the layout and land use of geographical spaces (Brantingham & Brantingham, 1995), and situational characteristics that influence offender decision making (Clarke, 2009; D. Cornish & Clarke, 1986). Concentrations of crime opportunities, accessible to a parolee, may influence their likelihood of offending. Brantingham and Brantingham’s (2008) crime pattern theory describes how the “activity space” of an offender is structured by the key settings or “nodes” of their daily activity including home, work, school, sites of shopping and entertainment areas. It is also shaped by the paths they travel between nodes as part of their daily routine, and their “search” activities at the boundaries of these spaces. Nodes, paths, and search areas become crystallized in an offenders’ “awareness space” (Brantingham & Brantingham, 2008), and offending will tend to occur when this space overlaps with local crime opportunities, and where there are cues to those opportunities that offenders can read.
The only existing study to investigate the influence of local crime opportunities on parolee failure is our own (Miller et al., 2016). We found very limited evidence for associations between potentially criminogenic places (such as bars, liquor stores, restaurants, public transport hubs and drug markets) near a parolee’s residence and their subsequent failure. However, we questioned whether our measures of crime opportunities were entirely valid. Research suggests that crime incidents tend to be unevenly distributed across similar types of potentially criminogenic locations (e.g., Eck, Clark, & Guerette, 2007), likely because of local variations in criminogenic circumstances (Clarke & Eck, 2005; Cohen & Felson, 1979; Felson, 1995). Our previous measures did not reflect this variation. By contrast, crime hotspots may offer a more valid measure because they correspond directly with underlying crime risks.
Hotspots
Hotspots represent localized clusters of crime events that tend, in turn, to arise as a direct consequence of concentrations of crime opportunities (Eck et al., 2005; Sherman, Gartin, & Buerger, 1989). They are found at particular places, such as certain street corners, street segments, city blocks, or across larger neighborhood areas (Clarke & Eck, 2005; Eck et al., 2005; Sherman et al., 1989; Weisburd & Eck, 1995). This may contrast with the patterning of community-level crime causes invoked by neighborhood theories (Block & Block, 1995; Eck et al., 2005). As St. Jean (2007) has observed, among blocks lacking collective efficacy and with high levels of social disorder, crime is not universal, but concentrates in pockets that may correspond to local businesses, neighborhood markets, check-cashing centers, or bars.
Brantingham and Brantingham’s (1995, 2008) crime pattern theory suggests hotspots often correspond to “crime generators” or “crime attractors.” The former are places such as public transport stations, shopping malls, entertainment locations, schools, or parks to which large numbers of people are attracted for reasons unrelated to crime, but nonetheless provide opportunities for people to commit crime (Bernasco & Block, 2011; Brantingham & Brantingham, 2008, 1995; Clarke & Eck, 2005). The latter are places such as drug markets, prostitution areas, or bars that directly attract motivated offenders because they have a concentration of targets that are inadequately protected (Brantingham & Brantingham, 1995, 2008; Clarke & Eck, 2005). Routine activity theory focuses attention on the regulation of behavior at particular locations by crime controllers, which may include “guardians,” who protect the potential victims or targets of predatory crime; “handlers,” who exert control over a potential offender because of a social or familial relationship; and “place managers” (Eck, 1994; Felson, 1995), who are designated with overseeing particular places including the behaviors that take place within them, such as landlords, bar staff or bus drivers. And hotspot formation may owe something to the presence or absence of “facilitators” in and around particular locations (Clarke, 2009; Clarke & Eck, 2005) that could include tools used in the commission of crimes, such as guns (Lester & Murrell, 1981, 1982), rewards, or encouragement for criminal acts—for example, from the presence of gangs or unsupervised youth, or the consumption of alcohol or drugs that allow potential offenders to ignore risks or moral prohibitions associated with crimes (Clarke & Eck, 2005).
The Home Node
We focus our attention in this study on where the offender lives, or the “home node” (see also Miller et al., 2016). While this represents just one among a number of places where an offender spends time, we would nonetheless expect it to be one of the most central nodes in an offender’s activities. It also has major practical relevance: Parole officials tend to evaluate intended home addresses according to their proximity to criminogenic places such as known gang territories or open-air drug markets, as well as schools, playgrounds, or other restricted areas (Harries, 2002). An understanding of the influence of hotspots on recidivism could significantly contribute to this kind of assessment. Furthermore, it may be the only activity node that can be systematically identified, relying as it does exclusively on parolee address information, which is routinely recorded on administrative databases.
Given the centrality of the home node, it is not surprising that crime events tend to be spatially biased toward it. They tend to follow a distance decay function from the home location reflecting a “least effort” (Rossmo, 2000; Rossmo & Rombouts, 2008; Zipf, 1949) or “utility maximizing” decision principle (Bernasco, 2010). For example, research by Bernasco (2010), examining arrests within different postal code areas of the Netherlands (generally less than half-a-mile squared in urban areas), the current home area of the offender is far more likely to be chosen for a crime than an area they have never lived.
Consistent with crime pattern theory is the idea that criminal activity will be moderated by the presence (or absence) of crime opportunities in an offender’s awareness space. However, crime pattern theory also suggests that offenders limit their offending very close to their home, to avoid the risk of being recognized, which may moderate these effects somewhat. Some research supports the existence of this kind of “buffer zone” of reduced offending around the home. The size of these buffer zones is not consistent across studies. Turner (1969), examining burglaries by Philadelphia delinquents, noted a peak in burglaries about a block’s distance from their residences, with very little activity in the intervening area. Similarly, Canter and Larkin (1993) analyzing the offending patterns of British rapists, found evidence of a “safe area” of at least 0.61 miles around their homes, with the average minimum distance from crime to home being 1.53 miles. More recently, Sorensen (2005) showed a reduced probability of residential burglary in the evidence in the first 500 meters from home, for a sample of convicted Danish burglars. Other research finds little evidence of a buffer zone, including a study of nonlethal violence in Chicago (Block, Galary, & Brice, 2007) and rape in London (Davies & Dale, 1995). Variations in study results may reflect in part the analytical approach taken. For example, buffers may show up when serial offenders are analyzed individually but not when crime incidents are analyzed in the aggregate (Block et al., 2007), in part because buffer zones vary in size according to individual travel patterns (Warren et al., 1998).
Overall, the existence and size of buffers probably vary according to variables relating to the offender, the offense, and the geographical context for crime opportunities. In turn, these may affect the perceived likelihood of detection by an offender, the distances travelled as part of their routine activities, and the distribution of crime opportunities.
The Present Study
This research examines the statistical associations between the presence of crime hotspots within the parolee’s home node and parolee recidivism. The specific hypotheses addressed in this research are as follows:
The hypotheses are tested in the context of Newark, New Jersey. The city has an estimated population of 278,154 in 2009, about half of whom are black and a third Latino (U.S. Census Bureau, 2011). It has high levels of disadvantage, with 24.3% of residents living below the poverty line, compared with 8.8% for the state as a whole (U.S. Census Bureau, 2011). Newark is also New Jersey’s largest sender and receiver of prison and jail inmates.
Method
Data
The analysis focuses on a cohort of New Jersey parolees previously detailed in Miller et al. (2016). This cohort returned from prison to the community under parole supervision between July 2007 and June 2009. They also spent some time living in Newark while on parole in the subsequent period up to April 30, 2010, based on New Jersey State Parole Board records. While the full cohort numbered 2,880, the present study narrowed its focus to 1,632 parolees (56.7% of the total cohort). The final study cohort excluded about a third of cases because they fell within a distance shorter than 1,240 feet of the edge of the study area boundary, making it impossible to calculate the influence of nearby hotspots that might have existed in neighboring municipalities for which we did not have data. The study cohort additionally excludes cases with missing data on key variables, the most common reason for which were cases that were without a Level of Service Inventory–Revised (LSI-R) risk score, making up about one in six of the full cohort.
Data on variables relating to parolee characteristics, release dates, residential episodes, addresses, criminal histories, patterns of rearrest, and returns to custody following revocations were obtained from state databases maintained by or accessible to the New Jersey State Parole Board. These sources provide comprehensive information on events within the state of New Jersey, though exclude arrests or convictions outside. From these data, residential address information was geocoded to street centerlines in Newark, with a 98% match rate, substantially above the minimum reliable geocoding hit rate of 85% suggested by Ratcliffe (2004).
Information on crime hotspots was generated from Newark Police Department (NPD) crime and arrest data. Specifically, we focused on three types of hotspot—violent, property, and drug, speculating that each of their effects would provide different kinds of crime opportunities that might vary in their relevance to Newark parolees. We also focused on calendar year 2008, approximating the midpoint of the study cohort’s time in the community (though visual inspection of both 2007 and 2009 shows reasonable consistency in hotspot patterns between time periods). Violent crime hotspots were identified using NPD recorded incidents of murder, rape, robbery, and aggravated assault. Property crime hotspots were identified using NPD recorded crime incidents of theft, burglary, auto theft, and theft from auto. Drug-crime hotspots were identified by analyzing the geographical pattern of NPD recorded drug arrests from 2008. The recording of drug crime is notoriously susceptible to police activity, making recorded crime little different from police arrest data. A focus on arrests allows us to capture the location of open-air drug market crime hotspots that tend to be the target of police activity—which likely represent some of the most conspicuous and accessible crime opportunities for parolees. Drug arrest locations are commonly used as a measure of drug activity (Jacobson, 1999; Weisburd & Green, 1994, 1995).
Kernel density maps were produced to represent the hotspots (Braga & Weisburd, 2010; Eck & Weisburd, 1995; Groff & La Vigne, 2002) using ArcGIS 10. Consistent with the work of Weisburd, Bruinsma, and Bernasco (2009) and others (e.g., Caplan et al., 2011), the raster cell size was selected as a function of street segments: about half the mean block length in Newark, or 155 feet. A search radius (bandwidth) of 1,240 feet was selected based upon empirical research suggesting that behavior settings, which are “regularly occurring, temporally and spatially bounded person-environment units,” typically comprise up to just a few street blocks (Taylor, 1988; Taylor & Harrell, 1996). Density values were classified according to standard deviational breaks, and hotspots were operationalized as areas with density values greater than +2 standard deviations from the mean density value—which statistically puts these areas in the top 5% of the most densely populated with violent, property, or drug crimes, respectively. Figure 1 shows the contours of these hotspots. It is notable that, in many cases, hotspots are quite expansive, extending across multiple city blocks. This reflects a tendency found in Newark for crime to concentrate around spatially contiguous locations.
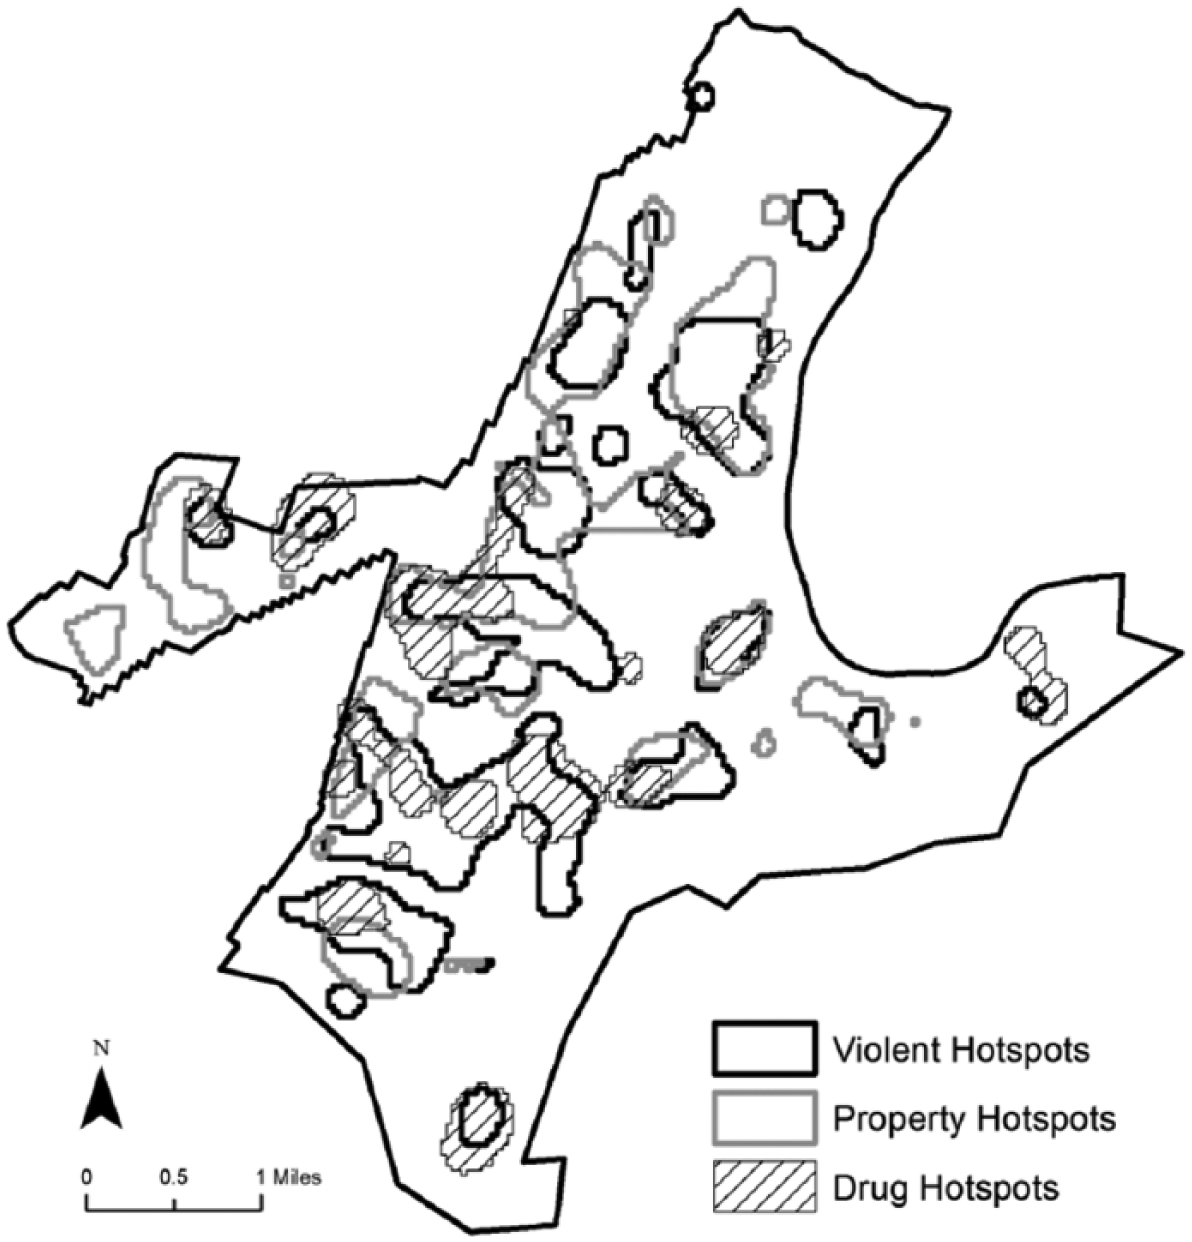
Hotspots of violent, property and drug crime in Newark, 2008.
Finally, tract level census data were obtained from the 2000 U.S. census to develop neighborhood measures related to social disorganization, also used in the analysis.
Analytic Strategy
The assessment of hotspot effects relied on multivariate Cox proportional hazards survival models of parolee failure (Cox, 1972), following the same approach taken by Miller et al. (2016). The models analyzed 2009 residential episodes nested within the 1,632 parolees within the cohort. Cox regression is a semiparametric technique that makes no assumptions about the shape of an underlying survival distribution, except that it is the same for all participants, and allows for multiple episodes per participant. Models involve variables that are both constant and time-varying for each parolee. The former include key demographic and criminal history variables (race, gender, prior convictions etc.), while geographical and hotspot variables and age vary between residential episodes. Controls for social disorganization constructs were also included in the models (concentrated disadvantage, residential stability, and ethnic/racial heterogeneity). These were measured at the tract level, taken to approximate neighborhoods. While they are an imperfect proxy, these geographical constructs (Sampson et al., 1997; Weisburd, Bruinsma, & Bernasco, 2009) remain a convenient approximation for which census data are available, and have been used to represent neighborhoods in prior studies examining the influence of neighborhoods on parolee recidivism (Hipp et al., 2010; Kubrin & Stewart, 2006; Morenoff, 2011).
Modeling was carried out using Stata 10.0. The software adjusts for missing episodes during the follow-up period in which parolees either lived outside of Newark or had unrecorded information by making adjustments to the active pool of parolees for each time point (Cleves, Gould, & Gutierez, 2002). Robust standard errors were used to adjust for tract-level clustering to address the multilevel character of the data analyzed, in keeping with prior studies of parolees (Hipp et al., 2010; Morenoff, 2011).
Dependent Variable
Parolee recidivism was measured as a new arrest for one or more crimes committed, approximating a criminal act. We use parole revocations for technical violations and termination of parole supervision as censoring events. While the latter are unlikely to be independent of rearrest (Clark, Bradburn, Love, & Altman, 2003), the inclusion of a range of background variables helps control for dependency effects, to the extent that censoring and failure times are predicted by common covariates (Rao & Schoenfeld, 2007).
Independent Variables
To assess the proximity of the crime hotspots to the parolee residence, for each of the three hotspot types (violent, property, drugs), we examined whether hotspots were located within a radius of 1,200 feet around the parolee’s residence. This distance was chosen for several reasons. First, we sought to delineate an area in which parolees plausibly operate when conducting their home-centered activities. These might include “hanging out” on the street, socializing with neighbors, buying groceries from a local store and perhaps conducting “search” activities for nearby crime opportunities. We reasoned that such activities probably take place within a couple of blocks of a parolees’ residence. In practice, a block’s distance is not consistent across Newark, with many blocks more rectangular than square. We therefore adopted a more inclusive operationalization of the home node to include approximately two longer block-face distances. This produced the 1,200 feet radius chosen, equivalent to about four times the mean block length for the city. A second reason for choosing 1,200 feet as our proximity distance was because there is a high concentration of hotspots in the city (see Table 2, below): By far, the majority of parolees counted hotspots within a distance of 1,200 feet from their residence. Any larger radius for measuring the presence or absence of hotspots would have resulted in measures with little or no variation, as hotspots would be consistently found.
We operationalized proximity measures in two ways. First, we calculated a single dummy variable for each hotspot type (violence, property, drugs) to indicate the presence or absence of hotspots within a 1,200 radius. This is used to establish evidence for the existence of a general effect of hotspots on recidivism. Second, we calculated a series of dummies to mark out the presence of hotspots within smaller, concentric zones, within the 1,200 feet radius, using distance bands of zero to 200 feet 200 to 400 feet, 400 to 600 feet, 600 to 800 feet, 800 to 1,000 feet, and 1,000 to 1,200 feet. Specifically, these dummies are used to identify the proximity of the closest hotspot, meaning that these are mutually exclusive dummy variables. This allows us to gauge distance-specific effects of hotspots within the broader radius of proximity, and in doing so to test our second hypothesis.
Control Variables
Models included variables to control for individual parolee characteristics, measuring the conventional individual risks associated with parolee failure (see also Miller et al., 2016). These included a global LSI-R risk score (individual instrument items were not recorded separately in electronic data) compiled by trained clinicians on behalf of the parole board. This risk score is reckoned to have strong predictive validity (Andrews & Bonta, 2006) and builds off 54 items that assess criminal history, education/employment, financial, familial relationships, accommodations, leisure and recreation, companions, alcohol and drug use, emotional health and attitudes, and orientations (Andrews & Bonta, 1995). In addition, we included the risk factors of gender, age, race/ethnicity, and prior convictions (Gendreau, Little, & Goggin, 1996) along with current offense.
Tract-level social disorganization variables (Shaw & McKay, 1931) were calculated based on the example of Hipp et al. (2010) using 2000 census data. These included the following: concentrated disadvantage, a principal component score based on percentage of residents below the poverty line, percentage unemployed, percentage of households single-parent, median income, and median home value; residential stability, a principal component score using median length of residence, percentage of households that moved into their units in the last 5 years, and percentage of units currently vacant; and racial/ethnic heterogeneity, calculated using the Herfindahl index (Gibbs & Martin, 1962) based on five racial groupings (White, African American, Latino, Asian, and other races). 1
Descriptive Statistics
As previously described, the study cohort involved 1,632 parolees and their 2,009 known residential episodes within the Newark study site (which disregards spells outside of the study site or with otherwise missing address details): They had an average of 1.2 episodes in the study area, with 81.6% counting just a single episode. The follow-up period averaged 260.7 days to failure or censor, with parolees spending 80.4% of their time, on average, at known study site addresses (57.0% recorded exactly 100% of postrelease time there). Table 1 (previously presented in Miller et al., 2016) provides descriptive characteristics of the study cohort. It shows that parolees were primarily male and Black, and aged about 35, on average. They tended to be experienced offenders averaging nearly six convictions and close to 11 prior arrests. A large proportion are drug offenders, with more than half convicted of these offenses in their first listed charge. Table 1 also shows patterns of postrelease recidivism. Apparently, the most common reason for recidivism is an arrest for an “other” offense, followed by drugs, violence, property crimes, and weapons-related offenses. Just over half of parolees were at moderate risk and a third were at low/moderate risk, based on the LSI-R cutoff scores recommended by the tool developers (Andrews & Bonta, 1995; Lowenkamp & Bechtel, 2007). Relatively few parolees fall into higher or lower risk categories.
Characteristics of Parolees Upon Release (N = 1,632).

Note. LSI-R = Level of Service Inventory–Revised.
Table 2 describes residential episode level variables including those relating to tract-level measures of neighborhood factors, and hotspot proximity measures (presented in part in Miller et al., 2016). It is notable that all hotspot places account for approximately 21% of the total study area, but about nine out of 10 parolee addresses have a property hotspot within 1,200 feet, seven out of 10 have a drug hotspot in this vicinity, and almost all (97 out of 100) have a violence hotspot in the same radius.
Measures for Residential Episodes (N = 2,009).
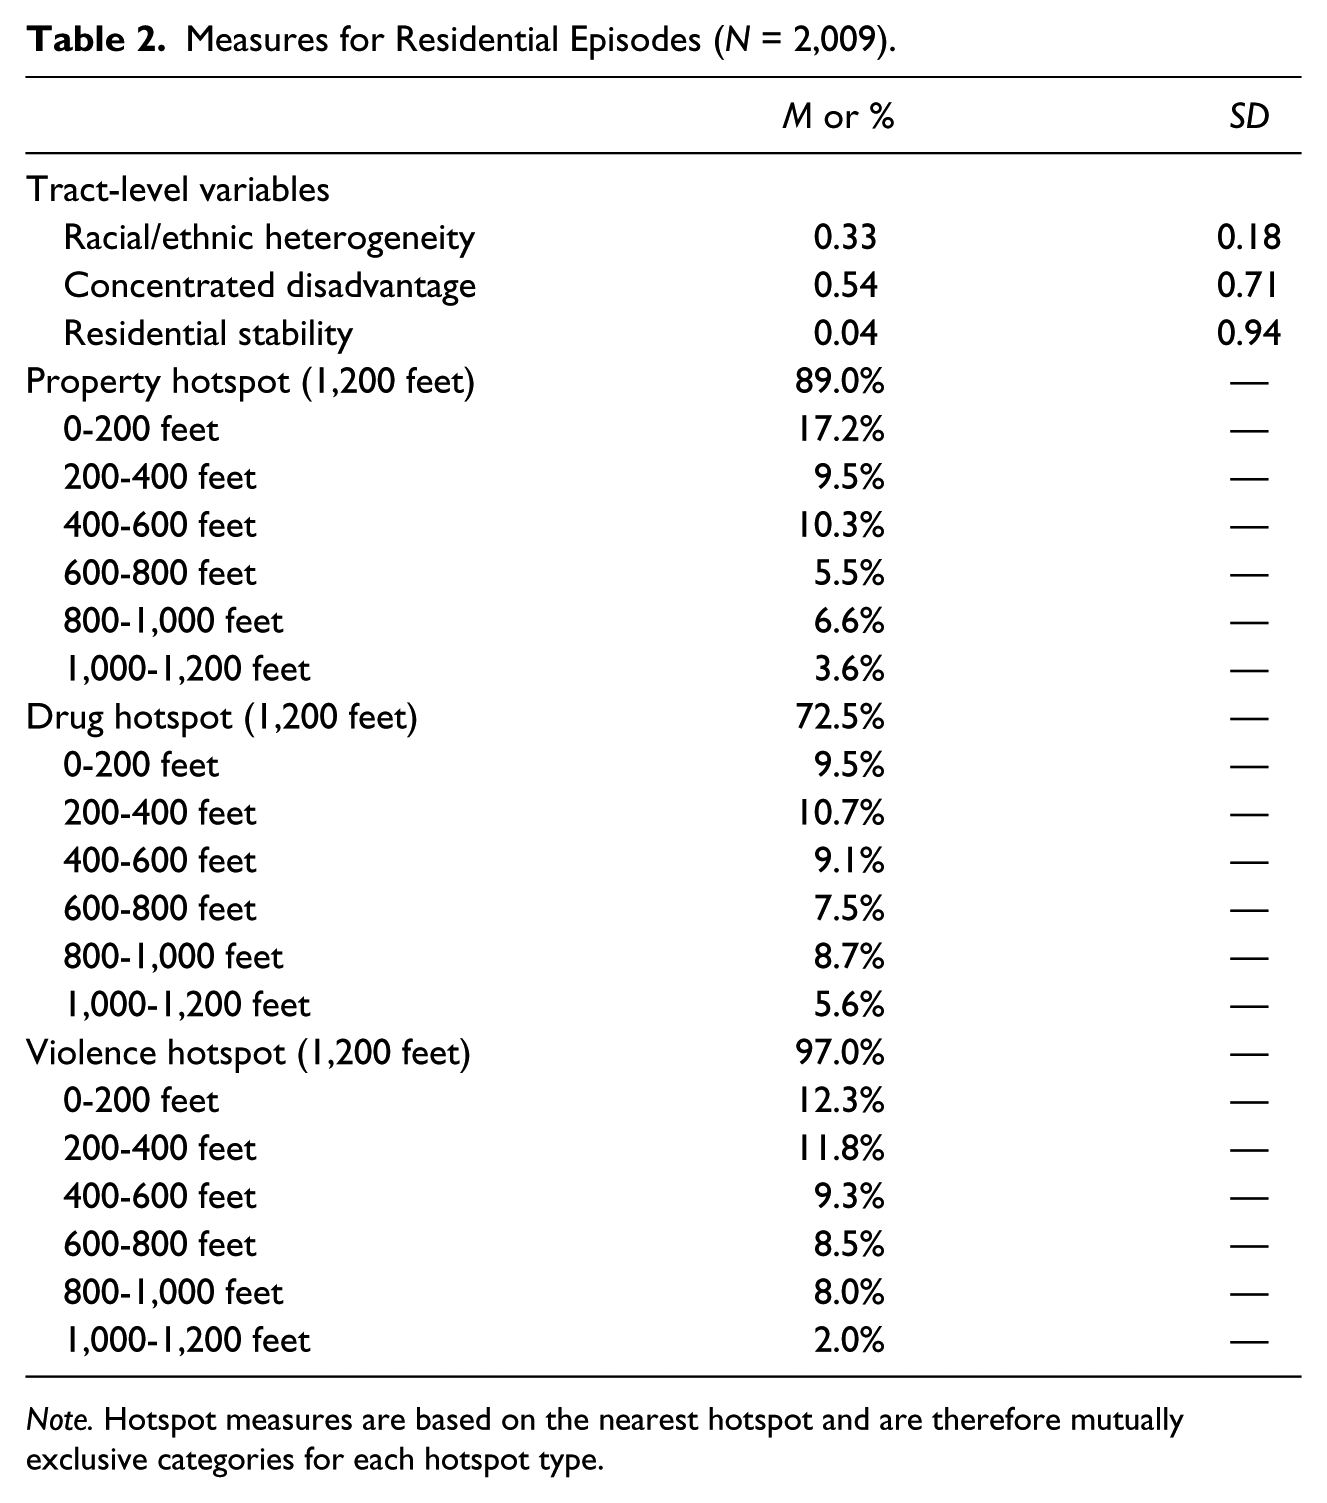
Note. Hotspot measures are based on the nearest hotspot and are therefore mutually exclusive categories for each hotspot type.
Survival Models
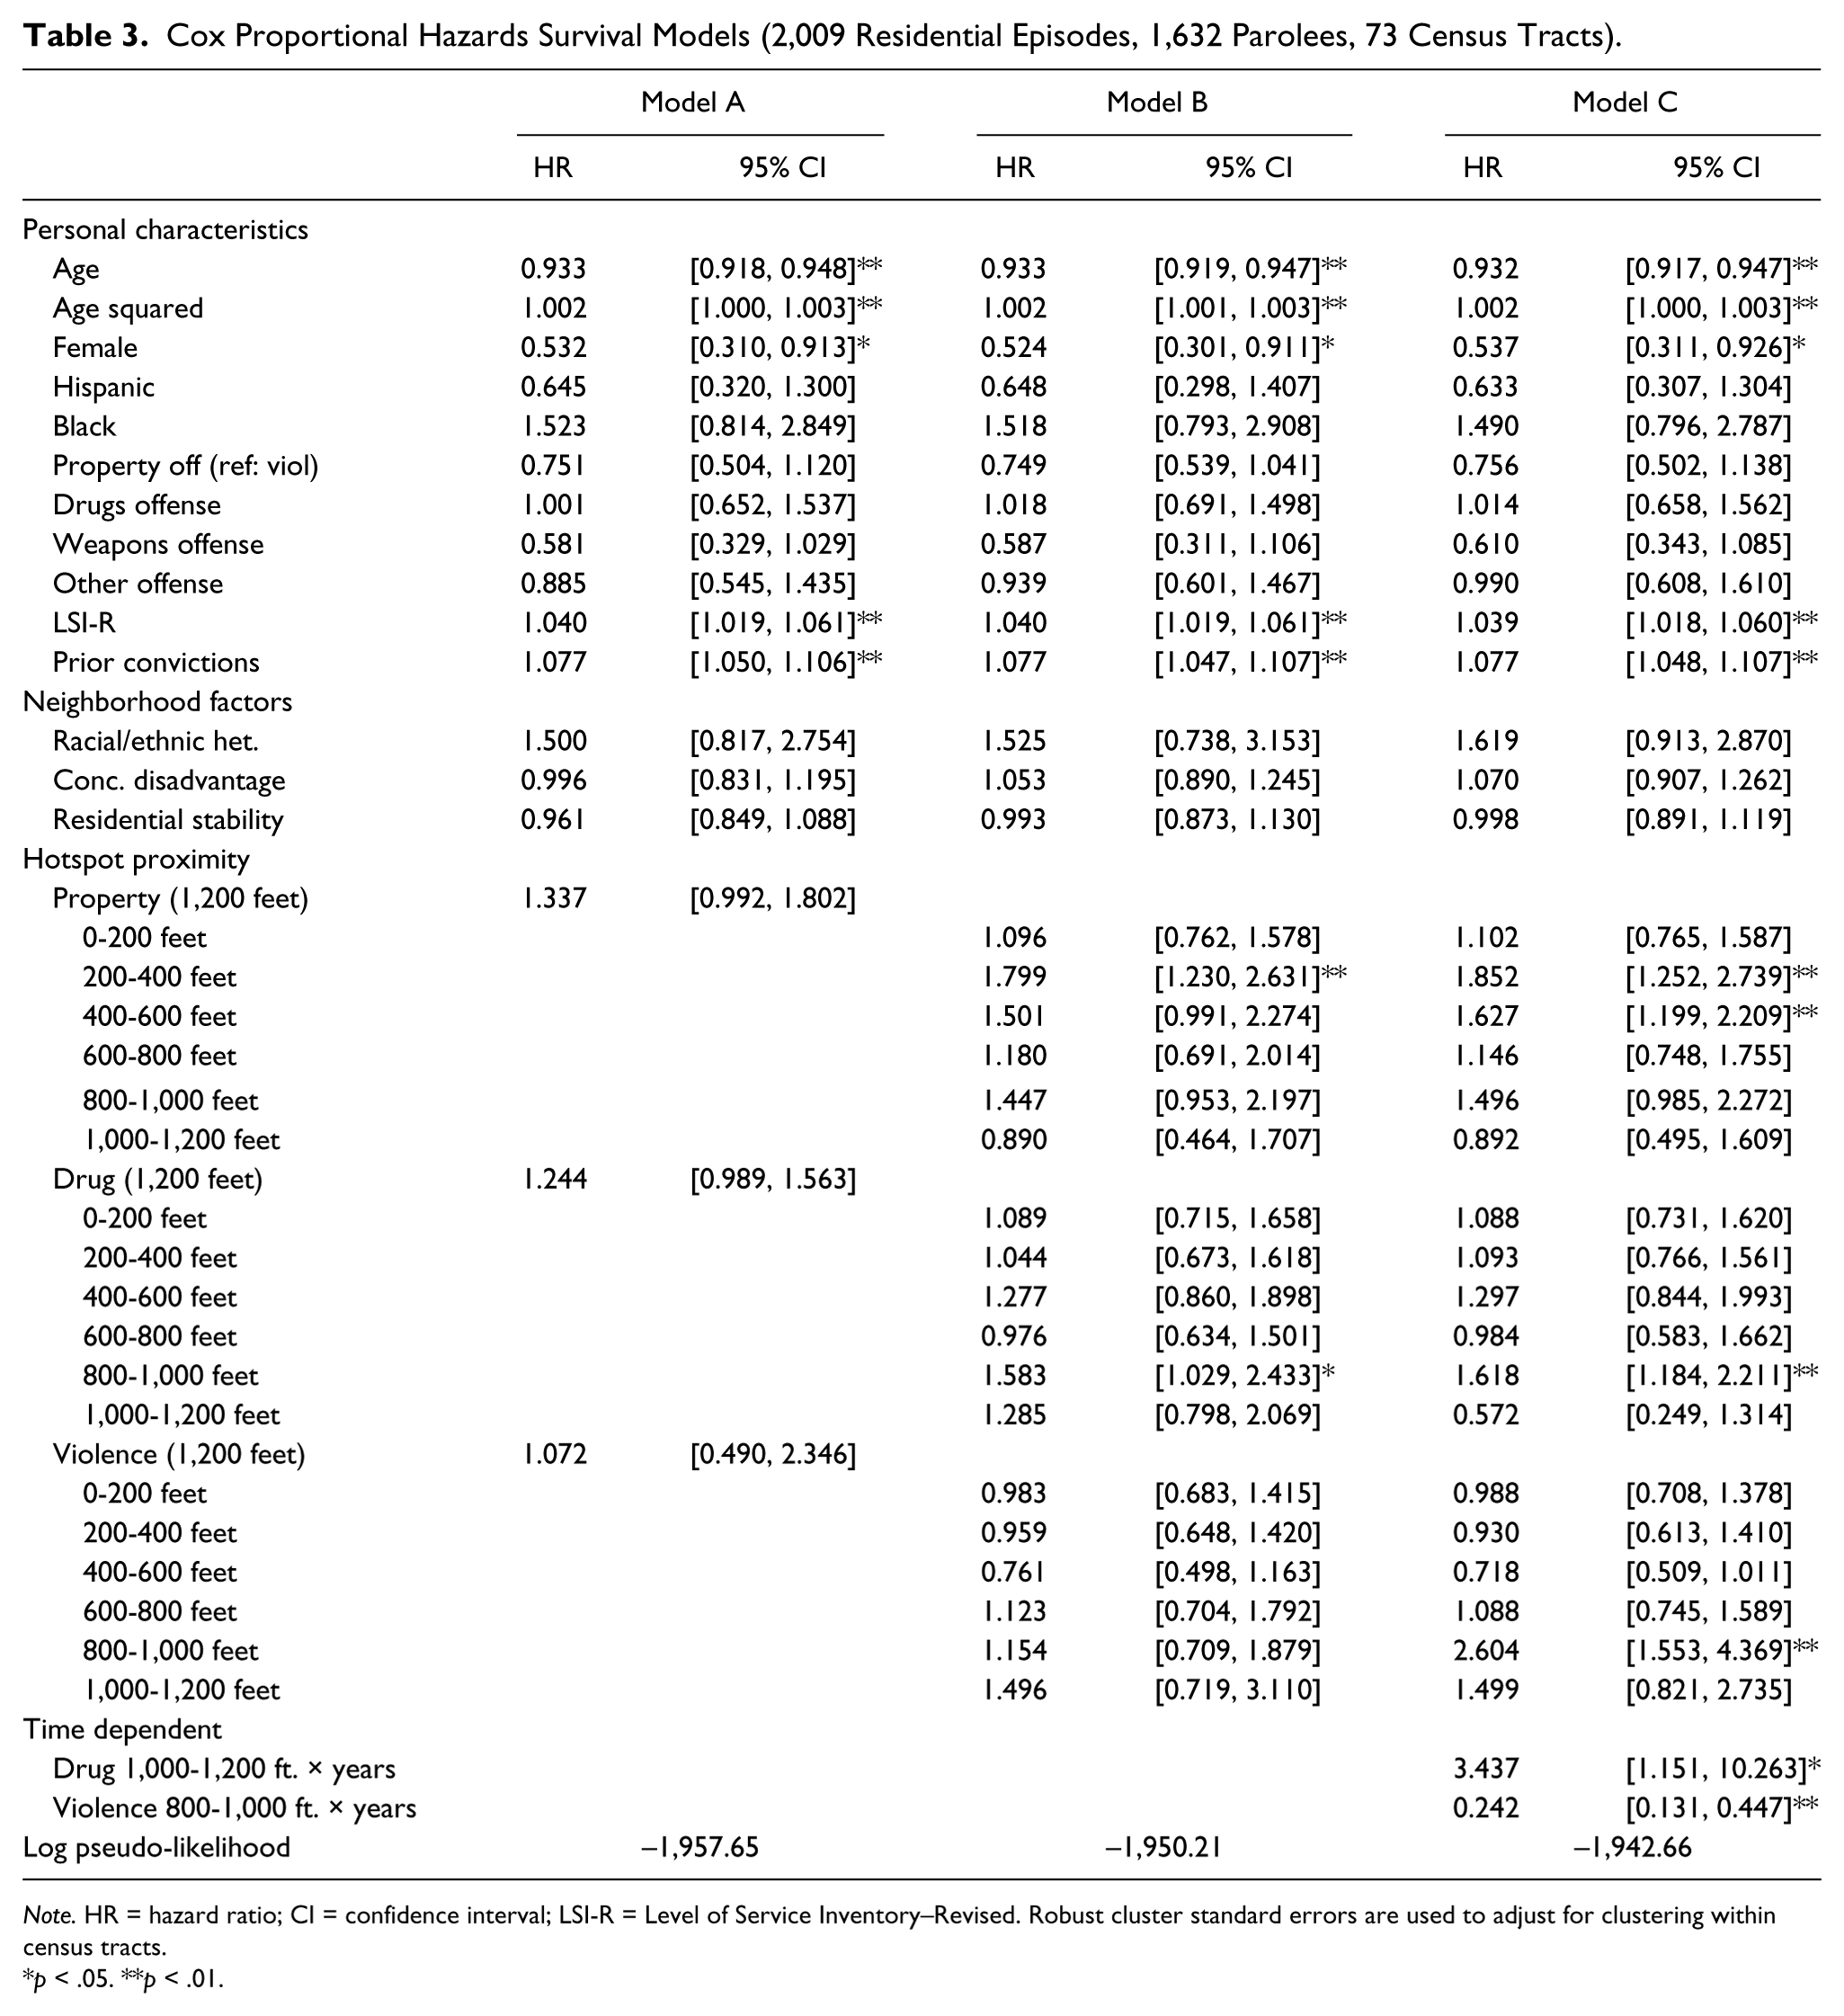
Table 3 provides results of three Cox proportional hazards survival models. The models use time to failure or censoring measured in days. They include the variables presented in Tables 1 and 2, although they also incorporate an age-squared term, alongside age, to account for any quadratic effects (the age variable was first centered). Moreover, while we considered using prior arrests in the models, the variable had some collinearity with prior convictions so it was excluded. We also considered making model adjustments to address spatial dependency processes by using tract-level spatial lag variables (Kubrin & Stewart, 2006). However, after calculating Moran’s I for census tracts, based on their aggregated 100-day failure rates, there was no evidence of spatial autocorrelation, so we did not do so. 2
Cox Proportional Hazards Survival Models (2,009 Residential Episodes, 1,632 Parolees, 73 Census Tracts).
Note. HR = hazard ratio; CI = confidence interval; LSI-R = Level of Service Inventory–Revised. Robust cluster standard errors are used to adjust for clustering within census tracts.
p < .05. **p < .01.
Model A uses the simple binary measures of hotspot proximity within 1,200 feet of the parolee’s address for each hotspot type (property, drugs and violence). Models B and C use the alternative measures of hotspot proximity, measuring the nearest hotspot according to a series of 200 feet concentric rings up to a 1,200 foot maximum. This helps assess the effects of the nearest hotspots according to their location within the 1,200 foot radius. Model C is differentiated from Model B by the inclusion of time-varying effects for drug hotspots at 1,000 to 1,200 feet and violence at 800 to 1,000 feet. These interactions were introduced to address violations of proportional hazards assumptions, identified by the Schoenfeld residual test (Cleves et al., 2002) in Model B.
The tables present hazard ratios and their 95% confidence intervals for each of the independent and control variables. The former are the exponents of model coefficients and indicate the difference in probability of failure, at any given time point, associated with a unit increase in an independent variable. For example, the hazard ratio for female in model C is 0.573, which indicates that females have a hazard rate—or probability of rearrest—that is 57.3% of males, at any given point in time. The same model has a hazard ratio of 1.852 for a property crime hotspot between 200 and 400 feet away. This indicates that a parolee with a hotspot at this distance has nearly double the probability of rearrest, at any given point in time, than a similar parolee whose nearest property hotspot is beyond 1,200 feet.
Overall, models consistently indicate that personal characteristics are predictive of rearrest. Specifically, age (and age squared), gender, LSI-R risk score and conviction history are significant. Meanwhile, neighborhood variables do not achieve any statistically significant results across the models: Hazard ratios for concentrated disadvantage and residential stability are almost exactly one, while a somewhat larger hazard ratio for racial/ethnic heterogeneity, across models, does not achieve statistical significance (though has p < .1 in Model C)—perhaps in part because of modest power at the tract level of measurement.
When we look at the measures of hotspot proximity, the crux of our analysis, our results provide modest support for our hypotheses. First, looking at the general proximity measures of hotspots within 1,200 feet (in Model A), coefficients are not statistically significant, though hazard ratios for property and drug hotspots are meaningfully larger than 1, and are close to statistical significance (p < .1 in both cases). However, when we replace generalized proximity measures, with the series of distance-specific measures, in Model B, some more specific effects are statistically significant. Importantly, and in line with our second hypothesis, the most proximate hotspots (between zero and 200 feet) show negligible associations with recidivism for any of the hotspot types—with no statistically significant effects, and hazard ratios all very close to one (indicative of no effect). However, as we move further out, there is more evidence of a potential influence of hotspots on recidivism, though effects vary for different hotspot type. For property hotspots, there are statistically significant (p < .01) effects for both 200-400 feet, and 400-600 feet. For drug hotspots, there are statistically significant effects at 800 to 1,000 feet (p < .05). For violence hotspots, there are no statistically significant effects, though it may be that weak statistical power here reduces our ability to confidently identify violence hotspot effects, given the pervasiveness of violence hotspots. Moreover, despite hazard ratios closely approximating one at the shortest distance from the hotspots, coefficients for all hotspot types tend to be larger at distances further out, even where these effects are not statistically significant, hinting at a more general effect, albeit one that we cannot be sure of.
In Model C, the introduction of time-varying effects allows the model to better satisfy Cox regression’s proportional hazards assumption (Cleves et al., 2002). Diagnostic analysis of Model B using the Schoenfeld residual test indicates violations of this assumption for selected covariates. The impact of this modification, however, is small. Beyond the main effects for the two variables used to construct interaction terms, model coefficients and significance tests remain similar to Model B. Model C, taken at face value, suggests simply that the effects for drugs hotspots at 1,000 to 1,200 feet increase with time, and for violence hotspots at 800 to 1,000 feet, initially positive effects fade, and may even become negative by about a year into a parolee residential episode. 3 However, these effects do not fundamentally challenge the main conclusions of the analysis, based on Model B. Effects of hotspots on rearrests are patchy and distance-specific. However, they are consistently absent in the first 200 feet from the parolee’s home address.
Discussion
This study has examined the relationships between hotspots of property crime, drug crime and violence, and parolee recidivism, through the lens of crime pattern theory (Brantingham & Brantingham, 1981, 1995, 2008). We hypothesized that hotspots, located within 1,200 feet of a parolee residence (approximating two to four Newark blocks), would be associated with increased recidivism. That is, crime opportunities—as exemplified by locations of crime hotspots—near parolees’ homes, and therefore within their awareness space, should increase their opportunities to recidivate. However, we also recognized that these opportunities may be less important when they are very close to a parolee residence, given that the parolee may be fearful of being recognized very close to home if exploiting crime opportunities there. We, therefore, hypothesized that effects of hotspots would be less in the areas closest to the parolee residence. The present study extends earlier analysis (Miller et al., 2016) in which local crime opportunities were measured as particular kinds of places (including bars, liquor stores, restaurants, public transport hubs, and drug markets) for which no effects were detected.
To carry out our analysis, we constructed a set of survival models on a cohort of parolees released from New Jersey prisons who subsequently lived in the city of Newark. We included measures of the proximity of parolee residences to crime hotspots, based on an analysis of city police data. Our models also included an extensive list of control variables, including individually measured risk factors and tract-level measures of social disorganization.
Our results provide some modest support for our hypotheses, though conclusions are tentative and in need of further testing. For drug and property crime hotspots, there was evidence of an association with recidivism, though one that was focused at particular distances from the parolee address. Notably—and in line with our second hypothesis—there were no convincing effects for hotspots at short distances of up to 200 feet for any of the hotspot types. However, there were distances further out that did have statistically significant associations with proximate drug and property crime hotspots. There were no stable statistical effects at any distance for violence hotspots though some evidence of a time-varying effect for at 800 to 1,000 feet. The limited effects may, in part, reflect the lower statistical power associated with violence hotspot variables.
Before drawing firm conclusions, we should consider any threats to the validity of findings. First, we should ask whether there are any confounds that might explain both hotspots and recidivism. As with any nonexperimental analysis that relies on statistical controls, we cannot rule this out. In particular, it is possible there are community characteristics that could contribute both to the occurrence of hotspots and the propensity for parolees to recidivate—or indeed for more recidivism-prone parolees to move to the community. For example, criminal networks within particular local communities may have criminogenic effects because they sustain criminality, or introduce offenders to criminal associates, while also contributing to the existence of hotspots. Notwithstanding, we did make reasonable efforts to control for community-level factors, through our tract measures of racial and ethnic heterogeneity, concentrated disadvantage, and residential stability, which mitigates this validity threat somewhat.
Second, we have little direct evidence that the crime opportunities presented by the hotspots were the opportunities exploited by parolees in their recidivism. For example, we do not know whether parolee offending took place at or around hotspot areas (we inquired, but were not granted access to arrest/incident locations). It is conceivable that mechanisms we did not contemplate could account for the relationships. For example, hotspots could increase rates of victimization among parolees which in turn could trigger offending—perhaps so that parolees can recover lost material possessions, seek vengeance, or use illicit drugs as a source of solace.
Finally, we should note that our analysis does not explore the interaction between the character of neighborhoods and the relationships between hotspots and parolee failure. It may be that not all neighborhoods are the same, so that our “average” results obscure important variations on the ground. For example, in some geographical settings, community members may be more tolerant of residents participating in certain crimes (e.g., drug-related offenses), such that there is less deterrence among parolees contemplating these crimes immediately around their home addresses. Such an effect in specific neighborhoods would tend to offset the buffer-zone pattern we saw in our city-wide models (i.e., a lack of hotspot effects on parolee failure when they were located within 200 feet of their homes).
Conclusion
This is the first study to directly test the statistical associations between hotspots and patterns of parolee recidivism, and one of very few to consider the associations of parolee recidivism with local crime opportunities at all (Miller et al., 2016). The study provides some qualified support for a relationship between crime hotspots and parolee recidivism, though only when hotpots exist at a distance from a parolee’s residential addresses. However, the study has some limits: It tests broad statistical associations without demonstrating causality; results are modest, and may be open to different explanations than those we have emphasized here; and our focus on the home node disregards a number of other settings in which offenders spend time, which likely also provide opportunities for recidivism (Brantingham & Brantingham, 2008).
Notwithstanding, we believe this article makes an important contribution to an understanding of the links between local crime opportunities and offending among parolees. Further research should test our hypotheses in different contexts and locations, and explore the precise mechanisms by which local crime opportunities may impact recidivism. It should include analysis of the spatial location of recidivist acts and their relationship to hotspots. Research might also combine data collection methods such as surveys and interviews with the empirical methods used here, to better measure the details of criminal behaviors and their environmental contexts, including their relationship to crime opportunities.
As part of such an effort, future research could collect data on the range of places beyond the home where parolees spend time and the things they do there, recognizing that the multiple nodes these activities create are a major source of crime opportunities, according to crime pattern theory (Brantingham & Brantingham, 1995, 2008). For example, this could include identifying the places they work, study, or spend leisure time, the travel routes between these places. It could also assess the specific activities they engage within these places, which might affect their availability to engage with crime opportunities. Offenders under intensive supervision might be a particularly interesting population for such studies, given the closer attention often paid to these offenders (they may even wear GPS tracking devices), and their often higher propensities to engage in crime. Research protocols developed to measure routine activities and travel patterns might build off some techniques already trialed in community corrections settings (see Bichler, Christie-Merrall, & Sechrest, 2011).
Finally, beyond its theoretical value, our research also helps advance a policy agenda that applies environmental criminological principles to the management of offenders in the community (Clear & Karp, 1999; Cullen, Eck, & Lowenkamp, 2002; Dickey & Klingele, 2004). In particular, the present research helps inform a model of “environmental corrections” (Cullen et al., 2002), oriented to reducing the extent to which offenders are “tempted by and come into contact with opportunities for crime” (Cullen et al., 2002, p. 31). Knowing where opportunities for crime are, and where they are not, seems an important goal in the advancement of this model. Though our results are only a modest contribution and need to be replicated and elaborated through future research, they hint at practical ideas for parole officials. For example, when preparing parolees’ release plans, officials may need to be a little less concerned with crime in the places where parolees actually live upon release, and more concerned about crime opportunities that may exist nearby. Further research is required to confirm this insight and to provide practical direction for assessing these risks at a distance.
Footnotes
Declaration of Conflicting Interests
The author(s) declared no potential conflicts of interest with respect to the research, authorship, and/or publication of this article.
Funding
The author(s) received no financial support for the research, authorship, and/or publication of this article.