
Abstract
Reliable test scores are essential to interpret the results obtained in statistical analyses correctly. In this study, we used the Values in Action Inventory of Strengths (VIA-IS) as an example of a widely applied assessment instrument to analyze its metric quality in what is known as reliability generalization (RG). In addition, we conducted a meta-analysis of the correlations between character strengths and life satisfaction to examine the potential relationship between the reliability of test scores and the intensity of these correlations. The overall variability of alpha coefficients supports the argument that reliability is sample dependent. Indeed, there were statistically significant mean reliability differences for scores across the 24 scales, with the highest level of reliability observed for Creativity and the lowest for scores on Self-regulation. Significant moderators such as the standard deviation of the scores and the sample type contribute to understand the high variability observed in the reliability estimation. The second meta-analysis showed that Zest, Hope, Gratitude, Curiosity, and Love were the character strengths that were highly related to life satisfaction, while Modesty and Prudence were less related to life satisfaction. Furthermore, the high heterogeneity between samples might be an indicator of the relationship between the variability of reliability of character strengths' scores and the intensity of their correlations with life satisfaction. Those character strengths with high-potential RG are related or unrelated to life satisfaction, whereas character strengths with less-potential RG showed unstable correlation patterns. The results of both studies point out the role of the relationship between the reliability of test scores and substantive studies, such as Pearson's correlations meta-analysis.
Keywords
Introduction
“What you measure affects what you do. If you don't measure the right thing, you don't do the right thing.” (Joseph Stiglitz)
There are important reasons why reliability should be reported in each study. For instance, reliable instrument scores are essential to interpret the results obtained by a statistical analysis correctly. On the contrary, the unreliability of the test scores would question the use of General Linear Model analysis (e.g., regression, analysis of variance, etc.; Vacha-Haase & Thompson, 2011). In other words, unreliable scores may call into question the validity of the statistical conclusion obtained. Therefore, the first step in any quantitative research study should be the assessment of the reliability of the instrument scores (Sullivan, 2011; Vacha-Haase & Thompson, 2011; Wilkinson & APA Task Force, 1999).
Considering the significance and the possible negative consequences of the unreliability of the test scores, Vacha-Haase (1998) proposed the reliability generalization (RG) meta-analysis. The RG meta-analysis was based on the validity generalization meta-analytic method, developed by Schmidt and Hunter (1977). Through systematical exploration of the different results of the reliabilities of any specific test, an RG meta-analysis contributes to a better comprehension of the factors involved in the variability of the reliability and what role they play in the study results. Moreover, this type of study can be very helpful to applied researchers, test administrators, and decision-making groups of people and individuals (Vacha-Haase, Henson, & Caruso, 2002) since RG studies would allow (a) to know to what extent the accuracy of a measure is generalizable across samples and studies, (b) to establish the sources of variability (methodological vs. substantive sources) that may affect the reliability estimation, and (c) to define the potential generalizability of reliability by taking into account different sources of error (measurement error vs. estimation error) that might be confounded when interpreting a substantive result (Vacha-Haase, 1998).
It is appropriate to apply an RG only if the test under study was applied widely and if there is a reasonable number of empirical studies that estimated the reliability of the scores (Henson & Thompson, 2002). In this current study, we considered the Values in Action Inventory of Strengths (VIA-IS), a measure based on character strengths (Peterson & Seligman, 2004), since these requisites are accomplished. It is considered that a concrete application of the VIA-IS (or any test) to a specific sample is not enough to establish psychometric properties and the quality of the measure, since the results are related to scores on a particular application, which may vary in a second application even when it is applied to the same sample (Botella, Suero, & Gambara, 2010).
The VIA-IS
The model of strengths and virtues known as the VIA Classification of Character Strengths and Virtues was designed after reviewing several documents related to historic, literature, moral, and religious traditions (Dahlsgaard, Peterson, & Seligman, 2005; Peterson, 2006; Peterson & Seligman, 2004). As a result, Peterson and Seligman (2004) proposed 6 cross-cultural virtues and 24 character strengths (see Supplementary Table 1 for a description of each character strength). Character strengths are defined as positively valued trait-like individual differences with demonstrable generality across different situations and stability across time (Peterson & Seligman, 2004). They are fulfilling; intrinsically valuable, in an ethical sense (gifts, skills, aptitudes, and expertise can be squandered, but character strengths and virtues cannot). They are nonrivalrous as well as not the opposite of a desirable trait (a counterexample is steadfast and flexible, which are opposites but are both commonly seen as desirable). In addition, character strengths are trait-like (habitual patterns that are relatively stable over time); personified (at least in the popular imagination) by people made famous through history; yet, they are not a combination of the other character strengths. Finally, they are nurtured by societal norms and institutions which explains why they may be absent in some individuals (Peterson & Seligman, 2004). Character strengths were thus conceptualized as more personal prosocial trait variables compared with other positive traits such as talents (McGrath, 2016).
This elaboration served as the foundation for the creation of the VIA-IS. This self-assessment instrument is composed of 240 items that measures behaviors that are representative of different character strengths (Peterson & Park, 2006, 2009; Peterson, Park, & Seligman, 2005; VIA Institute, 2012). There are 10 items for each of the 24 strengths in the VIA classification, and a Likert 5-point scale (1: Not at all like me to 5: Very much like me) is used to rate them. The VIA-IS was initially created as a universal measure of what Peterson and Seligman (2004) called the good character. The inclusion of cross-cultural character strengths allowed the translation of the instrument in several languages such as Spanish, Croatian, Chinese, Dutch, Israeli, German, and Hindi (Azañedo, Fernández-Abascal, & Barraca, 2014; Brdar & Kashdan, 2010; Duan et al., 2011; Jónsdóttir, 2010; Littman-Ovadia, & Lavi, 2012a; Ruch et al., 2010; Singh & Choubisa, 2009, 2010). Its large application to different populations and settings in psychological research as well as in different countries supports the objective of examining whether its psychometric properties, and in particular the scores' reliability, can be generalized across studies that have used this inventory.
The study of character strengths occupies a central role in Positive Psychology research because the good character contributes to variables such as pleasure, flow, well-being, life satisfaction, and other positive experiences (Niemiec, 2013; Park & Peterson, 2009; Proyer, Gander, Wellenzohn, & Ruch, 2013). Regarding the relationship between character strengths and life satisfaction, Hope, Zest, Gratitude, Curiosity, and Love have a consistent relationship with character strengths (Brdar & Kashdan, 2010; Ruch, Huber, Beermann, & Proyer, 2007; Shimai, Otake, Park, Peterson, & Seligman, 2006). In contrast, the associations between life satisfaction and Modesty, Creativity, Appreciation of beauty and excellence, Judgment, and Love of learning (Park, Peterson, & Seligman, 2004a, 2004b) are lower or even nonsignificant. However, the substantive interpretation of the correlations between variables might be affected if there is a high heterogeneity of the reliability estimation (Vacha-Haase, 1998). In other words, the variability in the reliability of the test scores alters the probability of Type II error (decreases the statistical power) and directly weakens the correlations.
The present study
The aim of the present study is twofold. First, it attempts to investigate the reliability of scores obtained by VIA-IS applied in a diverse set of contexts. Second, after examining the heterogeneity of the estimation of the reliability of scores (RG), we aim to determine how this influences the relationship between character strengths and life satisfaction. Therefore, this article aims to illustrate the need to perform an RG study before performing a meta-analytical study, since different sources of error may be confounded when interpreting the correlation patterns (measurement error vs. estimation error). For example, the measurement error is associated with a lack of precision of the instrument, and this might increase the estimation errors of the correlations between two variables (Vacha-Haase, 1998). To achieve these aims, we present two studies: the RG (Study I) and the correlations meta-analyses (Study II).
Study I: RG meta-analysis
Method
Literature search
We retrieved articles from PsychINFO, PsicARTICLES, Psicodoc, PubMed, and Psychological Abstracts databases. The literature search encompassed articles published between 2004 (January) and 2016 (December). The articles were searched for by using the following two groups search terms and keywords: Group 1: Values In Action Inventory of Strengths; VIA-IS; Character strengths; VIA; Group 2: Psychometric properties, reliability, internal consistency, alpha, Cronbach's alpha, coefficient alpha. The truncation symbol was added to the most basic word stem for each keyword to ensure all associated terms were included in the search.
To prevent the file drawer problem related to missing values, we contacted the VIA Institute on Character and seven investigators in the field, two of which reported information about missing values that was then included in the current study. The criteria to contact these authors were to have at least one publication that met the inclusion criteria (and none of the exclusion criteria), but all data related to character strengths' reliability were not reported in the published article. The procedure was to write an e-mail explaining the aim of our research and to ask for unpublished data. E-mail content was the same in all cases.
All articles were reviewed by three referees, and discrepancies were resolved through discussion (see Supplementary Table 2 for a description of the inclusion and exclusion criteria, and Supplementary Table 3 for the studies included in the current meta-analysis). Those discrepancies were mostly related to the number of items in each scale and to reliabilities not reported in the studies selected. Interrater reliability for Study I was .92. Flow diagram for Study I is reported in Figure 1.
Flow chart for Study I.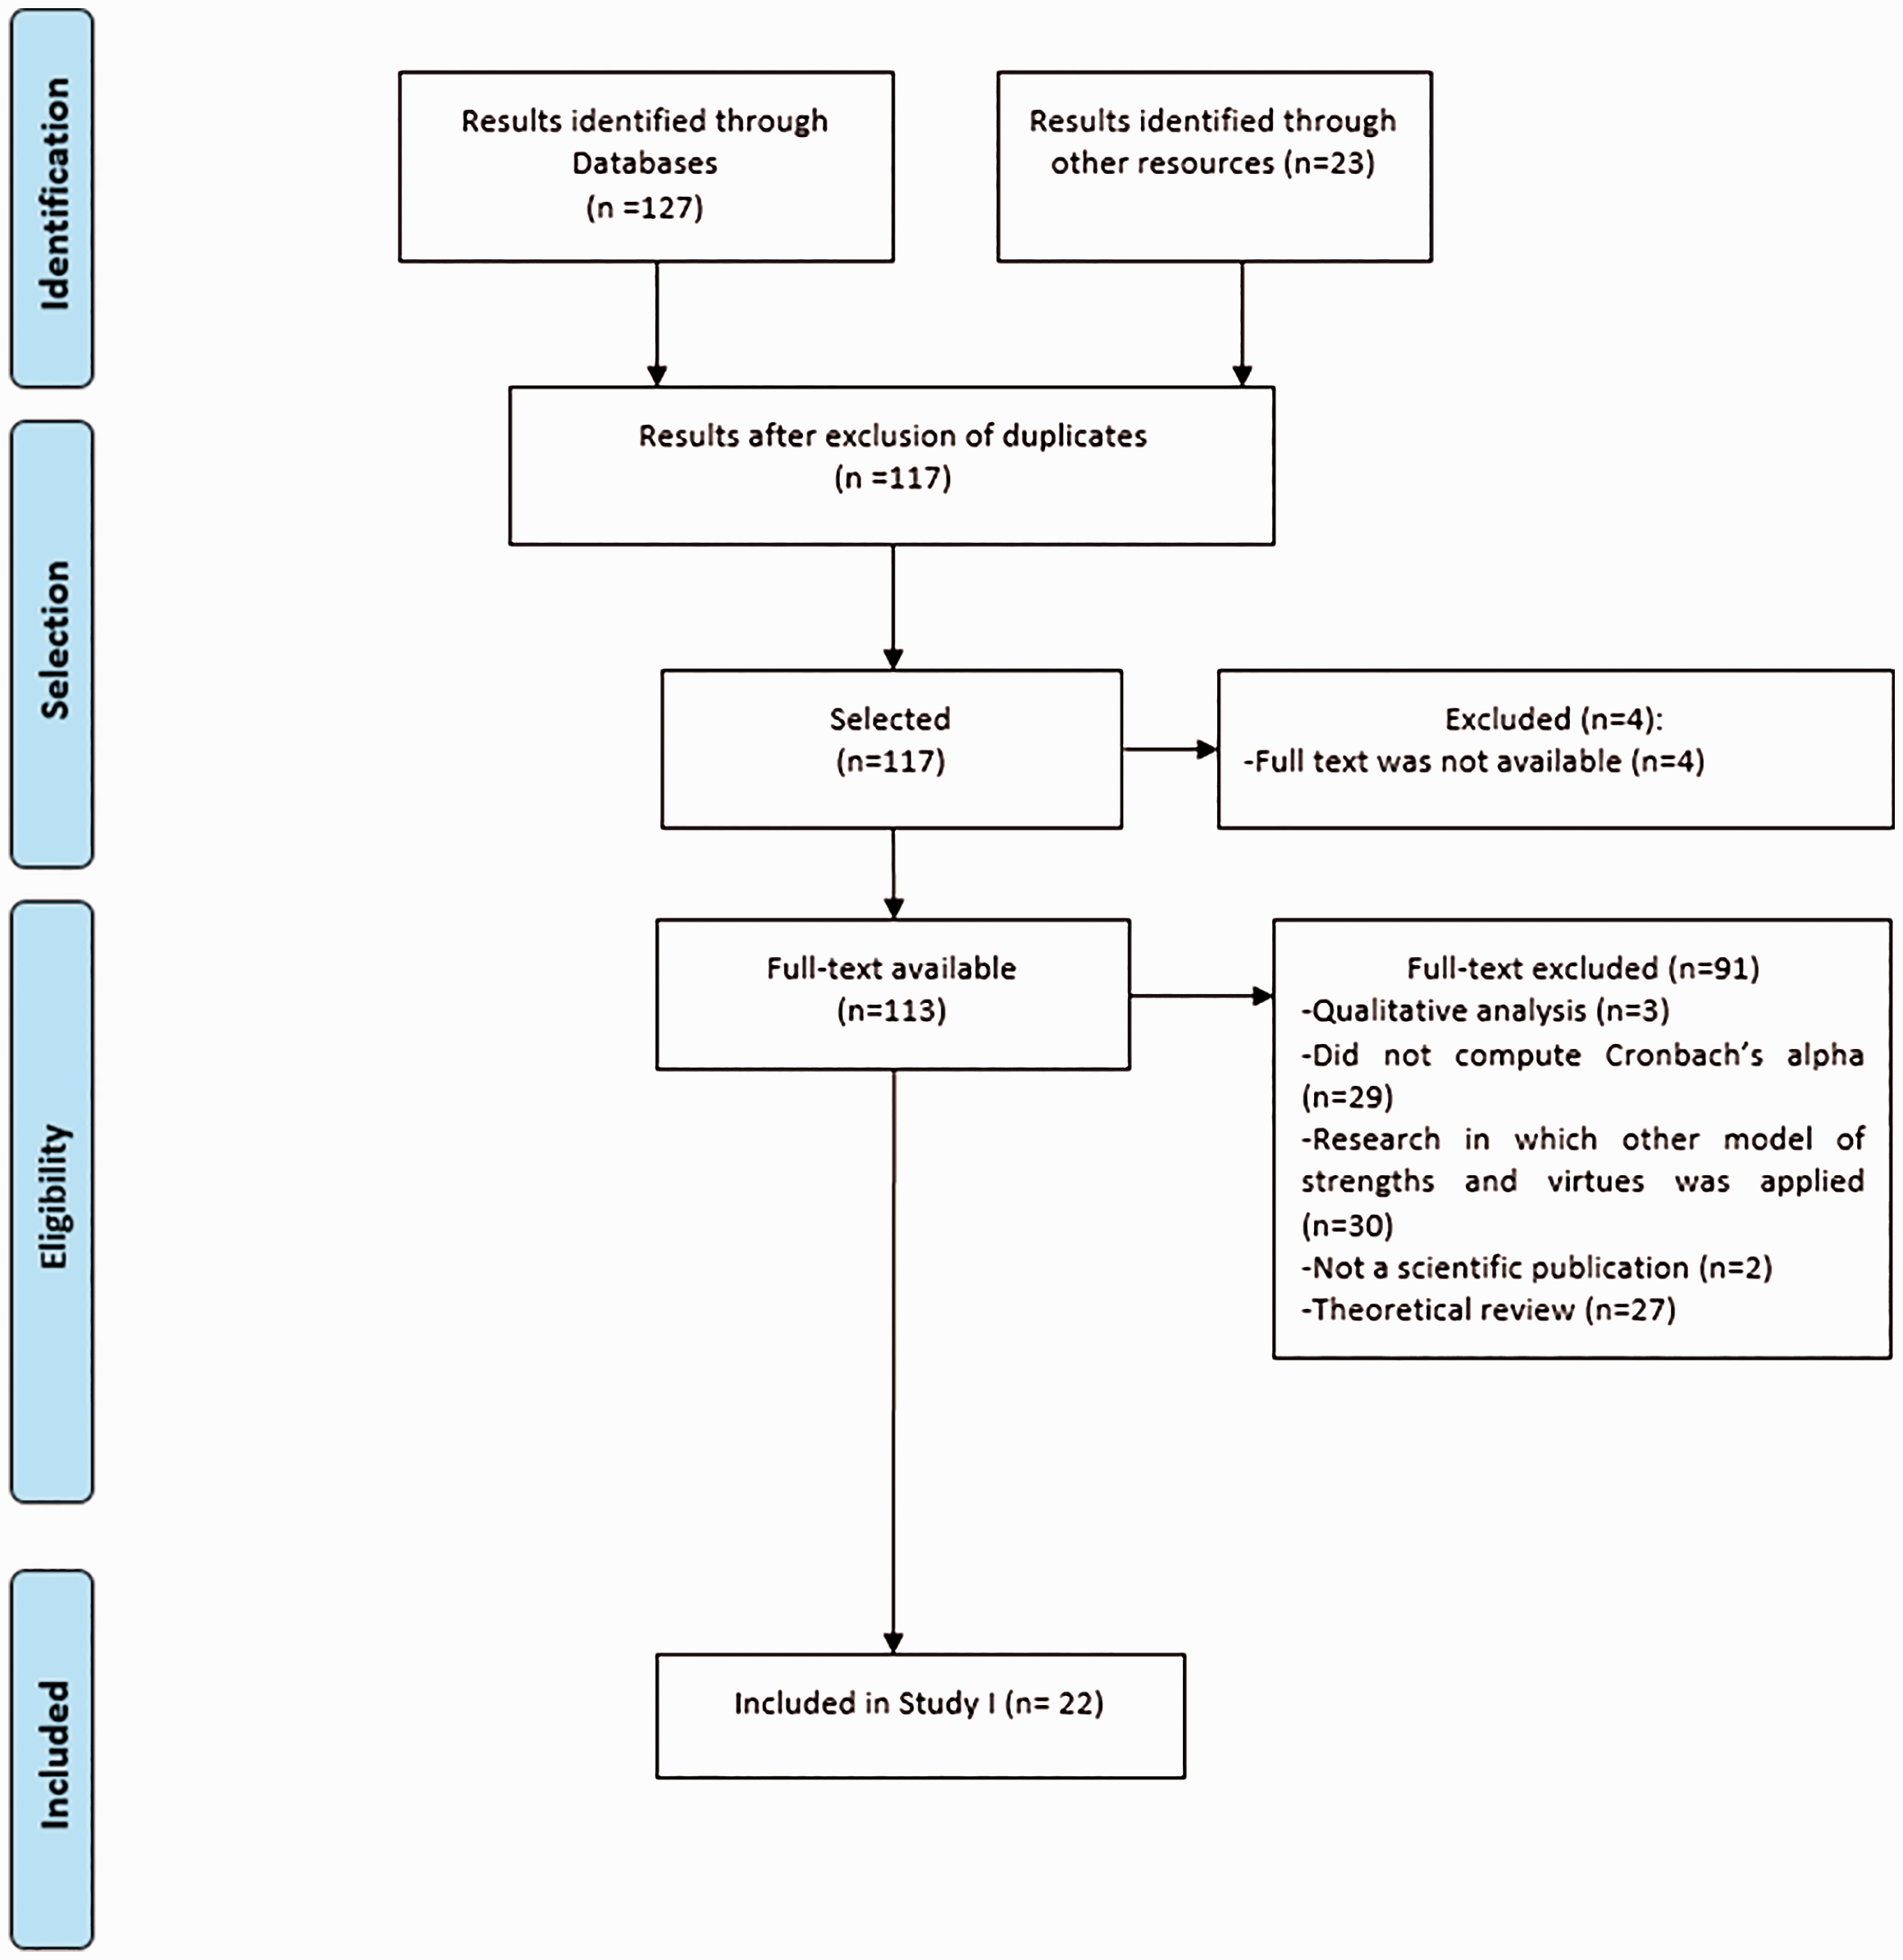
Data analysis
To carry out the RG study, the Cronbach's alpha of each character strength was collected from each sample. The pooled estimate of the internal consistency of each trait was computed using Bonett's transformation (Bonett, 2010) considering the inverse of its sample variance (Sánchez-Meca & López-Pina, 2008) and assuming a model of random effects. Q test was used to determine whether there were any significant violations of homogeneity in the effect size distributions. Since Q test has a low power because of the small number of the studies (Higgins & Thompson, 2002), I2 was also calculated. A categorization of values for I2 would tentatively assign adjectives of low, moderate, and high to I2 values of 25%, 50%, and 75% (Huedo-Medina, Sánchez-Meca, Marín-Martínez, & Botella, 2006). Trim-and-fill procedures (Duval, 2005; Sterne et al., 2011) were used to account for a potential publication bias (see Supplementary Table 5 for more details). This method can be used to estimate the number of studies missing from a meta-analysis due to the suppression of the most extreme results on one side of the funnel plot.
The effect of the moderating variables (standard deviation, test version, and sample type) on the variability of the reliability estimates was evaluated by means of analyses of variance for categorical variables and regression model for the continuous variable, assuming a model of mixed effects. The data were analyzed using R software (R Core Development Team, 2018) and metafor package (Viechtbauer, 2010).
Results
Estimate of average reliability
Pooled estimates of character strengths' scores reliability coefficients.

Note: Alpha back-transformed from Bonett's procedure. All Q indices were significant (p < .001). N: samples included.
Moderator analyses
Characteristics such as the standard deviation of VIA-IS scores, the test version (English vs. translated versions of the inventory), and the sample type (college-general population) were analyzed to explain the variability of the reliability. Detailed moderator analyses are presented as supplementary material (see Supplementary Tables 6 to 8).
Moderator analyses model summary.
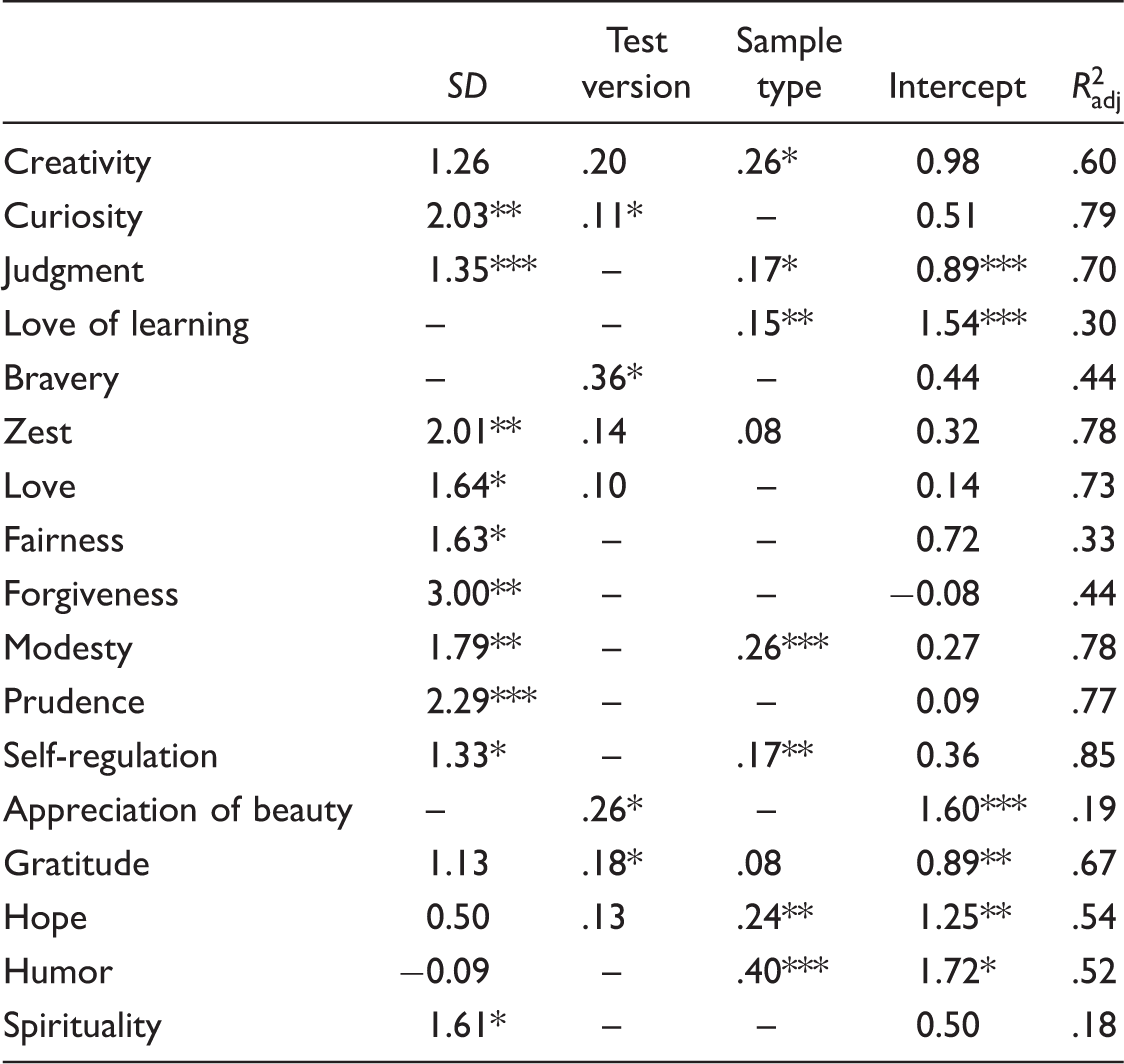
Note. Only character strengths with significant moderators are included. SD: standard deviation. Predictor's raw weight is included.
*p<.05. **p<.01. ***p<.001.
Study II: Applied meta-analysis
Method
Literature search
To identify studies for the correlational meta-analysis, a literature search in the electronic databases such as PsycINFO, PsicARTICLES, Psicodoc, PubMed, and Psychological Abstracts was carried out to find empirical studies that computed Pearson's correlations between character strengths' scores and Satisfaction With Life Scale (Diener, Emmons, Larsen, & Griffin, 1985). The following keywords and search terms were combined in the electronic search for the period between January 2002 and December 2016: Group 1: Values In Action Inventory of Strengths; VIA-IS; Character strengths; VIA, Group 2: Satisfaction with life; Life Satisfaction; Satisfaction With Life Scale (SWLS).
Following the same procedure as Study I, and to prevent the file drawer problem associated to the presence of unreported correlations, we contacted the VIA Institute on Character and investigators in the field using the same criteria as Study I, but data to report were correlations between character strengths and SWLS. Three of the authors then sent information about those correlations computed that were not included in the article published.
All articles were analyzed by three independent reviewers, and discrepancies were resolved through discussion (see Supplementary Table 3 for more details). Interrater reliability was .94 (see Supplementary Table 9 for a description of the inclusion and exclusion criteria and Supplementary Table 10 for the studies included in Study II). Figure 2 shows the flow diagram for Study II.
Flow chart for Study II.
Statistical analyses
Pearson's correlation coefficients (r) were extracted from the included studies. Following Hafdahl and Williams' (2009) recommendations, correlation coefficients were transformed using Fisher's Zr. A random effects model was considered because this type of model accounts for the heterogeneity of studies through a statistical parameter representing the interstudy variation. Furthermore, the pooled estimate of Pearson's correlation was weighted according to its inverse-variance. Resulting Zr values were transformed back into meta-analytic Pearson's coefficients for reporting. Homogeneity was estimated using the Q statistic (Hunter & Smith, 1990) and I2 index (Higgins & Thompson, 2002). Trim-and-fill procedures (Duval, 2005; Sterne et al., 2011) were used to account for publication bias (see Supplementary Table 11 for more details). The analysis was carried out using R software (R Core Development Team, 2018) and meta (Schwarzer, 2014) and metafor packages (Vietchbauer, 2014).
Results
Overall effect sizes and homogeneity: Correlations between character strengths and SWLS Scores.
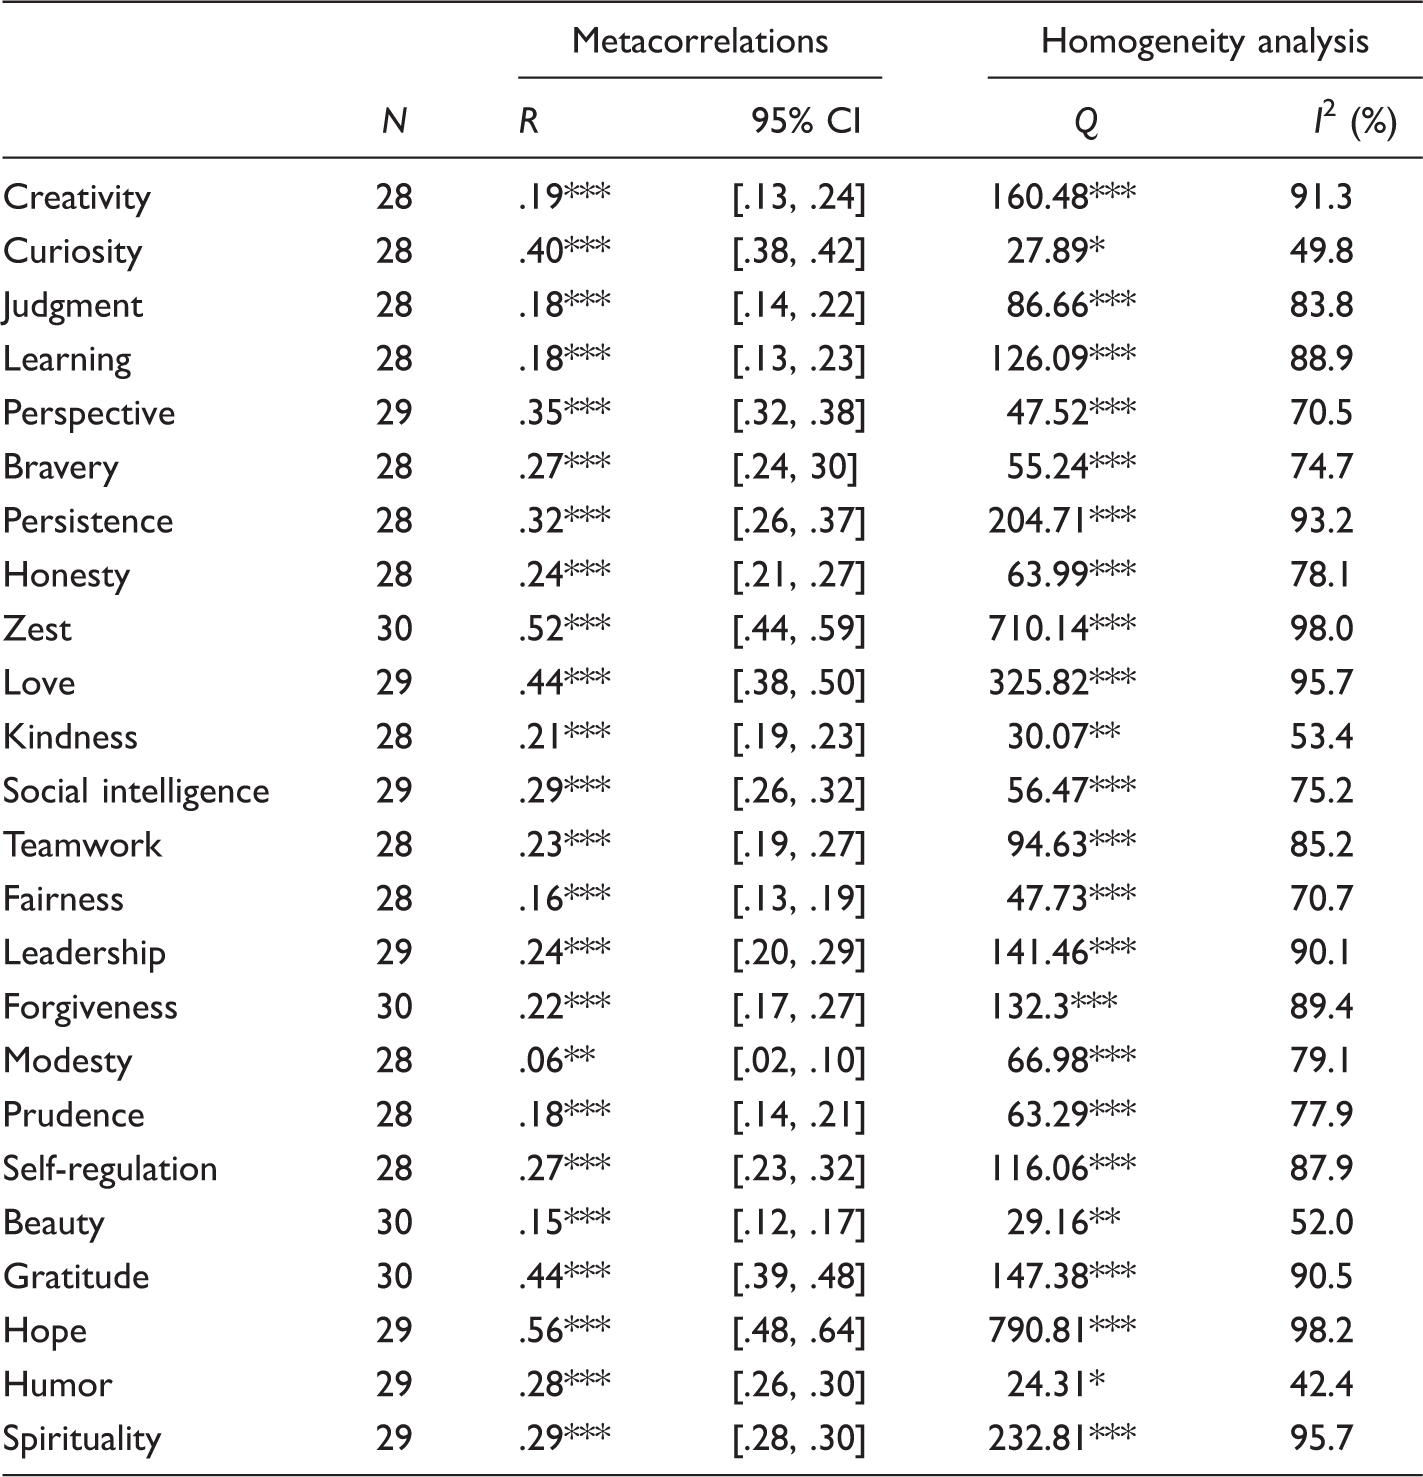
Note: SWLS: Satisfaction With Life Scale.
*p<.05. **p<.01. ***p<.001.
Discussion
The aims of these two meta-analyses were first to examine the scales that are more affected by a high heterogeneity in the reliability estimation and, second, to establish how this might influence the relationship between character strengths and life satisfaction. Hence, it is shown that heterogeneity of reliability might play an important role in evaluating the quality of substantive studies such as meta-analyses of Pearson's correlations. This research thus aimed to show the need to perform an RG before performing a meta-analytical study. The RG allows to distinguish between different sources of error such as the measurement error (inherent to the test scores precision) and the estimation error (related to the statistical analyses) when interpreting the correlation patterns. The VIA-IS was chosen as an example of a widely used inventory.
The RG study focused on 25 internal consistency reliability estimates (alpha coefficients) obtained from 23 articles. Character strengths internal consistency varies from .71 (Self-regulation) to .86 (Creativity). These values are usually considered recommendable when applying tests for exploratory research purposes, as well as when taking the lower limit of .80 for general research purposes (Nunnally & Bernstein, 1994). However, the reliability estimates show a high heterogeneity (22 scales obtained I2 values higher than 90%), suggesting that there is some systematic variance that cannot be explained by sampling error. Therefore, the values of reliability are not directly generalizable through all the applications. Different characteristics of the studies such as the standard deviation of total scores, sample type, and the test version explain part of the heterogeneity of character strengths' reliability.
To have an overview of the impact of moderating variables, a model that incorporated all the relevant moderator variables was generated. The moderator variable that exhibited the strongest relationship with reliability was the standard deviation of total scores. This moderator variable that has a statistical origin (Crocker & Algina, 1986) affected most of the scales of the VIA-IS, varying the
Although the percentage of variance explained in most cases is high, it is important to note that the generalizability of reliability is not measured by the Character strengths that have high percentage of variance of reliability explained by the moderators considered in this study: Self-regulation, Curiosity, Zest, Modesty, Prudence, Love, Judgment, and Gratitude. Character strengths with moderate percentage of variance explained by the moderators analyzed in this study: Creativity, Hope, Humor, Bravery, Forgiveness, Fairness, and Love of learning. Character strengths with RMPE: Appreciation of beauty and Spirituality.
In the second meta-analysis, it is shown that character strengths in the VIA classification were associated with life satisfaction (Peterson & Seligman, 2004; Wood, Linley, Maltby, Kashdan, & Hurling, 2011). The higher a given character strength, the more life satisfaction was reported. Nevertheless, some of these traits appeared to be more correlated to life satisfaction than others. As Park et al. (2004a, 2004b) showed in their initial studies, Curiosity, Zest, Gratitude, and Hope were among the strengths that were most related to life satisfaction. Other character strengths such as Modesty and Prudence were less associated with life satisfaction.
Summary: Reliability generalization and correlations.

Note: Cutpoints for correlations are based on Cohen (1992) and for
RG: reliability generalization; RMPE: recommended minimum effect size representing a practically significant effect.
The lack of reporting of the reliability estimates for the test scores may lead to inappropriate interpretations and conclusions (Cousin & Henson, 2000). Moreover, the lack of precision of the test scores may lead to an inconclusive result and may generate sources of variability associated to the measurement error that is added to the estimation error. Our study allows to conclude that RG studies are a prerequisite for conducting a meta-analysis on other variables since the results of Study I and Study II taken simultaneously point out the role of the relationship between the reliability of test scores and substantive studies, such as Pearson's correlations meta-analysis.
Finally, these results might be of interest for researchers using the VIA-IS. For example, the reliability of the scores has shown limitations in terms of its generalizability to different populations (e.g., Appreciation of beauty, Honesty, Kindness, Social intelligence, Leadership, and Teamwork). However, other dimensions such as Curiosity, Zest, Love, and Gratitude have shown greater generalizability and have also shown a more consistent relationship with life satisfaction. In other words, our results show that there are some character strengths measured by the VIA-IS, which should be used with caution since it has been observed that the heterogeneity found in their reliability coefficients varies in an unknown way. Consequently, there may be differences in the intensity of the correlations that are not solely related to the defining elements of each strength but also to a low metric quality of the evaluated construct.
Limitations and directions for future research
The main limitation is related to the selection of primary studies for these meta-analyses. Although the VIA-IS is one of the most popular self-report inventories for the assessment of positive traits, there are few studies that consider its psychometric properties when assessing different populations, which reduces the number of eligible studies for both meta-analyses. In addition, the applied procedure for collecting relevant data is rather limited, since numerous publications that used the VIA-IS did not report detailed internal consistencies for all scales, and they were not considered (i.e., authors of these studies were not contacted and asked for further information). Furthermore, there were studies that were excluded because they only computed the internal consistency of the whole VIA-IS or made reliability induction. These (incorrect) practices did not allow the study of the accuracy of the measurement of each scale. In addition, two studies did not include the reliability of Self-regulation, and other did not include the reliability of Zest, and details about those exclusions were not provided. It may have influenced the confidence intervals of the reliability of the scores for these character strengths had wider amplitude. These issues might be related to the results of the trim-and fill analyses. In Study I, it is observed that there are slight variations in reliability in the case of character strengths with studies imputed with a trim-and-fill procedure. This implies that the risk of publication bias in this study is low. However, in Study II, the results suggest that there are certain character strengths whose correlations with life satisfaction might be affected by publication bias or even the presence of missing values.
Studies Included in Study I and Study II.
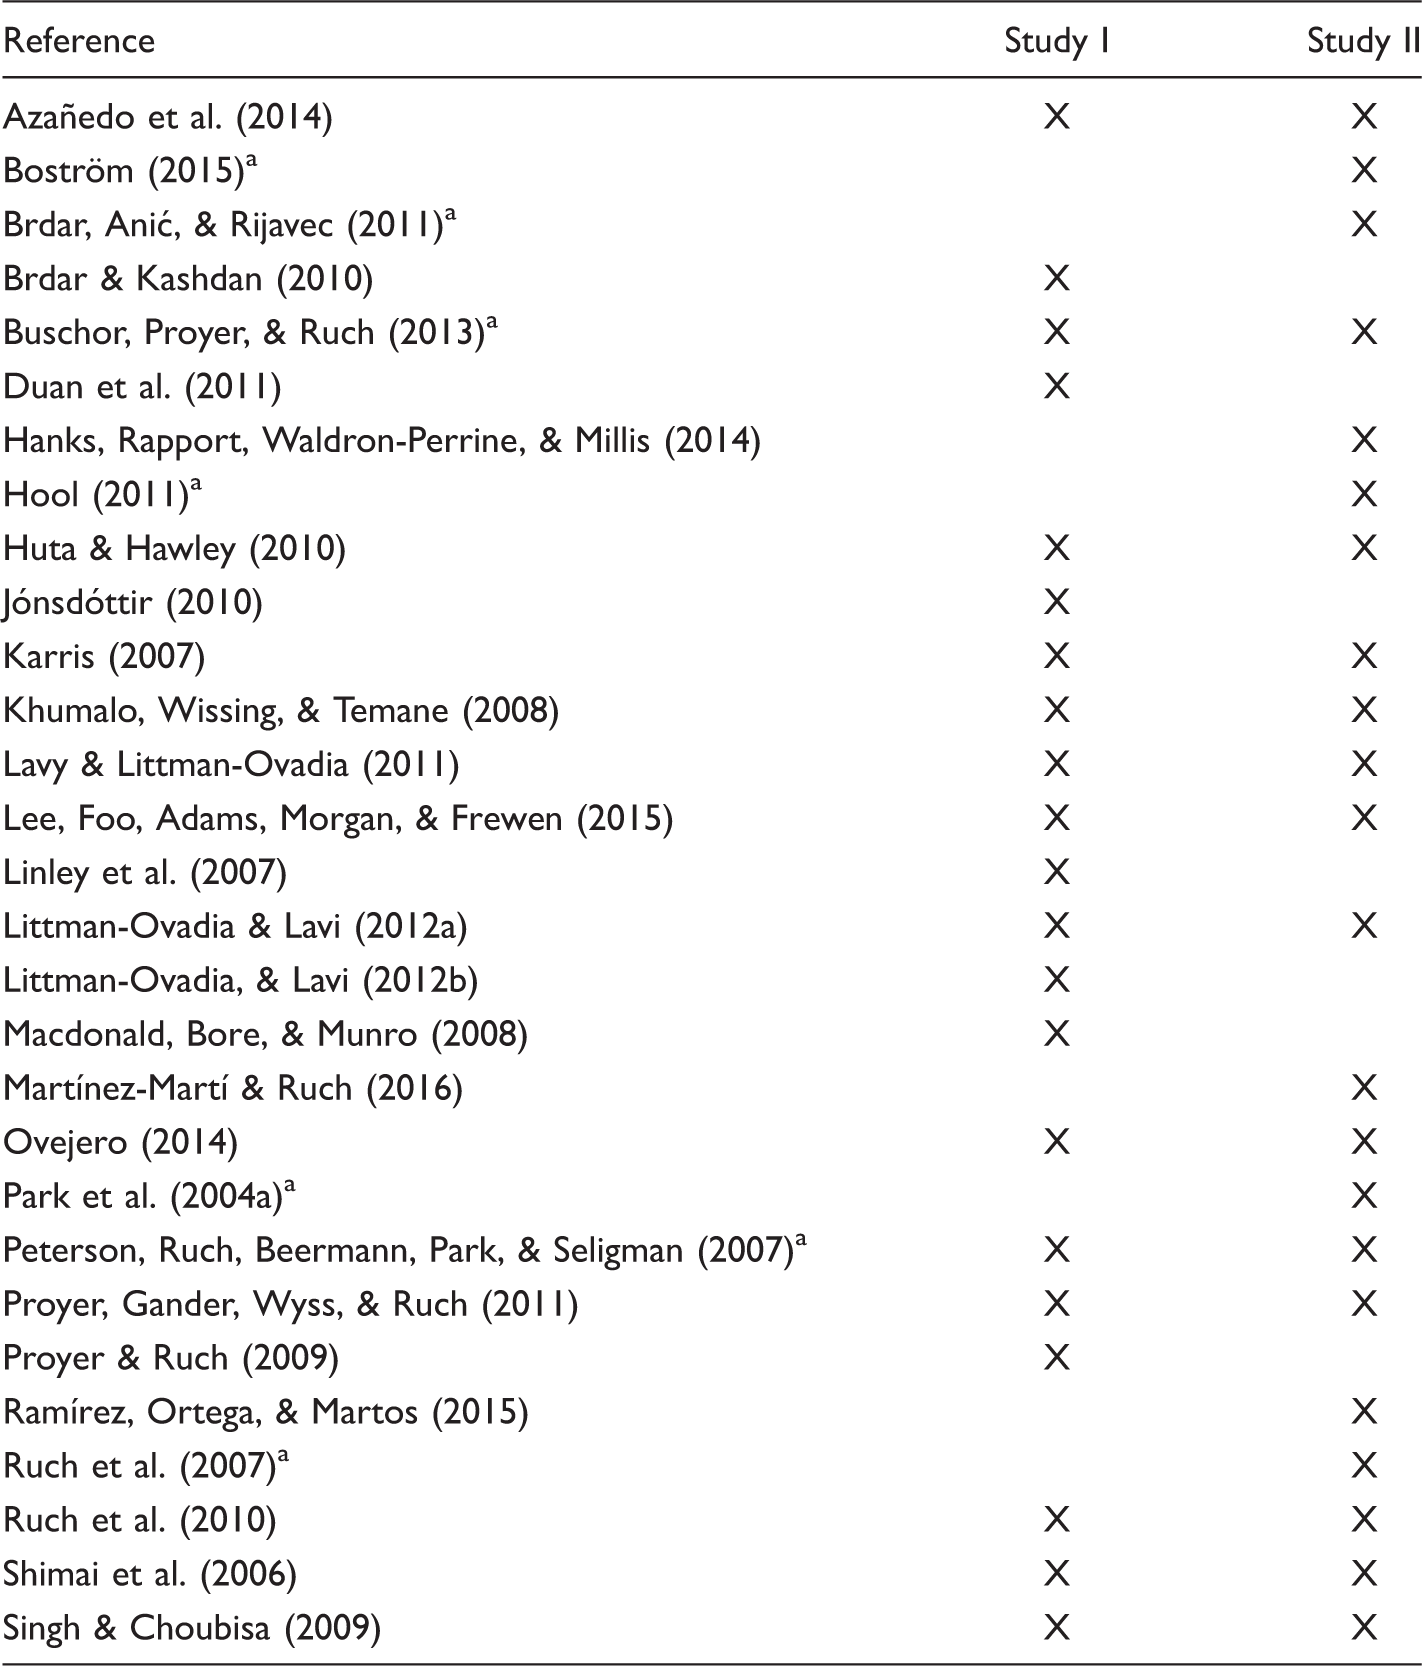
aStudies with more than one sample (see details in supplementary material).
Regarding the second meta-analysis, it is important to mention that causation cannot be inferred from these correlations. More studies are needed to quantify whether the character strengths truly promote life satisfaction, or if certain levels of satisfaction with life may enhance character strengths. Furthermore, the data meta-analyzed in the present study are strictly based on self-reports measures. This situation might lead to an inflation of the correlations due to shared method variance.
The results of the present study emphasize the great importance of reporting reliability in primary studies to increase and guarantee the validity, generalization, and quality of the results included in the research work (Bannigan & Watson, 2009; Wilkinson & APA Task Force, 1999). It is also important to take into account the heterogeneity of reliability estimation as a source of additional variation that may affect more substantive content meta-analysis (Dimitrov, 2002), such as meta-analysis of correlations.