
Abstract
Spirituality and spiritual well-being are connected with many areas of human life. Thus, especially in secular countries, there is a need for reliable validated instruments for measuring spirituality. The Spiritual Well-Being Scale is among the world’s most often used tools; therefore, the aim of this study was its psychometrical evaluation in the secular environment of the Czech Republic on a nationally representative sample (n = 1797, mean age: 45.9 ± 17.67; 48.6% men). A non-parametric comparison of different sociodemographic groups showed a higher disposition for experiencing spirituality among women, older people, and divorced persons. Based on confirmatory factor analysis, negatively worded items were excluded using a polychoric correlation matrix. The new version of the scale consisting of 11 items had good internal consistency (Cronbach’s α = 0.85; McDonald’s ωt = 0.91). The two-factor model of this shortened version, with factors corresponding to the Religious and the Existential subscales of the Spiritual Well-Being Scale, shows a satisfactory fit with the data, where the loadings of all items ranged from medium to high. Thus, this study offered a new version of the tool, convenient for measuring spiritual well-being in secular conditions.
Introduction
In recent years, the need to measure spirituality as a factor influencing health and well-being has arisen in the scientific world, and the construct of spirituality has been broadly examined (Koenig, 2008). Attention toward the concepts of spirituality and religion has intensified, and many empirical studies have been published in recent decades. Nevertheless, as researchers point out, the concepts of religiosity and spirituality are not clearly and uniformly defined in the scientific community, which can make comparing different studies difficult (Hill & Pargament, 2003; Koenig, 2008). Moreover, research instruments used in countries with predominantly religious population might not be suitable for secular countries.
Among the many tools for measuring spirituality, the Spiritual Well-Being Scale (SWBS) developed by Paloutzian and Ellison (Ellison, 1983; Paloutzian & Ellison, 1982) is one of the most widely used. The scale has been used in different settings on a wide variety of different samples specific for the particular setting (Ellison, 1983). The SWBS measures two dimensions of spiritual well-being: the vertical one, Religious Well-Being (RWB), represents well-being related to God, while the horizontal one, Existential Well-Being (EWB), focuses on a meaning of life and life satisfaction.
Since the psychometric evaluation of the SWBS has been examined in many settings, it has led to different results. The two-factor structure of the scale found by Ellison (1983) was disputed in later studies. As the RWB and EWB subscales correlate with each other and show a high correlation to the overall SWB (Ellison, 1983), it might be considered, as Gorsuch (1984) argued, that they share a single general religious factor. Ledbetter, Smith, Fischer, Voslerhunter, and Chew (1991) showed that neither the general factor model nor the two-factor model provided a satisfactory conceptualization of the SWBS factor structure and suggested that the scale might be factorially complex. Further studies suggested different factorial structures of the SWBS, depending on the sample used. Thus, Genia (2001) confirmed the original two-factor structure on a sample of college students, while Miller, Fleming, and Brown-Anderson (1998) found a three-factor structure in Caucasian subjects and a five-factor structure in African-Americans. However, Utsey, Lee, Bolden, and Lanier (2005) did not confirm this five-factor model on a different African-American sample. Scott, Agresti, and Fitchett (1998) and Gow, Watson, Whiteman, and Deary (2011) identified a three-factor structure in their studies. Other language variations of the SWBS did not show a clear structure either. Musa and Pevalin (2012), for example, reported a two-factor structure in a sample of Jordanian patients, and Martinez, Almeida, Garcia, and Carvalho (2013) found a three-factor structure of the SWBS in a sample of Portuguese students. Murray, Johnson, Gow, and Deary (2015) suggested that the additional factors identified in these studies might not reflect substantive constructs, but reveal only the presence of common variance due to methodological artifacts, such as item wording, item complexity, and different understanding of items among religious and nonreligious individuals.
The Czech Republic is an area of special interest in spirituality research, because according to the Pew Research Center (2014), it is the country with the highest percentage of religiously unaffiliated people in the world, and a recent national representative study report only 9.4% of respondents affiliating themselves to any church or religion (Malinakova et al., 2018). Therefore, there is a dramatic decrease in the percentage of religiously affiliated population from 1991, where 44% of the population identified themselves as Catholic, to 2018. Such a shift may be related to the history of the country, concretely to the 40 years of the communist regime. That period strengthened already existing negative attitudes toward the church (Nešporova & Nešpor, 2009), which were probably linked to the Czech reformation (Hussitism) in the 14th century, forced re-Catholicization in the 17th and 18th century and a rise of nationalism in the late 19th and early 20th centuries (Hamplova & Nespor, 2009).
This secular setting could possibly modify the studied associations with spirituality which have been reported in countries where a majority of population identify themselves as believers. Therefore, the aim of this article was to present adaptation and validation of the Czech version of the SWBS questionnaire and to evaluate its psychometric properties in a representative sample of Czech population.
Methods
Participants and procedure
The Czech version of the SWBS was used as a component of a broader national representative survey focused on health and a healthy lifestyle of Czech adults. First, in November 2013, the questionnaire was piloted among 228 participants, which resulted into the final version of the survey. Consequently, from November to December 2013, other 2089 participants were randomly chosen using quota sampling. This type of sampling imitates in the sample the known characteristics of the population. In this case, the study employed the criteria that allowed the construction of the representative sample that corresponds to the adult Czech population (older than 15 years) with regard to gender, age, education, and regional affiliation. However, 292 (14.0%) participants refused to take part in the survey. As the main reasons for doing so, they reported that they did not have enough time (49.5%), that they were not interested or did not trust this kind of research (21.4%), and that the survey was too long (13.2%). Thus, the final sample consisted of 1797 respondents aged 15 years and older. A process of data collection was carried out by professional administrators using a standardized face-to-face interview.
All procedures were done according to the ethical standards of the institutional and national research committee and the 1964 Declaration of Helsinki and its later amendments.
Measures
The original SWBS was translated into Czech by two independent translators specializing in translations of psychological literature. The two versions, especially the differences in the translation, were discussed in a working group consisting of the translators and researchers in order to create the unified version of the instrument. Consequently, this version was translated back into English by a professional native English translator fluent in Czech. In the next step, the translated version was compared with the original version of the scale. The final version was discussed in a focus group which consisted of both religious and non-religious members representing also different religious affiliations and understanding of spirituality. None of the items were identified as problematic, and the Czech translation of the SWBS was considered suitable for use in further research. The final Czech version was afterwards approved by the author of the scale.
The SWBS consists of 20 items, which can be answered on a six-point scale ranging from strongly agree (in our study corresponding to one point) to strongly disagree (in our study corresponding to six points). Negatively worded items have reverse scoring. Thus, in this form, the higher summary score would correspond to a lower level of spirituality. However, for the purpose of a better presentation of the results, we reverted the score of the positive items, so a higher SWBS score corresponds to a higher level of spirituality.
It takes approximately 10 to 15 minutes to answer the questions. The scores of the odd items are summed up to create a final score for the RWB scale. The scores of the even items are intended to measure the EWB scale. In each subscale, the final scores can vary from 10 to 60. Consequently, the total SWBS score ranges between 20 and 120.
Statistical analyses
Normality of the data distribution was appraised by histograms and then tested with the Shapiro–Wilk test. The total score of the SWBS and its individual items were shown to be non-normal, thus nonparametric tests were applied for statistical comparison of groups: the Wilcoxon rank-sum and the Kruskal–Wallis tests. In case of multiple group comparison, the Bonferroni correction was employed.
Confirmatory factor analysis (CFA) was used to assess the factorial structure of the questionnaire. Due to the categorical nature of the scale items, CFA was based on the matrix of polychoric correlations. For CFA, the lavaan R Package was used, which employs the diagonally weighted least squares estimator of ordinal items parameters. Several indices of acceptability of model fit were used: comparative fit index (CFI) and Tucker–Lewis index (TLI) > 0.95; standardized root mean square residual (SRMR) < 0.07; and root mean square error of approximation (RMSEA) < 0.06 (Yu, 2002). Cronbach’s alpha and McDonald’s omega were employed to assess the reliability of the SWBS. For sociodemographic comparisons, the SWBS as well as its subscales were used as continuous variables. All statistical analyses were carried out with the R software, version 3.6.0.
Results
Factorial validity
The descriptive statistics of all items of the scale are presented in Table 1. The correlation coefficient used in Table 1 corrects for the overlap of items (R Core Team, 2017). All positively formulated items of the SWBS show an acceptable strength of correlation with the scale (emphasized in boldface in Table 1). The correlation coefficients of the positive items range from r = 0.30 to r = 0.59. Most of the negatively formulated items, however, do not show an acceptable correlation with the scale. There are correlations as low as r = 0.20 to r = 0.09. One of the negatively worded items (item no. 13) even has a negative correlation with the scale.
Descriptive statistics of the SWBS items.
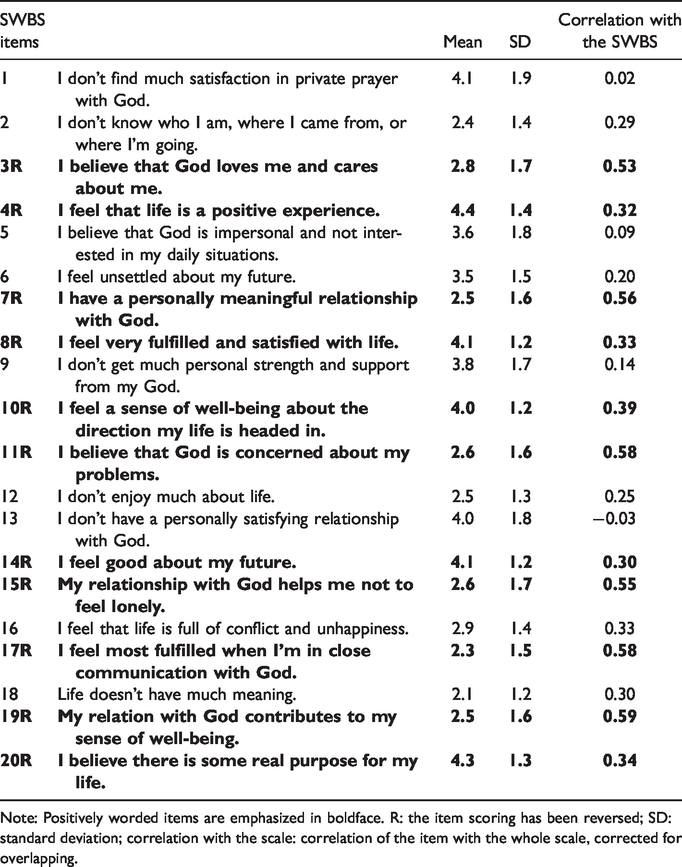
Note: Positively worded items are emphasized in boldface. R: the item scoring has been reversed; SD: standard deviation; correlation with the scale: correlation of the item with the whole scale, corrected for overlapping.
Our data met the standard criteria for using factor analysis as described in Cerny and Kaiser (1977): statistical significance of the Bartlett’s test of sphericity and the Kaiser–Meyer–Olkin (KMO) coefficient > 0.80. The KMO test measures sampling adequacy for each variable in the model and for the complete model, in our case, the KMO = 0.91. In CFA, χ2 assess the overall fit and the discrepancy between the sample and fitted covariance matrices. In our case, χ2 (190) = 16808.9, p < 0.001. A unidimensional (one-factor) model as well as a two-factor model (with factors RWB and EWB) were considered for the CFA according to the theoretical background of the SWBS (Ellison, 1983). In a one-factor CFA model, the loadings of several items are positive, while those of several items are negative. The criteria values of CFI, TLI, SRMR, and RMSEA (see Table 2) show that the model does not have a satisfactory fit to the data. In a two-factor CFA model, the positive items have positive loadings, while the negative items have negative loadings. The two-factor model shows a better fit to the data than the unidimensional model (CFI and TLI ≥ 0.95), but the residuals are too high (SRMR and RMSEA > 0.1), see Table 2.
Parameters of fit of several CFA models on the complete SWBS and on the SWBS consisting of positively worded items only.

Note: An acceptable model fit was considered CFI, TLI > 0.95; SRMR < 0.07; and RMSEA < 0.06. DWLS: diagonally weighted least squares; CFI: comparative fit index; TLI: Tucker–Lewis index; SRMR: standardized root mean square residual; RMSEA: root mean square error of approximation; CI: confidence interval.A scaled difference chi-square test p < 0.001.
Thus, in the next step, we excluded the negatively worded items from the scale and performed the CFA analysis on the 11 positively worded items only. In a one-factor model, several items have low loadings (with values < 0.50). The unidimensional model does not meet the criteria of satisfactory fit to the data (see Table 2). However, the two-factor model consisting of the positive items only shows a satisfactory fit: CFI = 0.998, TLI = 0.997, SRMR = 0.049, RMSEA = 0.059 (90% confidence interval (CI): 0.053‒0.066). There are medium to high loadings of all items, with values of 0.80‒0.92 in the RWB subscale and 0.54‒0.80 in the EWB subscale. The correlation between the RWB and EWB subscales is r = 0.15. The structural equation model with two factors on positive worded items is presented in Figure 1.
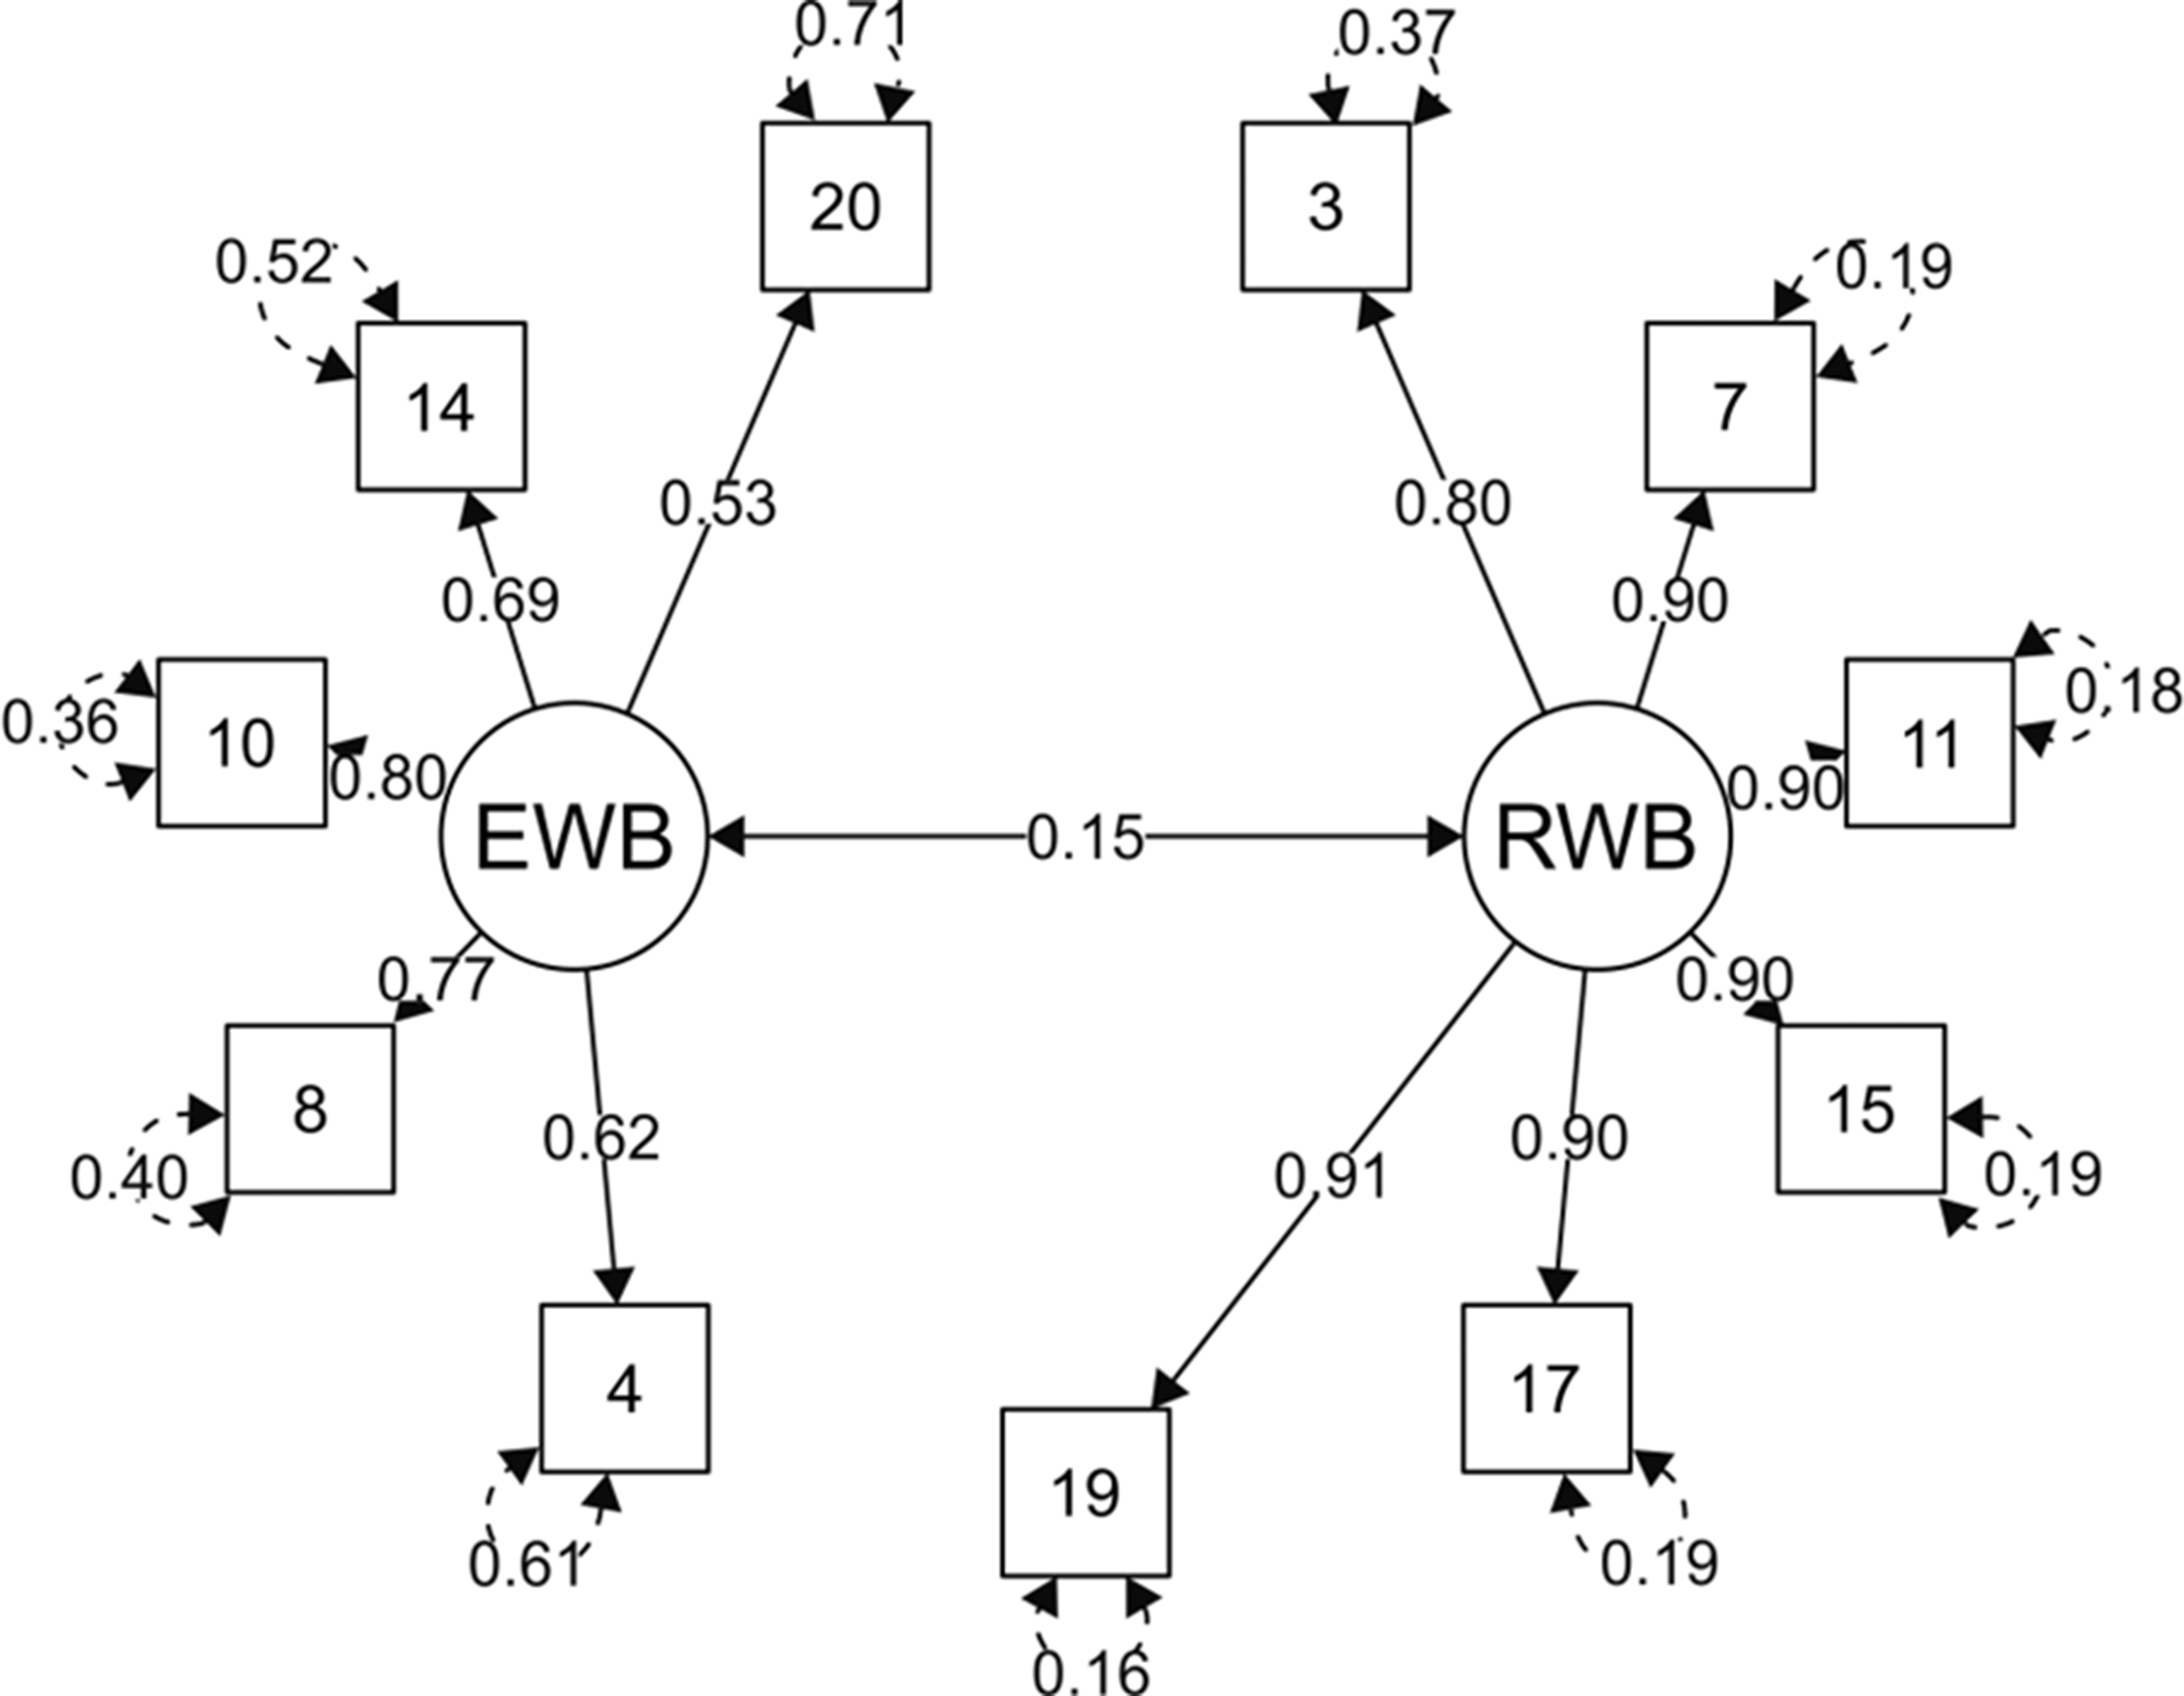
Structural equation model of the SWBS with two factors, with positively worded items only. RWB: Religious Well-Being; EWB: Existential Well-Being.
Reliability
The reliability of the complete and the shortened version of the SWBS was verified with the Cronbach’s alpha and McDonald’s omega coefficients. The complete 20-item scale shows an unacceptably low internal consistency, with α = 0.65 (95% CI: 0.63‒0.68) and ω = 0.83.
After excluding the nine negatively formulated items, the Czech version of the scale has an acceptable reliability, with Cronbach’s α = 0.85 (95% CI: 0.84‒0.86) and McDonald’s ω = 0.91. The reliability of the RWB subscale with positive items is α = 0.94 (95% CI 0.93‒0.94) and ω = 0.95; the reliability of the EWB subscale with positive items is α = 0.77 (95% CI 0.76‒0.79) and ω = 0.80. Based on the results of CFA and internal consistency, all subsequent analyses were performed on the shortened SWBS with 11 positive items.
Sociodemographic differences
Descriptive statistics of the demographic characteristics are shown in Table 3. The total score of the shortened SWBS and its subscales was compared among different sociodemographic groups. The scores were not normally distributed; therefore, non-parametric statistics were employed to test the differences. Table 3 shows the results of the non-parametric comparison of the shortened SWBS total score (with 11 positive items) and its RWB and EWB subscales (gender differences were tested with Wilcoxon rank-sum test, other comparisons with Kruskal–Wallis test).
Descriptive statistics of the data set.

Note: The p-value denotes all-group comparison, while results in parentheses denote multiple group comparison with the Bonferroni correction. SD = standard deviation; n.s. = non-significant; SWBS: Spiritual Well-Being Scale; RWB: Religious Well-Being; EWB: Existential Well-Being.
***p < 0.001; **p < 0.01; *p < 0.05.
In the shortened SWBS and its RWB subscale, men were found to have slightly lower mean scores than women, where the differences are statistically significant but with a small effect size (p < 0.001, Cohen’s d = 0.15, η2 = 0.006 in SWBS and d = 0.16, η2 = 0.007 in RWB). The Wilcoxon rank-sum test showed no significant difference in EWB score between men and women. No statistically significant differences were found in the EWB subscale in either the age groups or the marital status groups. Older people tended to have higher mean scores than younger participants in the SWBS as well as in the RWB (p < 0.001, d = 0.32, η2 = 0.025 in SWBS and d = 0.41, η2 = 0.041 in RWB). According to the post hoc analyses, the oldest groups of 60–69 and 70+ years and almost all younger groups showed statistically significant differences in both the SWBS and the RWB. In marital status groups, the highest mean SWBS and RWB scores were obtained for widows/widowers, while the lowest mean scores were obtained for single people (p < 0.001, d = 0.27, η2 = 0.018 in SWBS and d = 0.35, η2 = 0.030 in RWB). No statistically significant differences were found in the education groups in the SWBS and RWB. However, differences were found in the EWB subscale: the groups with higher education had higher mean EWB score (p < 0.001), but with only a small effect size (d = 0.23, η2 = 0.013). Religious subjects were found to have higher mean scores in the SWBS, RWB, and EWB than non-religious people (p < 0.001, d = 1.34, η2 = 0.31 in SWBS, d = 1.55, η2 = 0.38 in RWB and d = 0.17, η2 = 0.007 in EWB). In both the SWBS and RWB, there were significant differences even between the two groups of religious subjects of those who attended a church and who were not affiliated to a church.
Discussion
We found that while the positively formulated items of the SWBS showed satisfactory high positive correlations with the scale, the correlations of the negative items were low or even negative. Neither a one- nor a two-factor model of the full scale showed a satisfactory fit with the data. However, a satisfactory fit was achieved by examining a two-factor model consisting only of the positive items, with the factors corresponding to the RWB and EWB subscales of the SWBS. Problems with negative items also manifested themselves in the fact that the complete 20-item scale showed an unacceptably low internal consistency, while its shortened version consisting of only 11 positive items showed good values.
Our first finding of a multiple factor structure differs from the two-factor structure which proposed the authors of the scale (Ellison, 1983) but corresponds to the results of other authors, who reported finding three (Musa & Pevalin, 2014) or more (Miller et al., 1998) factors. There are several possible reasons for such a multiplicity. First and most important, the factor structure and psychometric coefficients are properties of the data set. The individual researchers used different samples, and so the various results could rather reflect the variability of the research samples and the understanding of the meaning of the scale items by the respondents. Second, the scale has a known ceiling effect, as the data tend to be negatively skewed, especially in religious groups. Consequently, the scale does not differentiate well among people who score above the median (Bufford, Paloutzian, & Ellison, 1991; Genia, 2001; Ledbetter et al., 1991), and so data are often not suitable for the use of the parametric correlational techniques (Bufford et al., 1991). The violation of assumptions in statistical procedures could lead to statistical distortions and the resultant potentiality for ambiguous or confounding interpretations (Ledbetter et al., 1991). Third, besides using different samples, factor analytic studies of the SWBS have employed different statistical techniques (Genia, 2001). A fourth explanation was suggested by Malinakova et al. (2017), who proposed that in some cases the occurrence of other factors could be a consequence of a distortion created by the use of negatively worded items. The authors based their study on a psychometric evaluation of a shortened 10-item version of the SWBS in a representative sample of Czech adolescents and came to the same conclusions as this study.
Besides, our findings are in line with the results of another study reporting the same effect of negatively worded items on another scale, the Functional Assessment of Chronic Illness Therapy-Spiritual Well-Being (Sarnikova, Malinakova, Furstova, Dubovska, & Tavel, 2018) and with the other research in this area, which showed that reverse-worded items could contaminate results due to respondents’ inattention and confusion (van Sonderen, Sanderman, & Coyne, 2013). The fact, that part of the respondents does not choose the option that corresponds to their real feeling, but because of their lack of focus choose the exact opposite, may naturally lead to the inconsistency in the scale and the consequent lower internal consistency values. Moreover, it is also possible, especially in a highly secular environment, that a respondent’s choosing of the option “I strongly disagree” of a negatively worded item may also be interpreted as their disapproval of the way in which the items were formulated, as these items implicitly assumed the existence of God or some kind of religious belief (Malinakova et al., 2017). The fact that the scale achieved a clear two-factor structure after all the reversed items were removed may support this idea.
Our another finding is that the EWB subscale of the SWBS showed a lower reliability as well as lower loadings of the items than the RWB subscale. Other authors (Ellison, 1983; Gow et al., 2011; Utsey et al., 2005) have also described a lower reliability. An explanation of our findings could be that the EWB represents a more heterogeneous construct. While all the RWB items are focused on the relationship with God, the items of the EWB cover several different, though related areas, as they refer to life purpose, satisfaction, and the vision of the future. Even the respondents with a strong belief in the meaning of their life might feel worried about their future, e.g., due to their difficult life situation. Moreover, it is also possible that these items are formulated in a way that may be understood differently by different people, depending on their cultural background and other factors. Furthermore, some of these items might be more easily influenced by their current emotional state.
Based on the previous findings, subsequent sociodemographic analyses were performed on the shortened version of the SWBS consisting of only positively worded items. Compared to other categories, slightly higher SWBS scores were observed among women, older people, and divorced persons. Our findings of higher spirituality among women correspond to those published another representative Czech adult samples (Malinakova et al., 2018; Sarnikova et al., 2018) and are in line with other research in this area, which came to the same conclusions (Kim, Martin, & Nolty, 2016). Given the fact that these studies used different spirituality scales, it seems that this finding could be universal and not associated with a specific research tool. Nevertheless, as Malinakova et al. (2019) described higher spirituality among boys in a representative Czech adolescent sample, further research is needed to conclude whether we can generalize the present findings to the whole population. Besides, the way of assessing spirituality (continuous vs. dichotomized) also has to be considered. Our findings of higher spirituality in the older age category are in line with other studies (Malinakova et al., 2018) and might be possibly explained by the existence of age cohorts (Hamberg, 1991) or by a growing need to review one’s life and find its meaning while facing the approaching end of life (Tavel, 2004). Regarding the higher spirituality among the widows/widowers, our research agrees with the findings of other authors, who suggest that these respondents often use religious coping as a way to deal with the loss of a spouse (Michael, Crowther, Schmid, & Allen, 2003).
Strengths and limitations
The findings of this study are based on the large and representative sample of Czech adults, which represents its first strength. It is also the first validation of the full version of the SWBS in the secular Czech environment. The other strength is that this study offers a new version of the tool which is convenient for this type of environment.
A limitation of our study could be the fact that a self-reported approach, as used in this study, might be more prone to a social desirable responding. It is also possible that for the non-religious respondents the wording of some questions (especially the negatively worded items asking about the relationship with God) might have been problematic and therefore difficult to answer.
Implications
Our results show that greater attention must be paid to negatively worded questions, which can disrupt the results of psychometric evaluations. Therefore, excluding these items should be considered, especially regarding negatively worded items in a secular environment.
Conclusion
This study presents a successful validation of the Czech version of the SWBS, which can be used for assessing spirituality in various sociodemographic groups of Czech population.
We found that the shortened version of the SWBS scale containing 11 positively formulated items (6 RWB and 5 EWB) shows a satisfactory fit with the data and is therefore a convenient tool for assessing both religious and non-religious adult spirituality in a secular setting. Moreover, this study contributes to a cross-cultural research in spirituality and well-being.