
Abstract
Paranormal beliefs (PBs) are common in adults. There are numerous psychological correlates of PBs and associated theories, yet, we do not know whether such correlates reinforce or result from PBs. To understand causality, we developed an experimental design in which participants experience supposedly paranormal events. Thus, we can test an event’s impact on PBs and PB-associated correlates. Here, 419 naïve students saw a performer making contact with a confederate’s deceased kin. We tested participants’ opinions and feelings about this performance, and whether these predicted how participants explain the performance. We assessed participants’ PBs and repetition avoidance (PB related cognitive correlate) before and after the performance. Afterwards, participants rated explanations of the event and described their opinions and feelings (open-ended question). Overall, 65% of participants reported having witnessed a genuine paranormal event. The open-ended question revealed distinct opinion and affect groups, with reactions commonly characterized by doubt and mixed feelings. Importantly, paranormal explanations were more likely when participants reported their feelings than when not reported. Beyond these results, we replicated that 1) higher pre-existing PBs were associated with more psychic explanations (confirmation bias), and 2) PBs and repetition avoidance did not change from before to after the performance. Yet, PBs reminiscent of the actual performance (spiritualism) increased. Results showed that young adults easily endorse PBs and paranormal explanations for events, and that their affective reactions matter. Future studies should use participants’ subjective experiences to target PBs in causal designs (e.g., adding control conditions).
Introduction
Paranormal beliefs (PBs) are common in the Western world, whether assessed in children or adults (Hutson, 2012; Knittel & Schetsche, 2012; Moore, 2005; Rice, 2003). Broadly speaking, PBs include superstitious, paranormal, extra-terrestrial, religious, spiritual, and supernatural beliefs (Lindeman & Svedholm, 2012). Developmental studies have shown that PBs are dominant in childhood when children often mix up fantasy and reality (Subbotsky, 2004a; Woolley, 1997). Various well-known authors placed the abundance of PBs to what Piaget coined as the preoperational stage of childhood (Freud, 1950; Piaget, 1928, 1929; Werner, 1948). Accordingly, PBs should disappear, or at least diminish, as the child becomes older. The critical period for PBs to disappear – making room for critical and scientific thinking – should occur around six years of age (Piaget, 1929; Subbotsky, 2000, 2004b; Woolley, 1997). Yet, these assumptions do not match reality, because PBs are frequent in adulthood (Nemeroff & Rozin, 2000; Subbotsky, 2004b). We developed an experimental design to help understand the causal mechanisms that explain the persistence and/or formation of PBs in adulthood (see Mohr et al., 2019, for the theoretical rational). In this design, participants witness a supposedly paranormal event. We assessed whether the variables of interest changed from before to after the event; and we also measured psychological variables that might predict whether people explain the event in paranormal terms.
Previous studies have shown that PBs vary depending on situation and context. For instance, adults provided more paranormal explanations when situations were stressful (Keinan, 1994) and/or uncontrollable (Langer, 1975). Also, others have shown that verbal suggestions could increase the extent to which participants reported paranormal experiences when witnessing a “séance” (Wiseman et al., 2003) or psychokinetic phenomena (i.e., alleged psychic ability allowing a person to influence a physical object without physical interaction; Wiseman & Greening, 2005). Moreover, increases in PBs or PB-related behaviors have been observed when the denial of the paranormal might have negative consequences (Subbotsky & Quinteros, 2002). Finally, participants may explicitly state that they do not believe in the paranormal, but their behavior suggests that they implicitly consider the possibility of paranormal events (see also Nemeroff & Rozin, 1994; Subbotsky & Quinteros, 2002). Such studies indicate that (1) situations and context influence the extent to which PBs are acknowledged, and (2) a range of different measurements might be required to elicit PBs, for example, explicitly asking about beliefs (PBs), but also testing PB-related behavior.
Standardized PB questionnaires allow us to measure people’s explicit PBs (Prike et al., 2017; Thalbourne & Delin, 1993). Likewise, we can assess PB-related behavior with cognitive measures that have previously been associated with enhanced PBs. Examples of such measures include (1) tasks that show a tendency to easily associate things or events (Bressan, 2002; Rogers et al., 2011, 2016), (2) the propensity to see meaningful patterns in random noise (Blackmore & Moore, 1994; Brugger et al., 1993; Riekki et al., 2013), (3) attenuated reasoning abilities (Denovan et al., 2018; Lawrence & Peters, 2004; Lindeman & Svedholm‐Häkkinen, 2016), and (4) repetition avoidance (Brugger et al., 1990). Brugger et al. (1990) assessed repetition avoidance by asking participants to repeatedly imagine throwing a dice and to report the number they imagined on top of the dice (mental dice task). Participants high, as compared to low, in PBs showed a stronger repetition avoidance (i.e., they avoided stating sequences of identical numbers). The authors argued that this repetition avoidance represents participants’ propensity to underestimate chance, and thus to see meaning in randomly occurring events.
This mental dice task has been used to assess PB-related behavior in studies that have used staged paranormal demonstrations to investigate the causal link between cognitive biases and paranormal beliefs (Lesaffre et al., 2018; Mohr et al., 2014). In these classroom studies, participants saw a performance of paranormal nature (see also Benassi et al., 1980; Mohr et al., 2019), and the researchers assessed individuals’ PBs (Tobacyk, 2004) and repetition avoidance using a mental dice task (MDT; Brugger et al., 1990) before and after the performance. Participants were also asked to indicate the extent to which they explained the experience in psychic, conjuring, and religious terms. These studies showed that pre-existing PBs (assessed before the performance) correlated with more pronounced psychic event explanations after the performance (Mohr & Kuhn, 2020). However, these previous studies used relatively simple conjuring tricks (Benassi et al., 1980), which resulted in relatively low levels of paranormal explanations. We therefore replaced these simple tricks with a routine that had a stronger paranormal nature: a medium making contact with a confederate’s deceased kin.
When using this stronger paranormal routine, psychic and conjuring explanations were prevalent of comparable frequency (studies 2 and 3 in Lesaffre et al., 2018). However, these studies did not report significant increases in either PBs or repetition avoidance from before to after the performance. However, they did reveal that many participants seemed confused by the performance and simultaneously endorsed psychic and conjuring explanations. Lesaffre et al. (2018) additionally noted that the performance elicited strong affective responses. In light of these latter observations, the current study focused on participants’ confusion and affect. We examined whether these factors correlate with how participants experience supposedly paranormal events. For affectivity, we have some indication for its importance on beliefs (Frijda et al., 2000). For instance, PBs provided explanations for the unknown (Heine et al., 2006; Wyer & Albarracín, 2005), a sense of control (Boden & Gross, 2013), or helped to manage one’s stress (Keinan, 2002; Mascaro & Rosen, 2006; Tuck et al., 2006).
Our students experienced a performer in the classroom who allegedly contacted the deceased kin of a confederate (see Lesaffre et al., 2018; Mohr et al., 2014). Before and after the performance, we assessed PBs using a standardized PB questionnaire (Tobacyk, 2004) and repetition avoidance using the mental dice task (Brugger et al., 1990). After the performance, participants indicated the extent to which they explained the performance in psychic, conjuring, and religious terms (see also Lesaffre et al., 2018; Mohr et al., 2014). Most importantly, we asked participants to report on their opinions and feelings about the performance. We used an open-ended question to assess participants’ spontaneous accounts. We used “open coding” (Glaser & Strauss, 1968) as well as “clustering” or “theme identification” (Miles & Huberman, 1994) to determine recurrent themes. Having these themes, we could test which opinions and feelings were associated with participants’ endorsement of paranormal explanations. In addition, we expected, first, to replicate that pre-existing PBs correlate with more psychic explanations after the performance (Lesaffre et al., 2018; Mohr et al., 2014). Second, we expected no change in PBs or repetition avoidance (Lesaffre et al., 2018; Mohr et al., 2014), but PBs reminiscent of the performance (i.e., spiritualism subscale; R-PBS spiritualism scores) to increase from before to after the performance. The later prediction was based on the observation that people endorsed particular beliefs after having experienced an event that most closely resembled these beliefs (French & Wilson, 2007; Glicksohn, 1990; Irwin et al., 2013; Lan et al., 2018).
Materials and methods
Participants
We recruited 419 first-year psychology undergraduate students (291 females) at a University in the French speaking part of Switzerland. Their mean age (in years) was 20.5 (SD = 3.07; range 18–47). Participants were recruited in the classroom after an introductory social psychology lecture. The experiment was conducted directly after the recruitment in the same classroom.
Swiss Law does not require ethical confirmation for this type of study. Yet, as detailed in the general procedure section, the current study was performed in accordance with the ethical standards described in the 1964 Helsinki declaration and its later amendments or comparable ethical standards (World Medical Association, 2013).
Self-report measures
Paranormal belief questionnaire
Revised Paranormal Belief Scale (R-PBS; Tobacyk, 2004). We used its validated French version (Bouvet et al., 2014). This 26-item self-report questionnaire consists of seven subscales including Traditional Religious Beliefs (e.g., “There is a heaven and hell”), Psi (“A person’s thoughts can influence the movement of a physical object”), Witchcraft (e.g., “Witches do exist”), Superstition (e.g., “Black cats bring bad luck”), Spiritualism (e.g., “It is possible to communicate with the dead”), Extraordinary Life Forms (e.g., “The Loch Ness monster of Scotland exists”), and Precognition (e.g., “The horoscope accurately tells a person’s future”). Participants answered each item along a 7-point Likert scale ranging from 1 (strongly disagree) to 7 (strongly agree). Accounting for one reversely coded item, the scores were averaged so that higher scores reflect greater PB. Regarding R-PBS psychometric qualities, Tobacyk (2004) reported adequate validity and a satisfactory reliability. Drinkwater et al. (2017) recently assessed R-PBS dimensionality and factorial structure. They found that the seven factors (as described above) as well as the global factor (R-PBS total) best explained the data. In the current study, we calculated the R-PBS total scores and the R-PBS spiritualism scores. Cronbach alpha reliability for the R-PBS total scores was excellent for both pre (α = .89) and post (α = .91) measures, and acceptable to good for R-PBS spiritualism scores pre (α = .74) and post (α = .81) measures. These results are close to what Drinkwater et al. (2017) found in their study, for R-PBS global score (α = .93) and Spiritualism (α = .83), respectively.
Event explanation scores
We asked participants whether the performance was accomplished through (1) paranormal, psychic, or supernatural powers (psychic explanation), (2) ordinary magic trickery (conjuror explanation), or (3) religious miracles (religious explanation) using a 7-point Likert scale ; 1 for strongly disagree to 7 for strongly agree (Lesaffre et al., 2018; Mohr et al., 2014)].
Assessment of participants’ overall impression of the performance
Participants were asked about their general impression of the performance using the following open question: "Please indicate your feelings and opinions about the performance you have just seen.” Participants then freely formulated their answers. Answers were later coded for content (see qualitative data section).
Repetition avoidance using the mental dice task (Brugger et al., 1990)
Participants received written and verbal instructions to imagine throwing a dice each time they heard a beep and to write down the number that they imagined being on top of the dice (66 trials). Computer-generated beeps were played 66 times at one second intervals, during which participants wrote down the imagined number. We calculated the number of first-order repetitions (e.g. 1–1, 2–2, 3–3). If numbers were generated randomly, the number of repetitions would average 10.8 (Brugger et al., 1990, p.461). While people in general produce less repetitions than expected by chance, this repetition avoidance is stronger in believers of the paranormal than in sceptics (Brugger et al., 1990).
Magic performance
The performance closely resembled the performance described in Lesaffre et al. (2018; Study 2 and 3). To be as ambiguous as possible about the performer (avoiding the impression of an experienced stage magician or psychic), the performance accentuated the performer’s and the confederate’s discomfort of being on stage, non-professionalism, and affectivity. Specifically, a semi-professional magician (Gregory) performed the event. Gregory is a member of the FISM (International Federation of Magical Society) club of Geneva (www.lecmg.ch). He specializes in mentalism. We did not use magic props, such as cards or coins. The performance consisted of two parts. First, the performer aimed to guess the color a volunteer had selected. The volunteer received a dice with colors on the dice’s sides. Hidden from Gregory, the volunteer turned the dice so that the selected color was shown on top. Due to unexpected technical problems with the dice, this part of the performance was initiated, but not completed. Afterwards, the performer invited a confederate from the audience to join him. This female confederate was asked to think about one of her deceased close family members, in order to get in touch with him or her. The performer, after “having felt” a presence, started to “guess” details about the deceased person. Gregory reported more details about this person’s life as the performance continued. These details were “almost accurate” (e.g., Gregory guessed that the family member’s name was Michel, but it was actually Michael). As the performance continued, the confederate became increasingly emotional. The performer finished the performance by telling the young woman that her father loves her, that he was very proud of her, and that he would always look after her.
Experimental manipulation and general procedure
At the end of the introductory lecture on social psychology, the experimenter (LL) invited participants to partake in the experiment. The experiment was unrelated to the introductory lecture. Those who stayed for the experiment received only general information concerning the procedure. Participants were then invited to sign a consent form. A professional camera team filmed the procedure for subsequent research and presentation purposes. We specified where students would have to sit if they wished to remain outside the reach of the camera during the experiment. After the students took their preferred seats, they were given a work booklet that contained the study material. They were invited to open the first page of the booklet where they received general study information that was concurrently given in oral form by the experimenter (LL). They were also instructed to refrain from communicating with fellow students throughout the experiment (see supplementary material for the detailed instructions). Immediately afterward, participants filled out the PB questionnaire (Tobacyk, 2004). Following this, they were asked to perform the mental dice task (MDT; Brugger et al., 1990). Once completed, we gave additional oral information and instructions about the upcoming performance (see supplementary material for details on this oral information). After the performance, the students were asked to perform the mental dice task again (Brugger et al., 1990). Subsequently, they were asked to complete the event explanation questions, the PB questionnaire (Tobacyk, 2004), and finally the open question. After completing the experiment, participants received a short debrief in writing, and a full debrief in person, one week later.
Data treatment
Of the original 418 participants, 390 participants were retained for subsequent analysis. Of those participants discarded, 11 booklets were empty, three participants did not provide signed consent, and 13 participants had missing answers. Another participant was excluded because the person knew the confederate and was familiar with the experiment.
For the R-PBS analysis, we excluded participants who had at least one missing item before, after, or at both measurements reducing the total sample size to 338 participants. For repetition avoidance, we applied the same reasoning, and excluded participants who had at least one missing value before, after, or at both measurements reducing the sample size to 332 participants (see Table 1 for descriptive statistics).
Spearman correlation coefficient comparing pre-performance measures (R-PBS total scores, R-PBS spiritualism scores, MDT repetitions with event explanation scores).

R-PBS total= Revised Paranormal Belief Scale total scores; Spiritualism= R-PBS spiritualism scores; MDT rep.= Mental Dice Task repetitions (repetition avoidance).
***p < .001; **p < .01; *p < .05.
Quantitative data
According to a previous observation (Lesaffre et al., 2018), we accounted for confusion in the explanation ratings (appreciating conjuring and psychic explanations at the same time). We grouped participants into four explanation groups, according to whether they interpreted the event either as predominantly psychic, conjuring, using both explanations (confusion), or neither (see also Lesaffre et al., 2018). We did not consider religious explanations, because they were rare. We used the following criteria:
Qualitative data
To code the responses to the open question, we coded the responses twice, once on opinion and once on feelings. For the actual coding, we had several trained raters (LL, DR, CD). A senior researcher with expertise in such coding (DSJ) supervised the coding procedure, while being naïve to our study question.
Opinion groups
A priori, we were interested in whether participants would report that they were confused and also whether their own words would match the pre-determined themes as assessed by the event explanation scores (see also Benassi et al., 1980). In addition, we considered that this open question would reveal additional themes.
We first used the responses of a randomly chosen subgroup of participants (n = 100). We identified the presence of the three main themes, namely “Conjuror,” “Psychic,” “Religious.” During this first coding round, we identified a new group of responses, that is, responses we could not interpret (e.g., unclear formulations and/or content). We labelled these responses as “rater-cannot determine.” Next, we tested the usefulness of our codes looking at the responses from a new group of 100 participants. We found no additional themes. We concluded that the saturation point had been reached and that our codes were adequate for coding the data. Pairs of raters were responsible for the final coding starting again with the complete response set. The results of the final coding showed a moderate interrater reliability, with a Kappa value of κ = .675. To account for chance ratings, we weighted raters’ decisions when calculating this Kappa value (Cohen, 1968): we weighted zero when the raters agreed, we weighted the ratings as 1 when the raters’ decisions differed slightly (doubts-only versus doubt-bias-conjuror, doubts-only versus doubt-bias-psychic, psychic versus doubt-bias-psychic, conjuror versus doubt-bias-conjuror), and weighted the ratings as 2 when the raters’ decisions differed substantially (psychic versus conjuror). Disagreements were resolved through discussion. Further information on the final coding system including major categories, subcategories, and examples are given in the supplementary material.
Affect groups
We examined the affective reactions participants spontaneously expressed and decided to identify recurrent themes using a qualitative analysis approach influenced by “open coding” in grounded theory (Glaser & Strauss, 1968) as well as “clustering” or “theme identification” as referred to in more eclectic approaches (Miles & Huberman, 1994). Toward this aim, we again selected responses from a randomly chosen subgroup of participants (n = 100).
We observed that a large number of participants expressed affective reactions varying in valence, that is, positive and negative. We also observed that participants mentioned the affectivity of the experience but did not further specify valence. Other participants reported that the experience was positive or negative, while others did not mention any feeling. Next, we tested the usefulness of our codes looking at responses from a new group of 100 additional participants. We found no additional themes. We concluded that the saturation point had been reached and that our codes were adequate for coding the data. Pairs of raters were responsible for the final coding, starting again with the complete response set of 200 participants. The results of the final coding showed an excellent interrater reliability, with a Kappa value of κ = .864. We again weighted raters’ decisions when calculating the Kappa value (Cohen, 1968), to account for chance ratings. We weighted zero when the raters agreed, we weighted 1 when the raters’ decisions differed, and weighted 2 when raters provided a positive affect and a negative affect rating. Disagreements were resolved through discussion. Further information on the final coding system and examples are given in the supplementary material.
Data analysis
We first examined the data for normality using the Shapiro Francia Normality Test (Shapiro & Francia, 1972). Most of the variables were not normally distributed (p < .05). Given our large sample size, we nevertheless performed parametric statistics (Ghasemi & Zahediasl, 2012), apart from using Spearman correlations. We also examined the data for outliers, but none were identified.
To test whether pre-existing PBs correlate with post-performance explanation scores, we performed Spearman correlations between R-PBS scores (total, spiritualism) and the three explanation scores. To test whether explicit (R-PBS) or implicit (repetition avoidance) belief-related measures changed with the performance, we ran paired samples t-tests comparing repetitions in the mental dice task, R-PBS total scores, and R-PBS spiritualism scores before and after the performance.
To test the way participants might confuse various levels of explanations (Lesaffre et al., 2018), we also examined how participants responded to the different event explanation scores. We were particularly interested in the proportion of participants having a clearly psychic, conjuring, or confused explanation, or no explanation, comparing the frequencies in these groups using chi-square comparisons.
To account for the possibility that psychic explanations could be explained by participants’ confused and affective reactions after the performance, we compared explanation scores between (1) opinion groups (conjuror, psychic, doubt-bias-psychic, doubt-bias-conjuror, doubts-only), and (2) affect groups (positive, negative, unspecified, mixed, none). For each type of group, we conducted separate multivariate analysis of variance (MANOVA) on the three explanation scores. We used Pillai’s trace test statistic, because of its robustness to model violations (Olson, 1976). Post-hoc pairwise comparisons were conducted using Tukey tests. Alpha levels were set at .05 for all statistical tests.
Results
Effect of pre-performance measures (R-PBS total, R-PBS spiritualism, repetition avoidance) on explanation scores (post-performance)
The correlations between pre-performance measures and explanation scores showed the expected relationships such that belief scores (R-PBS total, R-PBS spiritualism) positively correlated with psychic explanation scores and negatively correlated with conjuring explanation scores (Table 1). R-PBS total scores also correlated positively with religious explanation scores. Repetitions before the performance correlated positively with conjuring explanation scores (Table 1). Additionally, psychic explanation scores correlated negatively with conjuring explanation scores, and correlated positively with religious explanation scores (Table 1).
Comparing belief scores and repetition avoidance before and after the performance
Paired sample t-tests showed no differences in R-PBS total score before and after the performance. However, there were significantly higher R-PBS spiritualism scores and significantly more repetitions after as compared to before the performance (Table 2).
Descriptive statistics and results from paired sample t-tests comparing measures before and after the performance.
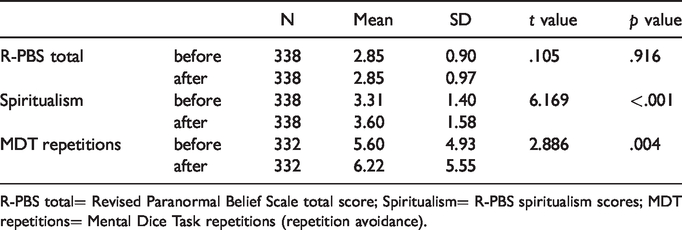
R-PBS total= Revised Paranormal Belief Scale total score; Spiritualism= R-PBS spiritualism scores; MDT repetitions= Mental Dice Task repetitions (repetition avoidance).
Event explanation scores and groups
Table 3 presents the event explanation scores (means and standard deviations), as well as how often the various explanation scores (range 1 to 7) were used (Table 3). In descriptive terms, the bold numbers show that a score of 7 was most frequently given for psychic explanations, while a score of 1 was most frequently given for conjuring and religious explanations, with another peak at the score of 4 (in italic, Table 3).
Descriptive statistics and distribution of answers for explanation scores (psychic, conjuror, religious).

Scores from 1 to 7 refer to the prevalence of each Likert scale score for each explanation question.
The counts per scale score (1–7) are also shown. Bold numbers depict the lowest and highest possible scores of 1 and 7. The italicized numbers depict the mid-score of 4.
The distributions of participants belonging to the psychic, conjuring, confusion, or neither explanation groups (Figure 1) were not evenly distributed,

Proportions (%) of participants allocated to the different explanation groups according to their answers on both the psychic and conjuring explanation questions.
Groups resulting from the qualitative data
Explanation scores between opinion groups
We coded the following responses from 385 participants: 167 expressed doubts, 120 talked clearly about a psychic event, and 60 about a conjuror event (see Figure 2). Responses from about 10% of the sample could not be interpreted (38 out of 347 responses, Figure 2). Moreover, of the participants who expressed doubts, about half had a preferred explanation (psychic: n = 45; conjuror: n = 30).

Mean explanation scores as a function of opinion groups and as a function of psychic explanation scores (a), conjuring explanation scores (b), and religious explanation scores (c). Columns depict the opinion groups Psychic, Doubt-bias-psychic (Doubt-P), Conjuror, Doubt-bias-conjuror (Doubt-C), Doubt-only (Doubt-O), Rater-Cannot-Determine (RCD). Vertical bars denote ± one standard error of the means.
The MANOVA tested how our pre-determined explanation scores varied according to what people freely reported (opinion groups). The major comparison was significant, Pillai’s trace, V= .61, F(5, 379) = 19.50 p < .001. Subsequent separate univariate analyses of variance on explanation scores were all significant; psychic explanation scores, F(5, 379) = 99.6, p < .001, conjuring explanation scores, F(5, 379) = 7.46, p < .001, and religious explanation scores, F(5, 379) = 6.51, p < .001 (see also Figure 2).
For psychic explanations scores (Figure 2(a)), pairwise Tukey comparisons showed that scores were lowest in the conjuror explanation group as compared to all other groups (all p-values <.001). The next lowest scores were found for the doubt-bias-conjuror explanation group, which were significantly different from all other groups (all p-values < .001). Highest scores were found in the psychic group, which scored significantly higher than all other groups (all p-values < .001). The second highest scores were in the doubt-bias-psychic group, which scored significantly higher than the other groups (biggest p value = .02), with the exception of the rater-cannot-determine group (p = .37). Lastly, the rater-cannot-determine group and the doubt-only group were not significantly different from each other (p = .97), but were significantly different from the other groups (highest p-value = .02).
For conjuring explanation scores (Figure 2(b)), pairwise Tukey comparisons showed little differences between groups (all non-significant p-values > .05). Mean scores were all below 4.0. We found lower scores in the psychic group as compared to the doubt-only (p < .001), conjuror (p < .001), doubt-bias-conjuror (p = .008), and rater-cannot-determine (p = .004) groups.
For religious explanation scores (Figure 2(c)), pairwise Tukey comparisons did not show many differences between groups (all non-significant p-values > .05). Mean scores were all below 4.0. We found lower scores in the conjuror group as compared to the doubt-only (p = .002), psychic (p < .001), and doubt-bias-psychic (p = .011) groups. Also, higher scores were found in the psychic, as compared to the doubt-bias-conjuror group (p = .031).
Explanation scores between affect groups
From 387 participants who completed the open question, we had responses that we could code as follows: 225 expressed affective reactions, while 162 did not report their feelings. Eighty participants expressed affective reactions that conveyed a clearly valanced experience (positive or negative), 24 reactions were unspecified, and 121 reactions conveyed mixed experiences (see Figure 3).
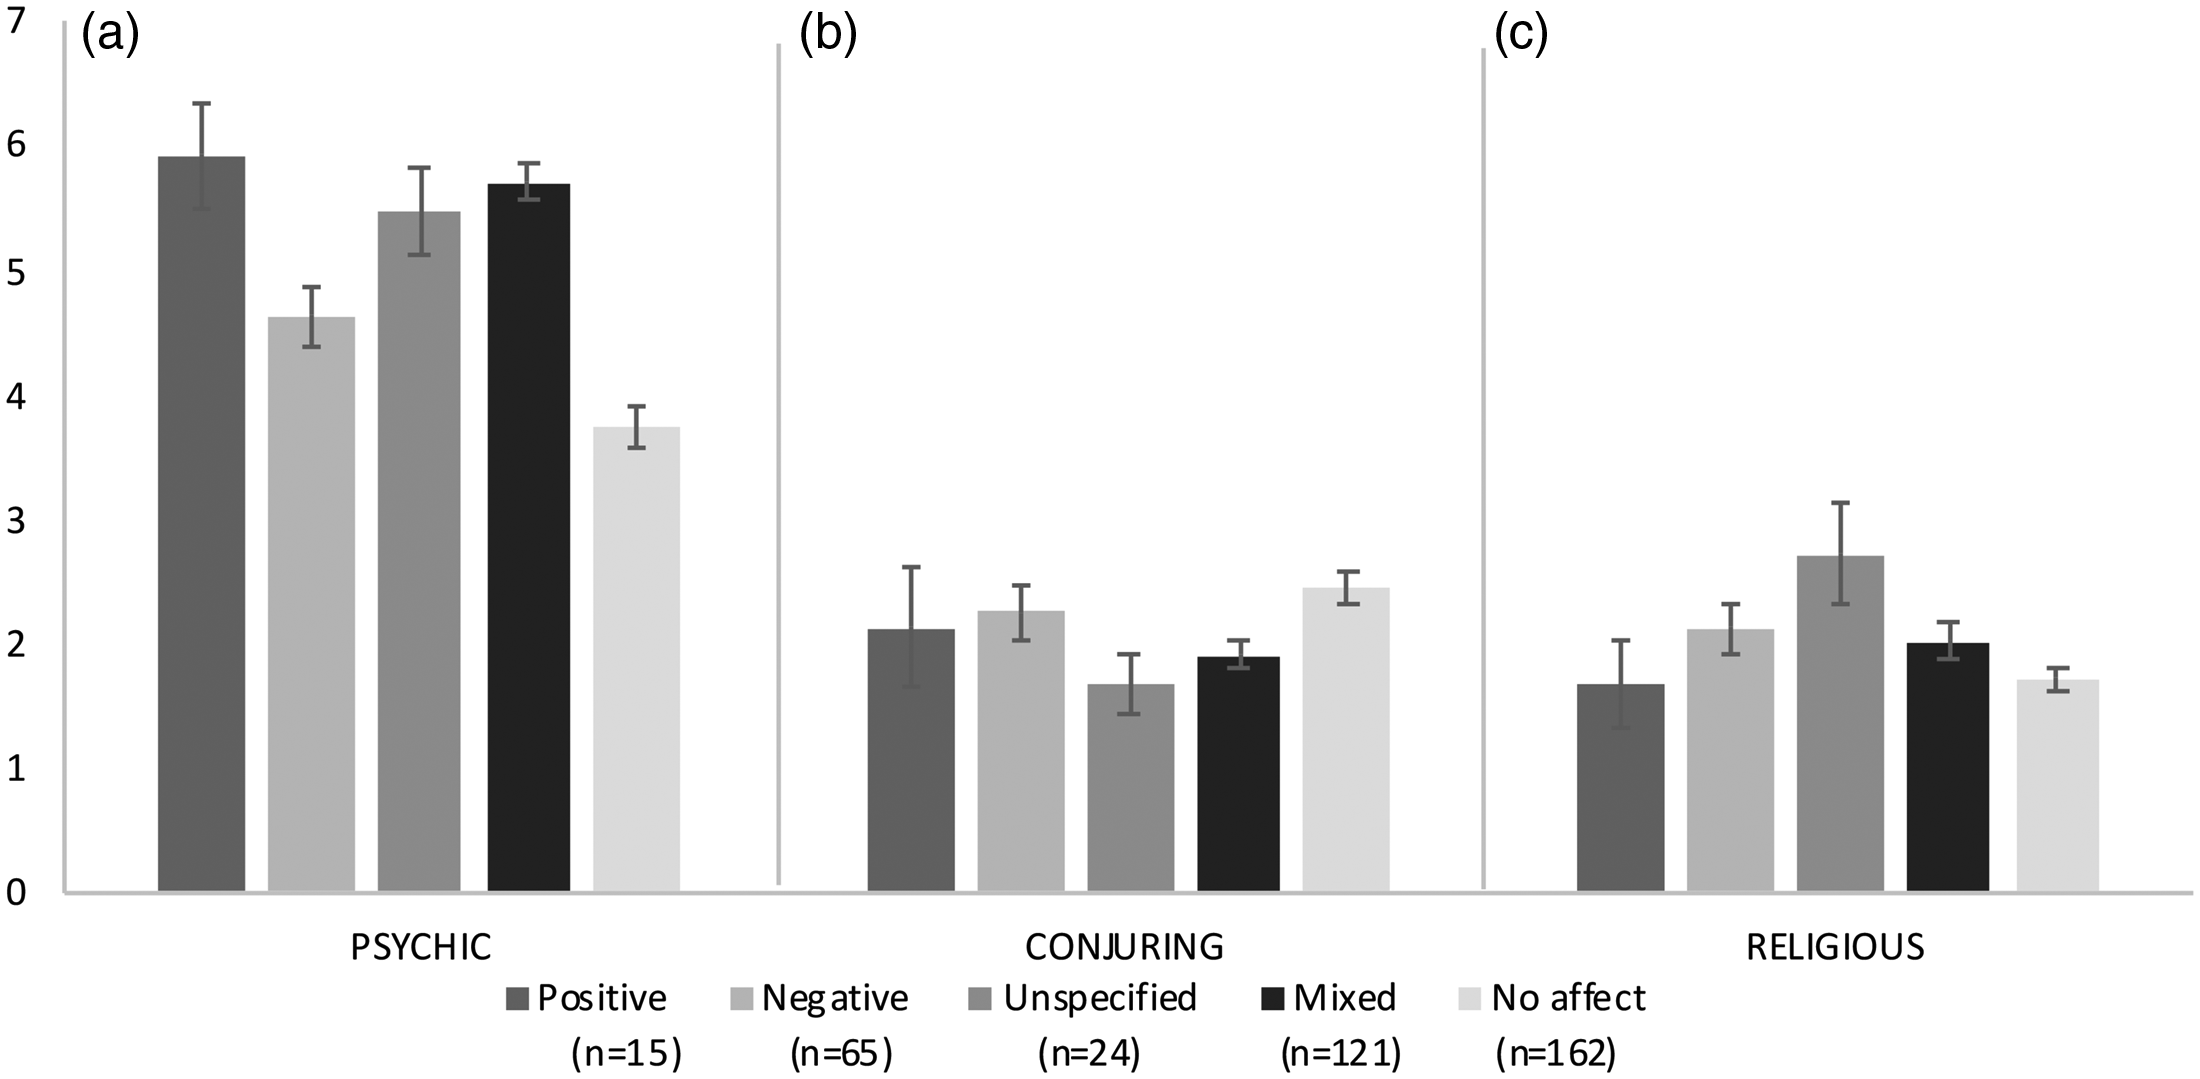
Mean explanation scores as a function of affect groups and as a function of psychic explanation scores (a), conjuring explanation scores (b), and religious explanation scores (c). Vertical bars denote ± one standard error of the means.
This MANOVA tested whether pre-determined explanation scores differed between affect groups. The major comparison was significant, Pillai’s trace, V= .21, F(4, 382) = 7.14, p < .001. Subsequent, separate univariate analyses of variance on explanation scores were significant: psychic explanation scores, F(4, 382) = 20.6, p < .001, conjuring explanation scores, F(4, 382) = 2.58, p = .037, and religious explanation scores, F(4, 382) = 2.95, p = .020.
For psychic explanation scores (Figure 3(a)), Tukey tests showed that the no affect group yielded the lowest scores when compared to all other groups (all p-values < .02) (Figure 3). Moreover, scores were lower in the negative affect group when compared to the mixed affect group (p = .003) (Figure 3). For conjuring explanation scores (Figure 3(b)), Tukey tests showed comparable scores between groups (all p-values > .05) apart from a lower score in the mixed affect group as compared to the no affect group (p =.049). For religious explanation scores (Figure 3(c)), Tukey tests showed comparable scores between groups (all p-values > .05) apart from a lower score in the no affect group as compared to the unspecified affect group (p = .022).
Discussion
Paranormal Beliefs (PBs) are frequent in the adult population, and numerous psychological variables that are associated with PBs have been reported (see e.g. French & Stone, 2013; Irwin, 2009; Vyse, 2013 for reviews). However, little is known about the causal mechanisms behind these variables, including their formation and persistence. In our study, participants were exposed to a supposedly paranormal event, and we assessed key measures before and after the event. Moreover, we examined the extent to which these baseline measures predicted what people think and feel about the event. Our performance consisted of a medium making contact with a confederate’s deceased kin, and we observed that many participants were confused about the true nature of the performance and reported strong affective reactions (Lesaffre et al., 2018).
We aimed to better understand the nature of both this confusion and emotional affect, and whether they predicted paranormal explanations. We directly asked about participants’ opinions and feelings about the staged medium demonstration. About 65% of our sample gave psychic explanations (see also Benassi et al., 1980). A more detailed analysis revealed that lower paranormal explanation scores were found in participants who (1) assumed, not surprisingly, that the performer was a conjuror, or doubted that the performer could have been a conjuror, and (2) did not report on affective feelings when answering to the open question.
Before discussing our major results on confusion and affect, we wish to highlight that we replicated previous findings on independent samples of United Kingdom students (Lesaffre et al., 2018; Mohr et al., 2014). We also found that higher R-PBS total scores correlated positively with psychic and religious explanation scores and negatively with conjuring explanation scores (Lesaffre et al., 2018; Mohr et al., 2014). We then replicated that psychic scores negatively correlated with conjuring explanation scores, and psychic explanation scores correlated positively with religious explanation scores (Lesaffre et al., 2018; Mohr et al., 2014). Finally, we replicated that R-PBS total scores did not change from before to after the performance (Lesaffre et al., 2018; Mohr et al., 2014). On this background, it is interesting to note that R-PBS spiritualism scores were significantly higher after as compared to before the performance. This increase supports the importance of actual experiences in forming related paranormal beliefs (French & Wilson, 2007; Glicksohn, 1990; Irwin et al., 2013; Lan et al., 2018).
We tested whether participants’ confusion and feelings might explain whether, and to what extent, participants endorse psychic explanations. When looking at the explanation groups, the largest group (about 65% of participants) considered that they saw a genuine psychic event. Only about a tenth of our participants indicated that they had witnessed a conjuring event. In the current study, a small proportion of participants (2%) endorsed both psychic and conjuring explanations, while about a quarter endorsed neither of these explanations. The latter group might have been uncertain what to think about this experience. The coding of the open question showed that about half of all participants expressed doubts, with about a quarter favoring the notion that they saw a psychic, and another quarter that they saw a conjuror. About a third assumed having seen a psychic and about 15 percent having seen a conjuror. The coding of the affective reactions showed that about two thirds of the participants reported on their affective feelings. The remainder did not mention affective feelings. Also, about one third of all participants reported mixed affective feelings (positive and negative), while only a third expressed clearly negative or positive feelings. Overall, coding of the responses to the open question indicated that doubt and mixed feelings were widely shared reactions.
When testing whether psychic explanations differed between opinion and affect groups, it is worth highlighting that psychic explanations were overall much higher than conjuring and religious explanations. Only psychic explanations ranged beyond the mid-point on the 7-point Likert scale (see also Lesaffre et al., 2018). When now accounting for opinion and affect groups, psychic explanations were high in all opinion and affect groups, apart from relatively lower psychic explanation scores in the conjuror group, doubt-bias-conjuror group, and no affect group. In numbers, these groups represent a relatively small part of the sample. Most participants belonged to the psychic, doubts-only, doubt-bias-psychic, rater cannot decide, positive affect, negative affect, unspecified affect, and mixed affect groups. It seems that participants who have alternative explanations (conjuror, doubt-bias-conjuror) about what they have just seen (a performer talking to a deceased person) are also those who are less inclined to favor the obvious interpretation, that is, having seen a genuine psychic event. It also seems that less obvious explanations are more readily available to participants whose affective reactions are not the prevalent preoccupation when answering the brief question "Please indicate your feelings and opinions regarding the performance you have just seen.”
Strong links between affective reporting and psychic explanations may be explained by previous studies that examined affectivity and PBs. Frijda et al. (2000) stressed that “[emotions] are at the heart of what beliefs are about” (pp. 3). We showed that feelings were expressed in many ways (positive, negative, unspecified, mixed). However, the situation and context of our experiment might have been experienced very differently among participants. Participants sat in a large classroom, peers sitting close, some might have focused on the slightly clumsy performer, others on the emotional confederate. Still others might have focused on their own fears and hopes. Previous studies have shown some people find PBs reassuring, since they can provide explanations for the unknown (Heine et al., 2006; Wyer & Albarracín, 2005). Indeed, PBs may provide a sense of control, even if illusory (Boden & Gross, 2013). In difficult situations, PBs enhance or preserve positive emotions, while diminishing negative ones (Boden & Gross, 2013). Some people also find PBs and spirituality useful when having to manage stressful life events (Keinan, 2002; Mascaro & Rosen, 2006; Tuck et al., 2006). It is therefore possible that the affective arousal, rather than the positive or negative valence of the situation (Lazarus, 1991; Tversky & Kahneman, 1982) facilitates psychic explanations.
Our final observations concern the results of the mental dice task. First, more repetitions were associated with more conjuring explanations. Second, repetition avoidance was lower after as compared to before the performance. The first finding complements previous findings in that less repetitions were associated with higher PBs (Brugger et al., 1990; Lesaffre et al., 2018). The second finding is counter to our prediction (increase in repetition avoidance) (Bressan, 2002; Brugger et al., 1990), and different from previous, closely related studies that report no change in repetition avoidance from before to after the performance (Lesaffre et al., 2018; Mohr et al., 2014). It is possible that our reduction in repetition avoidance resulted from high levels of arousal. A large proportion of our participants reported high levels of arousal, which may have interfered with performing the mental dice task. As indicated by our qualitative coding, many participants reported on their emotions and doubts, which is likely to have drawn attention and engagement away from the mental dice task. Brugger et al. (1996) investigated random number generation in Alzheimer patients, and they posited that higher levels of repetitions in these patients may have resulted from impaired frontal executive functions, in particular attentional functions. As a result, a lack of task focus may result in more repetitions. However, we do not wish to make a strong case for the finding on the mental dice task and our current explanation. We report the mental dice task results for scientific transparency, and our preliminary interpretation of the data should be taken with caution. We have used the mental dice task in many published (e.g., Lesaffre et al., 2018; Mohr et al., 2014) and unpublished studies, and found rather inconsistent findings, which has made us rather uncertain about its reliability.
Limitations and future challenges
We examined belief and experience items using paranormal belief questionnaires, desirability effects, and the affectivity of the event. One limitation relates to our sample, which consisted of an intact group; thus this group of participants (i.e., a class) was established prior to the research. Therefore, the results might not be generalized to the wider public. Secondly, the questionnaire (R-PBS, Tobacyk, 2004) focused on beliefs rather than experiences. The participants experienced a supposedly paranormal event right in front of their eyes, and we might have obtained different results had we included belief questions that focus on people’s past paranormal experience, such as done for a recently published self-report questionnaire (Prike et al., 2017). Experiences might be relevant in other ways too. Total R-PBS scores did not increase after the performance, while R-PBS spiritualism scores did. When looking at item formulations, the wording for the R-PBS spiritualism scores were more related to participants’ experience than the questions in the other subscales. Our questionnaire findings could also reflect a desirability effect: participants might have answered in conformance with the experimenter’s expectancy. Yet, to fully explain the results, participants would have needed to (1) know which items belonged to which subscale, and (2) remember how they had answered during their baseline questionnaire in order to increase their R-PBS spiritualism score. We doubt that participants applied such a strategy. To further support our view, while not quantified, the classroom was fully engaged in the performance. Many students stormed forward at the end of the experiment because they wanted to talk to the performer. They asked him about his skills, and whether he would be willing to use his skills for their purposes too.
This brings us to the final point – the affectivity of the event. The qualitative analysis showed many affective reactions. Many participants reported feeling empathetic with our confederate (Emmanuelle) or our psychic (Gregory). They also reported being shocked by what they had experienced. Content coding revealed that participants reported on valanced reactions (negative or positive), mixed reactions (positive and negative), unspecified reactions (intense but ambiguous valence), or did not mention their affective reactions at all. The latter category was relatively frequent. However, not reporting on affective reactions does not imply that no affective reactions had occurred. Interesting in this regard, the no affect group scored closest to the negative affect group when looking at the event explanation scores. Perhaps, the no affect group had experienced negative affect, but refrained from reporting on these reactions. Such a possibility could be tested by formulating a priori questions, and by adding objective measures sensitive to variation in affect. For instance, one could assess psychophysiological measures such as heart rate. In case such measures are used, their variation could be matched to variation in psychic explanations due to intense emotional arousal. As already noted above, the arousing character of the situation (Lazarus, 1991; Tversky & Kahneman, 1982) might facilitate psychic explanations. If this suggestion is true, future studies could compare the current type of performance with a recently used performance of pseudo-psychological nature (Lan et al., 2018).
Supplemental Material
sj-pdf-1-prx-10.1177_0033294120961068 - Supplemental material for Talking to the Dead in the Classroom: How a Supposedly Psychic Event Impacts Beliefs and Feelings
Supplemental material, sj-pdf-1-prx-10.1177_0033294120961068 for Talking to the Dead in the Classroom: How a Supposedly Psychic Event Impacts Beliefs and Feelings by Lise Lesaffre, Gustav Kuhn, Daniela S. Jopp, Gregory Mantzouranis, Cécile Ndéyane Diouf, Déborah Rochat and Christine Mohr in Psychological Reports
Footnotes
Acknowledgements
We thank Dr. Benoit Dompnier for letting us run this experiment after his course at the University of Lausanne. We also thank the students who participated to this experiment for being open minded and very curious toward the experiment. We warmly thank Dr. Magali Jenny for her advices regarding qualitative data treatment. We are grateful to Maïté Andres for her help with data coding. A special thank goes to Emmanuelle Salina (our confederate) for her acting talent. Finally, we would like to thank the members of the Cognitive and Affective Regulation LAboratory (CARLA, Unil) who provided useful feedback on an earlier draft of this manuscript.
Author Contributions
L. L. oversaw the data collection at the University of Lausanne with the participation of G. M. The experiment was designed by L. L., G. K., C. M. (based on Benassi et al., 1980). G. M., L. L., and C. M. conducted the statistical analysis and interpretation of the results. D. J. led the qualitative data treatment, analysis and interpretation with L. L. and C. N. D. L. L. and C. M. were in charge of the full article writing which included literature review, data treatment and interpretation. All authors contributed to the critical and regular review of the present work. Moreover, all authors approved the submission of the current version.
Notes
References
Supplementary Material
Please find the following supplemental material available below.
For Open Access articles published under a Creative Commons License, all supplemental material carries the same license as the article it is associated with.
For non-Open Access articles published, all supplemental material carries a non-exclusive license, and permission requests for re-use of supplemental material or any part of supplemental material shall be sent directly to the copyright owner as specified in the copyright notice associated with the article.