



Abstract
Research on cognitive ability is done in different paradigms. In the Piagetian paradigm, cognitive ability focuses on cognitive development along qualitative stages. Interactive real scenarios, “Piagetian tasks”, are constructed for measurement. According to age, tasks differing in complexity are applied in individual measurements. In the psychometric paradigm, the investigation of cognitive ability focuses on individual differences. Intelligence is seen as a quantitative construct with gradual differences between persons and ages. Paper-and-pencil tests with items differing in difficulty are used for IQ measurement of single persons or school classes. However, do those tasks measure two distinct cognitive abilities? Solving tasks in both approaches requires basic (speed, working memory) and complex cognitive abilities (reasoning, understanding). Regarding empirical relationships, we used three Austrian samples (in kindergarten four to six years old N = 40, in primary school six to eight years old N = 40, and nine to ten years old N = 41). They were tested with psychometric tests (Raven CPM or SPM) and Piagetian tasks. In addition, mental speed (ZVT) was measured in the two school samples. The average observed correlation between IQ and Piagetian tasks was r = .51. In factor analyses, the tests loaded on a common factor of general intelligence. Further analyses revealed that mental speed is correlated more strongly with psychometric (r = .50) than with Piagetian tasks (r = .39), while Piagetian tasks are more related to parental education indicators (speed: r = .11, Raven: r = .20, Piaget: r = .25).
Research highlights
Developmental and psychometric intelligence approaches are compared.
The average correlation between IQ and Piagetian tasks is r = .51.
Both kinds of tasks load on a common general factor of intelligence.
Mental speed is more correlated with SPM (r = .50) than with Piagetian tasks (r = .39).
Piagetian tasks are more closely related to parental education (r = .25).
Introduction
Different paradigms within cognitive ability research
Within science, there are different paradigms dealing with cognitive ability. The most well-known and widespread one is the psychometric approach, in which intelligence (or IQ, cognitive ability, g) is seen as a quantitative individual trait. Intelligence is measured by paper-and-pencil tests, and results are age-normed and typically shown on an IQ scale with M = 100 and SD = 15. Statistical methods as correlations and factor analyses are applied, based on individual differences. Cognitive development is seen as being based on mental speed and working memory, in more knowledge-related dimensions also being based on learning. Important research questions deal with dimensionality, nature versus nurture (behavioral genetics), basic processes (mental speed, working memory) and validity issues (e.g., correlation with performance in school and at the job, impact of biases). This paradigm is accommodated in psychological research, especially in the research fields of personality and individual differences (e.g., Cattell,1971/1987; Hunt, 2011; Jensen, 1980). More recent applications tend to deal with historical and international differences in testing and ability (e.g. Flynn, 2012; Lynn & Becker, 2019; Rindermann, 2018).
The second, similarly old paradigm is genetic epistemology or, abbreviated, the Piagetian approach. This approach is focused on cognitive development in childhood (“genetic” as development, not as “genes”) being based on maturation and interaction with a typical childhood environment. To understand cognitive development and to measure it, children are observed in everyday life cognitive scenarios (“Piagetian tasks”). Children communicate their thinking (“epistemology”) in such measurements and give reasons for their solutions. Cognitive development goes through four stages of qualitatively different thinking, the sensorimotor stage (0 to 2 years), the preoperational stage (2 to 6 years), the concrete operational stage (7 to 11 years) and the formal operational stage (from age 11 onwards). Piaget summarized this development as an advancement from cognitive egocentrism to decentered thinking (Piaget,1947/2001). Important research questions here are about uniformity of development, developmental delays (“décalage”) and reached stages in cross-cultural comparison. This research is accommodated in psychology – specifically in developmental psychology. There is a strong impact of the Piagetian approach on philosophy and ethics (cognitive development as a basis for rationality, moral and the law; Habermas,1981/1984). In sociology, Oesterdiekhoff (2012, 2013) developed a cognitive modernization theory on the basis of the Piagetian approach. Historical and cultural differences in cognitive development are used as an explanation for historical and cultural differences in behavior, institutions and worldviews.
The psychometrical and Piagetian approach are the two “traditional” approaches to study cognitive abilities. In addition, four more approaches have to be mentioned: Quite prominent in the last decades is the student assessment approach (third). It measures “literacy”, “scholastic aptitude”, “student achievement” or “student competence”. Paper-and-pencil tests are adapted and the focus is not on individual persons but on social entities such as students at different schools or even entire nations. Some well-known studies are PISA (Programme for International Student Assessment), TIMSS (Trends in International Mathematics and Science Study) and PIRLS (Progress in International Reading Literacy Study). This paradigm is accommodated in educational science. In this approach, any reference to psychometric or Piagetian research is avoided. Researchers would even deny that “cognitive ability” is measured. However, analyses of item content and cognitive processes used for solving such tasks reveal a large similarity between psychometric tasks and tasks of student assessment (Rindermann & Baumeister, 2015).
The fourth paradigm is that of economics. No own measurement approach was developed for cognitive ability, but existing measures are taken as indicators of human capital enabling individuals and people to be productive. As in student assessment research, psychometric and Piagetian research is usually ignored (one of the few exceptions being Jones, 2016). The fifth one, the qualitative approach, is commonly used in cross-cultural research, which is best to be termed as “cognitive anthropology”. People of different cultures or of past epochs are analyzed in everyday life regarding cognitive ability, especially epistemic rationality. For example, Luria (1976/1974) and Hallpike (1980) collected descriptions of everyday life behaviors, which are indicators of cognitive ability. Finally, various developmental, educational and psychological approaches (e.g., expertise research) brought together, form the sixth approach. Compared to the psychometric one, learning is emphasized for acquiring ability. For example, chess players and their success depending on experience (deliberated practice) were investigated (Ericsson et al., 2007).
Theoretical overlaps and empirical correlations
All the above-mentioned approaches emphasize their uniqueness. However, there are many overlaps between them – especially between the first two approaches, the psychometric and Piagetian. The overlaps are less when it comes to theory. For example, the psychometric approach highlights mental speed, working memory and genetic factors as causes of individual differences (Humphreys & Parsons, 1979). By contrast, the Piagetian approach stresses self-regulated examination of the environment and internal cognitive processes of assimilation and adaptation as causes of age differences (in development). Nevertheless, the similarities among all approaches prevail when considering the applied cognitive processes to solve tasks and the associated outcomes: For instance, to solve PISA and TIMSS tasks, reasoning and problem solving are necessary, while domain-specific knowledge retrieval is less important (Rindermann & Baumeister, 2015). Correspondingly, psychometric cognitive ability tests such as the CogAT (Cognitive Abilities Test; Lohmann & Hagen, 2002), contain items requiring specific knowledge for their solution, e.g. “law → court: recipe →?” ; or “3³ + 42 = ?” .
Psychometric and Piagetian tasks share many similarities, too: To solve tasks from either paradigm, regardless of whether it is a paper-and-pencil task or a realistic scenario, it is necessary to engage in similar cognitive processes and abilities. First of all, participants need the same basic cognitive abilities: concentration, mental speed and working memory (e.g., Rindermann et al., 2011). Neo-Piagetian approaches which advanced Piaget’s theory and integrated psychometric concepts have stressed this too (Demetriou et al., 2002; Pascual-Leone, 1970). More complex cognitive processes include concept formation (e.g., sorting of living beings in flying animals versus non-flying animals in a Piaget task; “What fits to blue, red and green: ink, black, hue, brown, or rainbow?” in CogAT task), inductive and deductive reasoning (e.g., applying lever rules to mechanical tools in Piaget task; finding rules and applying them in Raven matrices; E. L. Armstrong & Woodley, 2014) and dealing with abstract information and finding in them regularities (e.g., Demetriou et al., 2002; for the Raven matrices: Carpenter et al., 1990). Additionally, the development of cognitive ability, independent from chosen theoretical background and measurement approach, depends on similar factors: On genes (e.g., Plomin, 2018), health and a healthy environment including healthcare (e.g., Hunt, 2011), family (e.g., Armor, 2003); Rindermann & Ceci, 2018) and school (e.g., Hattie, 2009). The formal operational stage cannot be achieved without formal education, usually in school (Oesterdiekhoff, 2013).
Consequently, individual differences in Piaget and psychometric tasks are correlated, so that children who are good at one task tend to be also good in the other: The average correlations between Piagetian tasks (across individual differences) and intelligence tests are reported to be r = .49 (Jensen, 1980, p. 674). This extends to correlations with student achievement as can be expected from the aforementioned arguments. According to Jensen (1980, p. 674), the average correlation of Piagetian tasks to scholastic achievement is r = .55, supported by a newer overview of older studies r = .54 (Hattie, 2009, p. 43), with math even r = .73. Humphreys et al.’s study in 1985 actually reported correlations of r = .81 (between Piagetian tasks and Wechsler IQ) and r = .75 (between Piagetian tasks and academic achievement in spelling, arithmetic, and reading). Finally, there is not only a similarity in individual differences, but also in age differences (Carroll et al., 1984). Regarding an absolute comparison, older children achieve better results than younger children in both Piagetian and psychometric tasks.
According to Cattell’s (1971/1987) investment theory, intelligence development proceeds in a cascade, from more physiological-neurological fluid intelligence to more knowledge-related culture and environment dependent crystallized intelligence. Fluid intelligence invested in learning leads, across time, to higher crystallized intelligence. Gains in fluid intelligence depend more on basic cognitive processes as mental speed (Jensen, 2006; for the Raven: Goldhammer et al., 2015) and working memory capacity (Kyllonen & Christal, 1990). The more crystallized an ability, the stronger should be the impact of a non-biological environment, i.e. of family and education (Rindermann, 2011) . Piagetian tasks are – compared to measures of fluid intelligence as the Raven or CFT – more complex, more knowledge-related and more verbal (instruction as well as argumentative justification of proposed solutions). Following this theory, increases in mental speed should lead to increases in fluid intelligence and subsequently, increases in fluid intelligence to increases in more knowledge-related abilities, of which Piagetian tasks are one example. On the other hand, from the point of view of the Piagetian cognitive development model, solving cognitive tasks (be they fluid Raven or complex problem solving tasks including Piagetian ones) depends on cognitive maturation and cognitive interaction processes. However it may be, there is not only a similarity in cognitive demands but also a developmental dependency.
Research questions
As can be seen with this wide range of empirical findings, especially the psychometric and the Piagetian approaches show obvious commonalities. However, the mentioned studies are all old and they did not study the theoretically assumed dependability on common or specific mental processes (e.g., mental speed; Jensen, 2006; efficiency and working memory; Demetriou et al., 2002) and family background (e.g. education as measured by parental education or number of books; Rindermann & Carl, 2017; Rindermann et al., 2013). That is the reason behind and the goal of the current study. For this purpose, we collected data in three samples, in one kindergarten and two primary schools. Based on theoretical considerations and past results of empirical research, we assumed that Raven and Piagetian tasks are correlated; that speed correlates more with fluid intelligence than with crystallized Piagetian tasks; and that the impact of educational-cultural environment is weaker for mental speed and fluid intelligence than for more crystallized Piagetian tasks. The samples and results for each study to prove stability across different developmental stages are presented first, followed by the summary analyses including a test of environmental dependency.
First study: Children at kindergarten
Method
In the first study (youngest children), N = 40 (18 girls, 22 boys) children in Austrian kindergartens at the age of four to six (M = 5.22, SD = 0.67) were tested. As cognitive tests, the figural-fluid Coloured Progressive Matrices (CPM; Raven, 1976) and Piagetian tasks were applied. The psychometric CPM (similar to the other Raven tests) measures inductive and deductive reasoning standing for fluid (knowledge-distant) intelligence. Adapted to age, four different Piagetian tasks were used (developed along the lines of Krampen, 2002): Understanding numbers (number of elements in a line vs. length of the line), spatial ordering of objects (copying figures and their position), class inclusion (e.g., “more animals or more birds”, comparing the size of two related groups of elements), and understanding of geometrical objects (copying a cross). If the participant could solve the task by assimilation using existing cognitive schemes, the task was rated with two points. If the participant solved the problem by creating a new scheme (“accommodation”) with external help, the answer was rated with one point. And if the participant could not solve the task (correctly), a rating with zero points resulted (see Krampen, 2002). Since both the answer and explanation were coded, verbal ability was indirectly measured too. The reliability (indicated by scale homogeneity resp. internal consistency) of the CPM-scale was Cronbach α = .79 and the reliability of the Piaget-scale was α = .40. The CPM and Piaget test results were age-normed. For analyzing the factorial structure and to achieve similarity in item quantity, the CPM items were grouped into four item parcels based on comparable item difficulties (ranging for the four parcels from .45 to .49). The rather small sample size was a further reason to use parcels (better ratio of number of items to number of observations). Therefore, we have for both tests four parcels, four CPM “items” and four Piaget items.
Parents were asked in a questionnaire about their own formal educational level (highest achieved degree in school, 5 steps from secondary school to university and highest degree in professional training, 6 steps from apprenticeship to academic degree; sum for both parents has a reliability of α = .69, N = 39) and the number of books they have at home (N = 39). The study was done in 2010 (Innerhofer et al., 2010).
Results
The age-normed CPM and Piaget results (total scores) were correlated at r = .43 (.425, N = 39; p < .01). Without age-standardization (no application of age norms), the correlation was nearly identical (r = .43, .430). When applying a correction for attenuation (for unreliability), the maximum possible (conventionally “true”) correlation was estimated with

The correlations at the level of items (respectively parcels) ranged from r = −.28 (Piaget 1 numbers with Piaget 3 classes) to r = .51 (CPM 1 with CPM 4). There were higher correlations between CPM and Piagetian tasks (r = .30 CPM 1 with Piaget 3 classes) than within Piaget (Piaget 3 correlations within Piaget varied between r = −.03 and −.28). Correlations as well as many other statistical coefficients are normally distributed. This includes negative outliers as given here for Piaget task 3.
This pattern becomes clearer when using factor analysis: First, a simple g factor analysis was applied. The first unrotated factor explained 32.18% of the variance (not age-normed 34.53%). As indicated by some negative correlations, the g factor was not very strong.
Finally, an exploratory factor analysis was conducted assuming two factors, one standing for psychometric intelligence (Raven), the other for Piagetian cognitive development (Piagetian tasks). There were “wrong”, unexpected cross loadings: The third CPM item parcel loaded on the second “Piaget” factor with λ = .73 and the second Piaget item classes loaded on the first “CPM” factor with λ = .70 (for further information see online Appendix, Table A1).
Regarding correlations with parental indicators of education, the pattern was unsystematic: Piagetian tasks were better correlated with formal education than psychometric tasks to education. For number of books it was the opposite (formal education: rCPM = .03 with 95% CI [−.29, +.35], rPia = .22 with 95% CI [−.11, +.50]; books: rCPM = .16 with 95% CI [−.17, +.46], rPia = −.04 with 95% CI [−.35, +.28]; N = 38 to 39). The 95% confidence intervals of both pairs of correlations are largely overlapping (>50%) and therefore the correlations do not differ statistically meaningful (for calculation details see Eid et al., 2011; S. 545f). The correlation between parental education and number of books was r = .22.
Discussion (short)
Individual differences in cognitive ability are consistent across different measurement approaches. The psychometric and the Piagetian tasks are not categorically different. There is no systematic difference regarding correlations with parental education.
Second study: Children at primary school at grades 1 and 2
Method
The second study was conducted at two Austrian primary schools, N = 40 children were tested (18 girls and 22 boys). The pupils were between six and eight years old (M = 7.00, SD = 0.68). In this sample with older children, the more difficult Standard Progressive Matrices (SPM; Raven et al., 1998) were used. The reliability of the sum value of five SPM sets was α = .80. Additionally, eight Piagetian tasks were applied: two tasks referred to the invariance of magnitudes (comparing a fixed amount of liquid in different vessels and a fixed amount of Plasticine in different shapes). Two tasks contained hierarchical ordering of pictures into different classes (e.g., ordering animals into groups of insects, birds, mammals, and fishes) and two other tasks tested the understanding of time (differentiating between speed vs. travel time of a car and height vs. age of a person). Another task measured the understanding of numbers (number of “millstones” in different groups with different distances). The last Piaget task contained abstract sequences (judging the height of two fictional persons by comparing them to a third person). The reliability of the Piaget-scale was α = .79.
Finally, a mental speed test was applied: The ZVT (Zahlenverbindungstest; Oswald,1987/2016) is a paper-and-pencil number trail test with four subtests. The reliability of the sum value was α = .96 in this sample. For comparability reasons (comparison with ZVT and across studies) and to reduce differences in item difficulty, the SPM and Piagetian tasks were each grouped to four parcels. In SPM, the first and the last sets, as the easiest and the most difficult set respectively, were combined. In Piagetian tasks, the tasks were combined according to their content: Two invariance items, two class items, two time items, one number and one order item. The items were grouped to four parcels and z-standardized. All test results were age-normed.
As in the first study, parents were asked about their highest level of formal education and the number of books at home (Greilberger et al., 2010).
Results
The correlation between the age-normed SPM and Piaget results as total scores was r = .54 (N = 39; p < .01). Without age-standardization, the correlation was higher (r = .60). After applying a correction for attenuation, the estimation of the maximum possible correlation (age-normed) became ρ = .68.
The correlations at the level of items (respectively parcels) ranged between r = −.10 (Piaget time 2 with SPM 5) to r = .69 (SPM 1 with SPM 2). For comparability reasons and to reduce difficulty differences, the SPM and Piagetian tasks were each grouped to four parcels.
Next, a simple g factor analysis was applied. The first unrotated factor explained 43.32% of the variance (not age-normed 46.15%). Assuming two factors, an exploratory factor analysis was conducted. There was one “wrong” loading, the last Piaget parcel loaded on the first “SPM” factor with λ = .62. The first three SPM parcels loaded with λ = .40 to .51 on the “Piaget” factor; however, their loadings on the SPM factor were higher (with λ = .55 to .63; for more detailed information see online Appendix, Table A2).
In this sample, we also measured a basic cognitive ability, mental speed. Mental speed was more highly correlated to psychometric intelligence than to Piaget cognitive development (age-normed results: rSPM = .58, rPia = .45, N = 36/37).
In a second exploratory factor analysis including four equivalent ZVT matrices as items and assuming three factors, the g factor explained 44.35% of the variance. The three measurement methods cannot be distinguished: Mental speed loaded on the first factor together with easier SPM tasks. SPM parcel 3 loaded on the Piaget factor. Factor 3 with SPM 3 and 4 and Piaget time and number-order may represent more difficult reasoning processes (see again online Appendix, Table A2).
Regarding the correlations with parental indicators of education, the pattern was systematic: The more complex and crystallized the measures are, the stronger were the correlations with parental education and number of books: with education: rZVT = .29 with 95% CI [−.04, +.57], rSPM = .35 with 95% CI [−.02, +.61], rPia = .53 with 95% CI [−.24, +.73]; with books: rZVT = .12 with 95% CI [−.22, +.43], rSPM = .17 with 95% CI [−.17, +.47], rPia = .21 with 95% CI [−.13, +.50]; N = 36 to 40). Due to small sample size the 95% confidence intervals of the correlation trios have a large overlap (>50%) and therefore the correlations yield no statistically meaningful difference. The correlation between parental education and number of books was r = .68.
Discussion (short)
Individual differences in cognitive ability are correlated across different measurement approaches. The psychometric and the Piagetian tasks are not categorically different. Mental speed is closer related to SPM than to Piagetian tasks. There is a systematic pattern of stronger correlations with parental education from basic to complex tests and from fluid to crystallized intelligence
Third study: Children at primary school at grade 4
Method
The sample of the third study (oldest children) consisted of N = 41 children (19 girls, 22 boys) between 9.25 and 10.83 years old (metric scale, M = 9.93 years, SD = 0.42). As in study two, the participants were tested with the SPM (here reliability for five sets α = .79), with Piagetian tasks (13 tasks α = .79) and the ZVT (mental speed, four sets α = .90). In this fourth grade sample, thirteen age-adequate Piagetian tasks were used: Four tasks measured the understanding of invariance (quantity, weight, volume), two tasks contained hierarchical ordering of pictures (classes), two tasks tested spatio-temporal understanding, three tasks contained dimensional ordering, and two additional tasks measured the comprehension of proportions and generating of abstract sequences. The last two tasks measured formal-operational thinking. (However, the probability of a correct response in this study was not lower than in that in the previous tasks.) Different from the former two studies, we decided not to age-norm the results: In this sample children’s age and test results were negatively correlated (rZVT = −.33, rSPM = −.34, rPia = −.31). Older pupils seemed to be children who were enrolled later or had repeated a class. A standardization would have increased the effects of these sample peculiarities. Similar to previous studies, SPM and Piagetian tasks were grouped into four item parcels: In the SPM, the first (the easiest) and the last (the most difficult) tasks were combined. In Piagetian, the tasks were combined according to content: The four invariance, two class, two time and space, and five order-abstract items were grouped into four parcels and z-standardized.
Identical to the first and second study, parents were asked about their highest level of formal education and the number of books at home (Schwab et al., 2010).
Results
The SPM and Piagetian tasks in general correlated at r = .54 (N = 41, p < .01). When applying a correction for attenuation, the estimated maximum possible correlation was ρ = .68.
The correlations between the parcels were all positive and ranged between r = .09 (SPM 1 with Piaget 1 invariance) and r = .78 (SPM 2 with SPM 4). Furthermore, higher correlations were observed among Piagetian tasks (the highest between Piaget 1 invariance and Piaget 4 order-abstract: r = .64). In a g factor analysis, the first unrotated factor explained 48.72% of the variance. An exploratory factor analysis led to two distinguishable method-construct factors (see online Appendix, Table A3, for more details): On the first rotated factor loaded SPM items, whereas on the second rotated factor loaded Piaget items. These results support the differentiation in psychometric and Piagetian tasks.
As in study two mental speed (ZVT) was more highly correlated with psychometric intelligence than with Piagetian cognitive development (rSPM = .42, rPia = .32, N = 41).
In a final exploratory factor analysis including four equivalent ZVT matrices as items and assuming three factors, the (first unrotated) g factor explained 40.62% of the variance. The three ability measurement methods can be distinguished, mental speed loaded on the first factor, SPM tasks on the second and Piagetian tasks on the third (online Appendix, again Table A3).
Regarding correlations with parental indicators of education, a systematic pattern similar to study 2 emerged: The more complex and crystallized the measures are, the stronger were the correlations with parental education and number of books: with education: rZVT = .14 with 95% CI [−.18, +.43], rSPM = .29 with 95% CI [−.02, +.55], rPia = .33 with 95% CI [−.02, +.58]; with books: rZVT = −.13 with 95% CI [−.42, +.19], rSPM = .17 with 95% CI [−.15, +.46], rPia = .24 with 95% CI [−.08, +.51], (N = 40/41). The 95% CI of the correlation trios overlap (>50%) – the samples were not large. The correlation between parental education and number of books was r = .41.
Discussion (short)
The three different measurement approaches and constructs, ZVT (mental speed), SPM (psychometric fluid intelligence), and Piagetian tasks (cognitive development), are empirically different. Mental speed is closer related to the SPM than to Piagetian tasks. Parental education showed increasing correlations as tests became more complex and as crystallized (and not fluid) intelligence was tested. Regarding correlations with indicators of parental education, there is a systematic pattern of stronger correlations from basic to complex tests and from fluid to crystallized intelligence.
Overall analyses (three samples combined)
Factor analysis
Finally, we analyzed all three studies together. At first, we listed and averaged the given correlations across the three studies using Fisher z-transformation (see Table 1). The correlations were not N-weighted – the sample sizes of the three single studies are very similar and there is no reason to give one study a larger weight. The average observed correlation between psychometric (figural-fluid) intelligence which was measured by Raven CPM or SPM and cognitive development level as measured by Piagetian tasks is r = .51 (Table 1). The attenuation-corrected correlation between the constructs is ρ = .71.
Correlations among cognitive ability measures and with combined indicators of education.
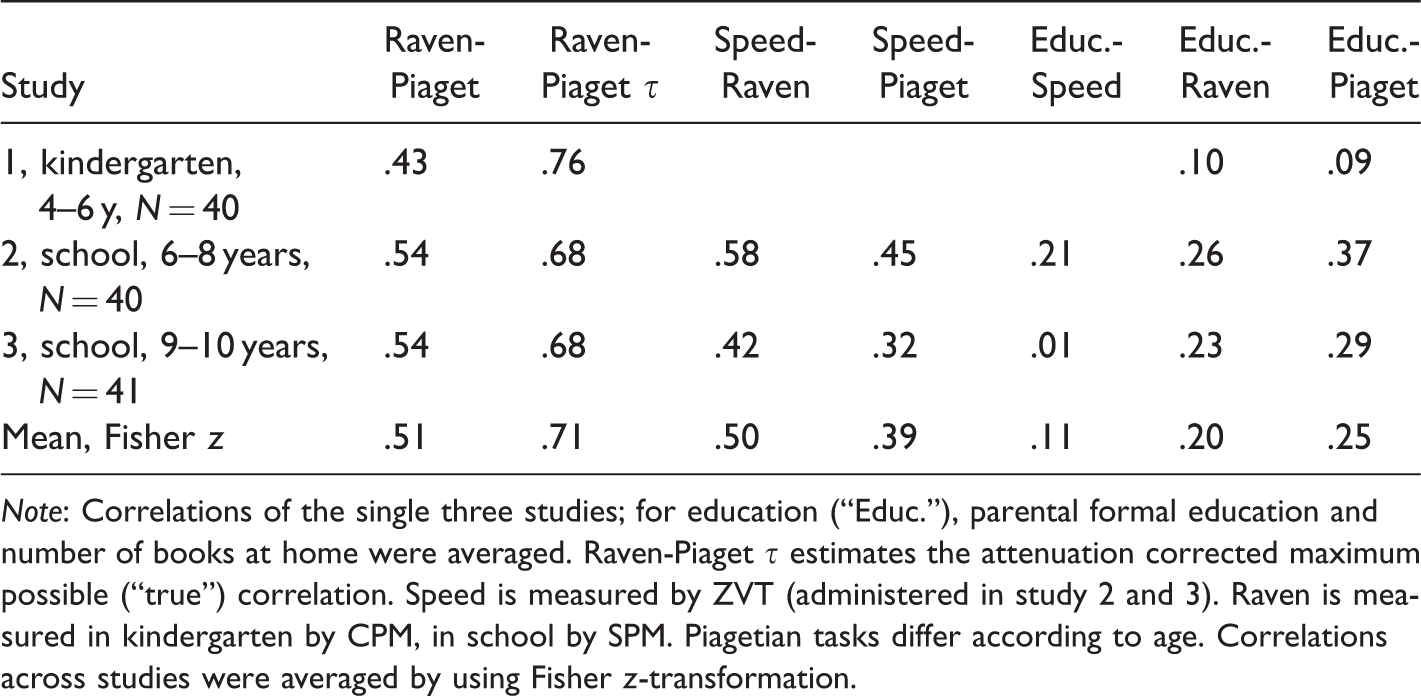
Note: Correlations of the single three studies; for education (“Educ.”), parental formal education and number of books at home were averaged. Raven-Piaget τ estimates the attenuation corrected maximum possible (“true”) correlation. Speed is measured by ZVT (administered in study 2 and 3). Raven is measured in kindergarten by CPM, in school by SPM. Piagetian tasks differ according to age. Correlations across studies were averaged by using Fisher z-transformation.
The correlations with mental speed reveal a systematic pattern: Speed and fluid intelligence – ZVT and Raven Matrices – are in both samples more highly correlated than speed and cognitive development – ZVT and Piagetian tasks –, on average rRaven = .50 and rPia = .39. Finally, the correlations with indicators of parental education (the correlations for formal education and number of books averaged) increase from speed to fluid intelligence and from fluid intelligence to cognitive development: rZVT = .11, rRaven = .20 and rPia = .25.
For analysis of the factor structure, we combined the three datasets (after z-standardization of the results in each study, M = 0, SD = 1). A hierarchical confirmatory factor analysis (first order: tests, test approaches, ability constructs; second order: g factor of cognitive ability) was conducted using Mplus 7.4, FIML (Full-Information-Maximum-Likelihood, all given observations are used) and a two-index strategy for evaluating the fit of the model (see Figure 1). The fit of the model was good with CFI = .95 and SRMR = .06. All single ZVT sheets were good indicators of the ZVT (on average λ = .80); concerning Raven matrices tasks, only the third item parcel did not show high loadings (here λ = .56, on average λ = .71) on the Raven factor. The Piaget item parcels loaded on average at λ = .53 on the third (Piaget) factor – this is considerably lower than the assigned tasks for ZVT and Raven on their factors. The best indicator for general intelligence (second-order factor) was Raven (λ = .91), followed by Piagetian tasks (λ = .76) and ZVT (λ = .64). Alternatively, if no high order factor is assumed, but correlations between the first order factors are allowed, the correlations are: ρZVT-Raven = .58, ρZVT-Pia = .49 and ρRaven-Pia = .70 (Figure 1). The fit of this model is identical to a hierarchical model; the message is the same: the three cognitive tests (constructs) are not independent. This is corroborated by a further analysis: Assuming independence, these correlations between the first order factors were not allowed. Then the fit of the model became very low, from CFI = .95 and SRMR = .06 to CFI = .84 and SRMR = .21. Empirically, the factors are correlated.
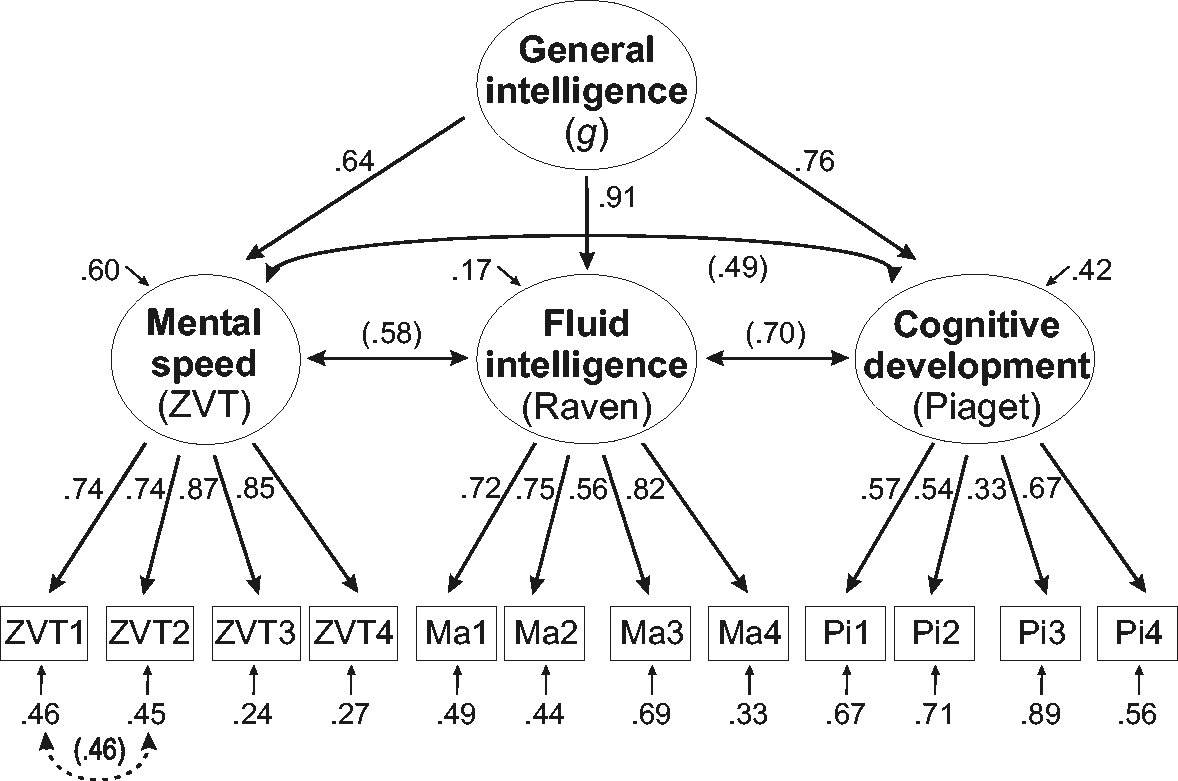
Hierarchical confirmatory factor analysis (N = 121 covering three studies, FIML, CFI =.95, SRMR =.06; correlations between latent factors are presented in parentheses).
Path model
However, mental speed does not claim to measure general intelligence but instead, a basic cognitive ability that explains cognitive development and individual differences in intelligence.
Thus, we applied a final analysis considering Cattell’s investment theory, assuming causal dependency among the three different constructs of cognitive ability and their different dependency on psychological environmental factors. We did choose parental education as the most important family predictor, which is measured by the mean of parental education and the number of books (both standardized before averaging; r = .44). The result can be found in Figure 2.
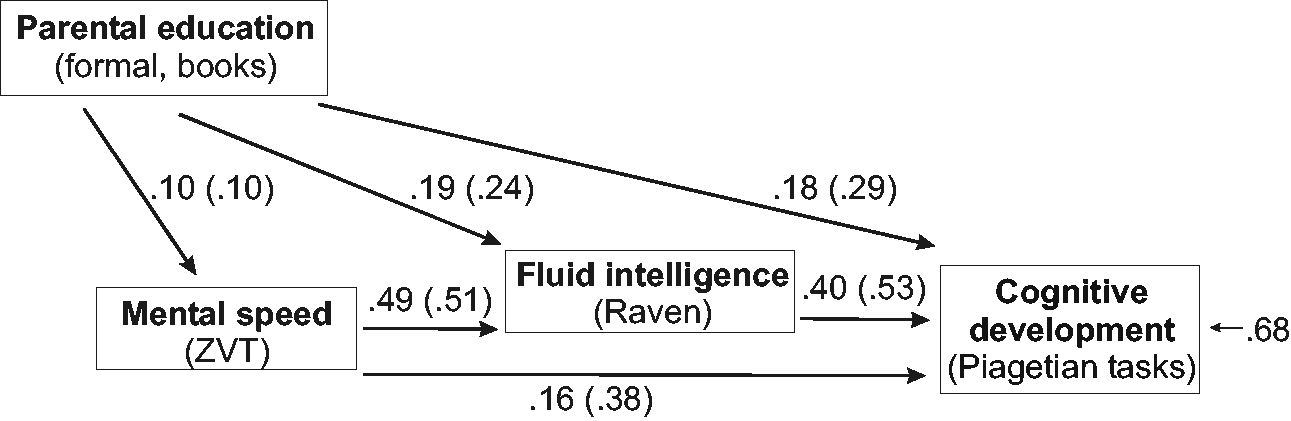
Path analysis (N = 121 covering three studies, FIML, saturated model, standardized path coefficients and in brackets correlations).
The more complex and crystallized a measure and a construct are (as we assume for Piagetian tasks), the larger is the impact of parental education in them (correlations in Figure 2: rZVT = .10, rRaven = .24, rPia = .29; direct effects: βEd→ZVT = .10, βEd→Raven = .19, βEd→Pia = .18; total effects: βEdtot→ZVT = .10, βEdtot→Raven = .19+.10x.49 = .24, βEdtot→Pia = .18+.10x.16+.10x.49x.40+.19x.40 = .29). Mental speed has an impact on fluid intelligence (βZVT→Raven = .49), and fluid intelligence itself has an impact on cognitive development (βRaven→Pia = .40). The effect of mental speed on cognitive development measured by Piagetian tasks is lower (correlations: rZVT-Raven = .51 vs. rZVT-Pia = .38, direct effects: βZVT→Raven = .49 vs. βZVT→Pia = .16, total effects: βZVTtot→Raven = .49 vs. βZVTtot→Pia = .16 + .49x.40 = .36).
Control for outliers
Excluding outliers does not substantially decrease the correlations and, even more important, does not change the pattern of correlations either: There are higher correlations between mental speed and fluid intelligence and between fluid intelligence and cognitive development than between fluid intelligence and cognitive development and there is an increasing correlation with higher complexity and knowledge-relatedness of tasks and constructs.
To check whether the correlations among our three cognitive measures are driven (or decreased) by outliers we present six scatter plots: First, between mental speed (ZVT) and fluid intelligence (SPM), between mental speed (ZVT) and cognitive development (Piagetian tasks) and between fluid intelligence (SPM) and cognitive development (Piaget). Second, between parental education and the three cognitive measures. As previously described, the results were z-standardized (same data set). In the scatter plots the data points indicate study 1 (kindergarten age), 2 (school, 6–8 years) and 3 (school, 9–10 years).
Figure 3 displays the relationship between mental speed (ZVT) and fluid intelligence (SPM). If the two lowest ZVT results from studies 2 and 3 are excluded (on the left bottom) the correlation decreases from r = .495 (N = 77) to r = .445 (N = 75), but is still substantial.

Scatter plot between mental speed (ZVT) and fluid intelligence (SPM), combined sample, N = 77, r =.495, studies (2, 3) are indicated.
Figure 4 displays the relationship between mental speed (ZVT) and cognitive development (Piagetian tasks). If the two lowest ZVT results from studies 2 and 3 are excluded (on the left bottom) the correlation decreases from r = .376 (N = 78) to r = .309 (N = 76), but is still substantial (of medium size).
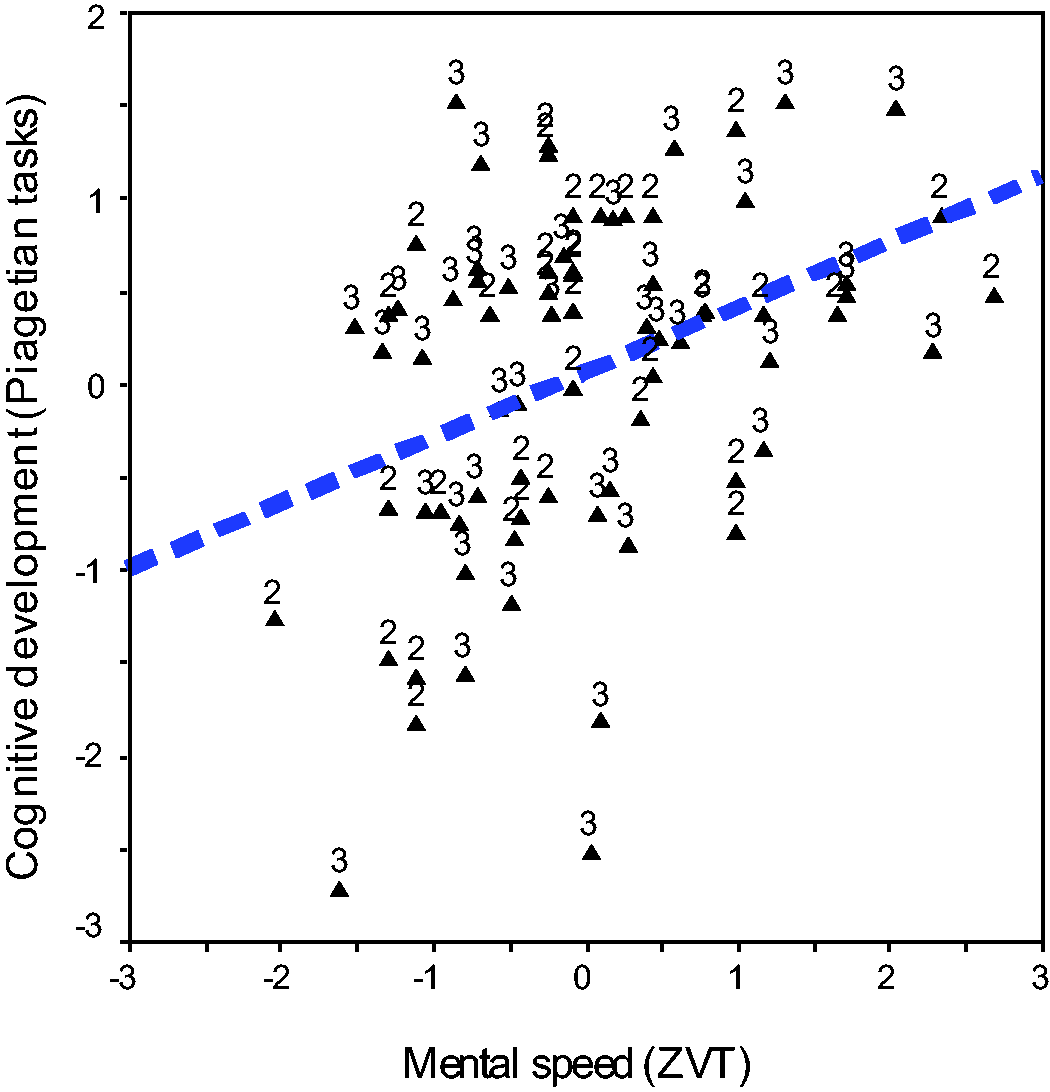
Scatter plot between mental speed (ZVT) and cognitive development (Piagetian tasks), combined sample, N = 78, r =.376, studies (2, 3) are indicated.
Figure 5 displays the relationship between fluid intelligence (SPM) and cognitive development (Piagetian tasks). There is one obvious outlier. If the lowest Piagetian result from study 1 is excluded (on the bottom) the correlation increases from r = .498 (N = 116) to r = .515 (N = 115). If the next two lowest Piagetian results from study 3 are removed, the correlation is r = .489 (N = 113) – nearly like with all deviating data before.
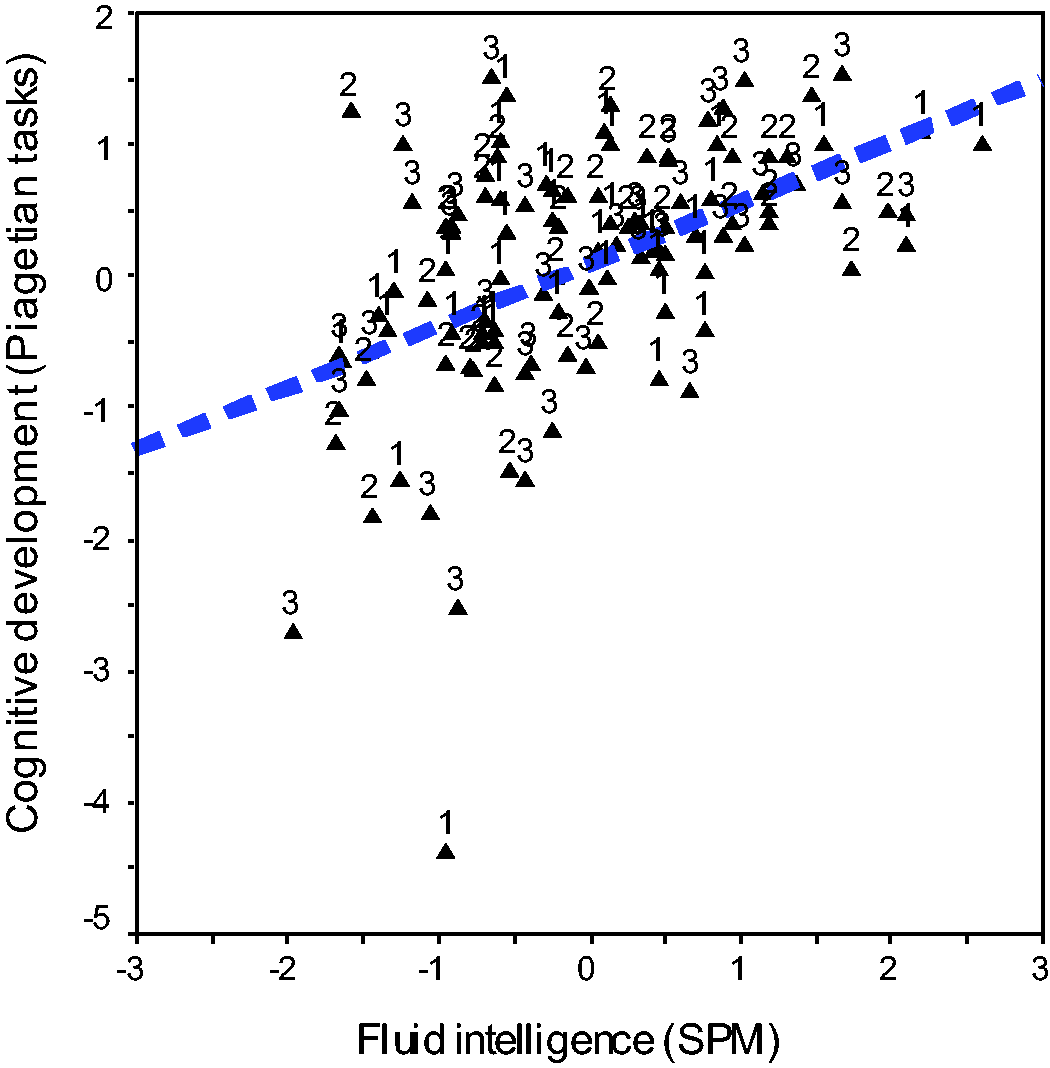
Scatter plot between fluid intelligence (SPM) and cognitive development (Piagetian tasks), combined sample, N = 116, r =.498, studies (1, 2, 3) are indicated.
The correlations between parental education and cognitive measures increase with complexity and knowledge-relatedness of tasks, from r = .115 (N = 78, ZVT) to r = .230 (N = 115, SPM) and r = .294 (N = 120, Piaget). The here presented SPSS-correlations differ slightly from the Mplus-correlations in Figure 2. SPSS presents the given correlations of a sample, Mplus estimates. However, that is not important, more important is that the ZVT results are given only for sample 2 and 3. If we choose an identical sample size for all three correlations (N = 77), the pattern of correlations with parental education remains and becomes even more accentuated: r = .123 (ZVT) to r = .277 (SPM) and r = .363 (Piaget). Nevertheless, outliers may have produced them, so we checked them using scatter plots.
Figure 6 displays the relationship between parental education and cognitive mental speed (ZVT). There are no obvious outliers. If the seven values at the lower left corner from both studies are excluded, the correlation would become smaller, if the two highest speed data in the upper middle are excluded, the correlation would become higher, but there is no hint that those values are biased outliers.
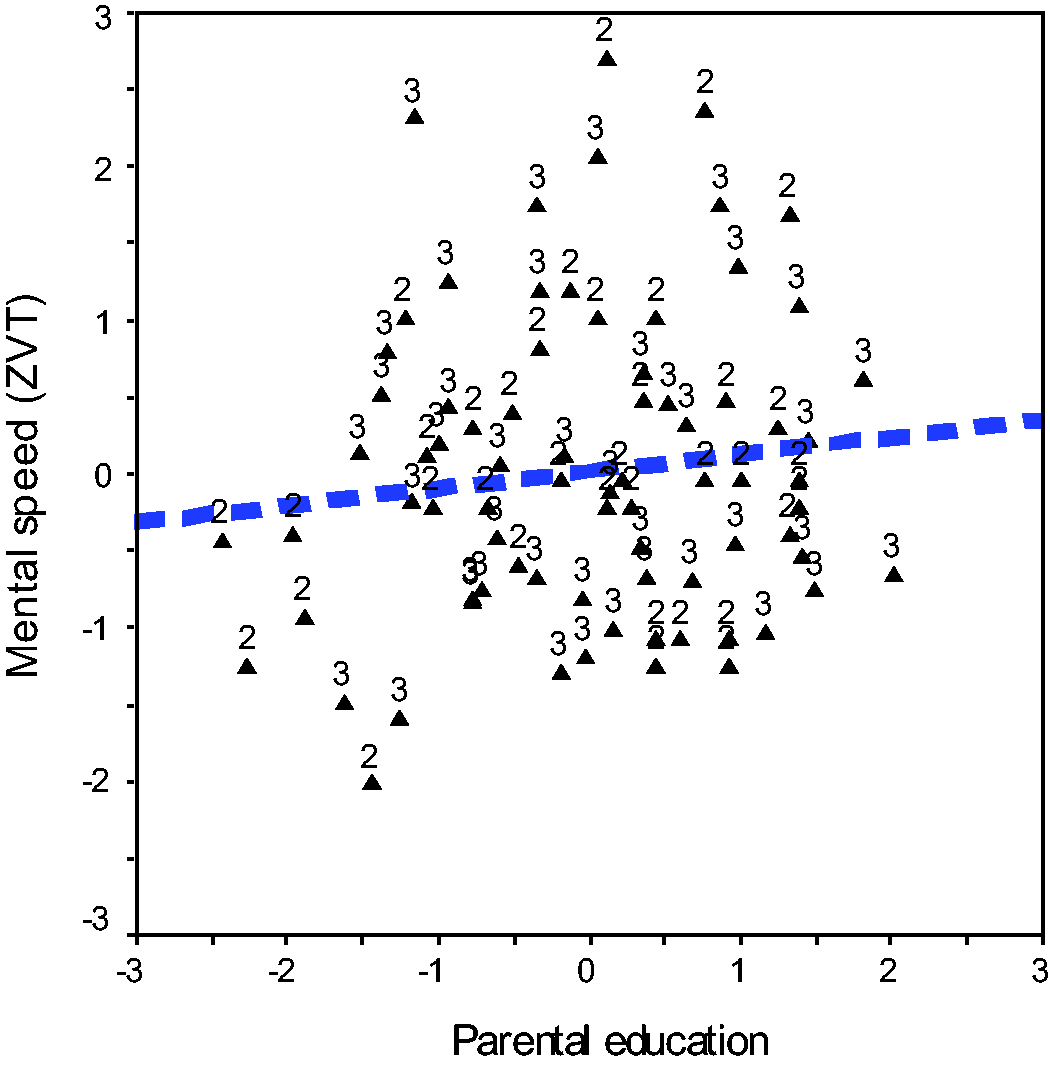
Scatter plot between parental education (formal, books) and mental speed (ZVT), combined sample, N = 78, r =.115, studies (2, 3) are indicated.
Figure 7 displays the relationship between parental education and fluid intelligence (SPM). Again, there are no obvious outliers. Excluding the highest SPM data point would increase the correlation from r = .230 (N = 115) to r = .259 (N = 114), but it is no clear outlier.

Scatter plot between parental education (formal, books) and fluid intelligence (SPM), combined sample, N = 115, r =.230, studies (1, 2, 3) are indicated.
Figure 8 displays the relationship between parental education and cognitive development (Piagetian tasks). There is one obvious outlier. If the lowest Piagetian result from study 1 is excluded (on the bottom) the correlation increases from r = .294 (N = 120) to r = .330 (N = 119). Excluding all low Piaget results (which would be dubious) would lead to r = .269 (N = 116).
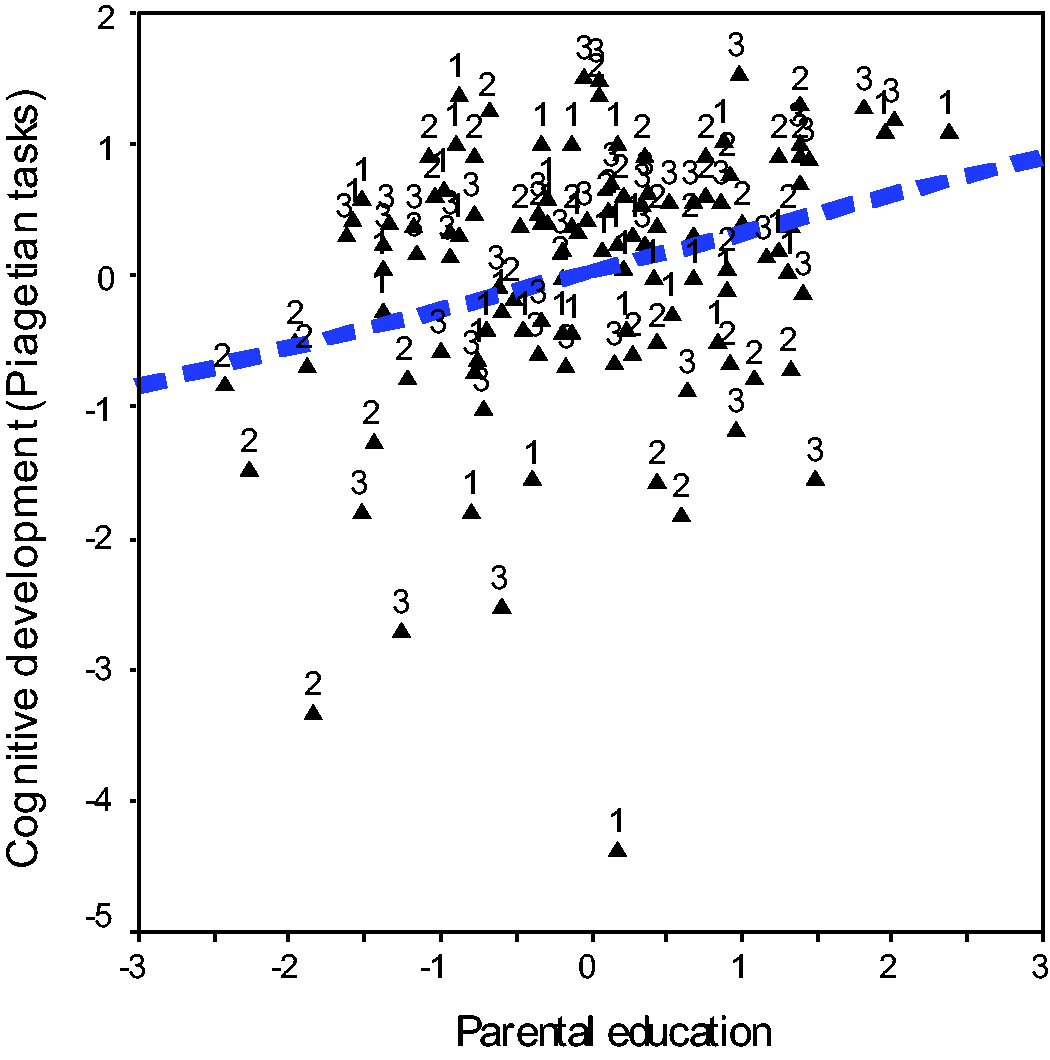
Scatter plot between parental education (formal, books) and cognitive development (Piagetian tasks), combined sample, N = 120, r =.294, studies (1, 2, 3) are indicated.
Discussion (of all presented studies)
There are four main results of our presented studies: (1) Raven and Piaget test results are empirically correlated on average at r = .51; after being corrected for attenuation (for unreliability), the average (“true”) correlation is ρ = .71. In a confirmatory factor analysis between latent factors, the correlation is ρ = .70. This means that the paper-and-pencil tests of Raven (CPM, SPM) and the scenario tests of Piaget show according to Cohen (1988) a “large” correlation (r ≥ .50).
However, the universal Cohen rule for the interpretation of effect sizes may not be appropriate for the correlations of test scales. As a second criterion, we choose a comparison with correlations between scales within one intelligence test, the German CogAT (KFT; Heller & Perleth, 2000). According to the manual (Heller & Perleth, 2000, p. 25), in 4th grade (the most similar comparison group in terms of age), the average correlation among single verbal, numerical and figural CogAT scales (V1, V2, … N3; using Fisher z-transformation) is r = .45. In our own data or data of secondary schools from our colleagues (German Gymnasiums), the average correlations vary from r = .35 to .47 (e.g., Rindermann & Heller, 2005). Compared to the correlations within one paper-and-pencil test, the empirical correlations between different tests and different measurement approaches (Raven and Piaget, observed data r = .51) are higher! A g factor of Raven and Piagetian tasks explains on average 41% of the variance compared to the German CogAT with around 47% (Heller & Perleth, 2000, p. 44). The g factor across different tests and measurement approaches is not extremely strong but nearly equally strong as a g factor within one test and within one test approach.
Based on individual differences, we conclude that Raven tests measure an ability similar to the one that Piagetian tasks measure. Raven tests were intended to measure an “eductive ability”, i.e. reasoning (Raven, 2000). The measured ability is seen as a very good indicator of fluid intelligence and as a good indicator of general intelligence g. Piagetian tasks were intended to measure cognitive development, not reasoning or general intelligence g. However, the high correlation shows that the tasks are also a good indicator of g. The same can be said for Raven tests: The tasks were not intended to measure cognitive development; however, the result of cognitive development in individual differences is well measured.
(2) Second, in two of our three samples (study 1 and 2), Raven and Piagetian tasks could not be distinguished by single sample factor analysis. Assuming independence of factors (no correlation), our exploratory factor analyses used an orthogonal rotation. This did not work. There were strong “wrong” loadings, i.e. Raven sets loaded on the Piaget factor, Piagetian tasks loaded on the Raven factor. However, in the third sample and in the confirmatory factor analysis (here using an oblique rotation assuming correlated latent factors), the two respectively three test approaches (ZVT, Raven, Piaget) were distinguishable. That means the tests are not “too bad”. But an assumption of independence is untenable: All three tests and the psychological abilities they measure are correlated.
(3) Third, ZVT showed higher correlations with Raven Matrices (SPM) than with Piagetian tasks, on average rRaven = .50 vs. rPia = .39. The average “true” correlation corrected for attenuation between constructs is ρRaven = .58 vs. ρPia = .45. In a confirmatory factor analysis, the correlation between latent factors is ρZVT-Raven = .58 vs. ρZVT-Pia = .49. Assuming that this is a stable pattern – what should be tested in further studies – three interpretations are possible: (a) Method; ZVT and Raven are paper-and-pencil tests and Piagetian tasks not. Therefore, ZVT-Raven correlations are higher. (b) Content: ZVT measures speed, Raven fluid intelligence, and Piagetian tasks crystallized intelligence. Speed and fluid intelligence are theoretically more similar (both strongly depending on maturation and biological factors) than speed and crystallized intelligence (crystallized intelligence depending more on education and learning than speed and fluid intelligence). (c) Development: Mental speed depends on biological maturation, fluid reasoning depends on mental speed and maturation (the Raven is a power test, so time constraints with respect to working speed are less important) and crystallized intelligence at the end of the development cascade depends on speed, maturation, fluid intelligence and learning opportunities (e.g., Demetriou et al., 2008). To distinguish between method and the two akin content-development theories, it would be necessary to measure mental speed and fluid intelligence with different methods, e.g. mental speed with chronometric tasks as reaction times (Jensen, 2006) and fluid intelligence with syllogisms or problem-solving tasks. In such a study a multitrait-multimethod matrix (Campbell & Fiske, 1959) can be obtained. We have not done this in the studies presented here, and so this is a research question for the future.
(4) Fourth, the indicators of environmental-cultural stimulation, formal educational level of parents and number of books at home, correlated more highly with Piagetian tasks than with Raven or ZVT. The correlations were on average rZVT = .11, rRaven = .20 and rPia = .25, in the path analysis of all data rZVT = .10, rRaven = .24 and rPia = .29, the total effects were βEdtot→ZVT = .10, βEdtot→Raven = .24, βEdtto→Pia = .29. There is no “method theory”, there is no assumption that parental education should correlate more or less with paper-and-pencil tests than with real-life tasks. Instead, there is a theory of different impact of environmental-cultural stimulation on mental speed (very low impact), fluid intelligence (low impact) versus crystallized intelligence (large impact; see Introduction and Cattell,1971/1987). So this empirical pattern supports the content-development theory: Piagetian tasks measure a kind of crystallized intelligence which is more dependent (compared to Raven as a measure of fluid intelligence) on environmental-cultural stimulation.
Regarding empirical individual differences, both approaches, the paper-and-pencil Raven and the scenario Piagetian tasks, measure similar constructs. From the perspective of psychometric intelligence theory, Piagetian tasks are a measure of crystallized intelligence and a good indicator of g (λg = .76). From the perspective of Piagetian cognitive development, Raven tests of inductive and deductive reasoning are a measure of achieved cognitive development.
Unsurprisingly, the Raven tasks (Figure 1: λg = .91) are a better indicator of g than Piagetian tasks (λg = .76): Higher g loadings are to be expected (1) when subscales (as within Raven) are more similar to each other (than subscales to each other within Piagetian tasks) and (2) when more tasks of one method (Raven and ZVT are paper-and-pencil tests) are used. Having more of the same kind and the resulting higher correlations lead to higher loadings on a g factor. However, in the case of Raven and Piagetian tasks, there is no convincing evidence for or against them being a good measure of cognitive ability. Differing content and tasks usually improve the construct validity of a test. Or is it evidence for having a good intelligence test if the test asks 100 times what 2 x 2 is? This would lead to high correlations and loadings on a g factor. Only if broad content and varied tasks are given along with high g loadings, a higher g loading is indicative of being a better test.
Of course, the psychometric approach has its large advantage in being more economic, especially such tests that can be applied in groups (as the Ravens, CFT, CogAT etc.). Well-established psychometric intelligence and student achievement tests (PISA, PIRLS, TIMSS etc.) can be used to test entire age cohorts. In contrast, Piagetian tasks have to be applied in individual test sessions. However, the speak-out-loud method allows for analysis of cognition. The theory can be used to understand thinking itself, people’s thinking, as well as its consequences for institutions, societies and culture in the present and in the past. For instance, from the perspective of epistemic rationality, absurd behavior such as “trials against animals” or “celestial bodies as persons with own intentions” cannot be explained by psychometric theories, but can be explained by Piaget’s cognitive development theory (Hallpike, 1980; Oesterdiekhoff, 2008, 2014). Hence, it should not be stated that one approach has to be abandoned in favor of the other, but that the different strengths in different applications should be used for measurement and for understanding cognition and intelligence.
Methodological issues, limitations and suggestions
All presented results are based on three not large samples. Stable estimates of correlations would require larger sample sizes and more different samples (Kretzschmar & Gignac, 2019; Schönbrodt & Perugini, 2013). According to a conventional approach, it could be suggested applying significance tests and also be criticized that in our small single samples as well as in our larger common sample, the mentioned differences in correlation (speed-fluid vs. speed-crystallized/Piagetian; parental education-speed vs. education-fluid vs. education-crystallized/Piagetian) are not statistically significant. This is indeed true. Given the differences in correlation of Table 1 of about rD = .11 a sample size of 290 persons would be necessary for significance at the 5%-level. For the difference in correlation between education-fluid and education-crystallized a sample size of even 2000 persons would be necessary!
However, significance tests are not appropriate to evaluate empirical data. Some quotes from titles of publications dealing with this issue also underline this statement: “Significance tests die hard. The amazing persistence of a probabilistic misconception” (Falk & Greenbaum, 1995); “Mindless statistics” (Gigerenzer, 2004); “Needed: A ban on the significance test” (Hunter, 1997); “Significance tests harm progress” (J. S. Armstrong, 2007); “The cult of statistical significance: How the standard error costs us jobs, justice, and lives” (Ziliak & McCloskey, 2008); “Moving to a world beyond “p < 0.05” (Wasserstein et al., 2019). The main message here is that significance testing does not help distinguish between true and wrong empirical statements.
Nevertheless, the answer cannot be “anything goes”. We applied a replication approach: Does an effect uphold if samples are changed (simple replication) or differ in important aspects (e.g., different age, different ability levels, different tests, different countries, different authors). We showed that there are consistent differences in the relationship of psychometric (fluid) and Piagetian (crystallized) measures with mental speed and parental education. However, we did not vary (except for age and Piagetian tasks) sample characteristics, measures and countries and, in addition, all studies were presented by us (though they were conducted by different students).
Further studies, preferably in different countries and age groups as well as by other authors and being preregistered, are needed to test the robustness of the results. Our Piagetian tasks showed lower internal consistency. Therefore, more tasks (better) or more similar tasks (not optimal) are needed. It would be better to have multiple, different indicators (tests) for each construct: for mental speed e.g. the ZVT and CDT (Coding-Test; Lindley & Smith, 1992) and chronometric tasks; for fluid intelligence the Raven and CFT and syllogisms; Piagetian tasks as given for cognitive development as well as further measures of crystallized intelligence as knowledge scales. In our study, effects (i.e., on correlations) of method (tests: ZVT, Raven, Piagetian tasks) cannot be distinguished from effects of construct (mental speed, fluid intelligence, Piagetian cognitive development or crystallized intelligence). A further comparison with student assessment tests and commonplace cognitive tasks would be revealing.
Finally, to check causal assumptions whether fluid intelligence has an impact on the development of Piagetian cognitive ability (Piagetian tasks being seen as indicators of crystallized intelligence), or whether progress in cognitive development from the perspective of Piagetian theory has an impact on solving tasks in psychometric intelligence tests (Raven matrices and others), longitudinal studies analyzing reciprocal cross-lagged effects are necessary. In such studies theoretically competing models (e.g., speed on fluid/psychometric on crystallized/Piagetian intelligence vs. crystallized/Piagetian on fluid/psychometric intelligence) can be tested.
Footnotes
Acknowledgments
The authors are grateful to Verena Greilberger, Marion Heilinger, Helga Innerhofer, Marion Kasnik, Alexandra Obendrauf, Rifeta Picha, Silvia Schwab, Patricia Prutsch and Vanessa Trost for their help in collecting data at kindergartens and schools.
Author Contributions
Conceptualization and Methodology: Heiner Rindermann; Project Administration: Laura Ackermann; Investigation: Heiner Rindermann and Laura Ackermann; Formal Analysis: Heiner Rindermann; Writing – Original Draft and Preparation: Laura Ackermann; Writing – Review & Editing: Laura Ackermann and Heiner Rindermann.
Article Notes

Supplemental Material
Supplemental material for this article is available online.