




Abstract
This study evaluated the psychometric properties of the Organizational Bullshit Perception Scale (OBPS) using two samples of employees of organizations in various sectors. The scale is designed to gauge perceptions of the extent of organizational bullshit that exists in a workplace, where bullshit is operationalized as individuals within an organization making statements with no regard for the truth. Analyses revealed three factors of organizational bullshit, termed regard for truth, the boss and bullshit language. The three factors are consistent with existing literature in the field of organizational bullshit and offer further insight into how employees view workplace bullshit. The OBPS constitutes three subscales measuring these factors. Future researchers should seek to validate the OBPS and further develop the identified factors of organizational bullshit.
Keywords
Introduction
In recent years, the term “bullshit” has moved from being a relatively mild expletive to a term that is used to describe acts of communication that have no grounding in truth. According to the seminal work by philosopher Harry Frankfurt (2009, inside cover), bullshit is everywhere: “One of the most salient features of our culture is that there is so much bullshit. Everyone knows this. Each of us contributes his share. But we tend to take the situation for granted”. Bullshit has become a seemingly ubiquitous practice of communication that permeates many different aspects of our lives, including our everyday language, culture, politics and, most relevant to the research here, life in organizations (Christensen et al., 2019). But in spite of the growing academic interest in bullshit (e.g. Christensen et al., 2019; Graeber, 2018; Pennycook et al., 2015; Pennycook & Rand, 2020; Petrocelli, 2018) and the mounting evidence of its influence on the world (Bergstrom & West, 2020; McCarthy et al., 2020; Spicer, 2017), research into its nature and effects remains in its infancy. In the research reported here we sought to add to this literature by investigating bullshit in organizations. More specifically, we present an original scale designed to measure employees’ perceptions of bullshit in their organizations, which we term the Organizational Bullshit Perception Scale.
The structure of this paper is as follows. First, we define the construct of organizational bullshit and its dimensions. Thereafter, the process used to generate the items for a scale to measure an organization’s members’ perceptions of the extent to which bullshit is prevalent in their organization is described. Following this, an outline of the initial study using this scale in a sample of adult employees is explained and the process whereby the reliability and validity of the scale was established is then discussed. Lastly, concluding remarks outline the applications of the scale in management practice and offer avenues for future research using the scale.
Construct definition and item generation
Drawing on Frankfurt (2009), McCarthy et al. (2020, p. 254) define workplace bullshit as “as taking place when colleagues make statements at work with no regard for the truth”. The word bullshit can therefore be both a verb (the act of communicating with no regard for the truth), and a noun (the information contained in that which is communicated with no regard for the truth). Bullshit can be expressed in writing (e.g., emails, memos, reports), in spoken form (e.g., conversations and speeches), and visually (e.g., charts, diagrams). It is important to distinguish between bullshit and lying. While liars care about the truth, know it, and deliberately misrepresent it, bullshitters neither know nor care whether something they communicate is true or not (Frankfurt, 2009; McCarthy et al., 2020). As bullshitters don’t care what the truth is, this affords them freedom to say whatever it takes to further their agenda (McCarthy et al., 2020). This freedom from truth and evidence can mean that bullshit is sometimes misperceived as something profound (Pennycook et al., 2015) or, alternatively, viewed as an empty claim (Spicer, 2020). In the workplace this range of perceptions can result in four responses from individuals that work to promote or hinder the prevalence of organizational bullshit: exit (they try to escape the bullshit); voice (they confront the bullshit); loyalty (they embrace and spread the bullshit); and neglect (they disengage from the bullshit) (McCarthy et al., 2020).
Workplaces are awash with many forms of bullshit that manifest in many different ways, including misrepresentation, where leaders make statements without knowing the facts; meaningless job titles (Graeber, 2018); fake and shallow company slogans (e.g. Lee et al., 2020); and workplace puffery such as resumé padding (Grover, 2005). Under some circumstances, organizational bullshit, usually referred to as “banter”, “badinage” or “joshing” can be harmless, often creative, and even contribute to a congenial atmosphere in an organization. Organizational bullshit may even have a positive effect when leaders articulate inspiring futuristic, but largely uncertain visions, that are meant to inspire others to act (Christensen et al., 2019). On the other hand, other scholars have outlined a number of detrimental effects of bullshit. McCarthy et al. (2020), while acknowledging there can be positive effects of organizational bullshit, also caution that it can result in lower job satisfaction among the organization’s members, increased distrust in leadership, a reduction in productivity, and ultimately a negative impact on overall performance (McCarthy et al., 2020). In a similar vein, Spicer (2017, p. 164) argues: “No longer is bullshit a handy supply of manure for fertilizing new ideas. Instead, it can create a dangerous waste problem, which could make people and, indeed, the entire organization, profoundly ill”. According to Spicer (2017), bullshit has a number of negative effects on both employees and organizations, including a separation of talk and action, an apparent ignorance to well-established assumptions and a tendency to suppress those with differing opinions and perspectives. He cautions that the most detrimental consequence of rampant organizational bullshit is the corrosion of organizational decision-making.
In spite of these arguments about the potentially powerful effects of organizational bullshit, at present they remain untested by empirical research. One reason why is that there is no instrument or scale to measure the prevalence of bullshit in an organization. We assume that the people who are in the best position to accurately assess the degree of bullshit in their organizations are the people who work there; therefore, we set out to develop a reliable and valid scale to measure employees’ perceptions of the extent to which bullshit exists in their organizations. Next, we turn to how we developed the Organizational Bullshit Perception Scale (OBPS).
When developing items for scales, it is critical to focus on construct validity, or as Hinkin (1995, p. 969) puts it, that the items generated “adequately capture the specific domain of interest yet contain no extraneous content.” Of course, given that research in this area is in its infancy, the domain itself is not well-defined, but we nevertheless conducted a review of the relatively sparse literature on organizational and workplace bullshit, including the work of Belfiore (2009), Frankfurt (2009), McCarthy et al. (2020), Pennycook et al. (2015), Pfattheicher and Schindler (2016), Spicer (2017, 2020) and Sterling et al. (2016).
Our first step was to generate a list of preliminary items based on that review. We began by generating dozens of items, and through an iterative process where we shared the items amongst the authors, and subsequently refined them, dropped them, or integrated them based on their clarity and comprehensibility. We also sought feedback from colleagues and managers who were less familiar with the literature on bullshit, (i.e. people who were more similar to potential respondents), in order to confirm whether they found the items to be clear and comprehensible. This process of developing and refining the items continued in an iterative manner, ensuring that only those items that we all agreed captured the concept of organizational bullshit and were readily understood by others, were included in the final set of items. Throughout this process the researchers remained mindful of good practices such as ensuring redundancy across different items, incorporating reverse-coded questions, and correcting double-barreled items (DeVellis, 2016), until the final list of 15 items that we used in our primary study was generated. This process was also informed by our review of the literature, which suggested that there should be three factors present in an organizational bullshit perception scale.
The first factor in our OBPS is based on the fundamental act of bullshit: communicating with little to no regard for truth, related evidence and established knowledge (Frankfurt, 2009, Petrocelli, 2018). This disconnection from the truth seems to be stronger - more pervasive and more accepted - in some organizations than others (Spicer, 2017, 2020). This variation is likely to be reflected in the extent to which an organization has a culture of seeking and using evidence to support statements, as opposed to it being more commonplace for employees and leaders to rely on hunches, anecdotes and personal experiences and opinions (McCarthy et al., 2020; Pfeffer & Sutton, 2006) when making decisions or persuading others to their points of view. In other words, this dimension of bullshit reflects the degree to which an organization tolerates (or even embraces) individuals who make statements with no regard for the truth. Does the organization accept, ignore, or challenge bullshit statements that try to impress, persuade, or fit (i.e., persuasive bullshitting), or to avoid, dodge or elude something (i.e., evasive bullshitting) (Littrell et al., 2020)? Based on these ideas, the first set of items in our scale are designed to measure the extent to which employees believe their organization has a culture that expects (or not) that workplace statements and discussions should have a regard for truth that is grounded in evidence and established knowledge.
The second factor suggested by literature on bullshit concerns the communication behavior of high-status individuals in organizations. Since leaders are likely to be the most important and influential bullshitters in organizations (McCarthy et al., 2020, Spicer, 2017), items were generated to tap into subordinates’ perceptions of whether their bosses tended to engage in bullshit-related practices. Applying the logic of Petrocelli (2018), leaders will be driven to bullshit when the social and professional expectations to have an opinion are high, and when they expect to get away with it. These two conditions are subject to how (un)knowledgeable their audience is. Similarly, if leaders exhibit high levels of overconfidence, and believe they are popular amongst their peers, this will make them likely to engage in more bullshit-related behavior (Jerrim et al., 2019).
To complement the first two factors of bullshit we propose a third factor, concerning bullshit language. This factor reflects how bullshit transpires in the workplace. As noted earlier, bullshit involves communicative acts that have no regard for the truth, and that are typically made with the bullshitter’s agenda in mind (Spicer, 2013). As such, bullshit typically contains language that is meant to enhance the credibility of arguments or statements, and to bolster the legitimacy of a bullshitter, while at the same time trying to befuddle listeners so they are unable or unwilling to try to penetrate to the lack of truth behind the bullshit. Corporate jargon is one such example of organizational bullshit language, whereby words or expressions are used in an attempt to legitimize something, whilst at the same time confusing language and thinking (McCarthy et al., 2020; Spicer, 2017). McCarthy et al. (2020) refer to a number of bullshit expressions such as “blue-sky thinking” or “out-of-the-box thinking”, which are often used as vague buzzwords with minimal substance. This vagueness serves the interests of bullshitters, because communication targets are less likely to ask questions when they find it difficult to understand what has been said (McCarthy et al., 2020). Bullshit language therefore goes beyond what is said, but also incorporates how it is said – whereby both components are able to compound the actions of bullshitters.
Thus, the literature suggests there are three factors comprising organizational bullshit. We have termed these factors regard for truth, the boss, and bullshit language. We expected that these factors would be related to one another. Organizations with a culture of bullshit would likely influence leaders to bullshit, and leadership bullshit could in turn shape an organization’s culture. Further, an organization with limited regard for truth, would likely reward the bullshitting behavior of the boss and other employees, who would readily make use of bullshit language to advance their own self-interests.
The data
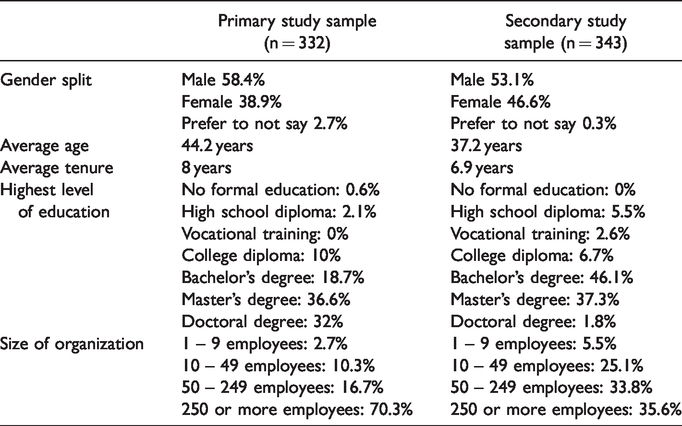
The primary study sample consisted of full-time employees in a range of different industries including healthcare, education, manufacturing, financial services, software development, government, gaming and marketing. Respondents were solicited via email and various social media platforms to complete an online survey containing 15 items. A total of 332 usable responses were received in the primary study sample. The secondary study sample was collected from a purchased, large commercial database of individuals currently in full-time employment who completed an online survey, that initially garnered 381 responses. Following data cleaning procedures that eliminated any duplicate responses, those failing basic attention checks and responses with excessive missing data, the final, realized secondary sample comprised 343 respondents. Table 1 below summarizes a number of descriptive statistics pertaining to both the primary and secondary study samples. As noted therein, the primary study had respondents that were slightly older, more tenured and more educated than respondents in the secondary study. A strong majority of the respondents in the primary sample typically worked for large organizations (above 250 employees), whereas respondents in the second study were employed across organizations of varying sizes.
Summary of sample descriptive statistics.
Data analysis and results
Exploratory factor analysis for the primary study
For the initial assessment of the OBPS an exploratory factor analysis (EFA) using IBM SPSS was conducted on the primary study dataset to assess psychometric properties. First, in order to confirm that the sample was suitable for factor analysis, both the Kaiser-Meyer-Olkin (KMO) measure of sampling adequacy (Kaiser, 1970) and Bartlett’s test of sphericity (Bartlett, 1954) were applied. The KMO value was 0.9, which exceeds the recommended threshold of 0.6 (Pallant, 2013; Tabacknick & Fidell, 2013). Similarly, Bartlett’s test was significant (X2 = 2742.40; p = 0.00) thus confirming the suitability of the data for an EFA.
The EFA used the principal components analysis extraction method, also referred to as component analysis (Hair et al., 2014), with rotation. Using Kaiser’s criterion of eigenvalues greater than one (Kaiser, 1960) three factors were extracted explaining a total of 64.4% of the variation in the data. The extraction of three factors was confirmed by the examination of a scree plot, which suggested that following the extraction of three factors, the plot slope begins to approximate a horizontal line (Hair et al., 2014). Factor 1 (eigenvalue = 6.41), loading seven items explained 25.25% of the variation, Factor 2 (eigenvalue = 1.99) loading four items explained 21.70% of the variation and Factor 3 (eigenvalue = 1.26) loading four items explained 17.45% of the variation in the data. As all items obtained communalities above 0.4 no items were removed from the analysis (Pallant, 2013). The 15 items and rotated factor loadings are presented in Table 2 below, all of which exceed the recommended threshold for practically significant loadings of 0.5 (Hair et al., 2014).
Rotated factor loadings.

1 indicates all these items were prefaced with “In our organization…”.
(R) indicates that the item was reverse-coded.
The results confirmed the three distinct factors of the OBPS. The first factor, named ‘regard for truth’, includes all items that relate to the use of evidence-based decision-making supported by the incorporation of data sources. The second factor, named ‘the boss’, includes all items that pertain to an evaluation of the actions of one’s superior. The third factor, named ‘bullshit language’ includes items that relate to typical characteristics of the language of bullshit communications, namely excessive use of acronyms and jargon (McCarthy et al., 2020). The fact that two of the items loading on the third factor contain the word ‘boss’ and yet do not load on the second factor provides evidence for the distinctiveness of the bullshit language factor as its own factor regardless of the source of the language.
Internal consistency and convergent validity for the primary study
An evaluation of the internal consistency or reliability of the scale indicated that the overall OBPS had a Cronbach alpha (Cronbach, 1951) value of 0.90, while the individual factors obtained alpha values of 0.86, 0.86 and 0.84 respectively. Since internal consistency is not sufficient to establish validity (Parasuraman et al., 1991), a number of other assessments were conducted. The authors examined the association between the OBPS and a separate measure of overall bullshit perception within an organization. All respondents assessed their overall perceived bullshit in their organization on a simple 4-point scale ranging from 1 indicating ‘there is no bullshit in our organization’, through 2 indicating ‘there is a little bullshit in our organization’, through 3 indicating ‘there is some bullshit in our organization’ to 4 indicating ‘there is a lot of bullshit in our organization’. The overall perceived bullshit in the organization was regressed on the three perceived bullshit scale factors. The R2 value of 0.36 indicates convergence between the OBPS and the overall bullshit perception measure, with regard for truth and the boss being significant predictors of the overall bullshit perception.
Factorial validity for the primary study
The factorial validity of the OBPS was then assessed by means of a confirmatory factor analysis (CFA). The three-factor model with the second order factor structure obtained an acceptable fit (Χ2 =366,07, df = 87, p < 0.01, CFI = 0.89; TLI = 0.87; RMSEA = 0.09; SRMR = 0.07). Furthermore, all factor loadings were found to be significant (p < 0.01) exceeding the threshold of 0.5 (Hair et al., 2014). To validate the factor structure, three models were examined. First, the three-factor model was examined, with the three identified factors of the OBPS, then a two-factor model with factors pertaining to (1) regard for truth and (2) bullshit communication – the bases upon which the original items were developed was examined. Thereafter, a single-factor model was examined, where all items load directly onto a single factor. Table 3 summarizes the results of the models identifying that both the single-factor and two-factor models presented a significantly worse model fit than the three-factor model. The model fit of the CFA therefore supports the three-factor structure for the primary study dataset.
Summary of model fit statistics.

All factors obtained acceptable Cronbach alphas (>0.7) (Malhotra, 2010) and composite reliability indices (>0.6) (Hair et al., 2014). All standardized regression weights were significant (p < 0.01) and exceeded 0.5, with the average variance extracted (AVE) exceeding 0.5 for the boss and bullshit language factors, providing support for convergent validity. Regard for truth obtained an AVE of 0.47, slightly below the threshold. However, as suggested by Fornell and Larcker (1981), if the AVE falls below 0.5, while the composite reliability is above 0.6, the convergent validity is acceptable. The discriminant validity of the model is assessed in Table 4, whereby the correlation matrix is presented with the square root of the AVE presented along the diagonal (Hair et al., 2014). As indicated in Table 4, the square root on the AVE presented along the diagonal exceeds the cross-correlations with all other constructs as per the Fornell-Larcker criterion (1981). The table therefore indicates that discriminant validity has been achieved.
Discriminant validity metrics.

Significant at a 1% level of significance.
Exploratory factor analysis for the secondary study
Following the initial exploration and validation of the OBPS, further data was collected to validate the scale on the secondary study dataset. Following the primary study data analysis, and the confirmation of three distinct factors, further items were generated in order to more comprehensively assess the three distinct factors. Following a similar iterative process to how we generated the initial item set for our first data gathering, we generated twelve items for each of the three factors.
The three subscales in the secondary study continued to show good internal consistency, with the three factors obtaining Cronbach alpha (Cronbach, 1951) values of 0.79, 0.86 and 0.87 respectively. The extended OBPS in the secondary study indicated an alpha value of 0.93. An EFA was then conducted on the data collected through the secondary study in order to determine if the three-factor structure was able to be replicated. The KMO value of 0.96 exceeds the recommended threshold of 0.6 (Pallant, 2013; Tabacknick & Fidell, 2013), and the significant Bartlett’s test (X2 = 9099.62; p = 0.00) indicates the suitability of the data for an EFA. However, we were unable to replicate the three-factor structure from our secondary data. An analysis of the scree plot indicated that only two factors should be extracted, which together explained 59.1% of the variation in the data. Factor 1 (eigenvalue = 13.08) loading 21 items explained 38.8% of the variation while Factor 2 (eigenvalue = 6.4) loading 12 items explained 20.3% of the variation. The latter factor, however, included all the reverse-worded items, strongly suggesting that it was a methods factor (Podsakoff et al., 2003), not a substantive factor that represented an underlying component of the construct of interest. Weijters et al. (2013) discuss three possible sources of reversed item method bias. Acquiescence refers to respondents’ having a preference for one side (often the positive side) of a ratings scale; careless responding (in the context of reverse-worded items) refers to respondents not noticing the reversed wording; and confirmation bias concerns respondents activating beliefs that are consistent with the way in which an item is stated (e.g. whether they are asked if a workplace is full of bullshit or devoid of bullshit they will agree). Both acquiescent responding and respondent carelessness tend to enhance inconsistencies in responses between regular and reverse-coded items (Weijters et al., 2013) ultimately influencing the results and the interpretation thereof. Confirmation bias results in either an upward or downward bias in respondent scores, depending on the direction of the first item that a respondent is exposed to. Due to the use of randomization in the survey design, the confirmation bias was not readily detectable as respondents were exposed to the questions in a randomized order.
Regardless of the reason why a significant methods factor emerged in our secondary study, the existence of such a factor points to concerns about the quality of the data. Taking that into account, where there is an inconsistency between the primary study and the secondary one, we place more credence in the results of the first study. Respondents in that case compiled the study voluntarily, unlike the paid respondents in the secondary study. Furthermore, the three factors identified are consistent with the existing literature. Therefore, we propose that the OBPS be viewed as having three factors, and we call for subsequent research to further investigate the factor structure of the scale.
Discussion and implications of the research
This research sought to develop a scale to assess employees’ perceptions of organizational bullshit. Through the development and testing of the OBPS, the initial EFA identified three distinct factors, namely regard for truth, the boss and bullshit language. This factor structure was then confirmed through an initial CFA and a number of reliability and validity assessments confirmed the integrity of the scale. Following further item generation to more comprehensively examine the distinct factors of the OBPS through further data collection, the secondary study confirmed the acceptable reliabilities of the three subscales, however, we were unable to confirm the three-factor model in that sample. We attribute that to flaws in the data of the secondary study, which were evident in the presence of reverse-coded item bias.
The three underlying dimensions of organizational bullshit provide insight into how bullshit manifests itself in organizational life, and provides evidence that employees are attentive to bullshit and its components. The first factor, regard for the truth, taps into the fundamental nature of bullshit as a communicative act that tends to disregard evidence and other factual information. It also suggests that employees are aware that such communicative acts are present in organizational life. Our own experiences, as well as the many anecdotal conversations that we have had when developing the items and conducting this research, suggests that this is a source of frustration for many employees. While an organizational disregard for the truth may be accepted under certain circumstances, such disregard may lead to organizations making more questionable decisions (Christensen et al., 2019; Spicer, 2017) that could not only alienate employees, but could ultimately put their jobs at risk by endangering the welfare of their employing companies.
The second dimension, the boss, confirms that employees believe that their superiors are key players in the dissemination of bullshit. Bullshit aims only to serve an immediate end – whether to puff up one’s reputation or to advance their point of view or argument (Gibson, 2011). Further, employees are likely to have to take action based on any bullshit communicated by their bosses. As a result, employees are likely to be acutely aware when their superiors use bullshit to advance their own self-interests.
The final dimension, bullshit language, considers some of the commonly used types of language employed by bullshitters, namely the excessive use of acronyms and jargon. The finding that employees perceive that the excessive use of such language is a form of bullshit confirms that they are not oblivious to its use in the workplace. They may share the opinion of McCarthy et al. (2020, p. 258), who argued that “if a statement is riddled with meaningless language, acronyms, buzzwords, and jargon, then it is likely to be bullshit.” It is possible that the excessive use of acronyms and jargon may occur to employees as an exclusionary mechanism in the workplace, whereby those unfamiliar with the terminology may not be able to meaningfully contribute to the conversation or voice their concerns.
From a scholarly perspective, the OBPS provides a way to delve further into this important concept, its nature, and its antecedents and consequences. Our findings suggest that employees are attuned to the presence of bullshit in organizations, and their attitudes, beliefs, and actions are likely to be influenced by their perceptions of it. Of course, further theoretical and empirical work is needed to tease out the varying ways in which bullshit influences organizational outcomes, and we hope our scale can be of use in that regard. From an applied perspective the OBPS provides a simple checklist for human resource practitioners to use to diagnose both the actual prevalence of organizational bullshit, as well as the extent to which employees believe it is present in an organization. The tool also enables the identification of more specific areas in which bullshit might be a cause of problems so that these can then be addressed: Does communication in the organization occur without regard for evidence? Do senior executives purvey bullshit in their communication? Is there excessive use of acronyms (e.g. CPC, LBH, NBD) and jargon (“thinking outside the box”, “low hanging fruit”, “drink the kool aid”)? If these conditions can be identified, strategies can then be developed for remedying them.
Limitations and recommendations for future research
Like all research this has its limitations, and we wish to acknowledge three of them here. First, we were unable to confirm the three-factor structure in our secondary study, likely due to problems with how respondents dealt with the reverse-coded items. Further research is therefore essential to confirm whether these three factors will replicate in other contexts. Second, while attempts were made to enhance the comparability of the two distinct samples, there are some noticeable differences between the two sample groups. The primary study sample was, on average, an older, more tenured and more highly educated group of individuals than the second sample, as such one cannot rule out a difference in interpretation of the items by the two groups as a result of these factors. Third, the research did not explicitly measure respondents’ attitudes toward their organization and as such was not able to control for its influence.
Nevertheless, we hope that this research serves as a catalyst for future research in the field of organizational bullshit. We also hope that future researchers will test the OBPS and validate the three-factor structure identified. We strongly advise that future researchers consider revising the reverse-coded items to reduce the introduction of reversed item method bias. We also encourage scholars to delve further into the impacts of bullshit in organizations by examining the relationship between the OBPS and other variables of importance. As noted earlier, scholars have noted that there may be both positive and negative effects of organizational bullshit. The overall effects of bullshit may be examined by relating them to important outcomes such as job satisfaction (e.g. Agho et al., 1992; Brooke et al., 1988) and the different types of organizational commitment (Angle & Perry, 1981). Further, we suspect that the effects of bullshit will often depend on context: bullshit may be acceptable, for example, when a leader extols the virtues of a new strategic initiative but may be met with approbation when it comes to the interpretation of scientific experiments. Future research could investigate such contextual influences. For example, employees in certain industries or occupations may report high OBPS scores yet be relatively unaffected (or even react positively), whereas those in other settings may react much more negatively.
In conclusion, we hope that the creation of the OBPS will contribute to the rapidly growing conversation about bullshit and its importance in the workplace. We hope researchers will conduct further theoretical and empirical investigations into the identified factors of regard for truth, the boss and bullshit language, so that we can learn more about this important concept and how it shapes all of our working lives. Hopefully this will help leaders to structure workplaces where fewer workers grumble “This place is full of bullshit.”