



Abstract
The aim of this study was to assess the factorial structure of the scale, the method's effect associated with its negative items, its temporal invariance, and factorial invariance according to sex. For this purpose, three samples were collected, an initial sample of 200 participants, a second sample of 461 participants and a third sample of 107 participants; making a total of 768 Peruvian university students. Other instruments were applied together with the EROS scale in order to measure satisfaction with life, anxiety, stress and depression. Regarding the results, in the initial sample it was found that the original scale containing positive and negative items does adequately fit the data (RMSEA = .19; CFI = .77; TLI = .71) and also evidence was found supporting the existence of a methodological effect associated with the negative items. It was also found that version B of the scale which only has positive items data fits the data (RMSEA = .13; CFI = .96; TLI = .95). In the second sample it was found that version B still had a good fit to the data in a larger sample (RMSEA = .07; CFI = .98; TLI = .98). In addition, it was found that the scale can be considered invariant according to sex and presents validity based on other constructs. In the third sample it was found that the test-retest reliability of the scale was adequate (.70 [CI95% .593–.788]) and also evidence was found in favor of the temporal invariance of the scale. It is concluded that the scale formed only by positive items presents more robust psychometric properties and constitutes a better alternative to measure the level of reward provided by the environment.
Keywords
Introduction
Behavioral Activation is a therapy set out in the third generation of cognitive-behavioral therapy whose main objective is to carry out activities that increase the contact with the contingencies of the environment, and thus feel reinforced by the environment (Hayes, 2016), which is based on the assumption that the behavioral change causes a change in state of life, in perceived rewards, in solution of problems (Pérez-Alvares, 2014) and in emotions (Barraca & Pérez-Álvarez, 2015). In addition, it is a therapy that uses a version of functional analysis and a philosophy based on functional contextualism to explain human behavior (Kanter et al., 2011). Its effectiveness has been demonstrated in several meta-analysis studies (Barth et al., 2013; Mazzucchelli et al., 2009, 2010; Zabihi et al., 2020) and in randomized clinical studies (Dimidjian et al., 2006; Gawrysiak et al., 2009; Hopko et al., 2011). Furthermore, it is as effective as pharmacological treatment (paroxetine) with less treatment abandonment or refusal (Dimidjian et al., 2006) and is more effective than Cognitive Behavioral Therapy (Richards et al., 2016). Also, several studies have demonstrated its efficacy in group interventions (Mahen et al., 2019; Simmonds-Buckley et al., 2019) and through mobile applications (Ly et al., 2014).
Since the development of this treatment protocol, one of the main needs was the development of original evaluation instruments that would allow for an effective assessment of the main objectives of the therapy: to measure the increase in behavior and to measure the access to positive reinforcement (Martell et al., 2013). However, the absence of instruments with robust psychometric properties may make it difficult to evaluate these objectives and to objectively assess the effectiveness of therapy.
Responding to this need, Armento and Hopko (2007) developed the Environmental Reward Observation Scale (EROS), which is a brief ten-item instrument to evaluate increased behavior and access to positive environmental reinforcement. The instrument has been widely used in randomized clinical studies (Fernández-Rodríguez et al., 2020; Mira et al., 2019; Vázquez et al., 2019) and explanatory studies (Aoki et al., 2019; Kern et al., 2019; Maitland et al., 2019; Martínez-Vispo et al., 2019; Otero et al., 2020).
Regarding the psychometric properties of the EROS scale, the original study conducted with university students (Armento & Hopko, 2007) showed that a one-dimensional model fits well with the data (RMSEA = .06; GFI = .92; NFI = .90) with good reliability in its scores (α = .88). Furthermore, EROS has several adaptations. Its French version (Wagener & Blairy, 2015) showed good evidence based for internal structure (RMSEA = .06; GFI = .99; NFI = .99) and reliability of scores (α = .89). In the Spanish version (Barraca & Pérez-Álvarez, 2010), its internal structure was reviewed by means of an Exploratory Factor Analysis (EFA) showing that the items formed two factors, although the first factor explained most of the variance (45.7%). Regarding its reliability, it showed an adequate level of internal consistency (α = .86). In Colombia (Valderrama-Díaz et al., 2016) the EFA showed that the items formed two factors, where the first factor explained most of the variance (46.8%) and the reliability of the scores was good (α = .87). Additionally, there is a Spanish version only for breast cancer survivors (Fernández-Rodríguez et al., 2020), where the evidence suggests a non-adjustment of the one-dimensional model (RMSEA = .116 [IC90% .096–.137); in spite of that, its reliability was excellent (α = 91).
With respect to the psychometric studies carried out in Spanish-speaking populations, there are several methodological limitations, such as the use of the principal components method as an EFA estimator, which only takes into account the total variance and does not differentiate between the common variance and the error variance to form the factors (Watkins, 2018). In addition, the use of Kaiser's rule overestimates the number of factors as a function of the number of items, that is, a greater number of items increases the number of factors estimated (Watson, 2017). Additionally, the use of varimax rotation is not appropriate since it assumes that the factors are not related to each other (Lloret et al., 2017). Furthermore, it is worth noting that only one study (Fernández-Rodríguez et al., 2020) carried out a Confirmatory Factorial Analysis (CFA) to evaluate the internal structure of the scale. However, it was carried out on a very specific sample of women, which limits the generalizability of the results. Therefore, it can be seen that there is a lack of conclusive psychometric studies to confirm the internal structure of the scale in the Spanish-speaking population.
It is important to mention that all the psychometric studies carried out use Cronbach's Alpha coefficient (α) as a reliability indicator and there is no evidence of the use of compound coefficients that are typically used in factorial models and that are resistant to tau-equivalence non-compliance (Viladrich et al., 2017). Nor has psychometric evidence been found on the test-retest reliability of the scale, which is important for evaluating the stability of scores over time.
Furthermore, no psychometric studies have been found that assure the factorial invariance of the scale according to the sex of those evaluated; several studies have found that women are more sensitive to reinforcements and rewards, because they obtain a higher score in behavioral events and participate in more behavioral domains than men (Ryba & Hopko, 2012; Tull et al., 2010). Nor has psychometric evidence been found on the temporal invariance of the scale that guarantees that the changes observed over time are the product of a real change in the level of the construct.
Another important aspect is the lack of psychometric studies that evaluate the possible methodological effect associated with the presence of negative items in the scale, since these types of items make it difficult to adequately understand the items (van Sonderen et al., 2013), cannot control for acquiescence bias in the factor structure (Savalei & Falk, 2014), and generally create an additional factor in the structure of the scale (Lindwall et al., 2012).
Finally, the review of previous psychometric studies shows that SEM has not been used to assess validity based on the relationship to other constructs. This is even though it is a very useful tool that provides information about the relationship between the observed variables (items) and the constructs they represent and the relationship between the measured constructs themselves (McCoach et al., 2013). For this study, according to the literature review, EROS was expected to have a positive relationship with life satisfaction (Hopko et al., 2011) and a negative relationship with depression and anxiety (Safra et al., 2019; Vázquez et al., 2019).
Faced with these methodological and psychometric limitations, this study has the following objectives: (a) evaluate the internal structure of the scale through CFA, (b) evaluate the method’s effect associated with negative items, (c) evaluate reliability using more robust indicators, (d) evaluate temporal reliability, (e) evaluate temporal invariance, (f) evaluate factor invariance according to sex, and (g) evaluate validity related to other constructs.
Method
Participants
For this study, three samples were collected, starting with an initial sample of 200 participants in order to compare two versions of the test. Version A involved 100 students (37% male and 63% female) aged 17–29 (M = 20.8, SD = 2.5) and version B involved 100 students (62% male and 38% female) aged 17–28 (M = 20.4, SD = 2.1). In both cases they were university students attending a private university in Lima, Peru. The sample size used for both versions (A and B) is sufficient considering that it is a one-dimensional model with ten indicators whose factor weights are equal to or greater than .50 (Wolf et al., 2013).
To confirm the psychometric properties of version B, a second sample of 461 university students (58.4% male and 41.6% female) between 17 to 28 years old (M = 20.7, SD = 2.4) was collected, where no significant differences were found between the ages of males (M = 20.2, SD = 2.4) and females (M = 19.9, SD = 2.3) and the effect size was low (t(459) = 1.06, p = .288, d = .24, CI95% −.20–.68). Finally, to evaluate the temporal invariance of version B, a third sample was collected which consisted of 107 university students of both sexes (21.5% male and 78.5% female) from 18 to 29 years old (M = 21.2, SD = 2.5). The time between the first and second application was 36 days.
The following inclusion criteria were used for the collection of the three samples: (a) informed consent of the participants, (b) ability to read and write in Spanish, (c) not older than 40 years of age, and (d) being enrolled in a university degree program. The following exclusion criteria were also used: (a) failure to complete all tests, and (b) failure to complete the second assessment in the temporal invariance.
Measures
Environmental reward observation scale (EROS)
This 10-item instrument was developed by Armento and Hopko (2007) to measure the degree of reward provided by the environment. The version adapted to Spanish by Barraca and Pérez-Álvarez (2010) was used for this study, where it showed a high reliability (α = .86). The items have four response categories that range from “totally disagree” (1) to “totally agree” (4), where a higher score shows greater experience of the environment.
Depression, anxiety and stress scale (DASS-21)
The short version of 21 items adapted to Spanish by Bados et al. (2005) was used, where it showed adequate reliability and validity indexes. Also, other studies have corroborated the existence of a model of three related factors (Patias et al., 2016; Wang et al., 2016). The scale has three dimensions that evaluate the presence and intensity of the negative emotional states of depression, anxiety and stress. In addition, each dimension is made up of 7 items which have four categories of response ranging from: “Does not apply to me” (0) to “Applies a lot or most of the time” (3). The present study also evaluated its psychometric properties, where it showed adequate reliability indices for the depression (α = . 93; ω = .91), anxiety (α = . 91; ω = .88) and stress components (α = . 89; ω = .87). In addition, it showed that the model of three related factors presented adequate indexes of adjustment (CFI = .98; TLI = .98; RMSEA = .067, SRMR = .043).
Diener's satisfaction with life scale (SWLS)
The short version of five items was used for the study, adapted to Spanish by Atienza et al. (2000) where it showed adequate reliability (α = .84) and validity indexes based on the internal structure (GFI = .98; NFI = .99; NNFI = .99; RMR = .02). Also, different studies in Latin America evaluated the metric quality of the instrument in university students, evidencing the existence of a unifactorial model (Oliver et al., 2018; Padrós et al., 2015). Regarding the structure of the scale, the five items have five response categories ranging from: “Strongly disagree” (1) to “Strongly agree” (5), where a higher score on the scale evidences greater satisfaction with life. In the present study, it showed adequate indices of reliability (α = . 90; ω = 91) and validity based on internal structure (CFI = .99; TLI = .99; RMSEA = .088; SRMR = .018).
Procedure and statistical analysis
The study was approved by an ethics committee of the Center for Health Research and Innovation (CIISA) of the Faculty of Health Sciences at a private university in Lima, Peru and following the rules of the Declaration of Helsinki (World Medical Association, 2013) did not represent a risk for participants. A cross-sectional design was used for data collection and the instruments were applied collectively in the classrooms. In each case, three fourth-year psychology students were trained in data collection before applying the instruments. During the application process, anonymity and confidentiality of the results were ensured, where the university students signed an informed consent, the objectives of the study were explained and doubts regarding the procedure were resolved. The average time for answering the instruments was 20 minutes.
The process followed to study the psychometric properties of the scale is made up of three stages: (a) content-based validity, (b) study of method effect, and (c) confirmation of psychometric properties (see Figure 1).

Stages of the EROS scale adaptation process.
Content based validity
For version A of the scale, five judges participated: four psychologists with the academic degree of Master in Psychology and one Doctor in Psychology. Similarly, for version B, five judges participated: four psychologists with the academic degree of Master in Psychology and one Doctor in Psychology. All the judges had at least 15 years of professional experience. To evaluate the structure and content of the items, all the judges used four criteria: (a) relevance, (b) representativeness, (c) clarity, and (d) context of the items. Aiken's V coefficient (Aiken, 1980) was used for its quantification and an ad hoc program in MS Excel© format (Ventura-León, 2019) was used for its calculation. Then thirteen psychology students in their last year of studies evaluated the clarity of the items in both versions (A and B).
Study on the method’s effect
As shown in Figure 2, four models were proposed, the A1 model maintains the original approach with positive and negative items, the A2 model adds a specific factor for negative items and the A3 model adds a specific factor for positive items. A B model of the scale was also tested, where the 10 items are all written in a positive way.

Models of the A and B versions of the scale.
The Diagonally Weighted Least Squares with Mean and Variance corrected (WLSMV) estimator was used to evaluate these models since the items are all ordinal (Brown, 2015). The chi-square test (χ2), the RMSEA (Root Mean Square Error of Approximation) and the SRMR (Standardized Root Mean Square Residual) were used to evaluate model fit, in which case values less than .05 indicate good fit, and between .05 and .08 are considered acceptable (Kline, 2015). In addition, the CFI (Comparative Fit Index), TLI (Tucker-Lewis Index) was used for these cases, values higher than .95 indicate a good fit and higher than .90 an acceptable fit (Schumacker & Lomax, 2015). The WRMR (Weighted Root Mean Square Residual) index was also used where values below 1.0 are adequate (DiStefano et al., 2018). For bi-factor models, the hierarchical omega coefficient (ωh) and the total omega (ωt) were used to calculate reliability (Zinbarg et al., 2005). For the one-dimensional model, the omega coefficient was used (McDonald, 1999). All statistical analyses were performed with the “lavaan” package (Rosseel, 2012) using the RStudio environment (RStudio Team, 2018) for R (R Core Team, 2019).
Confirmation of psychometric properties
For the descriptive analyses of the items (mean [M], standard deviation [SD], asymmetry [g1] and kurtosis [g2]) the program SPSS 22.0 for Windows was used. For Confirmatory Factor Analysis (CFA) the package “lavaan” was used (Rosseel, 2012), for factor invariance models of the scale the package “semTools” was used (Jorgensen et al., 2018) and for evaluating test-retest reliability the package “irr” was used (Gamer et al., 2019). In all cases the RStudio environment (RStudio Team, 2018) was used for R (R Core Team, 2019).
As part of the confirmatory factor analysis, the WLSMV estimator (Weighted Least Squares with Mean and Variance corrected) was used and the same adjustment indicators made in the pilot test were taken into account. In addition, to evaluate the relevance of the modification indexes (MI) in the model, the Saris et al. (2009) method was used, where “M” represents that the parameter is wrongly specified, “NM” represents that the parameter is not wrongly specified, “EPC: M” represents a misspecification using the expected change in the parameter and “EPC: NM” represents that there is no misspecification using the expected change in the parameter.
To evaluate the internal consistency of the scale, Cronbach's alpha coefficient (Cronbach, 1951) and omega coefficient (McDonald, 1999) were used, where a value of ω > .80 is adequate (Raykov & Hancock, 2005). The H coefficient was also used (Mueller & Hancock, 2001) because it is robust for correlated errors. A value greater than .70 is acceptable (Geldhof et al., 2014). In addition, to evaluate the test-retest reliability of the scale, the Intraclass Correlation Coefficient (ICC) was used, for which a mixed effects bidirectional model (ICC3) was used, for single measurement and the type of relationship was in absolute agreement (Koo & Li, 2016). A value greater than .60 is considered acceptable (Fleiss et al., 2013). Finally, in order to evaluate the invariance of the scale according to sex and time invariance, a sequence of hierarchical variance models was proposed, which were increasingly restrictive. To this end, first the configural invariance (reference model) was tested, followed by the metric invariance (equality of factorial loads), the scalar invariance (equality of factorial loads and intercepts) and finally the strict invariance was tested (equality of factorial loads, intercepts and residuals). Two strategies were used to compare the sequence of models: first a formal statistical test was used, for which the chi-square difference (Δχ2) was used where non-significant values (p > .05) suggest invariance between groups. Second, a modeling strategy was employed, using differences in the CFI (ΔCFI) where values less than <.010 evidence model invariance between groups (Chen, 2007).
Finally, to evaluate the relationship of the EROS scale with other variables, a structural equation model was proposed, where the degree of reward provided by the environment (EROS) is related to the level of stress, anxiety, depression and satisfaction with life. To estimate the model, the WLSMV estimator (Weighted Least Squares with Mean and Variance corrected) was used and the same adjustment indicators made in the confirmatory factor analysis were taken into account.
Results
Content based validity
Table 1 shows the modifications made following the suggestions of the judges and students in the items of version A and version B. In item 2 the expression “experiencias que vivo” (“experiences I live”) was used in both versions and in version B the item was written as a positive. In item 4, the expression “encontrar motivos” (“find reasons”) was added in both versions. In item 5, the expression “A comparación de mi” (“Compared to me”) was added at the beginning of the item and “vidas más gratificantes” (“more rewarding lives”) at the end of it for version A, in version B the item was written as a positive, keeping the content of the item. In item 6, the wording was kept in version A and in version B it was written as a positive. In item 7, the term “aficiones” (“hobbies”) was changed to “actividades” (“activities”) in both versions, and in version B the item was written as a positive. In item 9, the wording in version A was kept and in version B it was written as a positive. Finally, in item 10 the expression “actividades que realizo” (“activities I carry out”) was added in both versions.
Content validity of both scale versions.
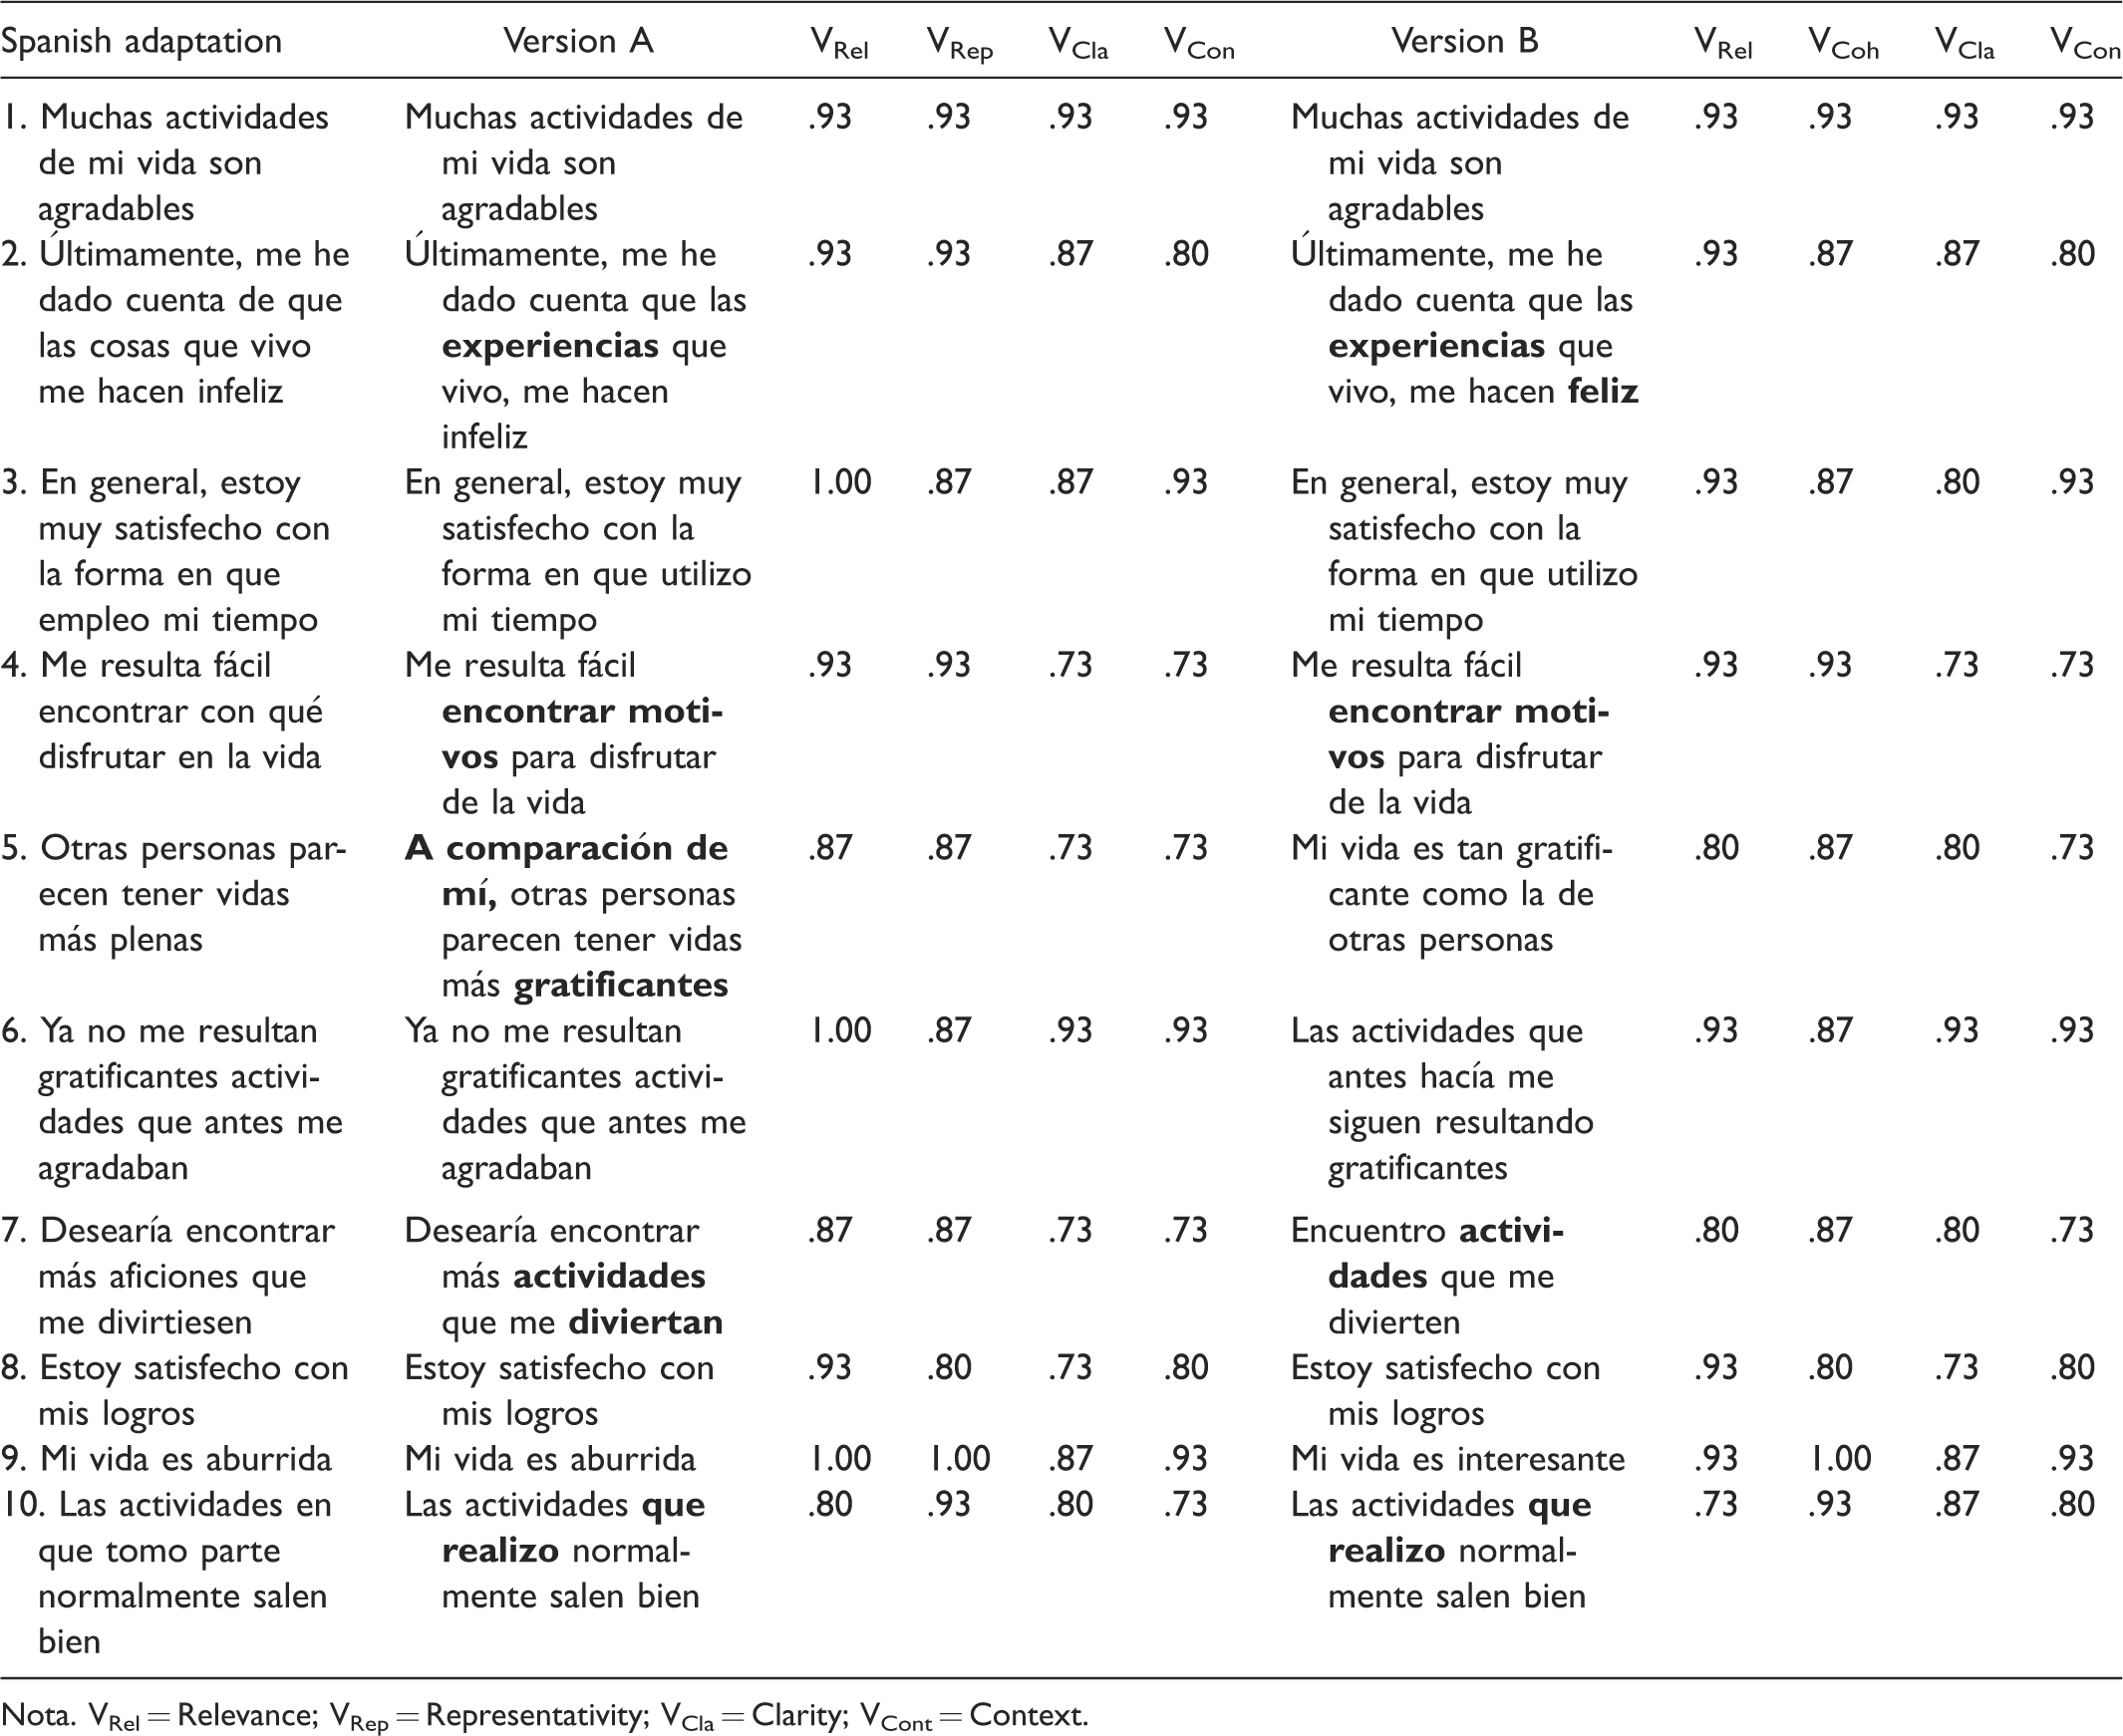
Nota. VRel = Relevance; VRep = Representativity; VCla = Clarity; VCont = Context.
Study on the method’s effect
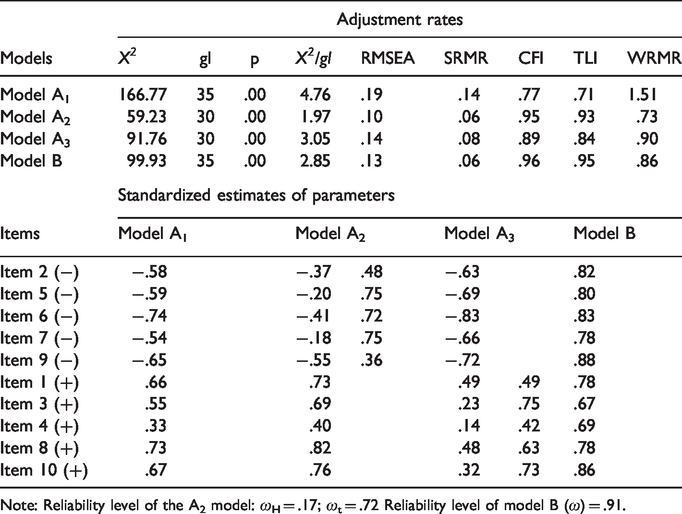
Table 2 shows that the one-dimensional structure in the A1 model presents inadequate indexes of adjustment to the data (RMSEA = .19; CFI = .77; TLI = .71; WRMR = 1.51), where negative loads associated with the inverse items are observed. On the other hand, the A2 model, where a specific factor was added for negative items, presents better adjustment indexes (RMSEA = .10; CFI = .95; TLI = .93; WRMR = .73). In addition, it can be seen that the reliability of the A2 model, considering only the general factor as true variance, presents a very low level (ωH = .17). On the other hand, when the specific factor is included as part of the true variance, the reliability of the model increases notably (ωt = .72). This change could be attributed to the method’s effect associated with the negative items. Following this line of thinking, the A3 model was evaluated, where a specific factor was added for the positive items. As shown in Table 2, this model does not present adequate indexes of adjustment to the data (RMSEA = .14; CFI = .89; TLI = .84; WRMR = .90), evidencing that the presence of positive items in the scale does not impact the model's adjustment. These results show that there is a methodological effect associated with the presence of negative items in the scale.
Comparison of adjustment indicators of both scale versions.
Note: Reliability level of the A2 model: ωH = .17; ωt = .72 Reliability level of model B (ω) = .91.
In light of this, a B model was proposed, where all the items are written in positive way. As shown in Table 2, this model has adequate adjustment indexes (RMSEA = .13; CFI = .96; TLI = .95; WRMR = .86) and has a high level of reliability (ω = .91) which is higher than the A2 model. It is also noteworthy that the items in model B show a higher factorial weight than in the other models. Taking into account these findings, the B model was chosen for the final version in the process of adaptation of the scale.
Confirmation of psychometric properties
Descriptive analysis of the scale items
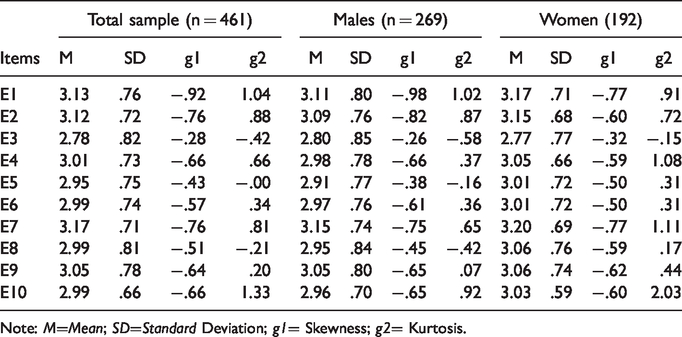
Table 3 shows that item 7 has the highest average score in the total sample (M = 3.17) and similarly in the group of men (M = 3.15) and women (M = 3.20). It is also observed that item 3 presents the lowest average score in the total sample (M = 2.78) and in the different groups of men (M = 2.80) and women (M = 2.77). In addition, it can be seen that the items present adequate indices of asymmetry and kurtosis (±1.5) in the total sample and in all the specific groups.
Descriptive analysis of the items.
Note: M=Mean; SD=Standard Deviation; g1= Skewness; g2= Kurtosis.
Validity based on internal structure
It can be seen in Table 4 that the proposed one-dimensional model presents adequate adjustment indexes (CFI = .98; TLI = .98; RMSEA = .075). It can also be seen that the factorial weight of the latent variable with each one of its observed variables is high and significant (see Figure 3). Furthermore, following Saris et al. (2009) method to evaluate the relevance of the modification indexes (MI) in the model and according to the item content analysis, a correlation was specified between the errors of items 1 and 2 (.34), 4 and 6 (.25), and 9 and 10 (.33).
One-dimensional model fit rates and invariance models by sex.

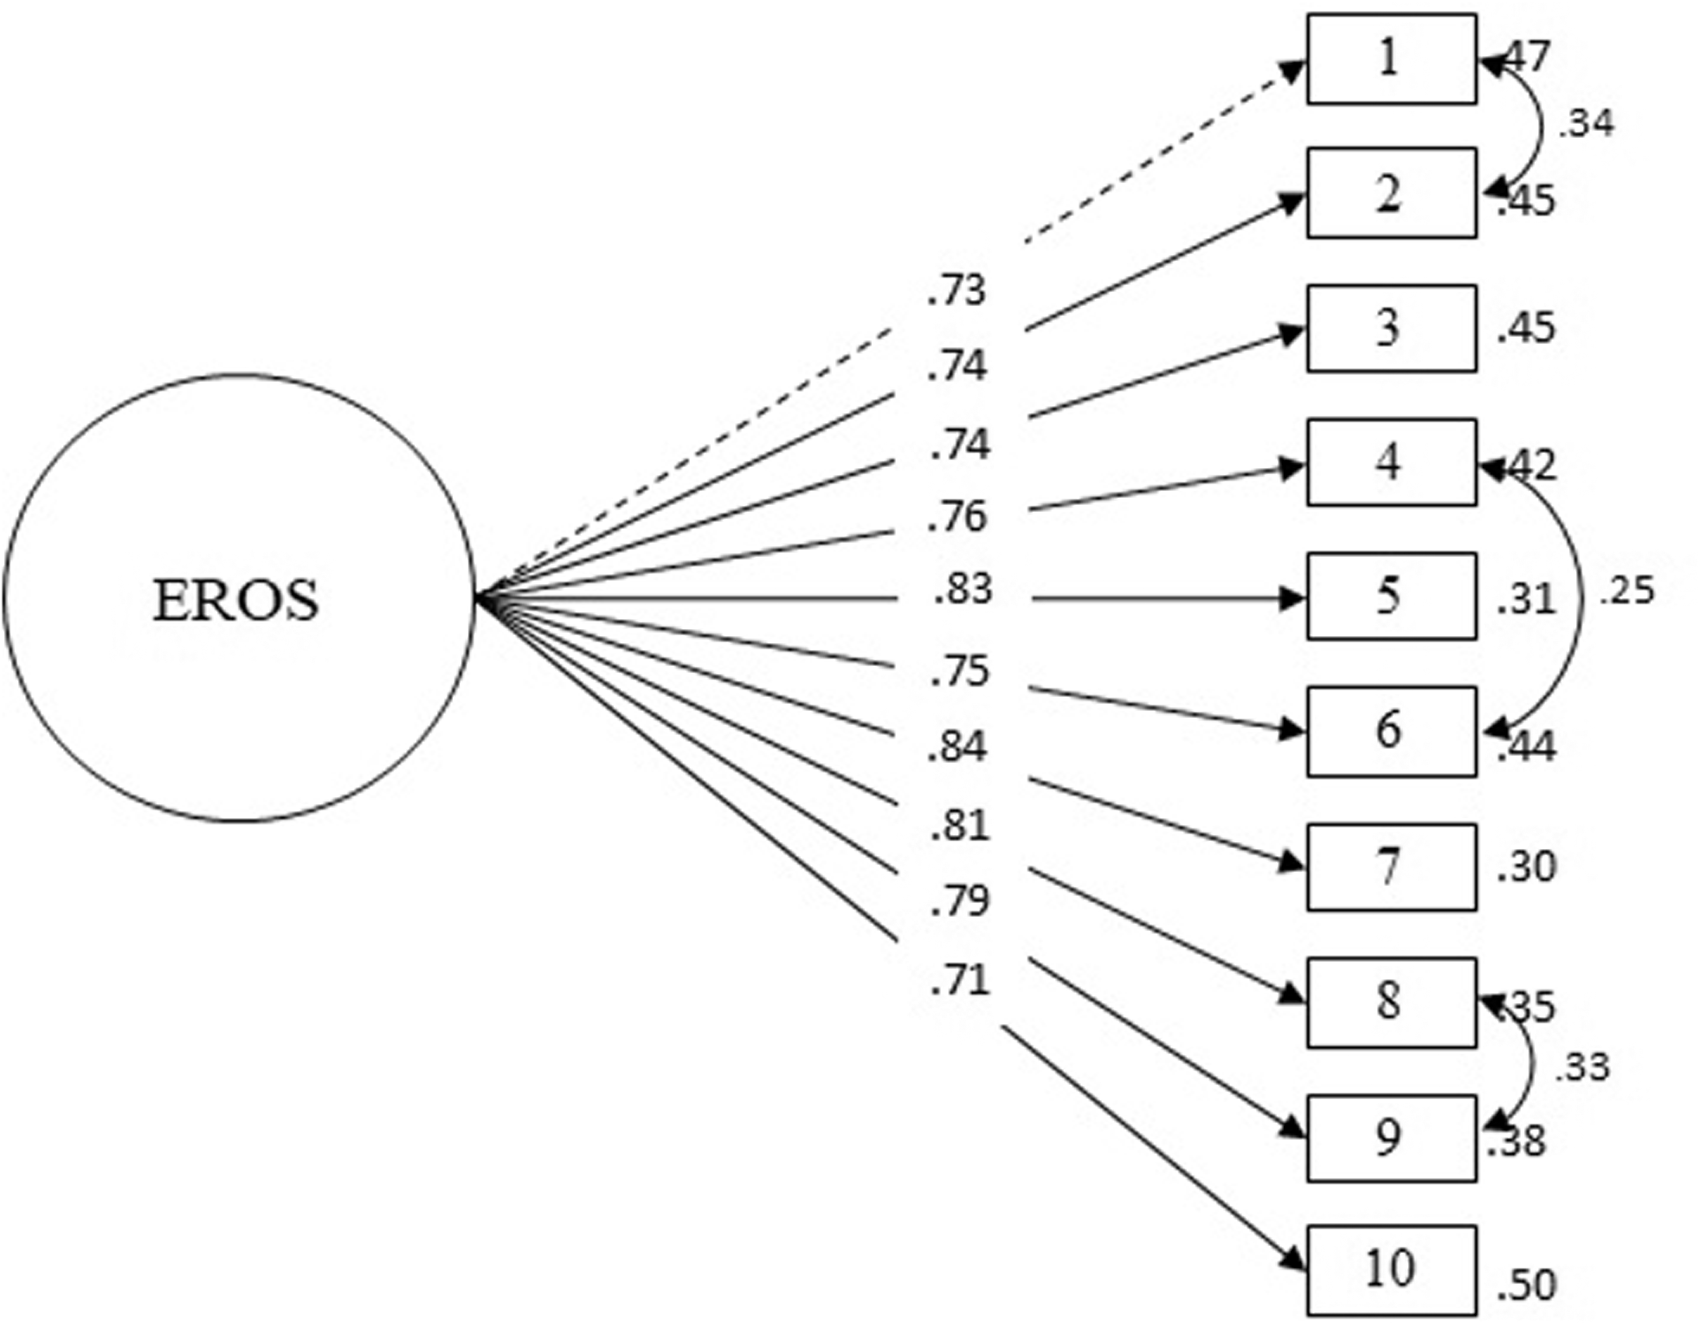
Confirmatory factor analysis of the scale.
Factorial invariance according to sex and time invariance of the scale
Table 4 shows the adjustment indexes for the sequence of invariance models proposed and its difference with the least restrictive model in the sequence.
Regarding factor invariance by sex, the configural model was evaluated first, which fit the data well (TLI = .98; CFI = .98; RMSEA = .085; SRMR = .039) and can therefore be used as a reference model for the evaluation of the following models. Next, the metric invariance was evaluated, where it can be seen that only the RMSEA index improved slightly (TLI = .98; CFI = .98; RMSEA = .077; SRMR = .039). Also, it can be seen that the differences in chi-square were statistically not significant (Δχ2 = 7.17; p > .05) and there were no important changes when comparing both models (ΔCFI = .001). Therefore, the metric invariance of the scale is affirmed. After evaluating the scalar invariance, where only the RMSEA index improved again (TLI = .98; CFI = .98; RMSEA = .061; SRMR = .039), no significant differences were observed between the two models (Δχ2 = 13.36; p > .05) and no important changes are seen in regards to the metric model either (ΔCFI = .003). Finally, strict invariance was calculated, where the adjustment indices improved slightly (TLI = .99; CFI = .99; RMSEA = .049; SRMR = .039), no significant differences are observed between the two models (Δχ2 = .34; p > .05), and no important changes are seen with respect to the scalar model (ΔCFI = .003). Therefore, the scale has proven to be strictly invariant for both groups (men and women). Similarly, the scale also showed evidence of being invariant over time, in the invariance models proposed: metric (ΔCFI = .007), scalar (ΔCFI = .003) and strict invariance (ΔCFI = .004).
Scale reliability
The scale evidences adequate levels of reliability since it presents a high omega coefficient (ω = .93 [IC95% = .92–.94]), a Cronbach’s alpha coefficient that can be considered excellent (α = .93 [IC95% = .92–.94]) and an adequate H coefficient (.94). Furthermore, the ICC for test-retest reliability was adequate (.70 [CI95% .593–.788]).
Validity based on relationship to other variables
Based on the literature review, a SEM model was proposed to evaluate the latent relationship between the EROS scale and the levels of stress, anxiety, depression and life satisfaction. As shown in Table 5, the structural model presents adequate adjustment indexes (RMSEA = .03; CFI = .96; TLI = .96) and the measurement models are adequately represented by their items.
Explanatory model.

Note: λ: Factorial load.
Figure 4 shows that the degree of reward provided by the environment is negatively related to the level of depression (.34; p < .01), anxiety (.22; p < .01) and stress (.21; p < .01). Furthermore, it has a positive relationship with the degree of satisfaction with life (.51; p < .01). Taking into account these results, it can be concluded that the scale presents validity related to other constructs.
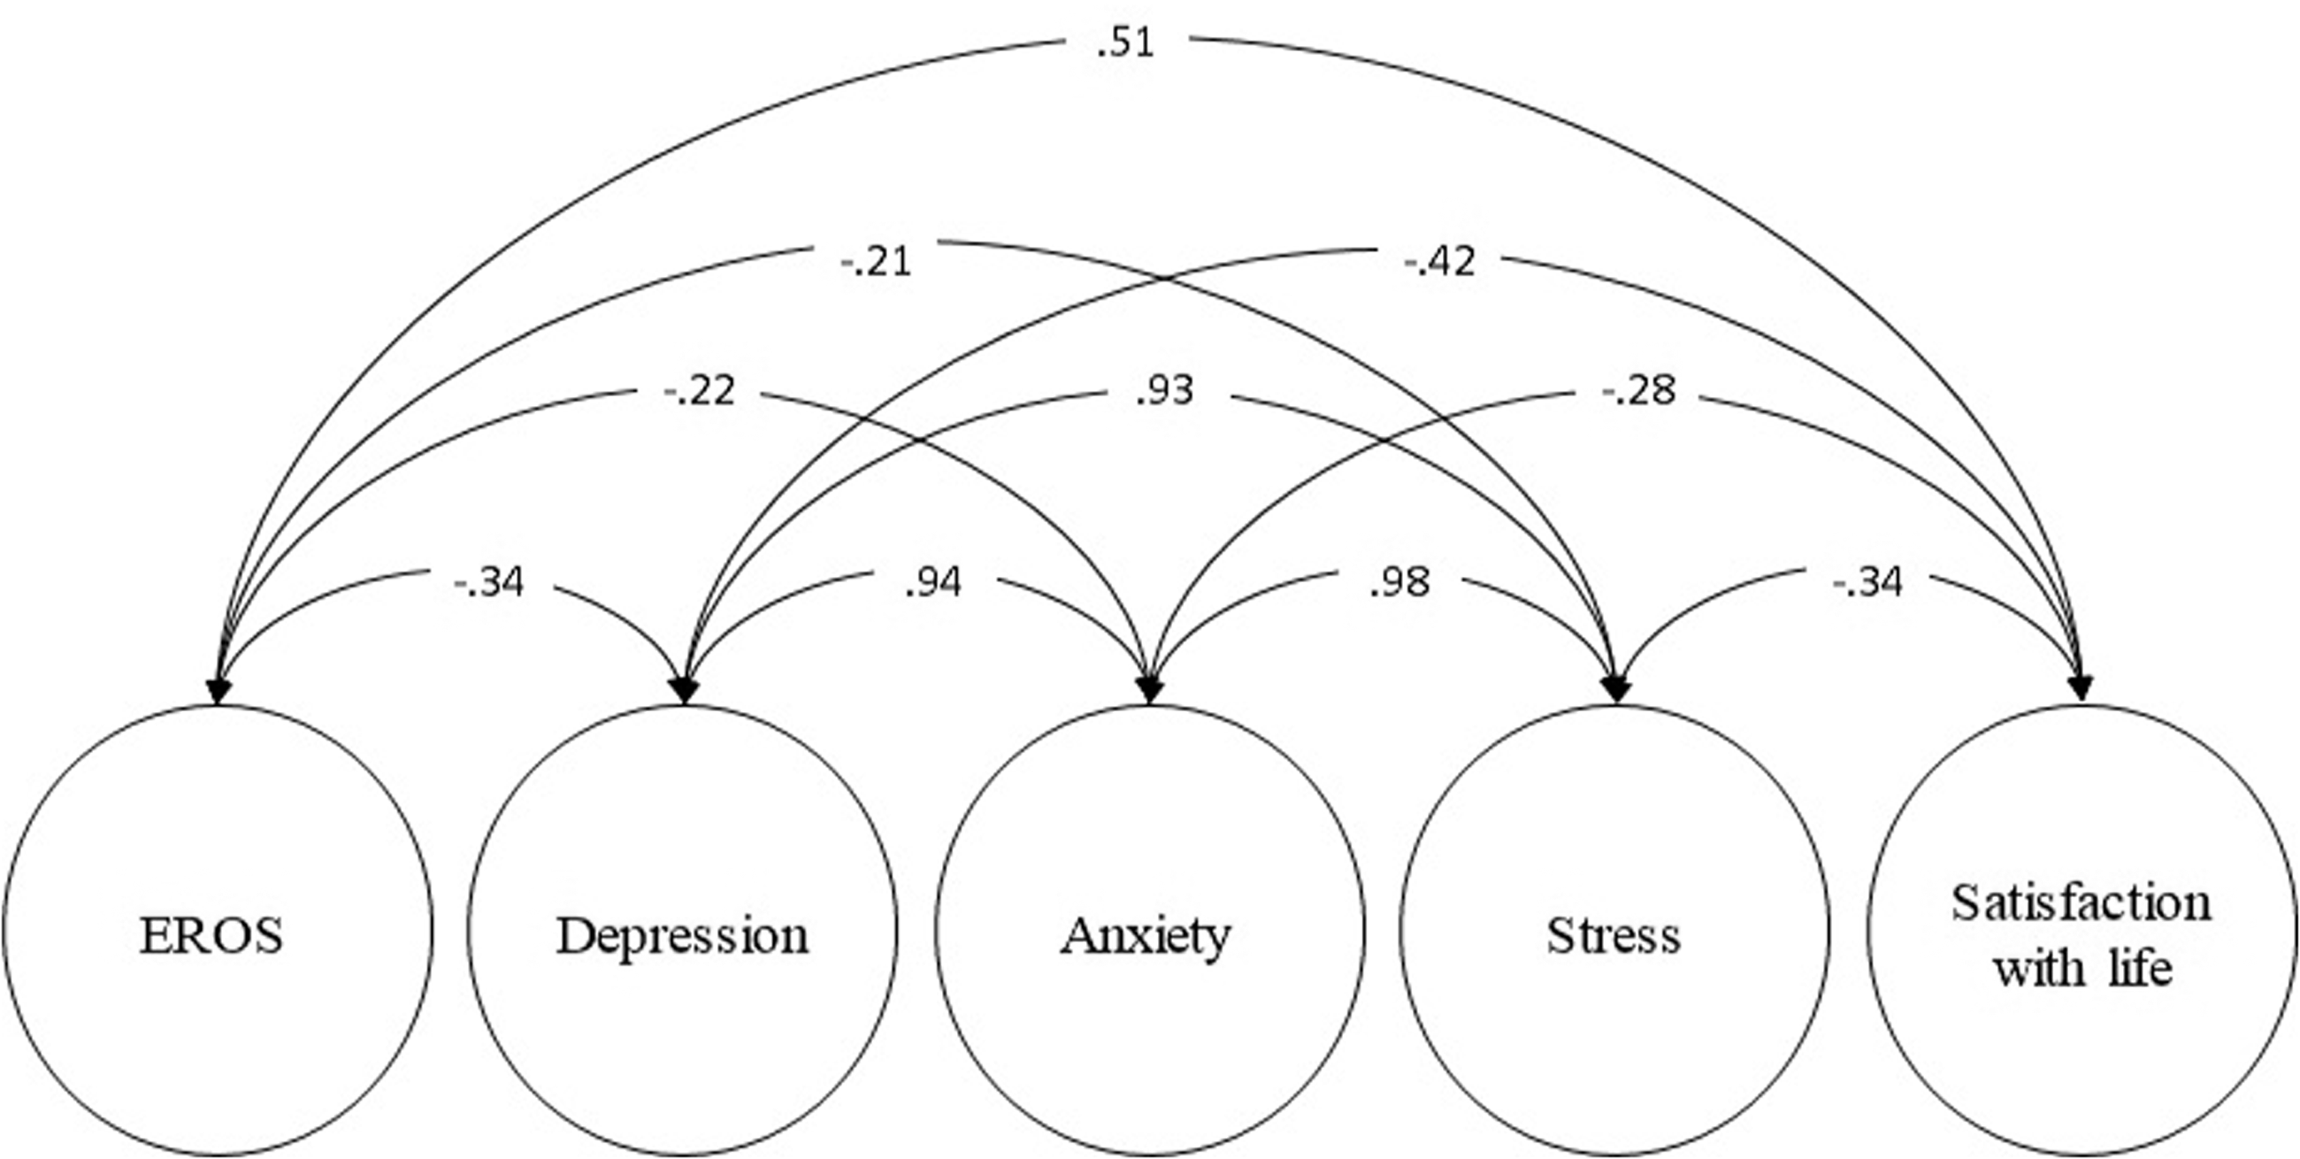
Model of latent relationships.
Discussion
The aim of this study was to adapt and evaluate the psychometric properties of the Spanish version of the EROS scale in Peruvian university students, because it is one of the most used instruments in the framework of behavioral activation (BA) as a treatment for depression (Barth et al., 2013; Richards et al., 2016) and other mental health problems (Fernández & Mairal, 2017; Hirayama et al., 2019).
In the initial sample, four models were tested, three models (A1, A2, A3) that maintain the original approach of positive and negative items; and a B model where all items were written in a positive way. It was found that the original A1 model presents inadequate adjustment indexes (RMSEA = .19; CFI = .77; TLI = .71; WRMR = 1.51), although this result does not coincide with what was found in the original study by Armento and Hopko (2007) where they evidenced that the one-dimensional model did present adequate adjustment indexes (RMSEA = .06; GFI = .92; NFI = .90) and neither does it coincide with the psychometric study carried out in France (Wagener & Blairy, 2015) where it also showed adequate fit indexes (RMSEA = .06; GFI = .99; NFI = .99).
This difference in model fit could be attributed to cultural differences between countries. People living in highly individualistic countries prioritize autonomy and self-realization while people living in less individualistic countries prioritize social interaction and cohesion (Hofstede et al., 2010). In addition, less individualistic countries show greater empathic concern, kindness, life satisfaction, pro-social behavior (Chopik et al., 2017) and lower levels of loneliness (Heu et al., 2019). All of this can influence the way in which people perceive and value the degree of reward that their environment provides; that is, the cultural aspect can condition the response to the items and affect the factor structure of the scale between countries with marked individualism, such as the United States (IC = 91) and France (IC = 71) and more collectivist countries such as Peru (IC = 16). The classification of countries according to their level of individualism was based on the information provided by (Hofstede Insights, 2020).
Regarding the adaptation of the instrument in less individualistic countries such as Spain (compared with the rest of the European countries) and Latin America, it was found that in the Spanish adaptation (Barraca & Pérez-Álvarez, 2010) the Exploratory Factor Analysis (EFA), showed the possible existence of two factors, where items 5 (.31), 6 (.28), 7 (.65) and 10 (-.34) entered in both factors, most of which are written in a negative way. Similarly, in the adaptation to Colombia (Valderrama-Díaz et al., 2016) the EFA showed the existence of two factors that explained 56.9% of the accumulated variance, and again item 7 (.47) showed a high factorial weight in both factors. In another study of adaptation for women survivors of breast cancer in Spain (Fernández-Rodríguez et al., 2020), the one-dimensional model presented adjustment problems (RMSEA = .116) and the values of the Unidimensional Congruence (UniCo = .89) and Explained Common Variance (ECV = .81) did not support the presence of a one-dimensional model in the data (UniCo > .95; ECV > .85).
These adjustment problems observed in the present and previous studies could be due to the method’s effect caused by the presence of inverse items, since these can form additional factors not associated with the construct (Brown, 2015; Tomás et al., 2013; Zhang et al., 2016). Taking this into account, the A2 model was tested where a second specific factor was added only for negative items (2, 5, 6, 7 and 9). This model improved the fit indexes (RMSEA = .10; CFI = .95; TLI = .93; WRMR = .73) and the total omega coefficient drastically and showed that including the specific factor as part of the true variance notably improves the reliability of the model (ωt = .72). This was not the case in the A3 model where including a specific factor for positive items did not contribute to the fit indexes of the model (RMSEA = .14; CFI = .89; TLI = .84; WRMR = .90). So these findings confirm the existence of method bias associated with negative items.
To overcome this limitation, the B model of the scale was proposed with all positively phrased items, where the results showed adequate adjustment indexes in their majority (RMSEA = .13; CFI = .96; TLI = .95; WRMR = .86) and a better level of reliability (ω = .91) than the previous models. In addition, the items in model B show a higher factorial weight than in the other models.
In the large sample, the B model of the EROS scale continued to show adequate adjustment indicators (RMSEA = .07; SRMR = .02; CFI = .98; TLI = .98; WRMR = .78) and all items showed a high factorial weight (λ>.70) evidencing that negative items transformed to positive continue to adequately measure the degree of reward provided by the environment. However, some correlated errors were found, which can be attributed to similar conceptual content among the items (Brown, 2015). In addition, the analysis of the modification indexes (MI) following the method of Saris et al. (2009) showed that it is pertinent to include these correlated errors in the model.
Regarding items 1 (“Many activities in my life are pleasant”) and 2 (“Lately, I have realized that the experiences I live, make me happy”), both items refer to activities or experiences that produce some degree of satisfaction. In the case of item 4 (“I find it easy to find reasons to enjoy life”) and item 6 (“The activities I used to do are still rewarding”), both items refer to some degree of satisfaction with life. Finally, items 8 (“I am satisfied with my achievements”) and 9 (“My life is interesting”) have in common that both refer to a positive affectivity of their personal experience.
Furthermore, these results constitute the first empirical evidence of the existence of a one-dimensional model for this scale in Spanish for university students, since in previous studies (Barraca & Pérez-Álvarez, 2010; Valderrama-Díaz et al., 2016) only exploratory analyses were carried out, where the existence of a one-dimensional model was not clear. It is important to note that no other psychometric studies of the scale have been found in Latin America or in other countries of the world besides the United States, France and Spain.
Regarding the reliability of the scale, the α coefficient shows an excellent level of reliability (α = .93) which is similar to that found in previous studies, where they also used the same coefficient (Armento & Hopko, 2007; Barraca & Pérez-Álvarez, 2010; Fernández-Rodríguez et al., 2020; Valderrama-Díaz et al., 2016; Wagener & Blairy, 2015) although this indicator can lead to biased estimates of reliability since it is difficult to guarantee the tau-equivalence of items and it is sensitive to the presence of correlated errors in the model (Dunn et al., 2014; Yang & Green, 2010). Furthermore, its use is not recommended for ordinal items (Elosua & Zumbo, 2008) . Therefore, to overcome these limitations, the omega coefficient (ω = .91) was used, which showed adequate reliability indices. The H coefficient was also used since it is robust regarding the presence of correlated errors (Dominguez-Lara, 2016). In this indicator the scale also showed an adequate level of reliability (.94). In addition, the test-retest method shows evidence that the scale scores are reliable over time (ICC = .60). This result allows for the objective contrast of a participant’s changes through time and presents objective data on the effectiveness of the therapy. All the coefficients used show an adequate level of reliability, thus ensuring less measurement error and greater accuracy of the scores obtained. These results also constitute the first empirical evidence on the reliability of the scale, through other indicators more robust than the traditional Cronbach’s α.
Additionally, the sequence of hierarchical variance models proposed in the invariance study show that the scale can be considered invariant according to sex and over time, for this purpose the ΔCFI index was used as the main criterion since ΔRMSEA can be affected by the sample size (Chen, 2007). This allows for the comparison of the scores between men and women, as well as the changes that can occur over time, asuring that the differences found are due to differences in the actual level of the construct. These results are particularly important when evaluating the effectiveness of intervention therapies. Furthermore, it is important to note that these results constitute the first empirical evidence on factorial invariance of the scale.
Regarding the validity in relation to other variables, it was found that the degree of reward provided by the environment is positively related to the degree of satisfaction with life (ρ = .51; p < .01). This result is coherent since if people positively value each aspect of their lives then that would allow them to feel reinforced by their environment. In addition, it was found that the EROS scale has a negative relationship with the level of depression (ρ = −.34; p < .01), anxiety (ρ = −.22; p < .01) and stress (ρ = −.21; p < .01). This relationship can be explained because depressive symptoms are strongly associated with reduced availability and sensitivity to environmental reward (Eshel & Roiser, 2010; Huys et al., 2013; Safra et al., 2019). Similarly, escape and avoidance behaviors associated with anxiety and stress reduce a person's exposure to sources of environmental reward (Grant & White, 2016; Harlé et al., 2017).
Regarding the limitations of the study, a non-probabilistic sampling was used for convenience which limits the generalization of the results. The metric quality of the scale was not evaluated in a clinical sample. Despite these limitations, the results of the study are important not only for psychometric research but also for therapies based on behavioral activation.
In conclusion, this study represents a significant contribution to measurement in the context of behavioral activation therapy as it will facilitate a rapid and efficient assessment of the degree of environmental reward perceived by the person, thus allowing for a systematic monitoring of progress in therapy. In addition, psychometric evidence has been shown for the existence of a method’s effect regarding negative items in the adaptations to Spanish. Finally, the results of the study provide a statistical and methodological basis for the development of the EROS scale in future psychometric studies. Further studies could use the scale to evaluate the effectiveness of therapy in different mental health problems.
Footnotes
Article Notes
Declaration of Conflicting Interests
The author(s) declare(s) that there is no conflict of interest with respect to the research, authorship, and/or publication of this article.
Funding
The author(s) received no financial support for the research, authorship, and/or publication of this article.
