
Abstract
The Proactive Personality Scale (PPS) is used widely to measure proactive personality. Previous research has evaluated the psychometric properties of the 6-item PPS (hereafter called PPS-6) using classical test theory. There is a need to provide further validity evidence for the PPS-6 using modern test theory. This study evaluated the psychometric properties of the PPS-6 using Rasch analysis. A total of 429 participants completed the PPS-6. Rasch rating scale model (RSM) was used to analyse the data. RSM showed that the PPS-6 fitted the Rasch model well. RSM demonstrated that the PPS-6 functioned as a unidimensional measure with good internal consistency reliability. Items on the PPS-6 did not show any noticeable differential item functioning across gender. RSM showed that the response rating scale of the PPS-6 is suitable. Results suggest that the PPS-6 is a reliable measure for the assessment of proactive personality.
Introduction
Developed to assess a person’s proactive disposition, the Proactive Personality Scale (PPS) is widely used in industrial and organisational psychology research (see Gerhardt, 2009; Li et al., 2010). The PPS was developed by Bateman and Crant (1993) and Seibert et al. (1999) in response to the growing recognition that understanding the antecedents of proactive behaviour in various work domains would require a self-report measure that could assess an individual’s proactive tendency. Proactive personality is defined as a dispositional tendency that is relatively unconstrained by situational forces and is held to be relatively stable over time (Crant & Bateman, 2000; Parker & Bindl, 2016; Seibert et al., 2001). Recent meta analytic work demonstrated that more than 50% of variance in proactive personality is unrelated to the Big Five personality traits (also known as the five-factor model; Gerber et al., 2011; Gosling et al., 2003; McCrae & Costa, 2008, 2013), suggesting its uniqueness (Spitzmuller et al., 2015). Considered a trait, proactive personality is enduring and relatively stable (Seibert et al., 1999). Previous research has evaluated the psychometric properties of the 6-item PPS using classical test theory (CCT; Claes et al., 2005). Despite the promising results reported for the scale using the traditional CTT, there is a need to provide further validity evidence for the 6-item PPS using modern test theory. This accumulated evidence would clarify the factor structure of the construct and provide further support to the use of the scale’s test scores. Moreover, to date, there is no validity information on the 6-item PPS from Ghana. Gathering validity evidence for the PPS in Ghana would extend the scale to a new cultural context, as it would help to draw inferences about the proactive personality dispositions of individuals in Ghana.
Various researchers, working independently, have used various versions of the PPS, including 10-item, 6-item, 5-item, and 4-item, to assess proactive personality (see Chan, 2006; Ji et al., 2019; Liao, 2015; Pan et al., 2018; Parker, 1998; Parker & Sprigg, 1999; Parker et al., 2006; Wang et al., 2017). Claes et al. (2005) investigated the factor structure of the 10-item, 6-item, 5-item, and 4-item versions of the PPS using cross-cultural data from Finland, Belgium, and from Spain. Results from confirmatory factor analysis (CFA) concluded that, the 6-item version (hereafter called PPS-6) demonstrated the most optimal factor solution that was internally consistent across the three samples (Finland, α = .78; Belgium, α = .79; and Spain, α = .86). See also Hu et al. (2018), Li et al., (2010), and Vermooten et al. (2019).
The CTT, although useful, cannot make the PPS-6 immune from psychometric criticism because it has inherent limitations. For example, the CTT cannot establish the response category functioning of the PPS (see Kean et al., 2017; Petrillo et al., 2015). Raykov and Marcoulides (2011) highlighted other limitations of CTT: An important limitation of CTT is that it does not place routinely in the center of its concerns how individuals at different levels of the construct studied (ability, trait, attribute) perform on the components, or items, of an instrument aimed at measuring that underlying latent dimension. (p. 247)
The Rasch rating scale model
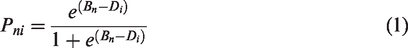
The Danish mathematician Georg Rasch (1960) introduced a logistic measurement model for tests that consist of dichotomous items. The simple logistic model states that the probability that person n would correctly answer item i,

The rating scale model is used to estimate for each item a single location parameter,
The rating scale model, like the simple logistic model, is built on the principle of specific objectivity (Andrich & Marais, 2019; Rasch, 1960). This principle holds that the comparisons of persons should be independent of particular instruments/measures. Similarly, comparisons of items should be independent of particular individuals. Rasch models may be seen as a prescription for objective measurement (Bond & Fox, 2015), which requires that the set of items should be unidimensional, pairs of items should be locally independent, the slopes of the empirical item characteristic curves should be equivalent, and the difficulty or location of items should be invariant across different classes of persons (Bond & Fox, 2015; Wright & Masters, 1982).
In the context of Rasch measurement the requirement of unidimensionality is commonly assessed by subjecting the standardised residuals of an analysis to a principal components analysis. In this respect, it is expected that there will be no structure in the residuals. Local independence is assessed by examining the correlations of pairs of standardized residuals, where it is expected that the residual correlation pairs will be close to zero. The uniformity of the slopes of the item characteristic curves (i.e. empirical item discrimination) is commonly assessed with reference to infit and outfit item fit mean square statistics, which have an expected value of 1.00 if the data fit the model. Values >1.00 indicate underfit (i.e. flatter slopes than expected), whereas values <1.00 indicate overfit (i.e. steeper slopes than expected). Infit and outfit mean squares between 0.75 and 1.30 may be considered acceptable. The mean squares can also be transformed to approximate t-values, which may be used to test the null hypothesis of perfect fit. The invariance of item locations across different classes of persons is assessed by comparing the item locations across the different classes.
An additional feature of the rating scale model is that it allows for an evaluation of the functioning of the ordered response categories. In this regard, it is expected that the category thresholds will be ordered in value in the same order as the response categories (Adams et al., 2012). Disordered thresholds may indicate that some response categories are under endorsed, which may be a problem when it is expected that the category would be endorsed more frequently. In the absence of such expectations disordered thresholds do not necessarily indicate misfit [but see Andrich (2004, 2013) for a contrary point of view]. Finally, it should be noted that Rasch models represent an ideal and that empirical data will always fail to fit the model to some degree. In this respect, the focal issue is whether the misfit is small enough to allow for useful measurement to take place rather than if the data fit the model perfectly.
Proactive personality and gender
In their meta-analytic review, Spitzmuller et al. (2015) examined gender differences in proactive personality across the 17-, 10-, and 6-item versions of the PPS. Using d statistics, they found no gender differences in proactive personality both in student and working adult samples. However, they observed small gender differences in proactive personality relative to the version of the measure used. They noted that the 17-item version was the most robust to contextual factors. This result suggests the need for a gender-invariance analysis on the PPS-6. As far as we know, no gender invariance analyses have been published on the PPS-6. Establishing that the items on the PPS-6 function invariantly across gender, would offer opportunities to meaningfully compare scores of individuals across gender groups in future research (see Davidov et al., 2014; Jones, 2019; Putnick & Bornstein, 2016).
Method
Participants
Data for the current analysis are from the School-to-Work Transition (SWoT) study. The SWoT study aims at validating selected job search and career interest measures among recent university graduates (N = 429; men = 215, women = 214; Mage = 24.11, SDage = 2.80). They were recruited at public and private organisations/institutions in the Greater Accra Region. Participants were national service personnel serving in corporate, educational, and health institutions. National Service personnel are graduates from accredited tertiary institutions in Ghana required by law to perform a one-year mandatory service to the people of Ghana in various work roles (for more information on Ghana’s National Service Scheme, see the Scheme’s website at https://nss.gov.gh). Participants were volunteers and were given detailed information pertaining to the study, including anonymity, confidentiality and the right of withdrawal. Those who expressed interest in the study were handed paper-and-pencil survey questionnaire together with informed consent to complete for immediate collection or later. The survey questionnaire was completed in the English language. In total 480 questionnaires were administered and 429 were returned indicating a response rate of 89.4%. The study protocol (ECH116/19-20) was approved by the IRB of the University of Ghana.
Measure
Proactive personality was assessed by the PPS-6 (Claes et al., 2005; Seibert et al., 1999). Participants responded to the items on a 5-point Likert-type scale: 1 = strongly disagree; 2 = disagree; 3 = neither disagree nor agree; 4 = agree; and 5 = strongly agree. Claes et al. (2005) reported Cronbach’s alpha reliability estimates of 0.78 (Finland), 0.79 (Belgium), and 0.86 (Spain) for the PPS-6.
Statistical analysis
We subjected the data to a Rasch rating scale analysis using WINSTEPS® (v4.4.2; Linacre, 2019). The analysis proceeded in a series of steps. First, we examined whether the data met the requirements of unidimensionality and local independence. Unidimensionality was assessed by subjecting the standardised residuals of the rating scale analysis to an unrotated principal components analysis (Chang et al., 2016; Khine, 2020). We expected that there would be no structure in the residuals and that the eigenvalue of the first component would be <2, which would mean that the dimension represented by the component has less strength than two items (Boone et al., 2014; Bravini et al., 2017; Linacre, 2020).
We evaluated the requirement of local independence, i.e. the assumption that items are conditionally independent of each other (Edwards et al., 2018), with reference to the correlations of the standardised residuals of pairs of items. Following Lambert et al. (2013), Røe et al. (2014), and Zhong et al. (2014), we regarded residual correlations >.30 as indicating the presence of local dependence.
Second, we assessed the functioning of the 5-point response category scale of the PPS-6 by examining the ordering of the category threshold parameters and the infit and outfit mean squares of the categories. We expected that the order of the category thresholds would correspond in value with the order of the categories on the 5-point response scale. In addition, we expected that the infit and outfit mean squares of the response categories would be <2.00 (Linacre, 2004, 2019). Third, we examined person infit and outfit mean square statistics to identify persons who responded in unexpected ways to the items. Infit and outfit mean square values <0.75 or >1.30 were considered to be overfitting or underfitting, respectively (Smith et al., 2008; Wilson, 2005).
Fourth, we examined whether the PPS-6 yielded invariant item location parameters across men and women by conducting uniform differential item functioning (DIF) tests (see Hagquist & Andrich, 2017; Henn & Morgan, 2019; Jones, 2019). We tested the difference in item locations for statistical significance by means of Bonferonni corrected (α = .05) independent groups t-tests and Mantel (1963) chi-square tests (Souza et al., 2017; Woudstra et al., 2019). In addition to the statistical tests, we regarded a difference in item locations across the groups >.50 as indicating practically DIF. Finally, we examined the reliability of the PPS-6 with reference to the Rasch person separation reliability (Wright & Masters, 1982), Cronbach’s alpha, and McDonald’s omega.
Results
Table 1 summarises the descriptive statistics of the items on the PPS-6.
Items and descriptive statistics of the PPS-6.
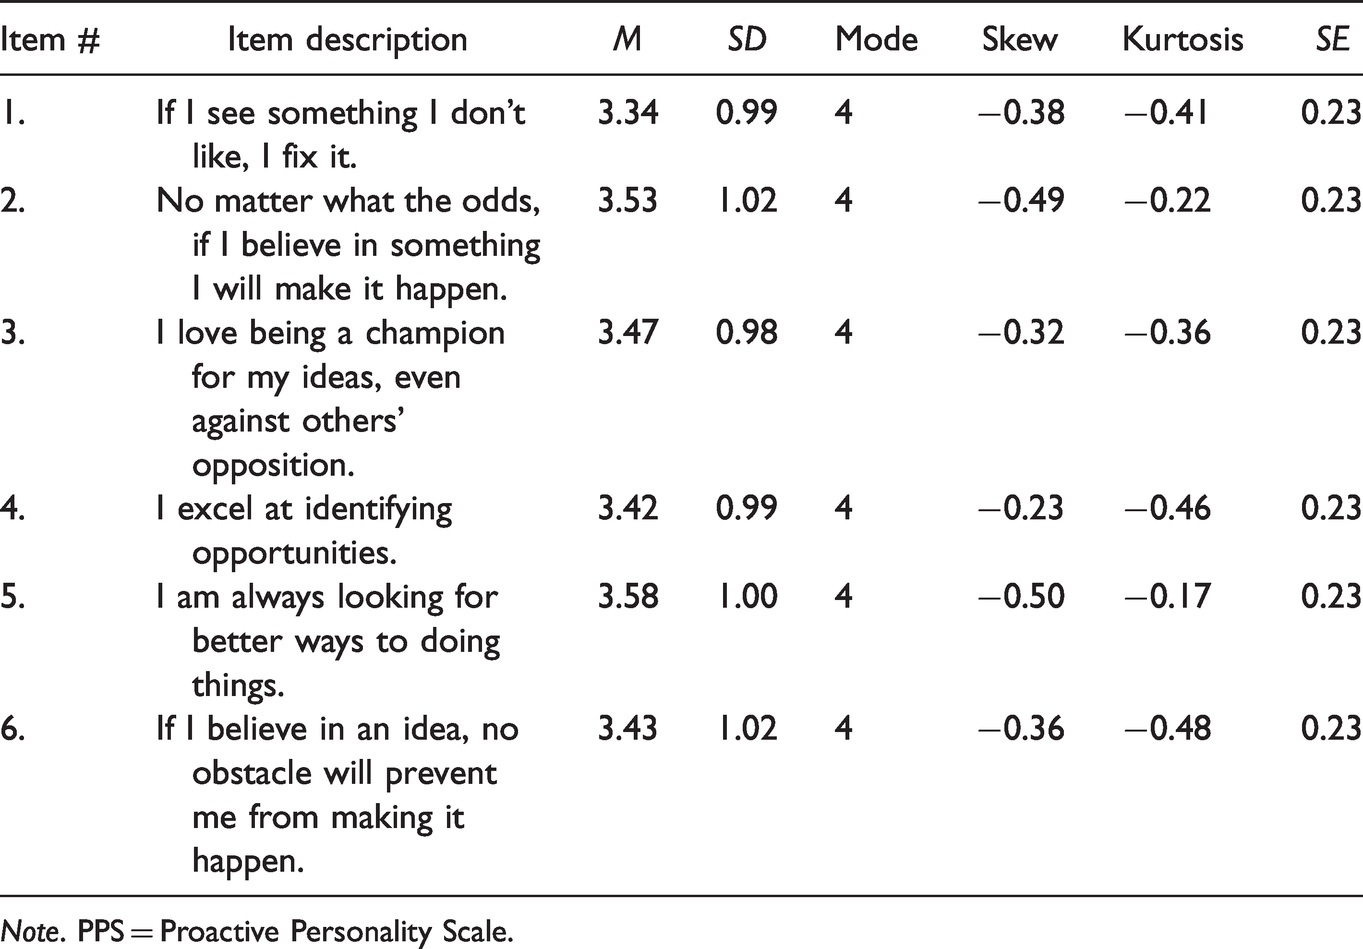
Note. PPS = Proactive Personality Scale.
Rasch analysis
We used the rating scale model to estimate person locations and item and threshold locations. These parameters were used to calculate expected scores of each person to each of the items. An unrotated principal components analysis of the standardised differences of observed and expected responses of the persons showed that the Rasch dimension explained 52.7% of the variance in the PPS-6. The eigenvalue of the first component was 1.3, which is less than the strength of two items. This indicated that the six items could be treated as if they measured a unidimensional construct. 1 Further, the item residual correlations ranged from −.13. to −.34, which evidenced that the items could be treated as locally independent.
Table 2 summarises the functioning of the 5-point ordered category response scale. Each category attracted a fair number of responses, but it is noticeable that the “strongly disagree” category was unpopular relative to the other categories. The order of the Rasch-Andrich thresholds corresponded with the order of the response categories. In addition, average person measures advanced monotonically with each successive response category, and infit and outfit mean squares of the categories ranged from .90 to 1.22. Jointly, these results show that persons used the 5-point response scale as expected.
Summary statistics of the response category functioning.
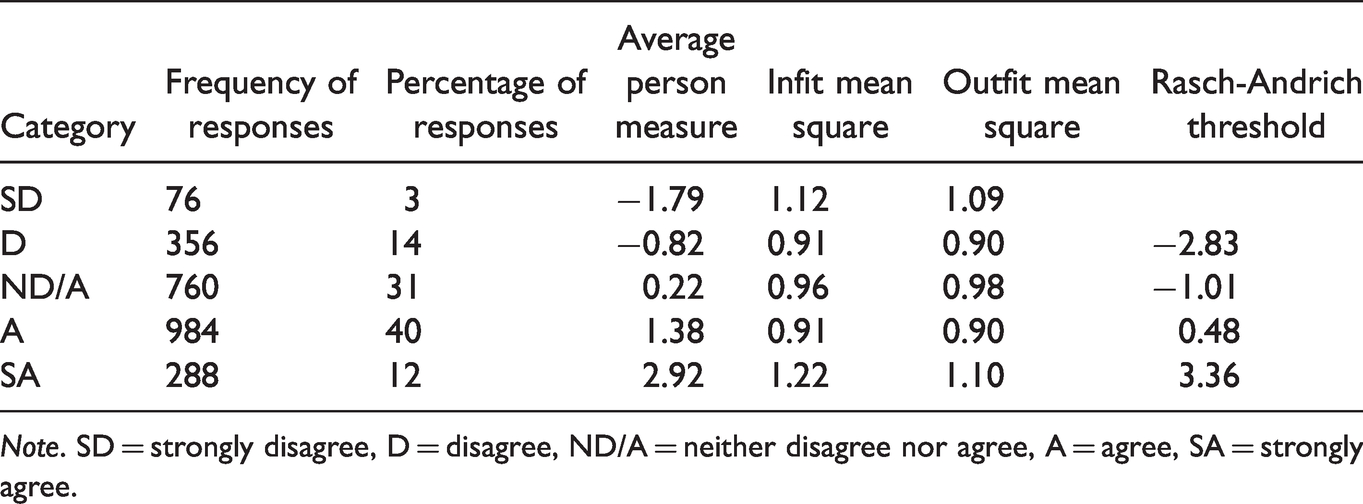
Note. SD = strongly disagree, D = disagree, ND/A = neither disagree nor agree, A = agree, SA = strongly agree.
Examination of infit and outfit mean squares of the items indicated that five items had satisfactory fit, but that item 1 evidenced underfit, with infit mean square = 1.45 and outfit mean square = 1.65. Comparison of observed person responses with model expected responses to item 1 revealed that a small number of persons (n = 16, 3.7% of the total number of participants) largely contributed to the misfit of item 1. Setting these persons aside yielded satisfactory infit and outfit mean squares for all the items, but item 1 remained the worst fitting item (see Table 3). Infit mean square values ranged from 0.88 to 1.18 and outfit mean square values ranged from 0.87 to 1.23. In addition, the item-measure correlations 2 indicated that each item related strongly to the trait that is measured by the PPS-6. Note, however, that the item-measure correlation of item 1 was clearly weaker than that of the remaining items. Figure 1 presents the empirical item characteristic curves, which link the latent trait to the expected item scores. Visual inspection shows that the slopes of the curves were essentially parallel, but that in the upper range of the trait, the curve of item 1 had a somewhat flatter slope than the remaining items.
Items, locations, item-measure correlations, and item fit statistics of the PPS-6 (N = 413).

Note. PPS = Proactive Personality Scale. Item locations are presented in descending order of item difficulty. Infit and outfit statistics are expressed as mean squares.
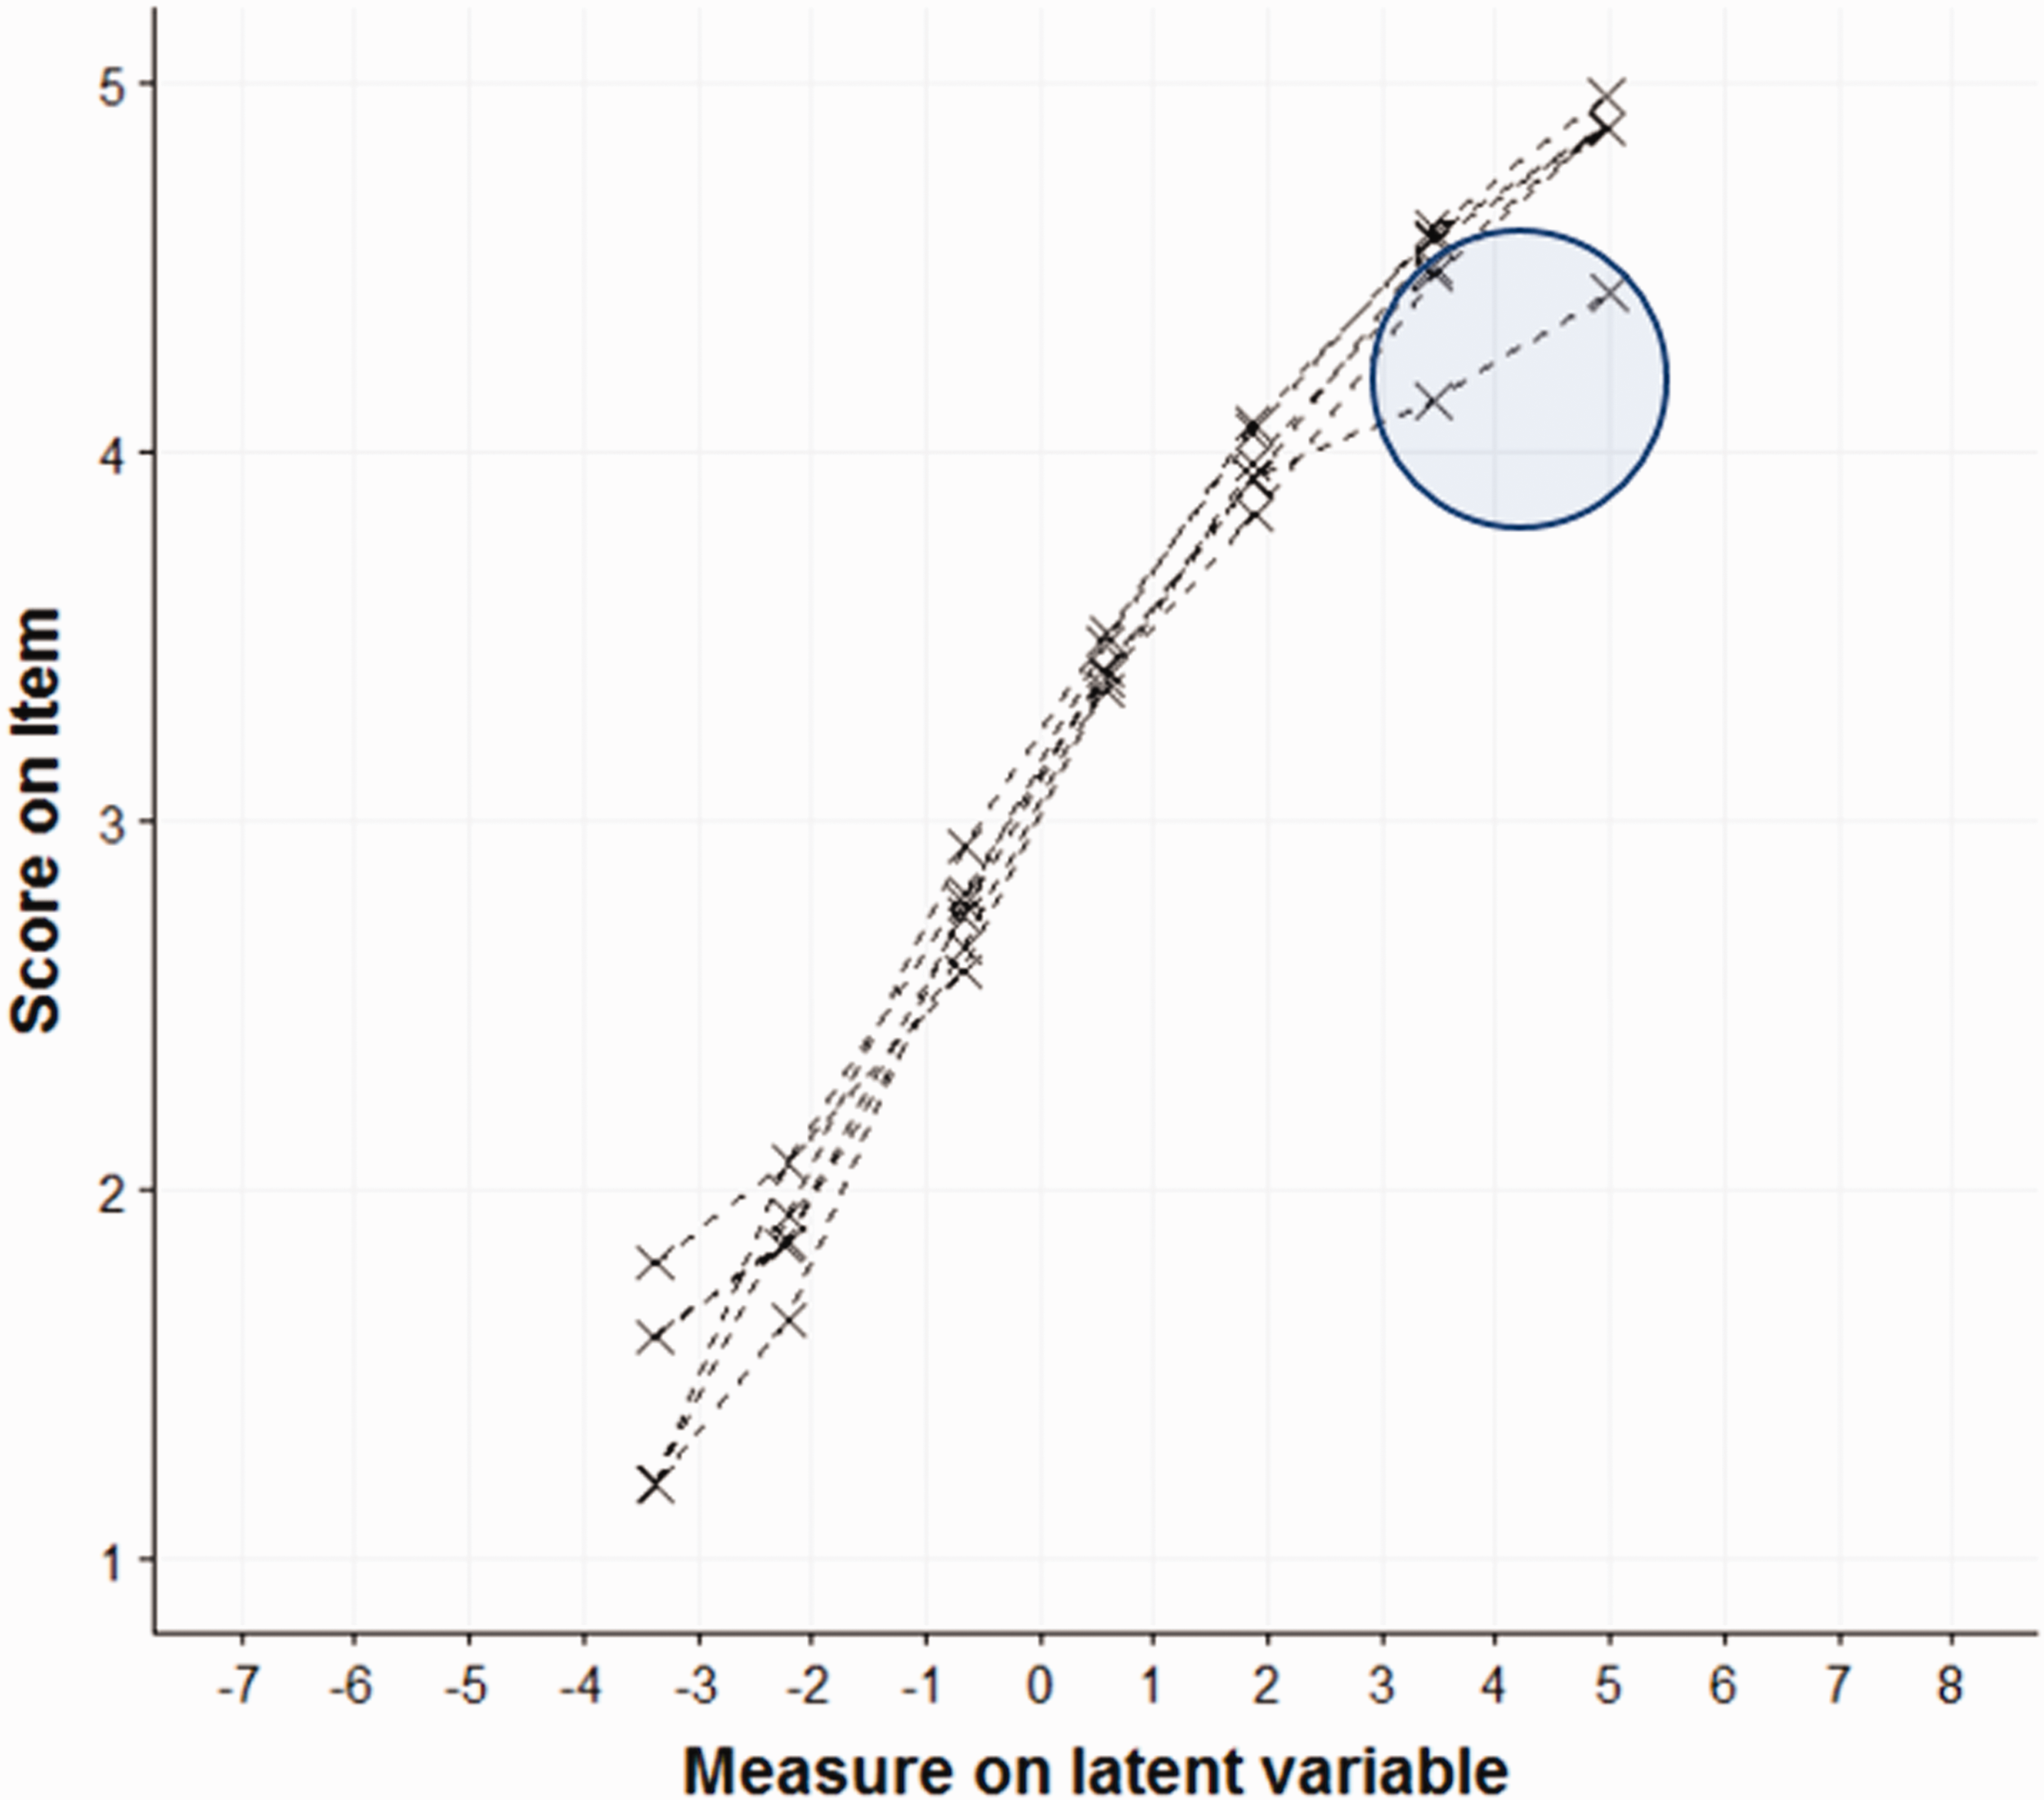
Empirical Item Characteristic Curves of the PPS-6. The transparent circle highlights the misfit of item 1 in the upper range of the latent trait.
Differential item functioning
Table 4 summarises the results of the DIF analyses. Comparison of the item locations of the men and women by means of independent groups t-tests yielded no statistically significant differences (Bonferonni corrected α = .05/6 = .008). Note, however, that if treated individually, item 6 would be seen as demonstrating uniform DIF, with women finding the item more difficult to agree with. These results were mirrored by Mantel (1963) chi-square tests. Overall, the differences of the item locations of the men and women were small (the largest contrast was -.35 logits for item 6). These results indicate that men and women attached similar meaning to the items. An independent groups t-test of the person measures of the men (M = .70 logits, SD = 1.71) and the women (M = .89 logits, SD = 1.49 logits) indicated that the means of the two groups on the proactive trait did not differ statistically significantly, t(407) = −1.20, p = .232).
Differential item functioning across gender of the PPS-6.
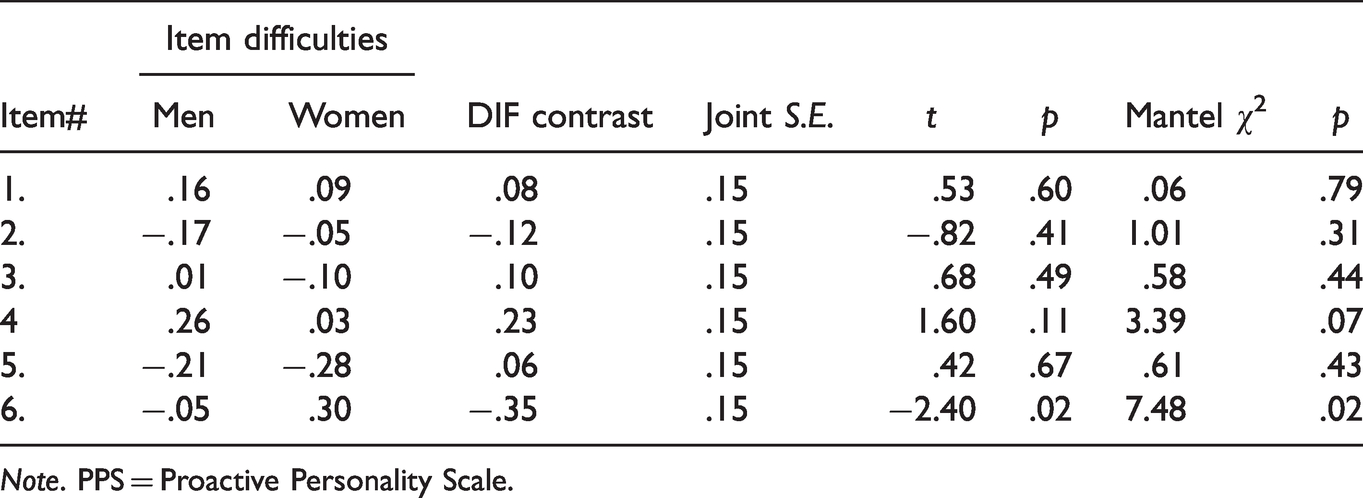
Note. PPS = Proactive Personality Scale.
Figure 2 is a Wright map that summarises the distributions of the men and women and the Andrich thresholds on the latent trait continuum. The distributions of the men and women were similar and roughly approximated normal distributions. The Wright map also shows the proper ordering of the Andrich thresholds, which covered a relatively large range of the latent trait continuum (ranging from about −3 logits to about 4 logits).

Wright map of person distributions and locations of the andrich thresholds of the PPS-6. The Wright map plots the locations of the men and the women (as density distributions) and the Andrich thresholds of the items on the latent trait continuum. This Wright map shows that the person measures were widely distributed along the latent trait continuum. The trait distributions of both groups roughly approximated a normal distribution. The distributions of the men and women were similar. An Independent groups Welch t-test showed that the means of the men (M = .70 logits, SD = 1.71, SE = .12) and the women (M = .89 logits, SD = 1.48, SE = .10) were equivalent, t(407) = −1.20, p = .232.
Discussion
The aim of this study was to evaluate the psychometric properties of the 6-item Proactive Personality Scale (i.e. PPS-6) for recent Ghanaian university graduates using the Rasch rating scale model. We employed the model as a diagnostic tool with the aim of identifying measurement disturbances that could threaten the validity of person measures obtained with the PPS-6. In particular, we focused on whether (a) the PPS-6 measures a unidimensional trait, (b) the items were locally independent, (c) the 5-point ordered response categories functioned as intended, (d) the slopes of the item characteristic curves were parallel, and (e) the items had invariant locations for men and women. Taken together, the results showed that the data provided a good fit to the rating scale model and that there were no serious measurement disturbances in the data. In the paragraphs that follow, we discuss each of our results with reference to each of the potential measurement threats.
Our analysis of the standardised Rasch residuals demonstrated that the Rasch dimension dominated the data and that no additional meaningful dimensions could be extracted. This result is consistent with previous confirmatory factor analytic studies that provided support for the unidimensionality of the PPS-6 in Finland, Belgium and in Spain (Claes et al., 2005). See also Hu et al. (2018), Li et al. (2010), Parker (1998), and Vermooten et al. (2019). Inspection of the pairwise correlations of the standardized Rasch residuals revealed no salient violations of the principle of local independence. These results indicate that it is safe to combine the items into a total measure among Ghanaian university graduates.
The rating scale analysis also provided evidence for the suitability of the 5-point response rating scale employed by the PPS-6. Participants used the response categories as expected, such that persons with higher trait levels endorsed higher response categories. The Andrich thresholds were properly ordered, which indicated that each successive category becomes the modal category along the latent trait continuum.
Infit and outfit statistics of the items demonstrated that the items fit the rating scale model satisfactorily which means that the differences between persons’ observed responses and model expected responses were similar. These statistics, in conjunction with visual inspection of the empirical characteristic curves indicate that for the most part, the slopes of the curves were essentially parallel. A noticeable exception was observed for item 1, where even after removing persons who responded most unexpectedly, the empirical slope flattened more than expected in the upper range of the trait (see Figure 1). This indicates that persons with high trait levels scored somewhat lower than expected. We speculate that this disturbance can be attributed to the content of item 1 (“If I see something I don’t like, I fix it”) with some persons perhaps attaching a literal interpretation to the item. It is conceivable that persons with such an interpretation would respond in lower categories if they dislike physically fixing things, even if they have high levels of proactiveness.
Comparison of the locations of the item characteristic curves of men and women evidenced that none of the six items displayed DIF that would lead to a noticeable measurement disturbance. It appears safe to compare the scores of men and women. Our analysis also demonstrated that the mean person measures of the two groups were equivalent (within error). This result accords with those of Spitzmuller et al. (2015) who found proactive personality to be invariant across gender. Finally, a Wright map of the person distributions and Andrich thresholds demonstrated that the PPS-6 was appropriately targeted at the trait levels of recently graduated Ghanaians. As is commonly the case with the measurement of normal personality attributes, however, persons at the extreme ends of the trait distribution are not targeted very well.
The Rasch person reliability of the PPS-6 person measures was .80, which corresponded with the Cronbach’s coefficient alpha (.82) and McDonald’s coefficient omega (.82). These coefficients suggest that the scale yields measures with satisfactory reliability for research purposes in Ghana. The Cronbach alpha corresponds well with reliabilities reported by Claes et al. (2005) in Finland, Belgium, and in Spain.
Limitations
One limitation of the study is that our participants were university graduates, who might not be fully representative of the Ghanaian population. Because the present sample comprised recent university graduates, it is possible that Ghanaian job seekers with lesser education, and those lacking proficiency in the English Language, might interpret the content of the English items on the PPS-6 in different ways than expected. This needs to be empirically examined and if necessary, the PPS-6 should be translated into Ghanaian local languages such as Ga, Akan, Ewe, and Dagbani.
Another limitation related to the sample used is that although the present sample consisted of recent university graduates (who may not technically be described as students), it is well known that research findings based on student samples raise external validity concerns. Thus, it would seem necessary for future research on the PPS-6 to overcome this limitation by sampling from working adult populations or adult job-seeking populations. This future research can corroborate our findings. A third possible limitation is that our study focused only on the internal psychometric characteristics of the PPS-6. Whereas these results are promising, it is necessary to also examine its construct validity within a nomological network of theoretically related constructs.
Conclusions
Rasch analysis demonstrated that the PPS-6 is a highly promising measure of pro-activeness in the Ghanaian context among recent university graduates. The analysis allowed for fine-grained evaluations of the scale and its items. The few measurement disturbances that we detected were mild and we believe that the PPS-6 can safely be used with adult working men and women. Our results also extend the theoretical reach of the proactive personality concept to the Ghanaian context and potentially pave the way for further research into the precursors and consequences of the trait.
Footnotes
Consent to Participate
Informed consent was obtained from all of the participants of the study.
Ethics Approval
The study protocol was approved by the Institutional Review Board of the University of Ghana (Ref#: ECH116/19-20).
Declaration of Conflicting Interests
The author(s) declared no potential conflicts of interest with respect to the research, authorship, and/or publication of this article.
Funding
The author(s) disclosed receipt of the following financial support for the research, authorship, and/or publication of this article: This study was generously supported by a postdoctoral fellowship award from the Department of Industrial Psychology, Stellenbosch University, to the corresponding author.