




Abstract
The study's objective was to develop and validate the psychometric properties of two brief pictorial scales to evaluate the roles of bystanders and victims of bullying. A sample of 910 students was considered (49.6%, boys; 50.4%, girls) between the ages of 7 and 13 (M = 10, SD = 1.4). Both instruments present nine pictorial items representing two dimensions: physical bullying (items 1 to 4) and psychological bullying (items 5 to 9). An additional measure of anxiety was used to assess convergent validity. The Confirmatory Factorial Analysis shows that the two-dimensional oblique model, physical bullying and psychological bullying, presents a better fit to the bystander scale data (RMSEA = .040; CFI = .984; SRMR = .033) and in the victim scale (RMSEA = .051; CFI = .978; SRMR = .040) in comparison to other competitor models. From the perspective of the Item Response Theory (IRT), it was found that the items adequately discriminate the levels of the latent variable; therefore, items 1 (physical bullying) and 7 (psychological bullying) are the most accurate on the bystander scale, and items 3 (physical bullying) and 7 (psychological bullying), on the victim scale. It was also found that the degree of difficulty on both scales is lower for the psychological bullying dimension than for the physical bullying dimension. Both instruments demonstrated good psychometric properties; therefore, they can detect school bullying in classrooms.
Introduction
Bullying, currently a major public health problem (Chester et al., 2015), is widespread in most schools globally (Barzilay et al., 2017; Craig et al., 2009). A recent meta-analysis (Modecki et al., 2014) that analyzed data in different geographical contexts, reported that 35% of school-age adolescents are involved somehow, mild or severe form in school bullying, either as a victim or a bully. Studies in the United States indicated a prevalence of school bullying between 20% and 40% (Gladden et al., 2014; Tokunaga, 2010). Other studies suggest that in Europe and the United States there is a prevalence between 26.1% and 33.5% (Chester et al., 2015; Schultze-Krumbholz et al., 2015). In Asia, particularly in China, victimization rates vary between 2 and 66%, while perpetration rates range from 2% to 34% (Chan & Wong, 2015).
In Latin America, it is estimated that between 50% and 70% of school students were involved in some type of school bullying (Eljach, 2011). Another study reported a prevalence between 13 and 63% in 16 Latin American countries (Román & Murillo, 2011). A more recent research study that reviewed the literature on school bullying published in twelve countries of America, reported that between 4.6% and 50% were victims; while around 4% and 34.9% were bullies (Garaigordobil et al., 2019). Finally, a bibliometric analysis conducted in Latin America recognizes that 3 out of 10 adolescents have been involved in bullying, indicating a prevalence of school bullying of 29.3%, calculated using grouped means analysis (Herrera-López et al., 2018).
On the other hand, bullying is associated with depressive symptoms (Zhou et al., 2017), social anxiety (Wu et al., 2018), negative social self-concept (Boulton et al., 2010), psychosomatic problems (Gini & Pozzoli, 2013), poor performance, school absenteeism and changes in psychological fit and mental health in general (Reijntjes et al., 2010; Turner et al., 2013). Several studies recognize that the associated impacts and consequences can be continuous and long-lasting, affecting the development of psychosocial and emotional skills especially in childhood and adolescence (Arseneault et al., 2010). Some research studies that have documented long-term consequences suggest a greater association between school bullying and depression, anxiety, autolytic behavior and mental health problems, both in young adults and middle-aged adults (Takizawa et al., 2014). In the case of bullies, it is recognized that they have long-term negative consequences such as poor academic performance, psychoactive substance abuse, juvenile delinquency and early sexual onset (Smokowski & Kopasz, 2005).
In previous studies, it is observed that the vast majority focus their attention on adolescents. However, it is essential to assess bullying before adolescence since mental health problems usually begin before puberty and can have markedly negative effects in adulthood (Kessler et al., 2005). Concerning this, several studies mention that bullying in children is related to depressive symptoms (Vergara et al., 2019), social anxiety (Wu et al., 2018), greater negative social self-concept (Boulton et al., 2010), and a negative effect on their mental health (Husky et al., 2020). Therefore, it is crucial to evaluate this phenomenon in childhood properly.
Faced with this problem, it is worth mentioning that the theoretical, empirical, and scientific research progress on the phenomenon in Latin America is scarce, making it more evident a need for studies that develop or validate measurement scales with proven psychometric quality (Herrera-López et al., 2018). Several studies that analyze the measurement of school bullying recognize that a large part of the scales that measure this phenomenon have been designed for the adolescent population (Lam & Li, 2013). In a systematic review, out of 41 papers found between 1985 and 2012, fifteen instruments were developed to specifically measure school bullying in children (Vivolo-Kantor et al., 2014); in that group, only two studies included a clear definition of school bullying and only one study covers the range of six to thirteen years of age. A more recent systematic review shows that, out of 234 papers on school bullying in Latin America, only 15 papers (7.6%) addressed primary education. In addition, out of the 180 studies that applied scales, only 79 (43.9%) papers evaluated the psychometric properties of the tests used and in this group. In order to assess validity of the construct, only 8 papers (10.1%) performed an exploratory factor analysis; 4 papers (5.1%) performed a confirmatory factor analysis; 3 papers (3.8%) reported a confirmatory factor analysis by groups; and only 4 studies (5.1%) performed an analysis under the theory of response to the item (Herrera-López et al., 2018). It is also necessary to highlight that the lack of measurement instruments designed for children makes several studies adapt items from other tests of school bullying whose original design was for adolescents (Bayer et al., 2018; Fink et al., 2017; Pan et al., 2017) or evaluate only the frequency of school bullying through a single item (Zhang et al., 2019). The lack of studies and the psychometric limitations of the traditional tests (Likert scale) to measure bullying in Latin American children becomes evident.
Another relevant aspect is that most of the instruments developed in the United States or Europe are usually directly transferred to other cultures and applied as close translations without studying cultural differences (Cheung, 2012). So the dependence on scales developed in other regions could be skewing the understanding of bullying in Latin America.
In addition, studies conducted in students aged 7 to 13 use Likert-type response categories that vary from three to five options, and none of them uses a pictorial representation of the items. Using pictorial items along with few Likert-type response categories is more appropriate for this age group cognitive development, characterized by limited reading comprehension abilities. Also, the pictorial scales facilitate the understanding of the items in children (Tietjens et al., 2018). All this greatly affects the measurement and adequate representation of the construct.
Finally, it is recognized that most of the instruments were constructed under the foundations of the Classical Test Theory (CTT). This theory is based on the idea that a person's observed score on a test is a linear function of two components: (a) true score and (b) measurement error (Muñiz, 2010). However, this theoretical approach implies two fundamental limitations: (1) Lack of invariance of the results with respect to the instrument used, that is to say, the results of a construct measured by different instruments cannot be compared. (2) Absence of invariance of the psychometric properties of the tests, which means that the degree of reliability, difficulty of the items and indicators of construct validity depend on the type of sample used to calculate it (Muñiz, 2010). Given this situation, the Item Response Theory (IRT) is an alternative that provides better solutions to the problems presented by CTT. Although IRT represents a radical change to the CTT approaches, it is not a contrary theory but rather complementary to the classical model. This model assumes that the probability that a person emits a particular response to an item can be described using a mathematical function of the person's position in the latent trait and one or more characteristics of the item (Muñiz, 2010).
Review of concept bullying
School bullying is defined as a set of aggressive or hostile acts or behaviors–of verbal, physical, or social nature–that is carried out intentionally and repeatedly over time by a student or a group of students and directed at someone who finds it difficult to defend him/herself, resulting in interpersonal relationships characterized by a real or perceived imbalance of power between the bully and the victim (Olweus, 1993; Olweus & Limber, 2010). Recent studies propose to include in the definition the rupture of ethical reciprocity (Herrera-López et al., 2018) and other characteristics such as the magnitude of the harm and the motivation for aggression (orientation and objective) that deepen the complexity of intentionality (Volk et al., 2014).
In general, research on school bullying focuses on the study of bullies and victims, the latter being the ones that result more affected and impacted (Zych et al., 2017). Bullies are children or adolescents who perform aggressive behavior towards others, while the victims are students who are constantly attacked (Salmivalli, 2010). Victims usually have characteristics that make them vulnerable, such as being introverted and melancholic, having physical characteristics of frailty, learning problems, or on the contrary, high academic performance, among others (Frisén et al., 2007). However, this perspective of individual conditions has advanced towards more contextual and ecological ones, which includes the study of the phenomenon in the framework of social stigma such as poverty level, racial or ethnic identity (Caravita et al., 2019), LGBT or disability status (Malecki et al., 2020). As a result, its various roles have been reconfigured, focusing on the social function of aggression and victimization, as well as of mixed roles, e.g. aggression-victimization, pro-aggression observation, or pro-victimization observation (Troop-Gordon et al., 2019; Zych et al., 2017). It is relevant to highlight that bystanders play an ever-increasing role because school bullying result from group processes supported in the school micro culture (Hong & Espelage, 2012; Salmivalli, 2010). Bystanders are those students who witness aggressions and usually do not take any action in defense of the victim for fear of being treated the same or worse (Gini et al., 2008). However, the type of behavior they assume regarding aggression influences the maintenance or reduction of school bullying (Rigby & Johnson, 2006; Troop-Gordon et al., 2019).
Regarding the differences according to sex, several studies indicate that boys and girls are involved in different ways in bullying. Boys usually use physical harassment, while girls use psychological harassment (Alsaleh, 2014; de Frutos, 2013). A study conducted on five large international databases (HBSC, EUKO, TIMSS, GSHS, PISA), recognized that the majority of boys were more involved in the role of aggression, a trend that remains throughout adolescence (Smith et al., 2019).
Goals of the current study
Considering the abovementioned, this study intends to respond to the need for new measurement instruments specifically designed for children and that adapt to their development stage. Therefore, the construction and test of psychometric properties of two short pictorial scales is proposed in order to assess bullying from the role of the bystander and the victim in children aged 7 to 13. For this purpose, analyses of structural equation models (SEM) and item response theory (IRT) will be used and evaluated factor invariance according to sex.
Method
Participants
Non-probabilistic sampling was used for data collection, using the following inclusion criteria for data collection: (a) informed consent of the parents or guardians, (b) voluntary participation of students, and (c) not older than 13 years of age. The following exclusion criteria were used: (a) failure to complete all tests and (b) failure to complete the items on sociodemographic data.
To assess the psychometric properties of both scales, a sample of 910 elementary level students was considered (49.6% boys and 50.4% girls), with ages between 7 to 13 years (M = 10, SD = 1.4). There were no statistically significant differences (t (908) = .495, p = .621, d = .045, CI95% −.133–.222) between the ages of male students (M = 10.1, SD = 1.4) and female students (M = 10, SD = 1.4). A total of 58.1% belong to the last two years of study (fifth and sixth grade of elementary); 70.7% live with both parents; and only 12.1% had repeated an academic year. All of the students attend public school, and most of them are from the coast of Peru.
Instruments
Brief pictorial scale of school bullying for bystanders (EPAE-E)
The scale presents nine pictorial items that have three response categories: never (0), sometimes (1) and many times (2). All items are direct, where a higher score indicates a greater presence of school bullying observed by the student. The scale has two dimensions: physical bullying (items 1 to 4) and psychological bullying (items 5 to 9). The full scale can be downloaded in the section of Supplementary Materials.
Brief pictorial scale of school bullying for victims (EPAE-V)
The scale presents nine pictorial items that have three response categories: never (0), sometimes (1) and many times (2). All items are direct; therefore, a higher score indicates that the student is a victim of school bullying. The scale has two dimensions: physical bullying (items 1 to 4) and psychological bullying (items 5 to 9). The full scale can be downloaded in the section of Supplementary Materials
Spence children's anxiety scale (SCAS)
It was used the Latin American version adapted by Hernández-Guzmán et al. (2010), which consisted of 38 items grouped into six sub-scales and rated on a 4-point scale (never = 0 to always = 4). The Spanish-language version had adequate reliability index for each factor: panic (α = .81), separation anxiety (α = .74), social phobia (α = .71), physical injury fears (α = .75), obsessive-compulsive problems (α = .77), and generalized anxiety (α = .72). It also presented an acceptable fit for a model of six-factor oblique (CFI. = 89; IFI = .89; RMSEA = .043 [IC90% .039–.046]). The total score is the sum of the items for each scale, where the higher score means higher symptoms of anxiety. In this study, the reliability indices valued through McDonald’s Omega coefficient (≥.60) were adequate: Separation anxiety (ω = .73) [IC 95% = .70–.76]), social phobia (ω = .69 [IC 95% = .66–.72]), obsessive-compulsive problems (ω = .67 [IC 95% = .64–.70]), panic (ω = .81 [IC 95% = .79–.83]), physical injury fears (ω = .66 [IC 95% = .63–.69]) and generalized anxiety (ω = .68 [IC 95% = .65–.72]).
Procedure and statistical analysis
This was an ex post facto/retrospective cross-sectional, descriptive-instrumental study, with one group and multiple measures (Montero & León, 2007). In addition, the study was approved by the ethics committee and subject to the principles of the Helsinki Declaration (World Medical Association, 2013) the research represented a low risk to participants. Permits from educational institutions or the child’s parents or guardians through informed consent and assent, duly signed, were obtained. They all were informed of the study objectives and decided to participate voluntarily.
The data collection was carried out by three research assistants, duly trained senior Psychology students. The three assistants explained the evaluation's objective and the instructions on how to answer the items on the scales. Student questions were answered, and the confidentiality of the information was ensured. It is important to note that only the students who wanted to participate in the assessment completed both scales. The average time taken to apply the instrument was 15 minutes.
The formation of EPAE-E and EPAE-V was carried out in three stages: (a) conceptual delimitation, (b) content validity, and (c) confirmation of psychometric properties (see Figure 1).

Stages of the scale construction process.
Conceptual delimitation
The Olweus Theory (Olweus, 1993) and his three principles, intentionality (orientation and objective), repetition and power imbalance, were taken into account for preparing the items. Likewise, emphasis was placed on the fact that bullying is a group phenomenon, where the roles of victim, aggressor and bystanders are recognized (Olweus & Limber, 2010). The most frequent form of physical bullying in childhood is scratching, pinching, biting and hair pulling, including indirect aggression such as hiding or destroying things or personal belongings. Other forms of bullying are verbal and social (also called psychological ones), which include behaviors such as name-calling, teasing, spreading rumors about the victim and social or game exclusion (Wu et al., 2018).
Based on the above, a two-dimensional model−called physical bullying and psychological bullying−was proposed for each scale, as they are the most frequent types of bullying in students aged 7 to 13. According to this approach, nine images were sketched for each scale representing specific situations and the most common types of behavior in school life (see an example of items in Figure 2). Every image was original and newly designed by an exclusive drawing and painting artist for this study.
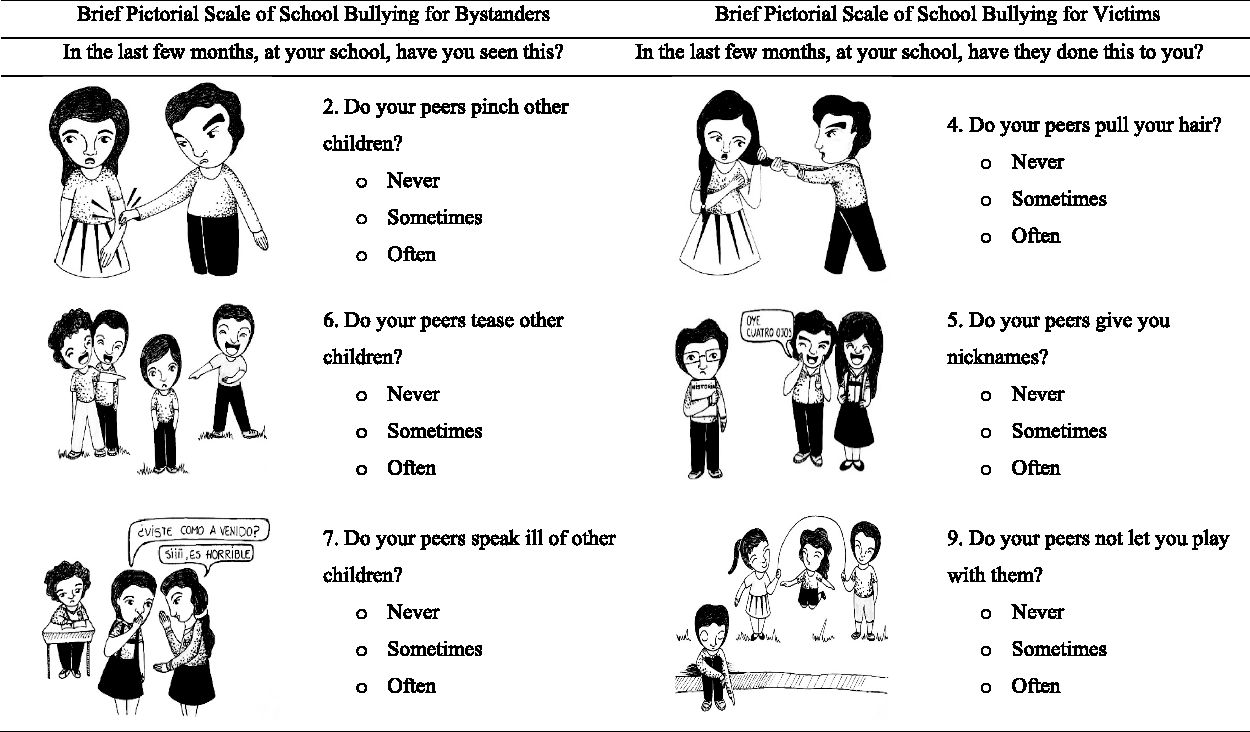
Examples of both scale’s items.
Content validity
An evaluation committee consisting of seven judges (all experienced psychologists in the educational area) was responsible for assessing the structure and content of the pictorial items. The items of the scale were assessed following four criteria: (a) clarity, which refers to the degree to which the item is clear and understandable, (b) coherence, which refers to the degree to which the item is related to its dimension, (c) context refers to the degree to which the item does not contain unusual or infrequent words for the assessment's cultural context, and (d) domain of the construct refers to the degree to which the item is essential or important to measure the construct. The Aiken’s V coefficient (Aiken, 1980) was used for quantification of the content. For calculation purposes, an ad hoc template in the MS Excel© program was used.
Construct validity
For testing the factor structure of the two scales several alternative Confirmatory Factor Analyses were estimated. These CFAs were estimated in Mplus (Muthen & Muthen, 2017) with WLSMV (Weighted Least Square Mean and Variance corrected) as the estimation method given the non-normality and Lykert-type scale of the items. Model fit of the CFAs was assessed with the indices available for this method of estimation: the chi-square, the CFI, and RMSEA. Cut-off criteria for adequate fit were: CFI above .90 (better if above .95) and RMSEA and SRMR below .08 (Marsh et al., 2004). Strength and interpretability of the estimates was also considered in evaluating the adequacy of the models. Internal consistency was estimated with the Composite Reliability Index (CRI), an index based on the confirmatory results that overcomes some of the shortcomings of Cronbach’s alpha (Raykov, 2001).
A sequence of hierarchical models of variance was proposed, which were increasingly restrictive to evaluate the scale's invariance according to sex. First, the configural invariance (reference model) was evaluated, followed by the metric invariance (equality of factor loads), scalar invariance (equality of factor loads and intercepts), and finally, the strict invariance (equality of factor loads, intercepts, and residuals). First, a formal statistical test was used in the study to compare the sequence of models, for which the chi-square difference (Δχ2) was used where non-significant values (p> .05) suggest invariance between the groups. Second, a modeling strategy was employed, using differences in the CFI (ΔCFI) where values less than <.010 evidence model invariance between groups between the groups (Chen, 2007).
Additional to the CFAs and CRIs, the scale was analyzed via Item Response Theory (IRT) models. Specifically, the Graded Response Model (GRM) was used (Samejima, 1997), an extension of the 2-Parameter Logistic Model (2-PLM) to ordered polytomous items (Hambleton et al., 2010). For each item two types of parameters are estimated, discrimination (a) and difficulty (b). The discrimination parameter (a) determines the slope on which responses to the items change as a function of the level in the latent variable. Item difficulty (b) parameters determine how challenging the item is. As the scales have three categories of response, there are two estimates of difficulty, one per threshold. The estimates for these two thresholds indicate the level of the latent variable at which an individual has a 50% chance of scoring at or above a particular response category. Item and Test Information Curves were also calculated, to estimate the accuracy (reliability) of the scale across the range of values in the scales.
Additionally, descriptive statistics for the items in the scales, their inter-correlations and correlations among the bullying scales (observer and victim) and their criteria were calculated in SPSS 24.
Results
Content validity
Regarding the Bullying Scale-Bystanders (EPAE-E), in the quantitative analysis, the nine pictorial items obtained optimal Aiken’s V coefficients in both clarity (V = .71 to 1.00), and coherence (V = .86 to 1.00), context (V = −.86 to 1.00) and construct domain (V = −.86–1.00). Qualitative analysis of the pictorial items showed no significant changes, and the judges also agreed on the response categories. As to the Bullying Scale-Victims (EPAE-V), its nine pictorial items also produced coefficients greater than .70 in the four criteria assessed. In the qualitative analysis, there were no changes and all the judges agreed on the response categories for the pictorial items.
Construct validity
There are two a priori plausible models for each scale (measuring observers of bullying and victims of bullying). The scales were developed with the intentions to measure both physical and psychological behaviors of bullying. However, as this two kinds of behaviors may well correlate highly, a one-factor model is also plausible. Therefore, for each scale (observers and victims) three factor models have been tested: a) a one-factor model; b) a two-factor model of physical and psychological aggression with uncorrelated factors; c) a two-factor model of physical and psychological aggression with correlated factors.
Model fit of the alternative model may be seen in Table 1. Fit of the one-factor model was adequate, while the inclusion of two uncorrelated factors of physical and psychological aggression clearly deteriorated fit. However, fit problems with the two-factors disappeared when the correlation between the two factors was estimated. Indeed, the best-fitting model was the one with two correlated factors of physical and psychological aggression. This is true in both scales, the scale that asks about observed bullying behaviors (observers scale) and the scale asking about bullying suffered (victims scale).
Competitive CFA models for the observers and victims bullying scale.

Note: df = degrees of freedom.
Table 2 shows the standardized factor loadings for the items in both scales. They are all statistically significant (p < .01) and large. The two dimensions of physical and psychological aggression correlated significantly in both scales .61 (p < .01) in the observer’s scale and .72 (p < .01) in the victim’s scale.
Factor loadings, discrimination, and difficulty parameters for the nine behaviors in the two aggression scales.

Note: λ= factor loading; a= discrimination parameters; b= difficulty parameters.
Graded response models
Graded response models, and specifically 2PL models were fitted. A 2PL model was fitted for each dimension (physical and psychological) in each scale (observer and victim). That is, four 2PL models. Graded response models with two parameters were chosen because each dimension may be considered unidimensional but the assumption of a constant discriminant parameter across items in the same dimension is not tenable according to the results in the CFA models (discrimination parameters in the IRT models are analytically similar to factor loadings in the CFA (Ferrando, 1996; Widaman & Reise, 1997). Therefore, a more parsimonious 1PL model is not adequate for these scales.
Discrimination and difficulty parameter estimates are presented in Table 2. As can be seen in the aforementioned table, all the discrimination parameters, except item 3 (observer scale) and item 8 (victim scale), are above the value of 1 usually considered as good discrimination (Hambleton et al., 2010). Regarding difficulty parameters, estimates of the ordered thresholds monotonically increased, as it is expected. In general, difficulties are lower for the observer scale than for the victim scale, and also in general, difficulties are lower for the psychological scale than they are for the physical one.
Item and Tests Information Curves (IIC and TIC, respectively), one ICC for each items and four TIC, one for each dimension in each scale. Figure 3 shows the IICs for all the items in the two dimensions of physical and psychological aggression in the observer scale as well as the two TICs estimated for each dimension. The most accurate item in the physical dimension in the observer scale was item 1, and the TIC shows that the test is more reliable (accurate) in the range of the scale between −1 and 3. With respect to the psychological dimension, it is item 7 the most accurate, with the test being more reliable in the range −1.5 to 1.5.
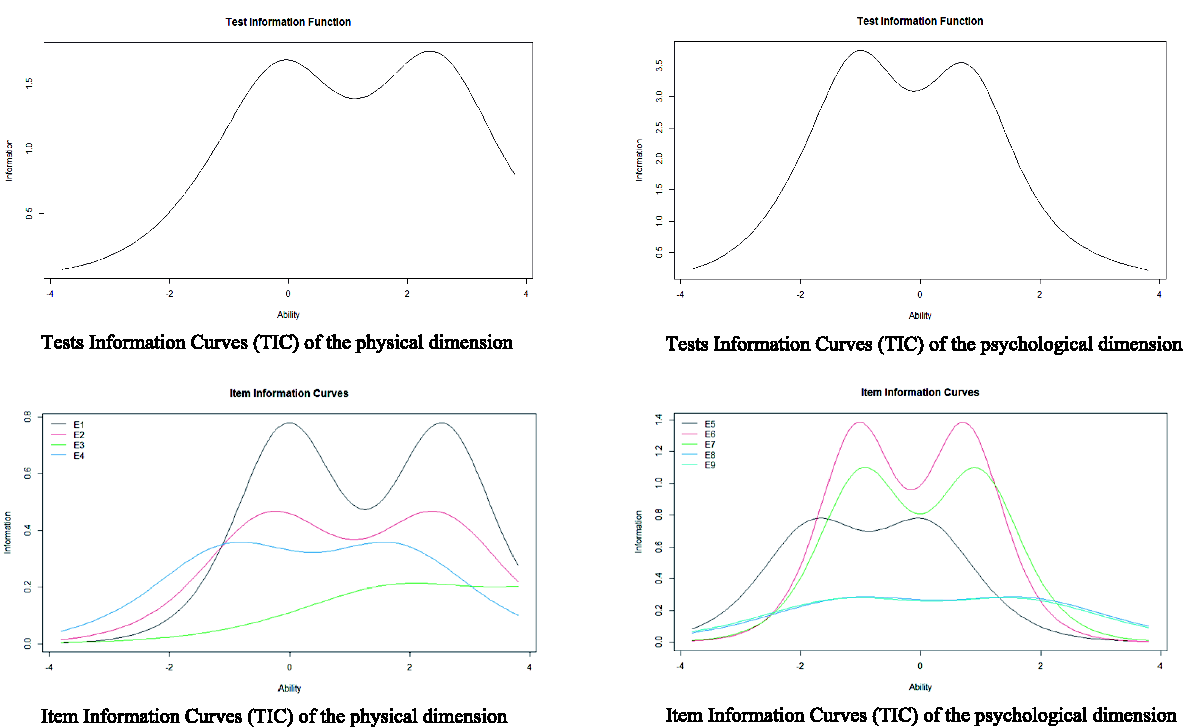
Item information curves for dimensions and items of the observer scale.
Figure 4 shows the IICs and TICs for the victim’s scale. The most accurate item in the physical dimension was item 3, and the TIC for this dimension showed that the scale was more reliable in the range 0 to 2.5. Regarding the psychological dimension, item 7 was the most accurate and overall the dimension had more accuracy in the range 0.5 to 2.
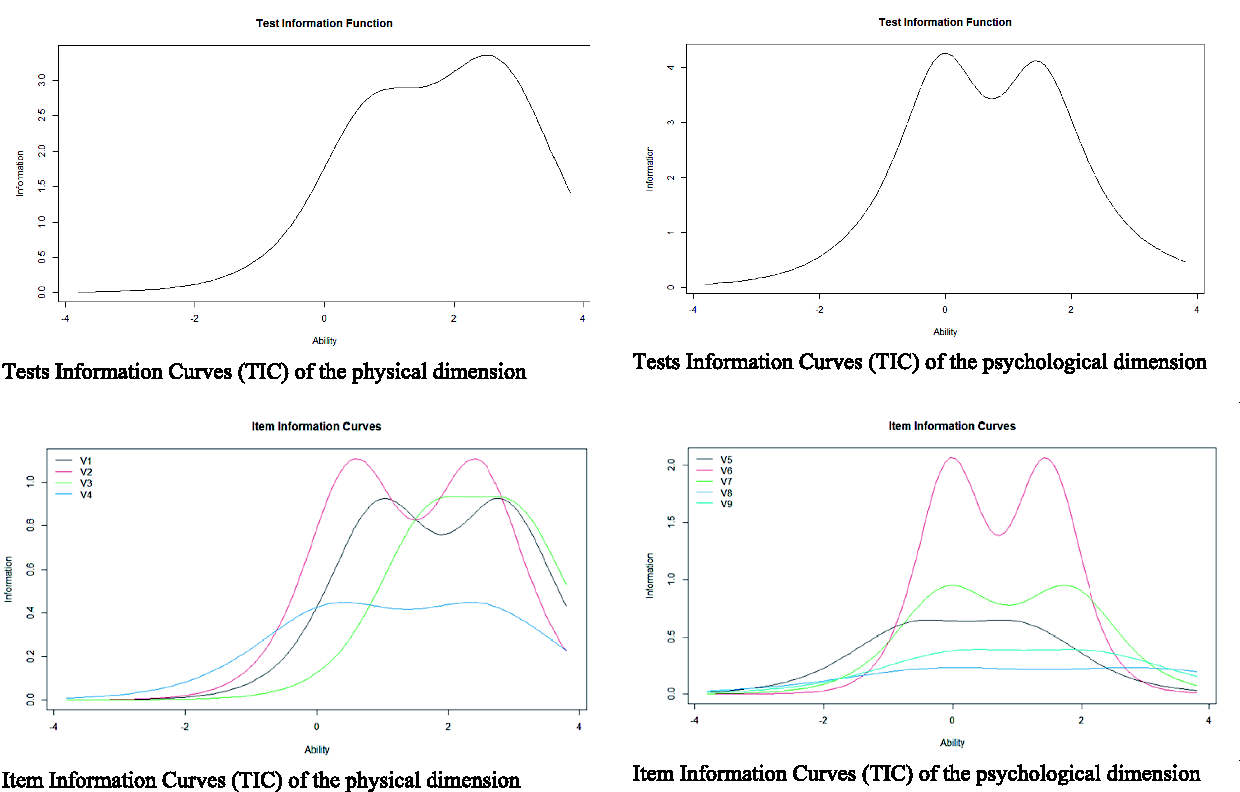
Item information curves for dimensions and items of the victim scale.
Reliability estimates
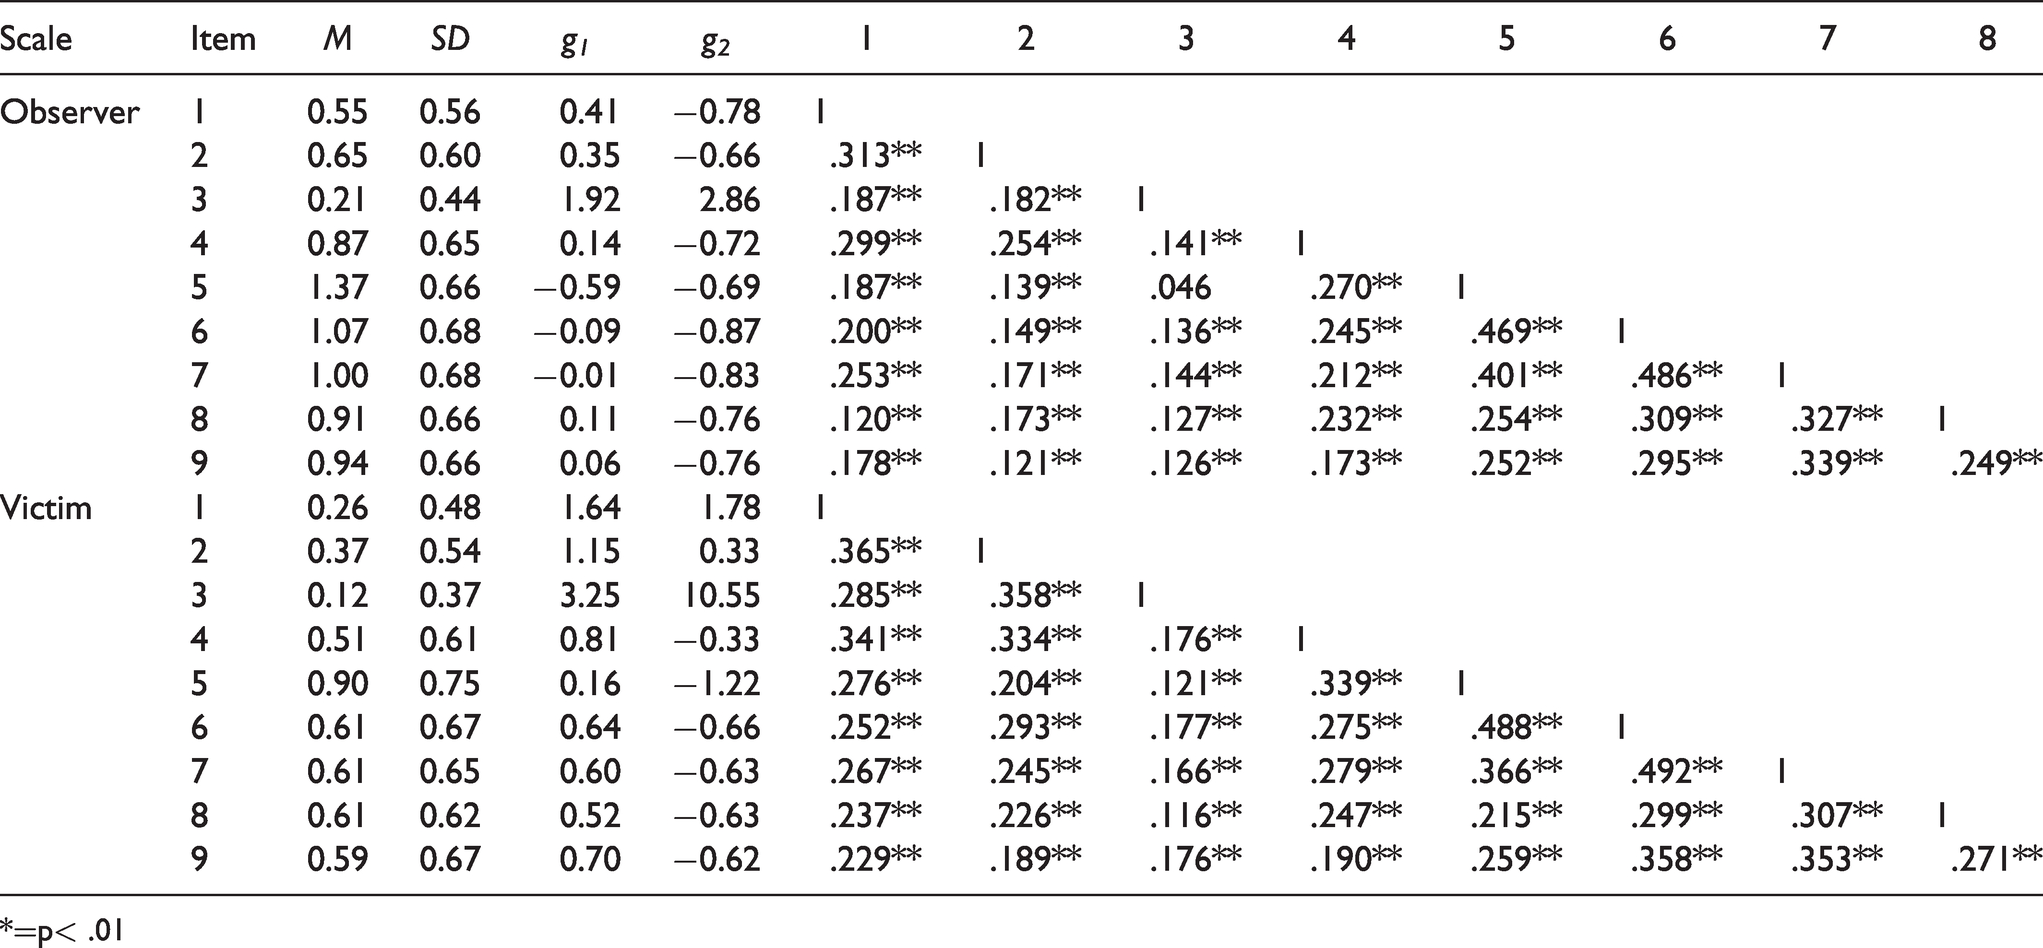
Table 3 offers descriptive statistics for all items of both scales and inter-correlations among them. Using the estimates in the best fitting CFAs, CRI have been calculated for each dimension in both scales. In general, reliability estimates are good. In the observer’s scale CRI for the physical dimension was .66 and for the psychological dimension was .79. Regarding the victim’s scale, the CRI for the physical dimension was .79 and for the psychological dimension was .80.
Means, standard deviations, asymmetry, kurtosis and inter-correlations of all items in both scales.
*=p< .01
Evidence of convergent validity
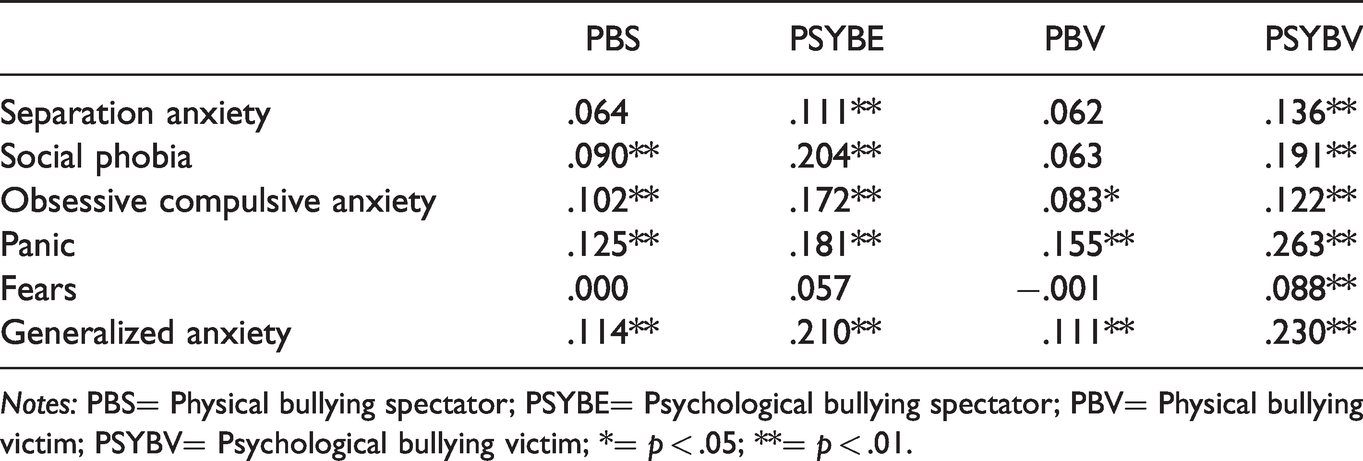
Table 4 shows the associations among the four dimensions of bullying in the two scales, spectators and victims, and other measures of interest. It can be seen that, in general, correlations are larger for the psychological dimensions of both scales than for the physical one.
Zero order correlations among the four dimensions of bullying and variables of interest.
Notes: PBS= Physical bullying spectator; PSYBE= Psychological bullying spectator; PBV= Physical bullying victim; PSYBV= Psychological bullying victim; *= p < .05; **= p < .01.
Measurement invariance by gender
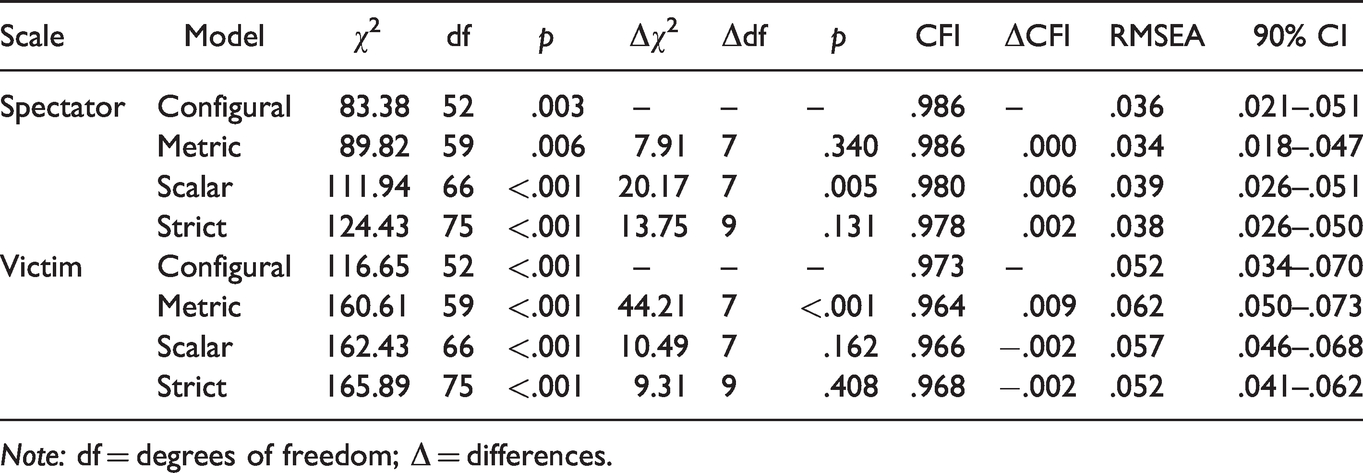
Table 5 shows goodness-of-fit indexes for the sequence of nested models and their differences in fit to the less restricted model in the sequence. This sequence of nested models is estimated separately for each scale. It is apparent from a look at chi-square and practical fit (differences in CFIs) that the scale of bullying as a spectator is strictly invariant by gender. Given this invariance, it is possible to compare latent means between boys and girls. In this case both zboys and girls report same average level of physical bullying (Mean difference = −.077, p = .31) and psychological bullying (Mean difference = .033, p = .66). Regarding the scale of bullying as a victim, a view at Table 5 indexes makes also clear that overall the scale may be considered strictly invariant by gender. Again and given this invariance a latent mean comparison is adequate. In this case there were statistically significant mean differences between boys and girls. Mean differences in physical bullying (as a victim) were 1.39 (p < .001), and therefore girls reported more physical bullying suffered than boys. Mean differences in psychological bullying were also statistically significant (Mean difference = .719, p < .001), and again girls reported more psychological bullying than boys.
Goodness-of-fit indexes for the nested models in the measurement invariance routine for both scales.
Note: df = degrees of freedom; Δ = differences.
Discussion
The main purpose of the study was to construct and validate, through the identification of psychometric properties, two short pictorial scales to assess the roles of bystanders and victims of school bullying in schoolchildren aged 7 to 13 since there are scarce instruments to adequately measure and represent bullying in childhood. While it is a widely studied phenomenon, most studies have focused on adolescents.
Accordingly, the results show that the EPAE-E and EPAE-V scales have optimal psychometric properties. From the Classical Test Theory perspective, the two-dimensional oblique model (physical bullying and psychological bullying) presents a better fit to the data compared to other competitive models such as the one-dimensional orthogonal model, which evidences that the students aged 7 to 13 recognize bullying from a double dimension: physical bullying and psychological bullying as both bystanders and victims.
The abovementioned is consistent with the proposal of the theoretical models that guided the study and intervention of the phenomenon globally (Catone et al., 1975; Nelson et al., 2019). They recognize bullying as a complex expression of interpersonal or relational violence that differs from the conflict and aggressive behavior precisely because it has particularities that make it completely unjustified (intentional, repeated in time and with an imbalance of power), using mechanisms of intimidation and/or physical, verbal mistreatment and social exclusion (the latter also psychological). Consequently, these practices of intimidation and mistreatment result in interpersonal relationships characterized by marked ruptures in moral reciprocity that are nurtured and perpetuated in the law of silence and the dominance-submission scheme (Ortega et al., 2001).
Regarding the reliability of the scales, the dimensions have adequate composite reliability indices (CRI> .60; Bagozzi & Yi, 1988), thus guaranteeing a lower measurement error and greater accuracy of the scores obtained in both scales. Additionally, these results are sufficient for brief screening (Dominguez-Lara & Merino-Soto, 2018) and research measures.
On the other hand, according to the Item Response Theory (IRT) the degree of difficulty is lower regarding the psychological bullying dimension than the physical bullying dimension, i.e., it is easier for the bystanders and victims to report cases of psychological bullying than physical bullying. This is an advantage for the early detection of school bullying since evident physical violence is not necessary to identify cases of bullying.
Likewise, the degree of difficulty is lower in the bystander scale than in the victim scale, i.e., it is easier for bystanders to report cases of school bullying than for the victim (Troop-Gordon et al., 2019). A probable cause of this is that victims are trapped in a relational structure−where the law of silence prevails−that dominates and subjugates them, and that clearly represents an imbalance of power between victim and bully (Juvonen & Graham, 2014). However, this also shows the importance of strengthening the bystanders’ role, as they can eventually identify and make visible the intimidation, break the law of silence and finally help to undermine dominance or imbalance of power (Gini et al., 2008; Limber et al., 2018).
Regarding the pictorial items on both scales, they all have a significant factor weight (λ > .40) in the corresponding dimension. In addition, the IRT shows that the items adequately discriminate the levels of latent variable; therefore, items 1 (physical bullying) and 7 (psychological bullying) are the most accurate on the bystander scale and items 3 (physical bullying) and 7 (psychological bullying) on the victim scale. In this respect, pictorial items fit well to assess students’ cognitive development since their thinking processes are still based on specific events, objects, and experiences (Case et al., 2001). On the other hand, they are a more effective means of representing and conveying a meaning that helps schoolchildren of these ages to give a response (Döring et al., 2010). Likewise, previous studies revealed their preferences for a pictorial scale because they consider it friendlier, clearer and faster to complete (De La Cabada et al., 2017).
On the other hand, the sequence of hierarchical variance models in the study of invariance, demonstrates that both scales can be considered strictly invariant according to the gender variable, that is, the items measure the same construct identically in both groups. In addition, these results suggest that children of both genders interpret and respond to the items in a similar way, which allows comparison of scores of boys and girls, taking for granted that the differences lie in the real level of the construct (Pedraza & Mungas, 2008). Regarding the EPAE-V scale, the findings of invariance coincide with the results produced by other psychometric instruments measuring also bullying, such as those made in Iran (Rezapour et al., 2019), Greece (Antoniadou et al., 2016), United States (Roberson & Renshaw, 2018) and Australia (Marsh et al., 2011). As to the EPAE-E scale, they found only one similar study that provides evidence of factor invariance according to the gender of the bystander (Jenkins et al., 2018). However, it is important to point out that the studies cited were conducted in adolescents and no studies were found evidencing the factor invariance in the child population. Therefore, the results of this study support the use of both instruments to assess the differences between boys and girls as bullying victims and bystanders. In this regard, no significant differences were found between boys and girls as bystanders of bullying in the classroom; however, significant differences were found in the role of victims: girls reported that they suffered more physical and psychological bullying than boys did. These results are similar to those found in other studies, where girls have a higher risk of involvement in victimization (Craig et al., 2009) and boys are mostly involved in the role of aggression (Smith et al., 2019).
Regarding the convergent validity, the physical and psychological bullying dimensions on both scales (EPAE-E and EPAE-V) had a positive relationship with the level of generalized anxiety. These results coincide with the findings in previous studies, where school bullying causes fear and anguish not only in victims but also in bystanders (Demirbağ et al., 2017; Takizawa et al., 2014).
Regarding the limitations of the study, firstly, a convenience non-probability sample was used, limiting the generalization of the results. Secondly, the study was based only on students’ reports of their involvement in bullying, and no other data collection techniques were used. Thirdly, children did not assess the face validity of the pictures for each item. Fourthly, the stability and reliability of both scales over time were not assessed. Fifthly, the predictive validity of the scales was not assessed. Sixthly, for convergent validity, a scale with Likert-type response categories was used to measure anxiety. Despite these limitations, the results of the study are significant not only for psychometric research but also for the prevention and intervention of bullying in classrooms.
In conclusion, this study represents an innovative and significant contribution to the scientific field referred to the phenomenon, as it provides two pictorial scales to assess the involvement as a victim and bystander of bullying. These have optimal psychometric properties and are developed for children aged 7 to 13. Furthermore, they can be used as instruments for early detection and screening, as they present relevant information on the dynamics of bullying in the classroom based on solid theoretical references that consolidate the information of the phenomenon worldwide.
Supplemental Material
sj-pdf-1-prx-10.1177_00332941211037601 - Supplemental material for Is It Possible to Measure the Role of the Bystander and the Victim of Bullying in Children? Construct Validity of Two Brief Pictorial Scales With IRT and CFA Models
Supplemental material, sj-pdf-1-prx-10.1177_00332941211037601 for Is It Possible to Measure the Role of the Bystander and the Victim of Bullying in Children? Construct Validity of Two Brief Pictorial Scales With IRT and CFA Models by Lindsey W. Vilca, Rocio E. Herrera, Tomás Caycho-Rodríguez, José M. Tomás and Mauricio Herrera-López in Psychological Reports
Footnotes
Declaration of Conflicting Interests
The author(s) declared no potential conflicts of interest with respect to the research, authorship, and/or publication of this article.
Funding
The author(s) disclosed receipt of the following financial support for the research, authorship, and/or publication of this article: This work was supported by Challenges Assistance Program Ministry of Science, Innovation, and Universities, Spain [RTI2018-093321-B-100] and Program of Grants for Special Actions of the Research of the University of Valencia, Spain [AE18-777619].

Author Biographies
References
Supplementary Material
Please find the following supplemental material available below.
For Open Access articles published under a Creative Commons License, all supplemental material carries the same license as the article it is associated with.
For non-Open Access articles published, all supplemental material carries a non-exclusive license, and permission requests for re-use of supplemental material or any part of supplemental material shall be sent directly to the copyright owner as specified in the copyright notice associated with the article.
