
Abstract
Abnormal child behavior is a complex entity including among others disorders such as ADHD, a neuropsychiatric disorder interfering with the normal development of the child, and combining many comorbidities. There are no specific tools designed to assess abnormal child behavior, although well-known ADHD screening tools such as the CTRS-R:S go beyond the disorder itself and cover the wider construct. This can be understood as the complex system of mutually influencing entities, that is why the aim of this study was to investigate the items of the CTRS-R:S as a psychological network. We analyzed a data set of 525 children in French-speaking primary schools from Belgium, and estimated a Bayesian Gaussian Graphical Model with a Bayes Factor of 30. We identified highly connected nodes from each community of the CTRS-R:S to build an additional network of communities. In the domain network, Oppositional and Cognitive skills share the strongest connection in the network. The 28-item network was overall positively connected albeit the presence of some negative connections. The spinglass algorithm identified eight domains in the CTRS-R:S network that causally influence each other. The network approach is a useful framework to investigate the domains of abnormal child behavior as well as the interplay between individual symptoms.
Introduction
The fifth edition of the Diagnostic and Statistical Manual of Mental Disorders (DSM 5), generally defines abnormal behavior as a construct that violates a norm in society, is maladaptive, is rare given the context of the culture and environment, and is causing the person distress in their daily life (American Psychiatric Association, 2013). Child behavior is considered abnormal when he ignores or refrains the entourage’s expectations or rules and when it limits their development. The abnormal behavior is also manifested by the excess or the lack of a character, or the hindrance to adaptive functioning (Dumas, 2013). As all psychological disorders, it is a pattern of behavioral, cognitive, and emotional or physical symptoms shown by a person and it includes some degrees of distress or disability (Mash & Wolfe, 2015).
The measurement of abnormal child behavior is complicated. Some researchers used subsets of abnormal child behavior as a proxy for studying the construct: in such cases, attention deficit hyperactivity disorder (ADHD) has been used as a good proxy for studying abnormal child behavior since it possesses several psychometric tools used for its early detection in children that contain items measuring a wider construct that ADHD itself, such as the different version of the Conners Rating Scale. The two main domains of this well-described psychiatric disorder are inattention and hyperactivity, with an optional feature of impulsive behavior. The known functional consequences of ADHD are social rejection, reduced education and educational performance (Frazier et al., 2007), low job performance, low achievement and high unemployment (Kessler et al., 2006), increased risk of mood, conduct, and substance use disorders (Agosti et al., 2011). Because of these consequences, early diagnosis and treatment is essential to prevent such complications (Shaw et al., 2012). Different formal theories have attempted to explain the ADHD development model, such as the Cumulative and Emergent Automatic Deficit model or Cumulative Automatic Deficit Hypothesis (Fabio, 2017), which postulate that automatic processes (cognitive processing without the need for attention) have consequences on controlled processes (that do require attention). ADHD is associated with a defect in executive functions which is well documented in the literature (Brown, 2013; Pennington & Ozonoff, 1996; Shallice et al., 2002; Willcutt et al., 2005), but there is also a deficiency in automatic processes (Fabio, 2017). Some studies postulated that deficits for executive functions might be partially due to a disability in automatic processing (Martino et al., 2017). ADHD is known to be associated with a defect in automatic processes, which in turn results in a defect in controlled processes (Capri et al., 2020).
Screening tools for teachers are essential to identify children that need a clinical evaluation to diagnose ADHD, since because of their nature, ADHD symptoms are most likely to appear early in school settings (Conners et al., 1998).
The most widely used screening tool rated by teachers is the CTRS-R:S (Conners Teacher Rating Scale - revised: short); the CTRS-R:S is part of a set of scales (Conners et al., 1998) that have a strong ability to distinguish ADHD children from normal children (Green et al., 1999). Originally, the Conners' Teacher Rating Scale (CTRS) was created to help clinicians in the screening of ADHD children through the teacher’s perception on the child’s behavior (Conners et al., 1998). This widely used test has a clinical relevance given the diagnostic criteria of ADHD in the DSM 5. Furthermore, the CTRS contains items that are adapted for the school environment. It is composed of four sub scales, namely oppositional (items 2,6, 10, 15, 20), hyperactivity (3, 7, 11, 17, 21, 24, 27), cognitive problems/inattention (4, 8, 13, 18, 22), and ADHD index (1, 5, 9, 12, 14, 16, 19, 23, 25, 26, 28) previously known as hyperactivity index in old version (Conners et al., 1998).
However, the CTRS-R:S goes beyond assessing ADHD, and rather measures a larger entity (Su et al., 2009). Mental disorders are very common in childhood and they include emotional-obsessive-compulsive disorder (OCD), anxiety, depression, disruptive, oppositional defiant disorder (ODD), conduct disorder (CD), attention deficit hyperactivity disorder (ADHD), or developmental (speech/language delay, intellectual disability) disorders or pervasive (autistic spectrum) disorders (Parry, 2005). Emotional and behavioral problems (EBP) or disorders (EBD) can also be classified as either internalizing, that is, emotional disorders such as depression and anxiety, or externalizing, that is, disruptive behaviors such as ADHD and CD (Ogundele, 2018). ADHD is more specifically included in disruptive behavior problem (DBP), just as oppositional defiant disorder (ODD) and conduct disorder (CD). In the DSM 5, some criteria are common in those troubles (for instance, argumentative or defiant behavior can be retrieved in ADHD or in ODD), and this is supported by empirical evidence. 50% of all children and adolescent with a mental health disorder have a conduct disorder (Dretzke et al., 2005) and 30%–75% of children with CD also have ADHD (Perou et al., 2013). This further motivates the present study to prefer the broader term of abnormal child behavior, which better conveys a complex perspective of the condition. It is clear that the CTRS-R:S goes beyond ADHD symptoms and assesses abnormal child behavior as a whole (Su et al., 2009).
In recent years, network theory as emerged as a new way of investigating psychiatric constructs as complex systems (Borsboom, 2017). The network theory considers symptoms to be more than passive and measurable consequences of a latent mental disorder, and instead are active components that cause each other: the mental disorder emerges as the set of interactions among its components, the symptoms themselves (Cramer et al., 2010). By conceptualizing ADHD, and abnormal child behavior more generally as a complex system of components interacting with each other.
Network theory is accompanied by a set of statistics known as network analysis: the connections among symptoms are computed as partial correlations in a Gaussian Graphical Model or GGM (Epskamp & Fried, 2018). Recently, a Bayesian way of estimating a GGM has been introduced in the network literature(Williams & Mulder, 2019): a Bayesian network estimation allows for assessing the amount of evidence supporting the existence of a connection between two symptoms, which is an essential step towards evaluating the potential replicability of network structures (Fried et al., 2018).
One of the most challenging steps when modeling a psychiatric construct as a network is choosing what variables to include: it has been considered that widely adopted and reliable psychometric tools are a good starting point as input for a network model. In that perspective, using items from the CTRS-R:S to model abnormal child behavior in school settings as a network model would make for a reliable input in an observational study.
Studying abnormal child behavior (including ADHD symptoms) as a network is interesting for several reasons: we will hereby list four of them. First, network analysis allows for investigating the unique interactions between two symptoms given all other symptoms in the network (Briganti et al., 2018). Second, network analysis can identify symptoms that are more connected than others, and are therefore core features of the network itself: such symptoms are customarily called central (Boccaletti et al., 2006). However, there can be pitfalls in retrieving central symptoms in networks composed of scale items (Briganti et al., 2019), because they tend to be redundant, that is, measure the same aspect of a construct: such a problem can be overcome by first identifying central items by domain of the scale and shrinking the network so that it is only composed of such central items (Briganti et al., 2020a); this has been referred to as topological overlap in the literature (Fried & Cramer, 2017). Central symptoms in a network can be considered as viable targets for clinical intervention (Fried & Cramer, 2017), since acting on a central symptom will affect many other symptoms in a network. Third, network structures are an interesting way to explore sex differences individuals (Briganti et al., 2020b): specific tools allow for testing the difference in global connectivity in sub-samples (van Borkulo et al., 2016). Fourth, network analysis allows for retrieving groups of nodes that strongly interact with each other and therefore predict each other: these groups are customarily called domains or communities, since they represent the main aspects of a construct (Briganti et al., 2020a). Community detection is the network equivalent of the exploratory factor analysis which is more established in the latent variable psychometric literature (Golino & Epskamp, 2017). Researchers have used communities to study simpler network structures and therefore focus on specific interactions among communities (Briganti et al., 2019): this approach is known as the generalized network approach (Epskamp et al., 2017).
Inspired by the insight that network theory can bring to the complex construct of abnormal child behavior (and therefore to ADHD itself), this study aims to investigate items from the CTRS-R:S as a network of mutually influencing components in a sample of 525 Belgian children in primary school.
This study is organized as follows. First, a network structure will be estimated with Bayesian methods (Williams & Mulder, 2019) from the CTRS-R:S and central symptoms as well as communities will be identified; then, by applying topological overlap a smaller network will be retained that is composed of only the central symptoms that best represent their own community. Second, the small network will be estimated to study the connections that are supported by a considerable amount of evidence. Third, sex differences in the female and male sub-samples will be investigated. Fourth, the results and the implications of this study for future research will be discussed in light of relevant literature, as well as highlighting a few limitations of our study.
Method
Participants and data collection
Data from this study were retrieved from different Belgian primary schools in the French-speaking community of Wallonia. Teachers completed the CTRS-R:S by filling in age, sex, the date of birth. Since the questionnaires were on paper, the data were encoded on Excel. Our study protocol was approved by the Ethical Committee of the Brugmann Teaching Hospital in Brussels (CHU Brugmann, protocol B0772020000052/I/U Modeling of interactions between ADHD symptoms of the CTRS-R: S scale). A consent form was signed by participants in the study.
Measurement
The CTRS-R:S is composed of 28 items divided into 4 subcategories: ADHD index, Oppositional, Excitable-impulsive, and Cognitive-Inattentive Problems. Each item has a score ranging from absent (0), intermediate (1,2) to severe (3). There are no reverse-scored items in the CTRS-R:S.
Network analysis
Software and packages
We used the software R for statistical computing (version 3.6.1, open source, available at https://www.r-project.org/). The package used to carry out the analysis is BGGM (Williams & Mulder, 2019). The software JASP (JASP Team, 2019) was used to estimate the descriptive statistics for the data set.
Network estimation
We estimated a Gaussian Graphical Model (GGM), a partial correlation network, with Bayesian methods (Williams & Mulder, 2019) for the 28 items in the CTRS-R:S following the protocol of a recent empirical study that applied the same method (Briganti et al., 2020c). The GGM is calculated as the inverse-covariance matrix: it is a network that includes a set of nodes that correspond to the symptoms and a set of edges that connect the nodes in the network (Epskamp & Fried, 2018). The estimation method used in this paper is optimized for ordinal data (Albert & Chib, 1993). If two nodes are connected, that means they are conditionally dependent given all other nodes in the network (i.e., their partial correlation is nonzero).
In the network of abnormal child behavior, if two symptoms X and Y are connected, it means for instance that if the observed group scored high on symptom X, then the observed group is also more likely to score high on symptom Y, and vice versa, controlling for other nodes in the network (Briganti et al., 2018). Each edge in the network has a weight representing the strength of association between two symptoms; edges can be positive or negative whether the association is positive or negative.
The network estimation with Bayesian methods allows for providing evidence for the hypothesis that best predicts the observed data. For instance, when testing for conditional dependence relationships among nodes, providing a Bayes Factor (BF) higher than 20 as a threshold for model selection is associated with strong evidence (Kass & Raftery, 1995). For the network estimation in this paper, a BF of 30 was used to retrieve connections that are supported with a relatively strong amount of evidence.
Network inference and topological overlap
Centrality
Strength centrality estimates were estimated for each of the 28 items in the CTRS-R:S. Strength centrality is understood as a measure of interconnectedness of a given item in the overall network, and is estimated as the absolute sum of all edges (Boccaletti et al., 2006). The higher the centrality, the higher the importance of the item in the network (Briganti et al., 2018).
Community detection
The spinglass algorithm (Reichardt & Bornholdt, 2006) was used to retrieve the number of communities in the CTRS-R:S network. A community is understood as a set of nodes with many edges inside it and few edges outside it (i.e., among nodes inside the community itself and the rest of the graph). The spinglass algorithm is rather straightforward (i.e., does not rely on a large set of parameters) and has therefore been widely adopted in the network literature (Briganti et al., 2018). The spinglass algorithm was performed a hundred times on the network estimates, and we retained the average result to define each symptom as a member of a given community.
Topological overlap
The most interconnected symptoms in each community were identified, and the data related to those eight symptoms were isolated to build a new data set to estimate an additional GGM with Bayesian methods. This solution, that is needed to address the redundancy in network structures, has been defined as topological overlap (Briganti et al., 2020a; Fried & Cramer, 2017). The smaller network can be investigated more thoroughly, as only connections among symptoms that are meant to represent their own community, and therefore a broad aspect of abnormal child behavior, are included.
Sex differences
We compared the Bayesian GGMs estimated from the female and male sub-samples of our data sets to detect sex differences in the network structures as performed in previous studies (Briganti et al., 2020c). The Kullback-Leibler Divergence (KLD) is used as a measure for sex difference. KLD can be considered as the “distance” between networks is understood as how far two multivariate normal distributions are from one another. In other words, KLD represents the difference between two node predictability distributions (Williams et al., 2020).
Results
Participants
Descriptive statistics.

Item network
The item network from the 28 items of the CTRS-R:S is shown in Figure 1. The 28 items from the scale are represented as nodes interacting with each other through edges (the connections among nodes). Positive edges (depicting positive partial correlations) are blue, and negative edges (depicting negative partial correlations) are red. The corresponding thickness and color saturation of the edges represents its edge weight (the importance of the partial correlation). Item network from the CTRS-R:S. In the network, each node represents an item from the CTRS-R:S and edges (connections among nodes) are partial correlations between items with a Bayes Factor of 30 (relatively strong amount of evidence supporting the existence of the partial correlation.).
We will hereby describe some of the relevant connections in the network. Item 8 (“Poor in spelling”) is strongly connected to item 13 (“Not reading up to par”); item 25 (“Fails to finish things he/she starts”) is strongly connected to item 26 (“Does not follow through on instructions and fails to finish schoolwork”); item 17 (“Has difficulty waiting his/her turn”) to item 23 (“Interrupts or intrudes on others”).
Although the item network is overall positively connected, some negative connections are also present in the item network; item 16 (“Only pays attention to things he/she is really interested in”) is negatively connected to item 20 (“Temper outbursts; explosive, unpredictable behavior”).
Centrality
Centrality estimates as standardized z-values for the item network are represented in Figure 2. We will hereby describe the three items with the highest and lowest centrality estimates. Item 15 (“Argues with adults”) has the highest centrality (1,42). Item 28 (“Restless, always up and on the go”) and item 27 (“Excitable, impulsive”) also have a high centrality (respectively, 1,32 and 1,09). Items 11 (“Leaves seat in classroom or in other situations where remaining seated is expected”), 24 (“Has difficulty playing or engaging in leisure activities quietly”), and 10 (“Spiteful or vindictive”) have the lowest centrality, respectively, 0,18, 0,42, and 0,44. Centrality estimates as standardized z-values for the item network from the CTRS-R:S.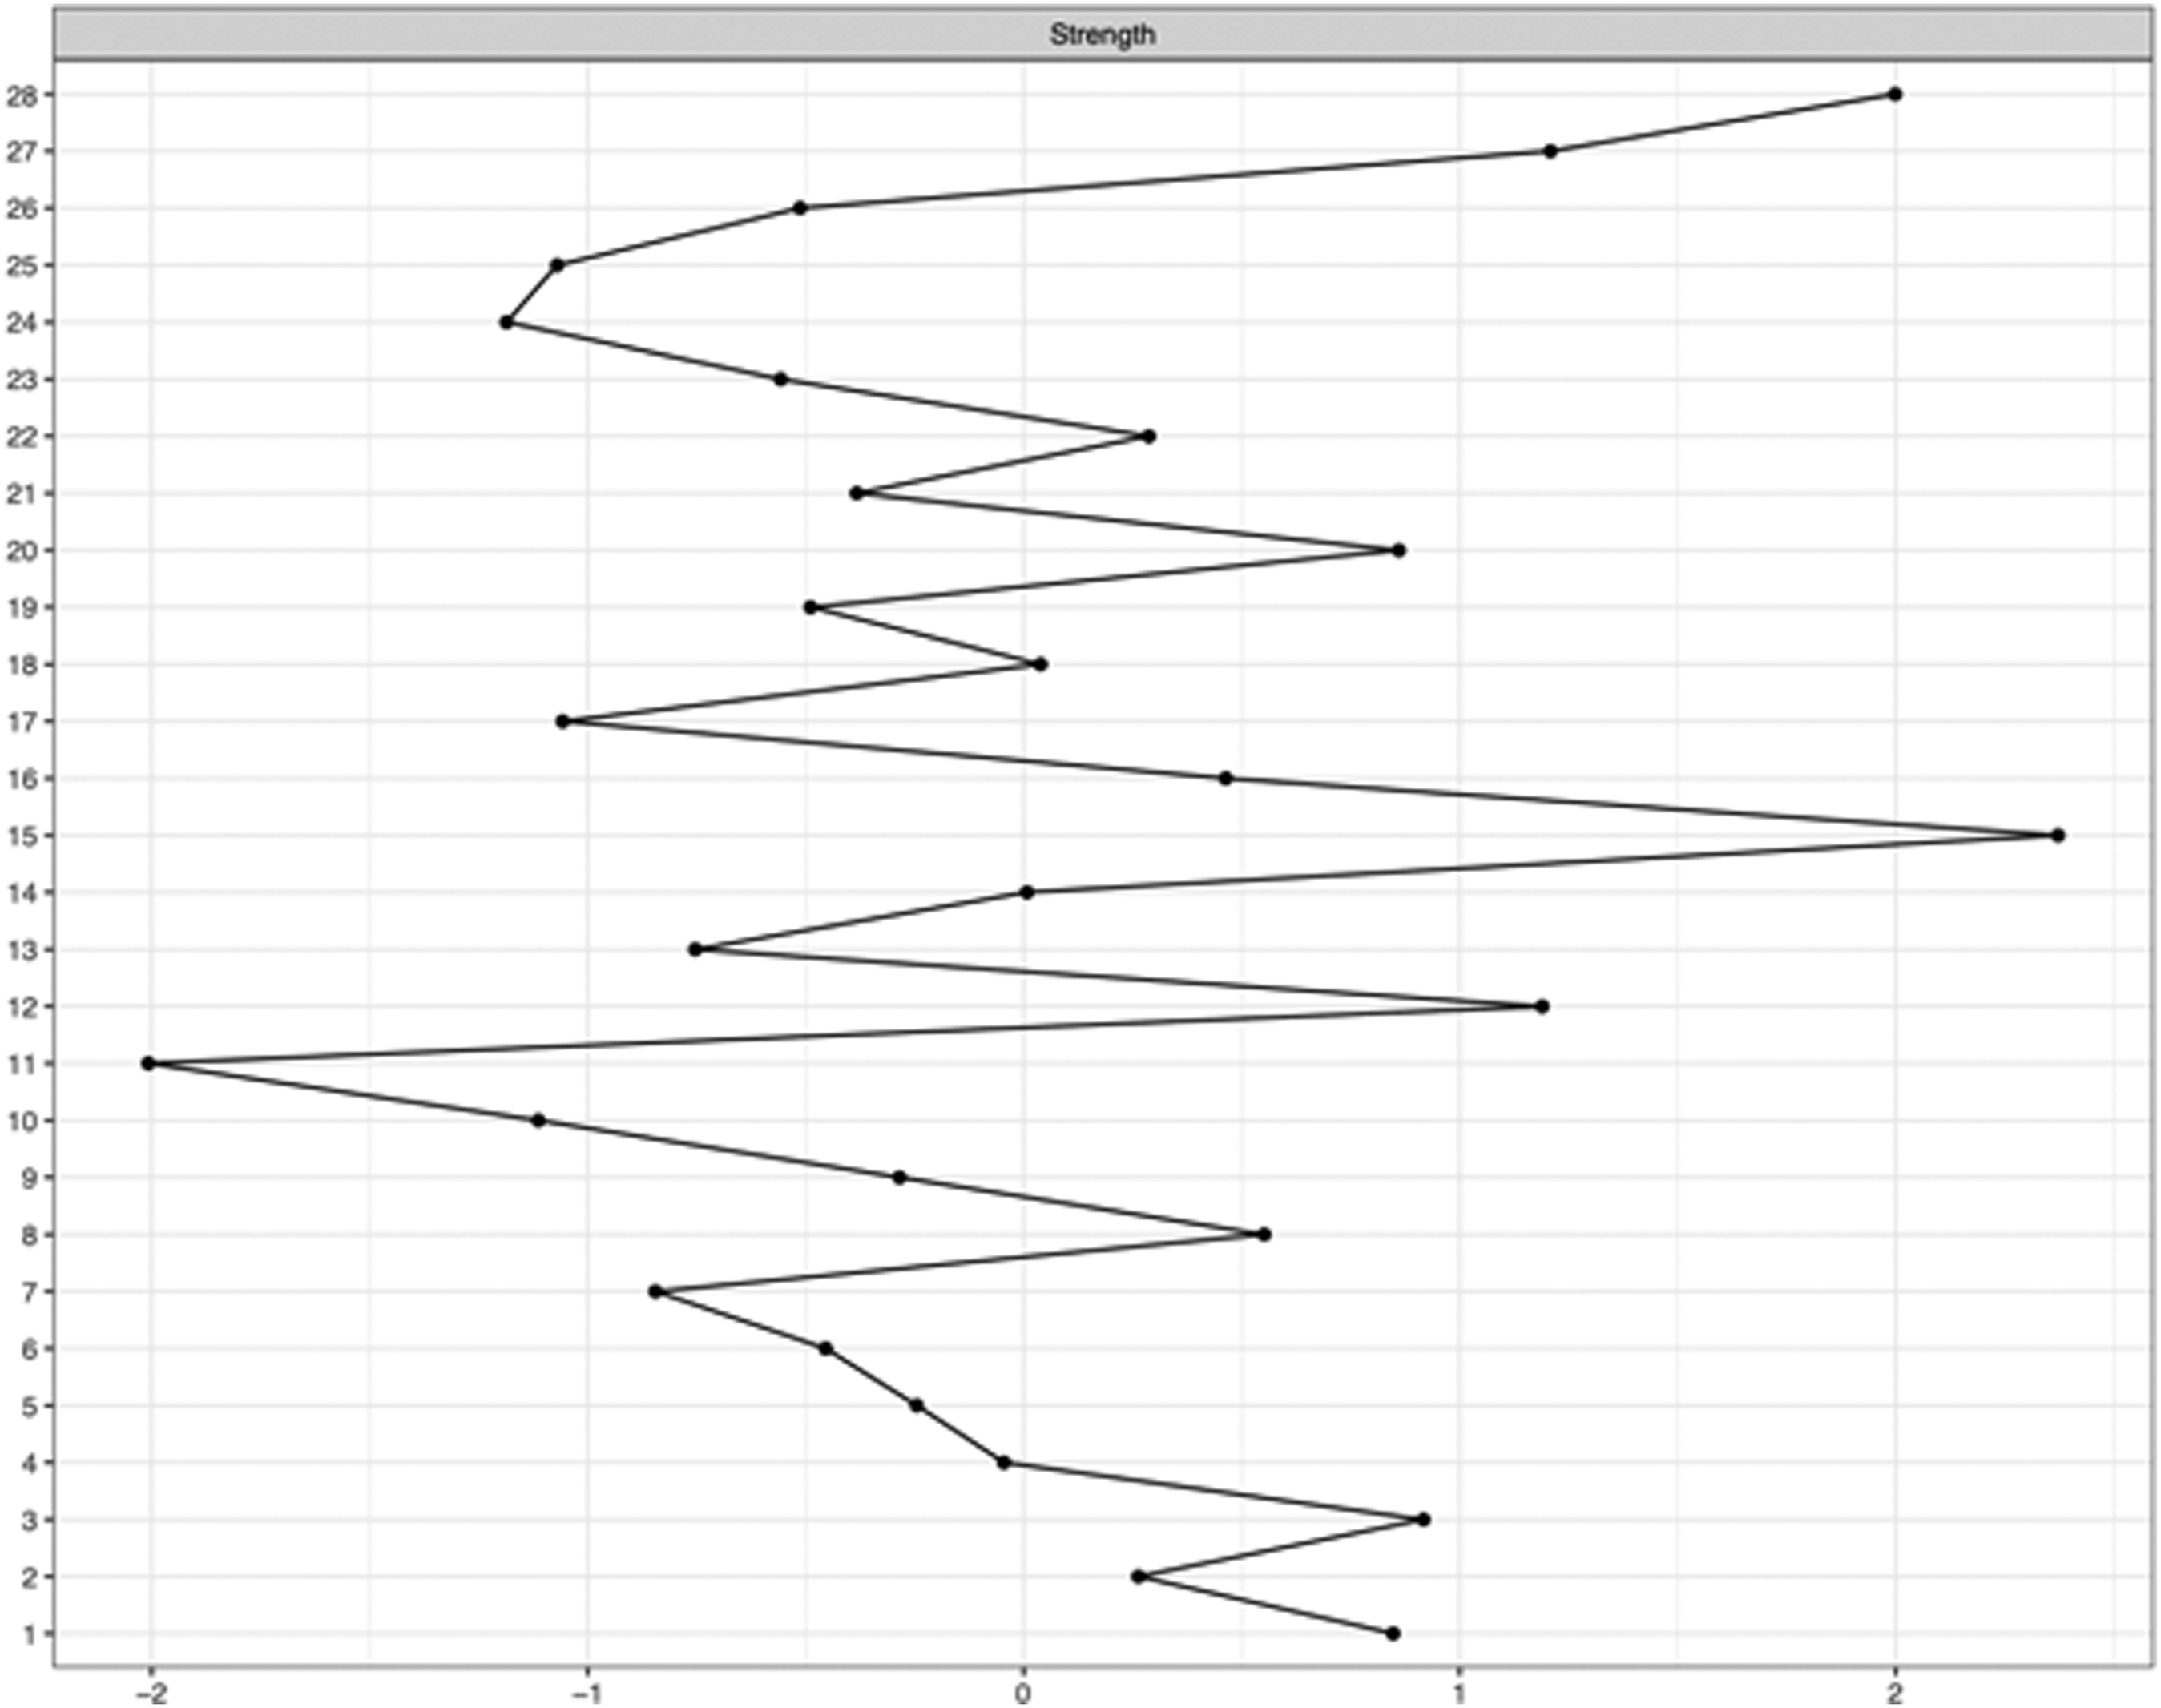
Sex differences
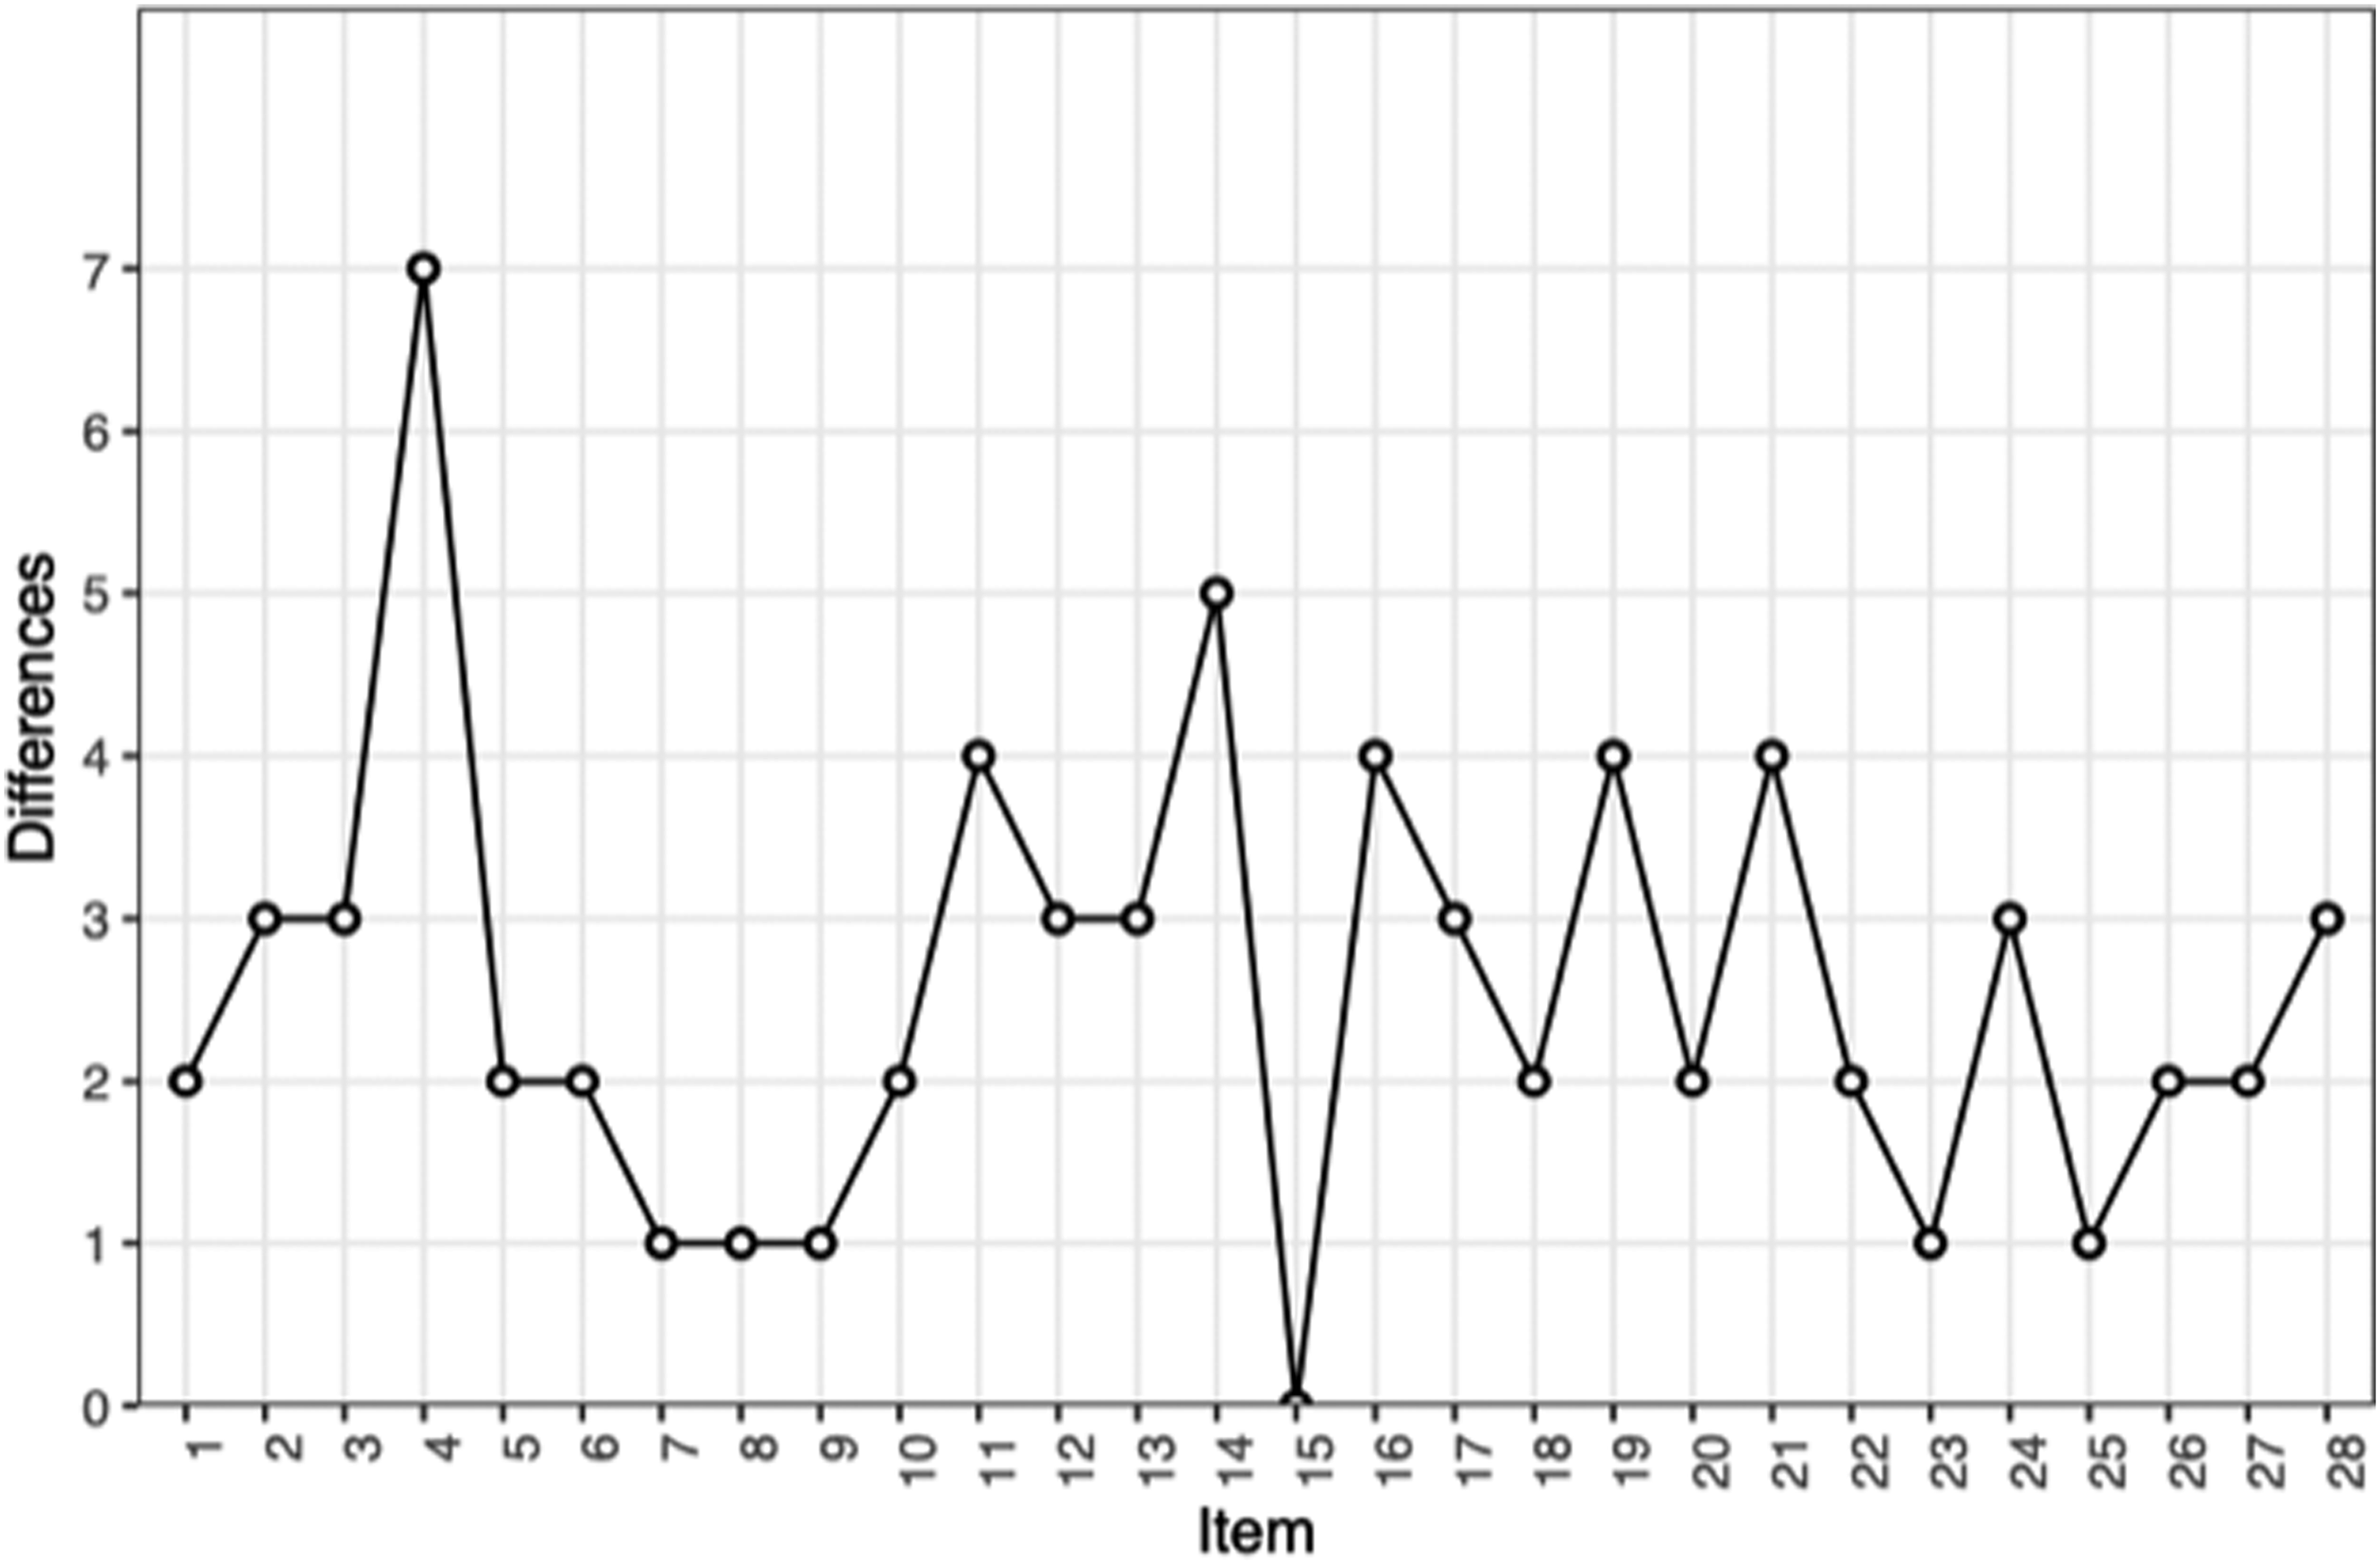
Sex differences between female and male subjects are represented in Figures 3 and 4. The network structures are overall statistically different in female and male subjects (KLD= 4.15; p = 0). Figure 4 reports the number of statistically different edges. Item 4 (“Forgets things he/she has already learned”) represents the highest number of different edges in that regard. Sex differences for the item network. The density is the predictive distribution of JSD, conditional on group equality. The red area corresponds to the chosen α level. Sex differences for the item network: number of different edges per node.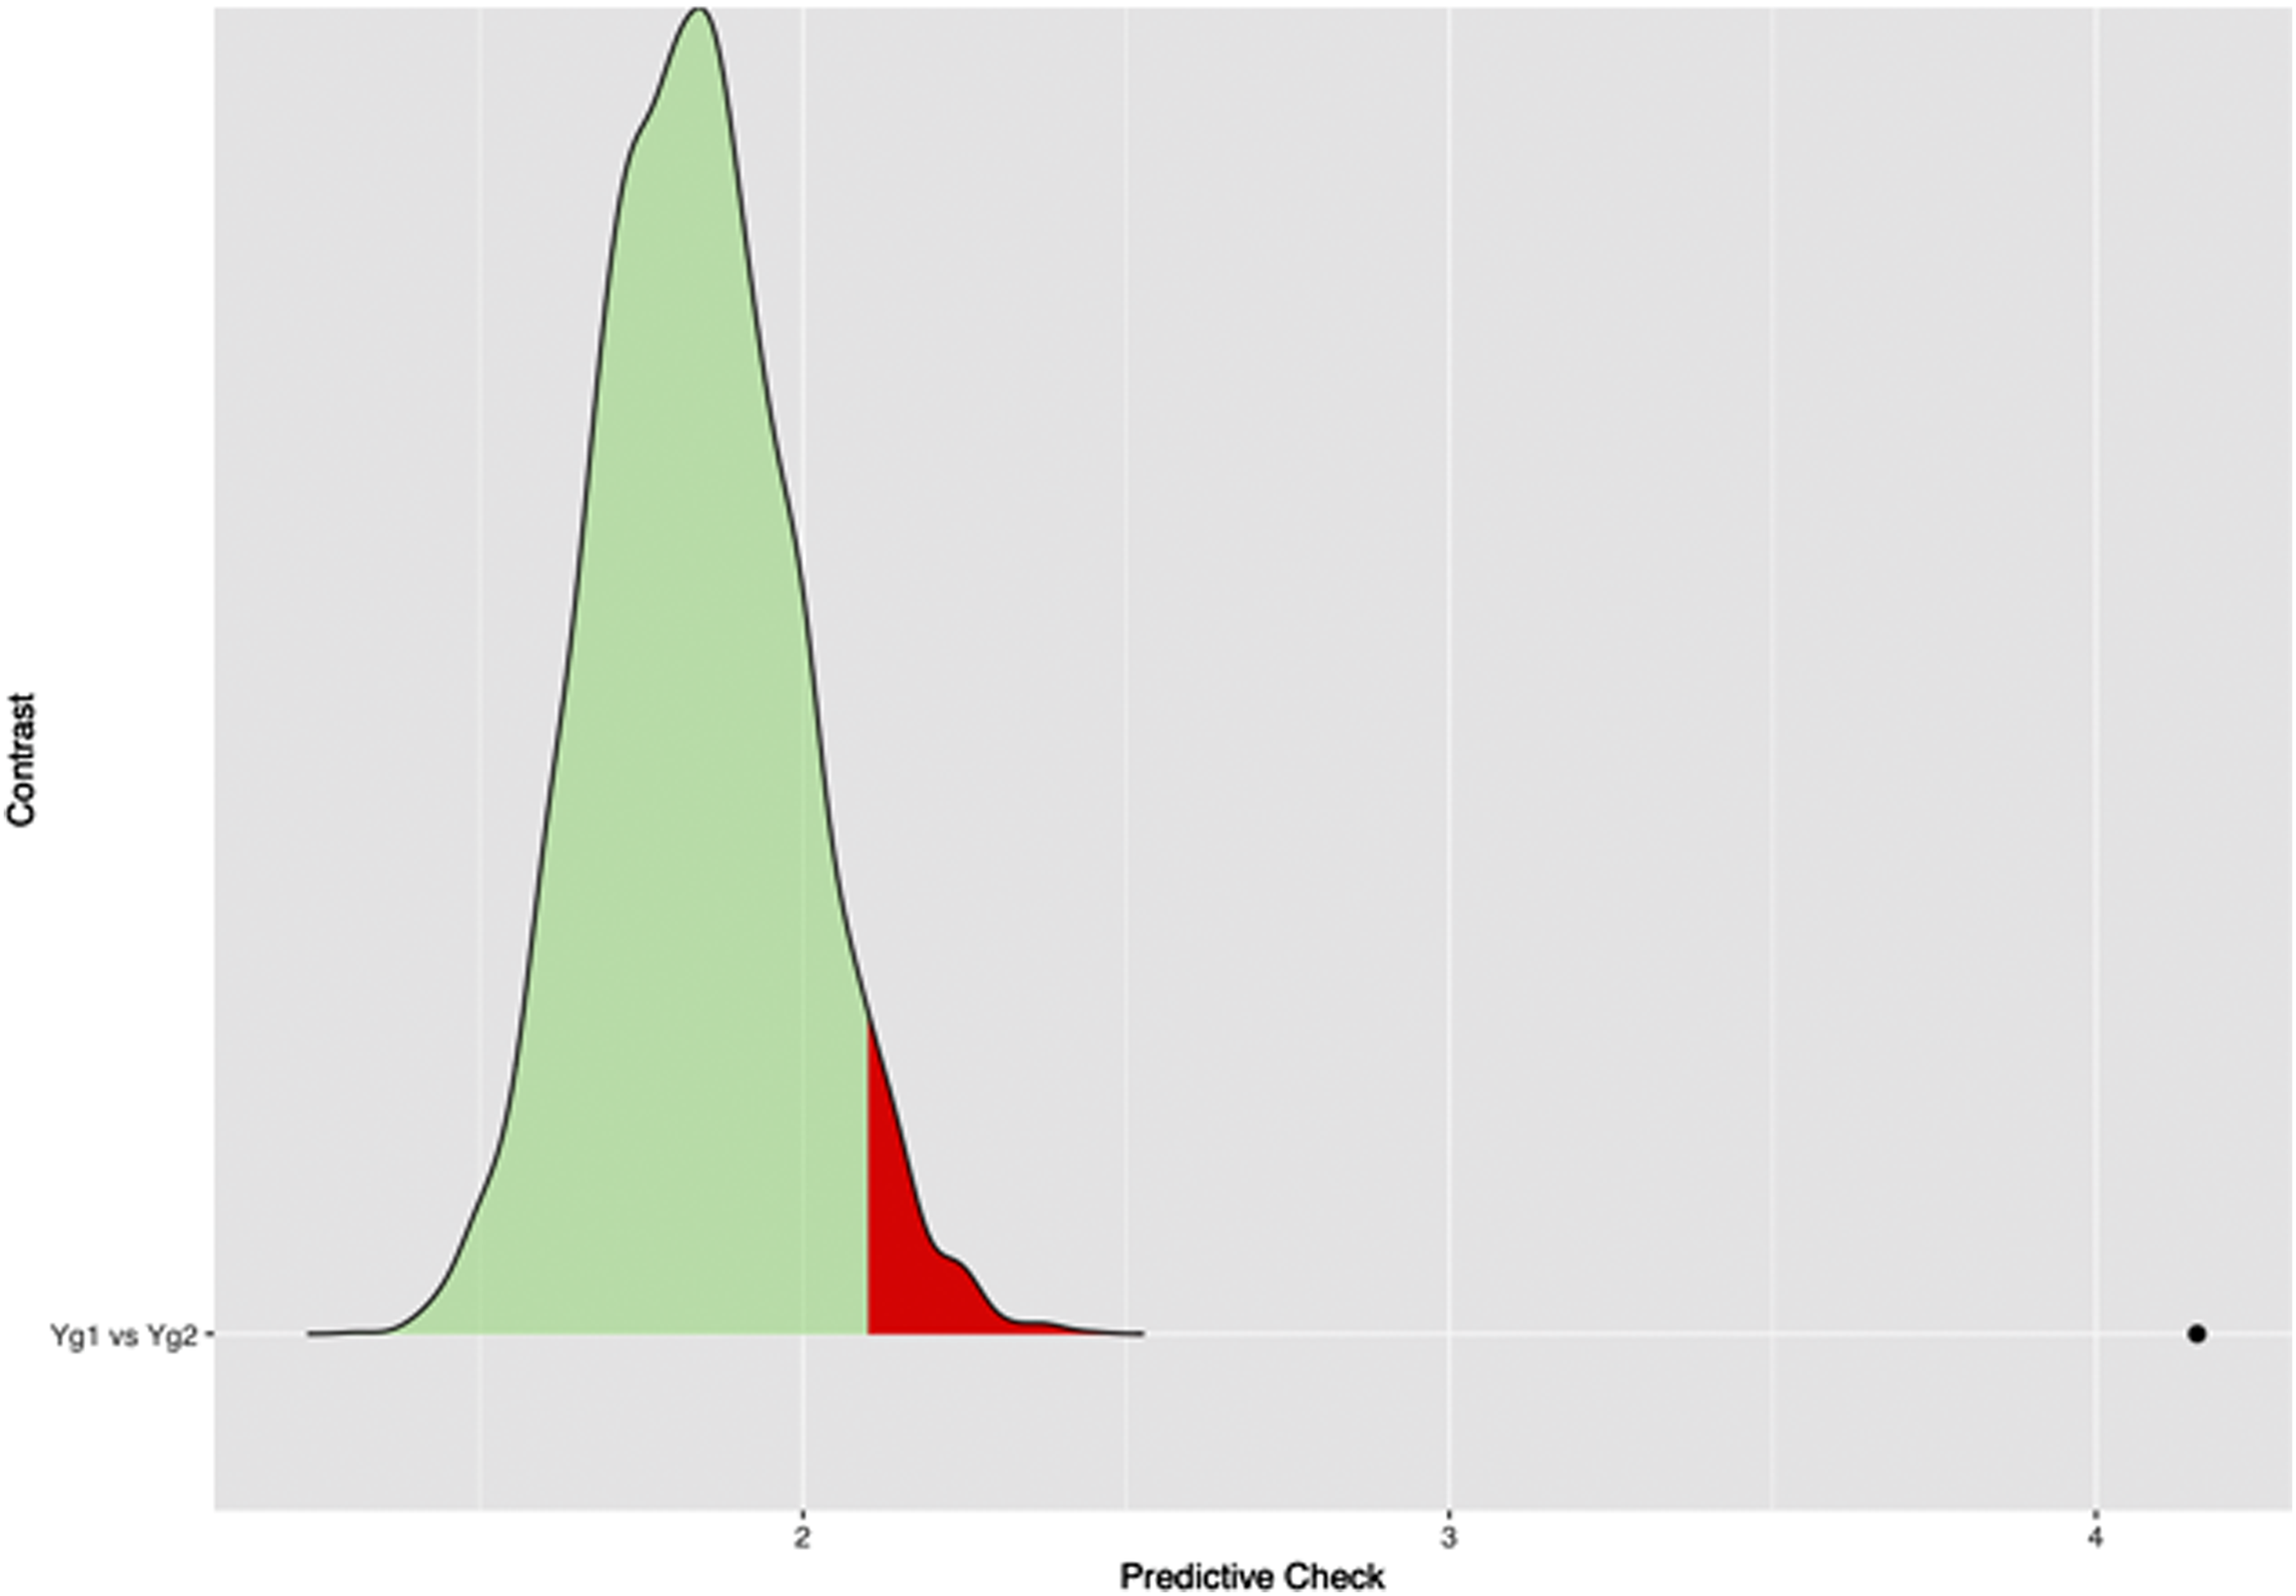
Community detection
The spinglass algorithm identified eight communities in the item network.
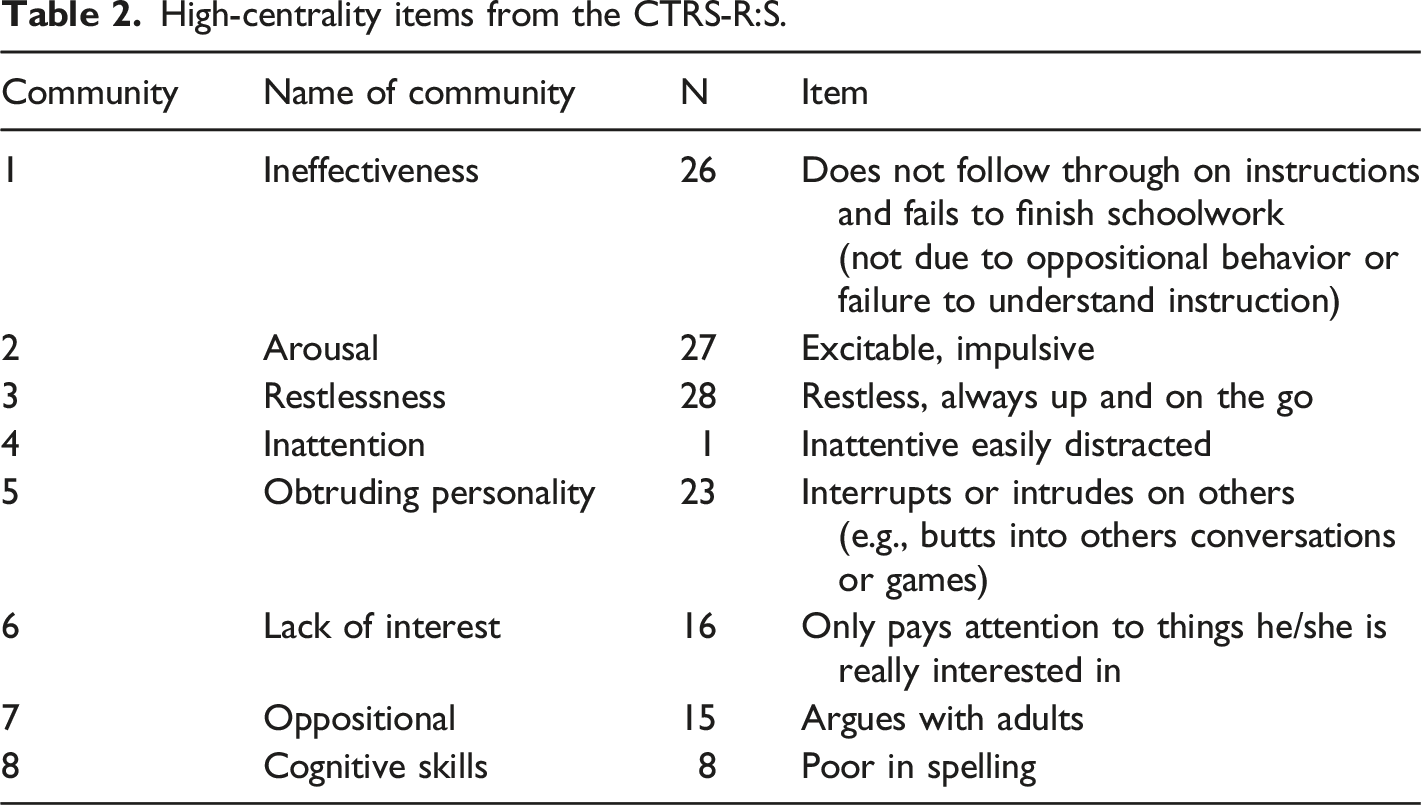
High-centrality items from the CTRS-R:S.
Community 1 (which includes items 25 and 26) was called Ineffectiveness, representing a child’s difficulties to finish a task or to follow instructions. Community 2 (which contains items 11, 20, 21, 24, 27) was called Arousal. Items of this group reflect a spiteful and vindictive child that can present with temper outburst and explosive or impulsive behavior. Community 3 (which is composed of items 3, 7, 9, 12, 28) was named Restlessness. It refers to a hyperkinetic child. Community 4 (which is formed by items 1, 4, 14, 19, 22) was called Inattention and it is composed of items that are meant to measure a child’s attention span and ability to focus. Community 5 (which contains items 17 and 23) was named Obtruding personality, and represents a child’s tendency to interrupt others. Community 6 (which includes items 16 and 18) was called Lack of interest, and measures the child’s ability to become interested in things. Community 7 (which is composed of items 2, 5, 6, 10, 15) was named Oppositional. The name of this community was chosen in reference to the Oppositional sub scale of CTRS-R:S, which is almost identical except for item 5 (which was included in the ADHD index in the original sub scale). Community 8 (which is formed by items 8 and 13) was called Cognitive skills because items represent the child’s difficulty in reading or spelling.
Eight-domain network
A domain network was built based on the centrality estimates and the community detection of the item network. To address the topological overlap of the CTRS-R:S, we chose, for each community, the most interconnected item (that is, the item with the highest centrality estimate) to represent the community. The eight items with the highest centrality are reported in Table 2.
For instance, in Arousal, item 27 (“Excitable, impulsive”) has the highest centrality (= 1.1), which means it is the item that best represents Arousal. Oppositional is represented by item 15 (“Argues with adults”, strength = 1.4).
For instance, item 8 (“Not reading up to par”) represents Cognitive skills.
Figure 5 represents the eight-domain network. Some strong connections in the network are found between the domains Oppositional and Cognitive skills (= 0.56), Restlessness and Oppositional (=0.4), and Lack of interest and Inattention (= 0.29). However, a negative connection is shared between the domains Obtruding personality and Arousal (= 0.37). Domain network for the CTRS-R:S. In the network, each node represents a domain of abnormal child behavior. Community 1 = Ineffectiveness, Community 2 = Arousal, Community 3 = Restlessness, Community 4 = Inattention, Community 5 = Obtruding personality, Community 6 = Lack of interest, Community 7 = Oppositional, Community 8 = Cognitive skills.
It is worth noting that in our data set, the sum scores obtained by summing up for each subject all items of the CTRS-R:S are strongly related to the sum scores obtained by summing up only the central item (Pearson’s ρ = 0.98).
Discussion
This is to our knowledge the first study to address abnormal child behavior items from the CTRS-R:S as a network of mutually influencing entities. Previous studies analyzed ADHD as networks following the DSM 5 diagnostic criteria (Martel et al., 2016; Preszler & Burns, 2019; Silk et al., 2019). In this study, we used another well-known screening tool for abnormal child behavior as input for the network model.
Furthermore, we used the recently introduced Bayesian approach for the estimation of partial correlation networks (Williams & Mulder, 2019). The estimation of a GGM with Bayesian methods allows for setting a BF, that is, a cut-off value that selects a network model with the conditional dependence relationships whose existence is supported by a strong amount of evidence. In this study, a BF of 30 was used for network estimation, which is associated with a strong amount of evidence supporting the existence of the partial correlation (Kass & Raftery, 1995).
The network structure is overall positively connected: this finding builds up on those from previous studies that focused on the smaller construct of abnormal child behavior (Martel et al., 2016; Preszler & Burns, 2019; Silk et al., 2019). Strong edges are often shared between items that present a similar meaning: some examples are the edges between items 8 (“Poor in spelling”) and 13 (“Not reading up to par”), 25 (“Fails to finish things he/she starts”) and 26 (“Does not follow through on instructions and fails to finish schoolwork”), 17 (“Has difficulty waiting his/her turn”), and 23 (“Interrupts or intrudes on others”). It is not surprising that such similar items are strongly connected: these items are redundant. Other examples of redundant items in the network structure are items 3 (“Restless in the “squirmy sense”), 7 (“Is always on the go”), and 28 (“Restless, always up and on the go”). Redundancy is a common trait of psychometric tools because of the interval validity required to build them from a latent variable perspective (Christensen et al., 2020), and the CTRS-R:S is no exception in that regard.
The presence of negative edges between some items is an interesting result in this study (for instance, between item 5 (“Disturbs other children”) and item 8 (“Poor in spelling”), or between item 16 (“Only pays attention to things he/she is really interested in”) and item 20 (“Temper outbursts; explosive, unpredictable behavior”)). This implies that the construct of abnormal child behavior such as depicted in the CTRS-R:S is heterogeneous, that is, some items are more likely to co-appear than others. This challenges the latent variable model of psychiatric constructs: if the symptoms described by the items in the CTRS-R:S were passive and interchangeable consequences of an underlying latent variable (that is, abnormal child behavior), then they should all be positively connected. Negative connections in the network are a clear indicator that the construct of abnormal child behavior such as represented in the CTRS-R:S is complex, and arises from the different interactions among variables.
Statistically, a negative edge indicates that if the observed group of subjects scores high on X, the observed group is less likely to score high on Y. However, a negative partial correlation may arise between two nodes X and Y if they are both connected to a third node Z and the underlying causal structure is X →Z ←Y : this structure is known as a v- structure or collider, and causes what is known as Berkson’s biais (Berkson, 1946). However, partial correlation networks propose a model where symptoms mutually influence each other, and therefore there is no directed causal relationship that can be uncovered by GGMs; those are analyzed with the help of other models, such as Directed Acyclic Graphs (Briganti et al., 2020b).
In the case of the negative connections in the item network, for instance, item 16 from Lack of interest and item 20 from Arousal are negatively connected, which means that in the observed group, children who lack interest are less likely to have temper outburst, and vice versa. This rejoins the findings of previous ADHD-focused studies, which reported that inattention/cognitive symptoms are overall negatively connected to hyperactivity symptoms (Martel et al., 2016; Silk et al., 2019). From a network point of view, this implies that symptoms from different domains of abnormal child behavior are less likely to be present at the same time in an observed group.
Network analysis also allowed for identifying the most interconnected nodes in the network: in the item network, items 15 (“Argues with adults”, from Oppositional), 28 (“Restless, always up and on the go”, from Restlessness), and 27 (“Excitable, impulsive”, from Arousal) have the highest centrality estimate in the network: this results also rejoins previous ADHD-focused studies (Silk et al., 2019) that identified hyperactivity-related symptoms to have high centrality.
Eight communities (or domains) of abnormal child behavior were detected by the spinglass algorithm, as opposed to the original scale which is only meant to present four factors (Conners et al., 1998). Each community is composed of strongly connected nodes. However, some edges are shared between nodes from different communities, which means that the different communities of abnormal child behavior present some meaningful interactions.
In the domain network, Oppositional is similar to homonym sub scale in the original CTRS-R:S scale, and differ only for item 5 (“Disturbs other children”) which belongs to the community in our network. Items 25 (“Fails to finish things he/she starts”) and 26 (“Does not follow through on instructions and fails to finish schoolwork”) from Ineffectiveness originally belong in the ADHD index sub scale from the CTRS-R:S. Cognitive skills is formed by items 8 (“Poor in spelling”) and 13 (“Not reading up to par”), both originally included in Cognitive problems/inattention sub scale. Some communities differ from the original dimensions. Lack of interest contains item 16 (which originally belonged to ADHD index) and item 18 (which originally belonged to the Cognitive problems/inattention sub scale) although these two items have very similar meaning.
Because of the redundancy among items from the CTRS-R:S (Briganti et al., 2020a), and the difficulty on interpreting a network of items (Briganti et al., 2019), we estimated a network model of the eight domains identified by the spinglass algorithm. Our domain network consists of the eight items of different communities that reported the highest centrality estimate, that is, are most interconnected within their own domain. This reduced network is overall easier to interpret: moreover, since the sum scores of the entire scale very strongly correlated to the sum scores of the central items (=98%), this opens the possibility of using network analysis to build shorter psychometric tools. A simpler screening tool (containing the most relevant items) would help teachers primarily detect children with abnormal behavior to improve the care and the management of the disorder and stem complications and comorbidities.
In the domain network, for instance, Oppositional shares the strongest edge in the network with Cognitive skills: this not only indicates that these two domains predict each other, but also that both are highly connected community in the construct of abnormal child behavior as represented in the CTRS-R:S. This is interesting, since both do not appear in the diagnostic criteria for ADHD; for instance, Oppositional represents some diagnostic criteria for the ADHD (American Psychiatric Association, 2013): it includes similar symptoms to ODD, for example, like losing temper or being vindictive (Ogundele, 2018). The connection between Oppositional and Cognitive skills because oppositional children are expected to feel a greater frustration and have more difficulties in learning to read and to spell. On the other hand, spelling or learning difficulties would cause frustration in oppositional children. This association is well known in ADHD children with oppositional features but not in ODD disorder itself (Clark et al., 2002; Fergusson & Horwood, 1995; Mayes & Calhoun, 2006; Rapport et al., 1999). The same happens with problems with executive functions (Klorman et al., 1999), as well as reading difficulties, which are not characteristic of ODD when one controls for ADHD (Willcutt & Pennington, 2000). This discordance should be clarified in future researches.
Overall, this shows how considering a larger and complex framework for abnormal child behavior can help to solve the heterogeneity of the symptomatology ADHD and related disorders (e.g., ODD, CD, DBP). From this perspective, the CTRS-R:S proves an excellent tool assess this larger framework.
We also tested for sex differences between the network structures from female and male subjects. This is not entirely new, since it is well-known that young female and male subjects present different ADHD symptomatology (Arnett et al., 2015): in particular more males than females receive a clinical diagnosis of ADHD (Mowlem et al., 2019). Females are more likely to present a larger increase in symptomatology in early adolescence while males are more likely to present with ADHD symptoms since childhood (Murray et al., 2019). Our study brings a complementary approach to sex differences in abnormal child behavior using a network perspective.
The results of this study should be met with a number of limitations. First, because this study aimed to study a network structure estimated from a non-clinical sample, the data from this study was collected in a sample of French-speaking Belgian primary school students. We do not know whether within the observed group there are children diagnosed with and/or treated for ADHD. The network structure may not replicate in other samples, although our results align with other network studies that used different psychometric tools (Martel et al., 2016; Silk et al., 2019). Second, the CTRS-R:S was of course completed by the teacher themselves, so there may be some bias in how the subjects were evaluated depending on the teacher that did the evaluation. Third, we used BFs to select a network structure that was supported by a strong amount of evidence; however, BFs are known for their sensitivity to the assumptions in the parametric model and the choice of priors (Kass & Raftery, 1995): however, in the case of GGMs estimated through Bayesian methods, the Wishart prior is always used (Williams & Mulder, 2019), which is likely to improve the replicability of results. Fourth, complete screening tools should require evaluation made by parents: future studies may include such tools (Conners et al., 1998). Fifth, the network structures under investigation in this study are not directed: it is therefore impossible to tell whether a symptom or domain of abnormal child behavior causes or is caused by another: this can only be addressed with DAGs.
Conclusion
Abnormal child behavior is a complex entity including ADHD among others disorders. However, well-known screening tools such as the CTRS-R:S go beyond ADHD and measure the wider construct of abnormal child behavior. This construct can be understood as a complex system of mutually influencing entities, that is why the aim of this study was to investigate the items of the CTRS-R:S as a psychological network to gain insight as to how the different parts of the construct interact. Further studies may endeavor to replicate our findings in other samples as well as extend the network approach to other screening tools.
Footnotes
Declaration of conflicting interests
The author(s) declared no potential conflicts of interest with respect to the research, authorship, and/or publication of this article.
Funding
The author(s) received no financial support for the research, authorship, and/or publication of this article.