
Abstract
Objectives:
To provide a sound foundation for public health policy and practice, scientific work must address priority topics and reach appropriate audiences. This analysis provides an evaluation of a large public health scientific publication portfolio. We explored the relevance and impact of a decade of Centers for Disease Control and Prevention (CDC)–authored publications.
Methods:
We used Science Clips, a CDC library database, to identify 34 104 scientific publications published from 2014 through 2023 with ≥1 CDC-affiliated author. To identify public health topics, we applied a large language modeling framework using BERTopic to publication titles and abstracts. We obtained bibliometric indicator data from Altmetric, Dimensions, and BMJ Impact Analytics. We assessed the percentage of publications with online attention, academic citations, and policy citations; the median Altmetric Attention Score; and the median number of academic citations by topic area.
Results:
Of CDC-authored publications published during 2014-2020, 94.6% were cited by academic articles and 52.4% were cited in clinical guidance or policy. Of those published during 2014-2023, 83.8% garnered online attention. Publications clustered into 46 public health topics. Fungal infections had the highest median number of academic citations (36.5 per publication), mining safety and health had the highest proportion of articles with policy citations (92.5%), and substance abuse or opioids received the highest median Altmetric Attention Score (14.0). More than one-quarter of topics ranked in the top 5 for ≥1 of the 3 indicators.
Conclusions:
CDC-authored scientific publications in this collection addressed an array of public health topics and demonstrated resonance in academic and policy arenas and with the public. Evaluating publication portfolios can strengthen science, policy, and communications partnerships.
High-quality scientific evidence can inform public health policy and practice. 1 The Centers for Disease Control and Prevention (CDC), an agency in the US Department of Health and Human Services, is known as a science-based, data-driven, federal government agency with a mission to protect public health. 2 Manuscripts with CDC-affiliated authors are subject to rigorous internal review to ensure high quality before submission to journals.3,4
CDC scientific publications are expected to address strategic priority areas, including public health emergency responses. 5 Therefore, a programmatic need exists to evaluate whether scientific publications are addressing priority topics and reaching appropriate audiences. Bibliometric methods are available to evaluate a publication’s reach and impact, each of which has strengths and weaknesses. 6 Categorizing publications by topic can be labor and time intensive, involving manual review and updates to search terms as scientific fields evolve. These challenges are amplified when evaluating a large number of publications from a large organization such as CDC.
To explore the impact and topic areas of CDC’s scientific publications from 2014 through 2023, we developed a concise set of bibliometric analyses as indicators of possible impact in conjunction with the application of a large language modeling technique. Our intent was to identify opportunities to increase scientific and societal impact and promote strategic science at the agency.
Methods
Data Sources
We conducted a bibliometric analysis and reported our results using the BIBLIO checklist. 7 We identified scientific publications published from January 1, 2014, through December 31, 2023, with ≥1 CDC-affiliated author by using CDC Science Clips, a public-facing database maintained by the Steven B. Thacker CDC Library. 8 For this analysis, we used data available as of May 3, 2024. For publications with a digital object identifier (DOI) or a PubMed identifier (PMID), we obtained Altmetric Attention Scores, the number of Dimensions citations, and the number of policy citations from Altmetric as of July 2, 2024 (explorer.altmetric.com; Digital Science). In addition, for these same publications, we obtained the number of policy and clinical guidance citations from BMJ Impact Analytics as of July 2, 2024 (BMJ and Overton).
We deduplicated Altmetric records by using Altmetric URLs (uniform resource locators) and then merged these records with records obtained from Science Clips, first matching on DOI and then, for unmatched records, by PMID. We subsequently merged BMJ Impact Analytics data to the combined dataset by DOI only. The final dataset included all Science Clips data from the analytic period regardless of the availability of attention or citation data.
Topic Modeling
To identify publication topic areas, we used BERTopic version 0.16.0. 9 BERTopic finds topic clusters by using pretrained large language models (LLMs) to create embeddings. We embedded publication titles and abstracts by using the SPECTER LLM, which was trained using titles, abstracts, and co-citation networks of scientific publications. 10
For dimensionality reduction, we used the Uniform Manifold Approximation and Projection (UMAP) method. 11 To generate topic clusters, we used Hierarchical Density-Based Spatial Clustering of Applications with Noise (HDBSCAN). 12 For these steps, we determined parameters that optimized 3 equally weighted measures: coverage, or the percentage of publications assigned to clusters; the relative validity score, which assesses cluster density as a measure of quality 13 ; and evenness, or the normalized difference between the number of publications in the largest and smallest clusters (eText in the Supplement). We identified optimal parameters by using a grid search of 3600 unique combinations of UMAP parameters (number of neighbors, number of dimensions, and minimum distance) and HDBSCAN parameters (minimum cluster size and minimum samples), while holding the initial random state of UMAP constant. For UMAP, we used the following parameters: number of neighbors = 25, number of dimensions = 50, minimum distance = 0. For HDBSCAN, we used the following parameters: minimum cluster size = 175, minimum samples = 10. The final model, which was the highest scoring model for this grid search (overall score = 0.72), gave us a coverage of 78% (n = 26 548), a relative validity score of 0.50, and an evenness of 0.89. By the end of these steps, we either assigned publications to a topic cluster or categorized them as unassigned to any cluster.
The remaining steps of the pipeline identified keywords associated with each cluster. For the vectorizer step, we used CountVectorizer with English stop words, a minimum frequency of 2, and an n-gram range of (1,3). We used the default settings for the c-TF-IDF step, which identifies the tokens that appear more frequently in each cluster, to generate each cluster’s keywords. Finally, we added a KeyBERT-inspired step to refine keywords. By the end of these steps, each topic cluster was described by a list of 10 representative keywords. To visualize our clusters, we used a UMAP model with number of dimensions = 2 but retained clustering results and other UMAP parameters from the full-size model.
Model Quality Assessment
We used 2 stages of review to assess the quality of the topic clusters produced by our topic model (eTable 1 in the Supplement). Our review process included 8 multidisciplinary coauthors serving as reviewers. In the first stage, 4 reviewers (J.O., M.K., B.Y., M.R.) created short topic labels that described each cluster. Two reviewers (J.O., B.Y.) assigned topic labels based on representative keywords, while 2 reviewers (M.K., M.R.) assigned topic labels based on the content of publications contained within the cluster. These 4 reviewers then met to reconcile and create provisional topic labels for each cluster. In the second stage, 4 reviewers (C.K., E.M., K.W., B.Z.) participated. We randomly divided the clusters in half and chose 10 random publications from each cluster. For both sets of randomly selected publications (n = 230; 10 from each of 23 clusters), 2 reviewers were tasked to assign each publication to a topic label from the set of provisional topic labels created for each cluster in the first step. For the first set of clusters, mean concurrence between the model and human reviewers was 78% (reviewer A: 77%, n = 177; reviewer B: 80%, n = 184), while the concurrence of the human reviewers with each other was 80% (n = 187). For the second set of clusters, mean concurrence between the model and human reviewers was 75% (reviewer C: 73%, n = 169; reviewer D: 77%, n = 178), while the concurrence of the human reviewers with each other was 84% (n = 193). Concurrence between reviewers was comparable with their concurrence with results from the topic model. We also used this stage to inform revisions to topic labels to better reflect the publications in each cluster (eTable 1 in the Supplement).
Impact Indicators
We used data from Altmetric and BMJ Impact Analytics to analyze metrics for 3 areas of impact: academic citations, policy and clinical guidance citations, and online attention.
Academic citations are a traditional measure of scientific impact, reflecting the influence and reach of an article’s scientific argument or evidence within its field. To assess citation impact, we collected data on the number of citations recorded in Dimensions for publications indexed in Altmetric Explorer. Dimensions is a bibliometric database that tracks academic citations (dimensions.ai; Digital Science). We assessed the following 2 metrics: the percentage of CDC-authored publications published from 2014 through 2020 that had received any academic citations and the median number of academic citations in each public health topic during the same period.
Policy and clinical guidance citations can be used to assess how an article’s scientific evidence is adopted and applied in shaping policy decisions or clinical recommendations. To assess this measure of broader societal impact, we collected data for each publication on the number of Altmetric policy citations and the number of policy or clinical guidance citations in BMJ Impact Analytics. We used 2 sources to maximize coverage of types of guidance documents, especially of clinical guidance documents available through BMJ Impact Analytics, which, at the time of our analysis, were not tracked by Altmetric. We coded a publication as having a policy citation if it appeared in either database with at least 1 citation for either a policy or clinical guidance document. This approach ensured that our percentage metric reflected unique publications and mitigated the risk of double counting. We used these data to calculate the percentage of CDC-authored publications from 2014 through 2020 that received any policy citations in either Altmetric or BMJ Impact Analytics and reported these percentages by public health topic.
Citations take time to accumulate after publication of scientific work. Previous literature shows that counts of academic and policy citations tend to stabilize approximately 2 or 3 years after publication.14,15 When we assessed academic and policy citations, we limited our dataset to articles published from 2014 through 2020, allowing for a 3-year lag. We justified this decision by evaluating the mean and distribution of the number of academic and policy citations by publication year, which appeared stable for 2020 publications (eFigure 1 in the Supplement).
Attention indicators assess whether information about an article is disseminated through such outlets as news media, social media, online forums, and others. As a potential indicator of broader societal impact, we collected data on the Altmetric Attention Score, available through Altmetric Explorer, for each publication. We calculated the percentage of all CDC-authored publications that received attention (defined as an Altmetric Attention Score >0) and the median Altmetric Attention Score for CDC-authored publications in each public health topic.
This activity was reviewed by CDC, deemed non–human subjects research, and conducted consistent with applicable federal law and CDC policy.
Results
From January 1, 2014, through December 31, 2023, CDC authors published 34 104 scientific journal articles indexed in Science Clips, or an average of 3410 articles per year (range, 2963-3591). Of these, we obtained data from Altmetric for 33 987 (99.7%) articles and from BMJ Impact Analytics for 14 121 (41.4%) articles.
Of the 24 208 articles published from 2014 through 2020, with time to accrue academic and policy citations, 94.6% (n = 22 896) received at least 1 academic citation and 52.4% (n = 12 681) received at least 1 policy citation by the date of our analysis. Of all 34 104 publications (2014-2023), 83.8% (n = 28 595) received online attention in Altmetric (Figure 1).
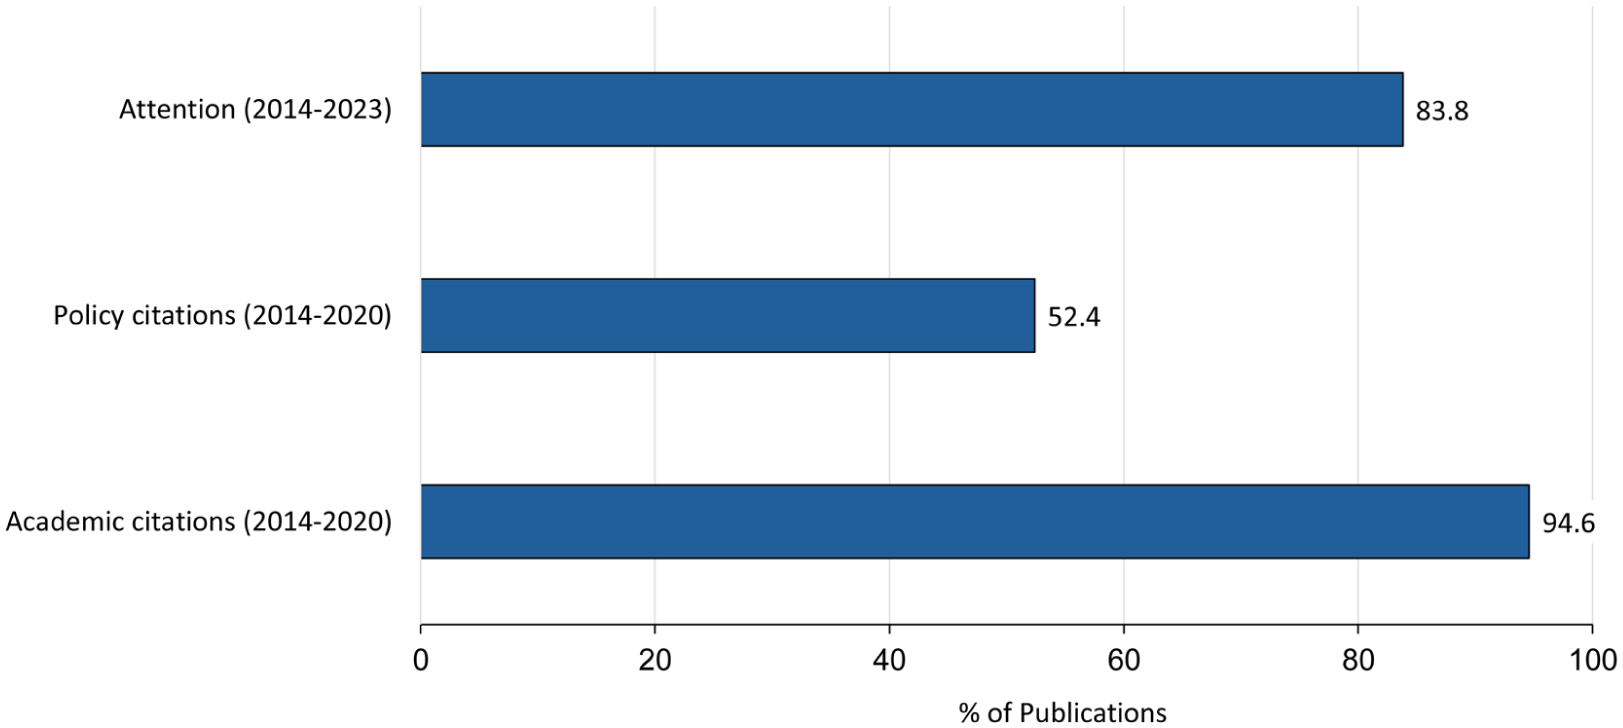
Percentage of CDC-authored publications receiving any academic citations, policy citations, and attention during the analytic period, 2014-2023. Academic and policy citation rates commonly take approximately 3 years to accumulate (eFigure 1 in the Supplement), so for these measures, only CDC-authored publications from 2014 through 2020 (n = 24 208) were considered. CDC-authored publications (2014 through 2023) were considered to have received attention if they received an Altmetric Attention Score >0 (n = 34 104). Analyses were conducted in 2024. Abbreviation: CDC, Centers for Disease Control and Prevention.
Our topic model categorized CDC-authored publications into 46 distinct public health topics (Table 1). Topics clustered broadly into areas representing infectious diseases, sexually transmitted infections, and chronic health conditions (Figure 2). The 3 topics with the largest numbers of publications were related to respiratory illnesses or vaccination (3828 of 34 104; 11.2%), sexually transmitted infections (2931 of 34 104; 8.6%), and occupational safety and health (903 of 34 104; 2.6%). Our model also detected topics with a relatively small number of publications, including environmental health (n = 175) and pandemic influenza (n = 177).
Number of CDC-authored scientific publications (N = 34 104), categorized by 46 public health topics identified by a large language model, 2014-2023
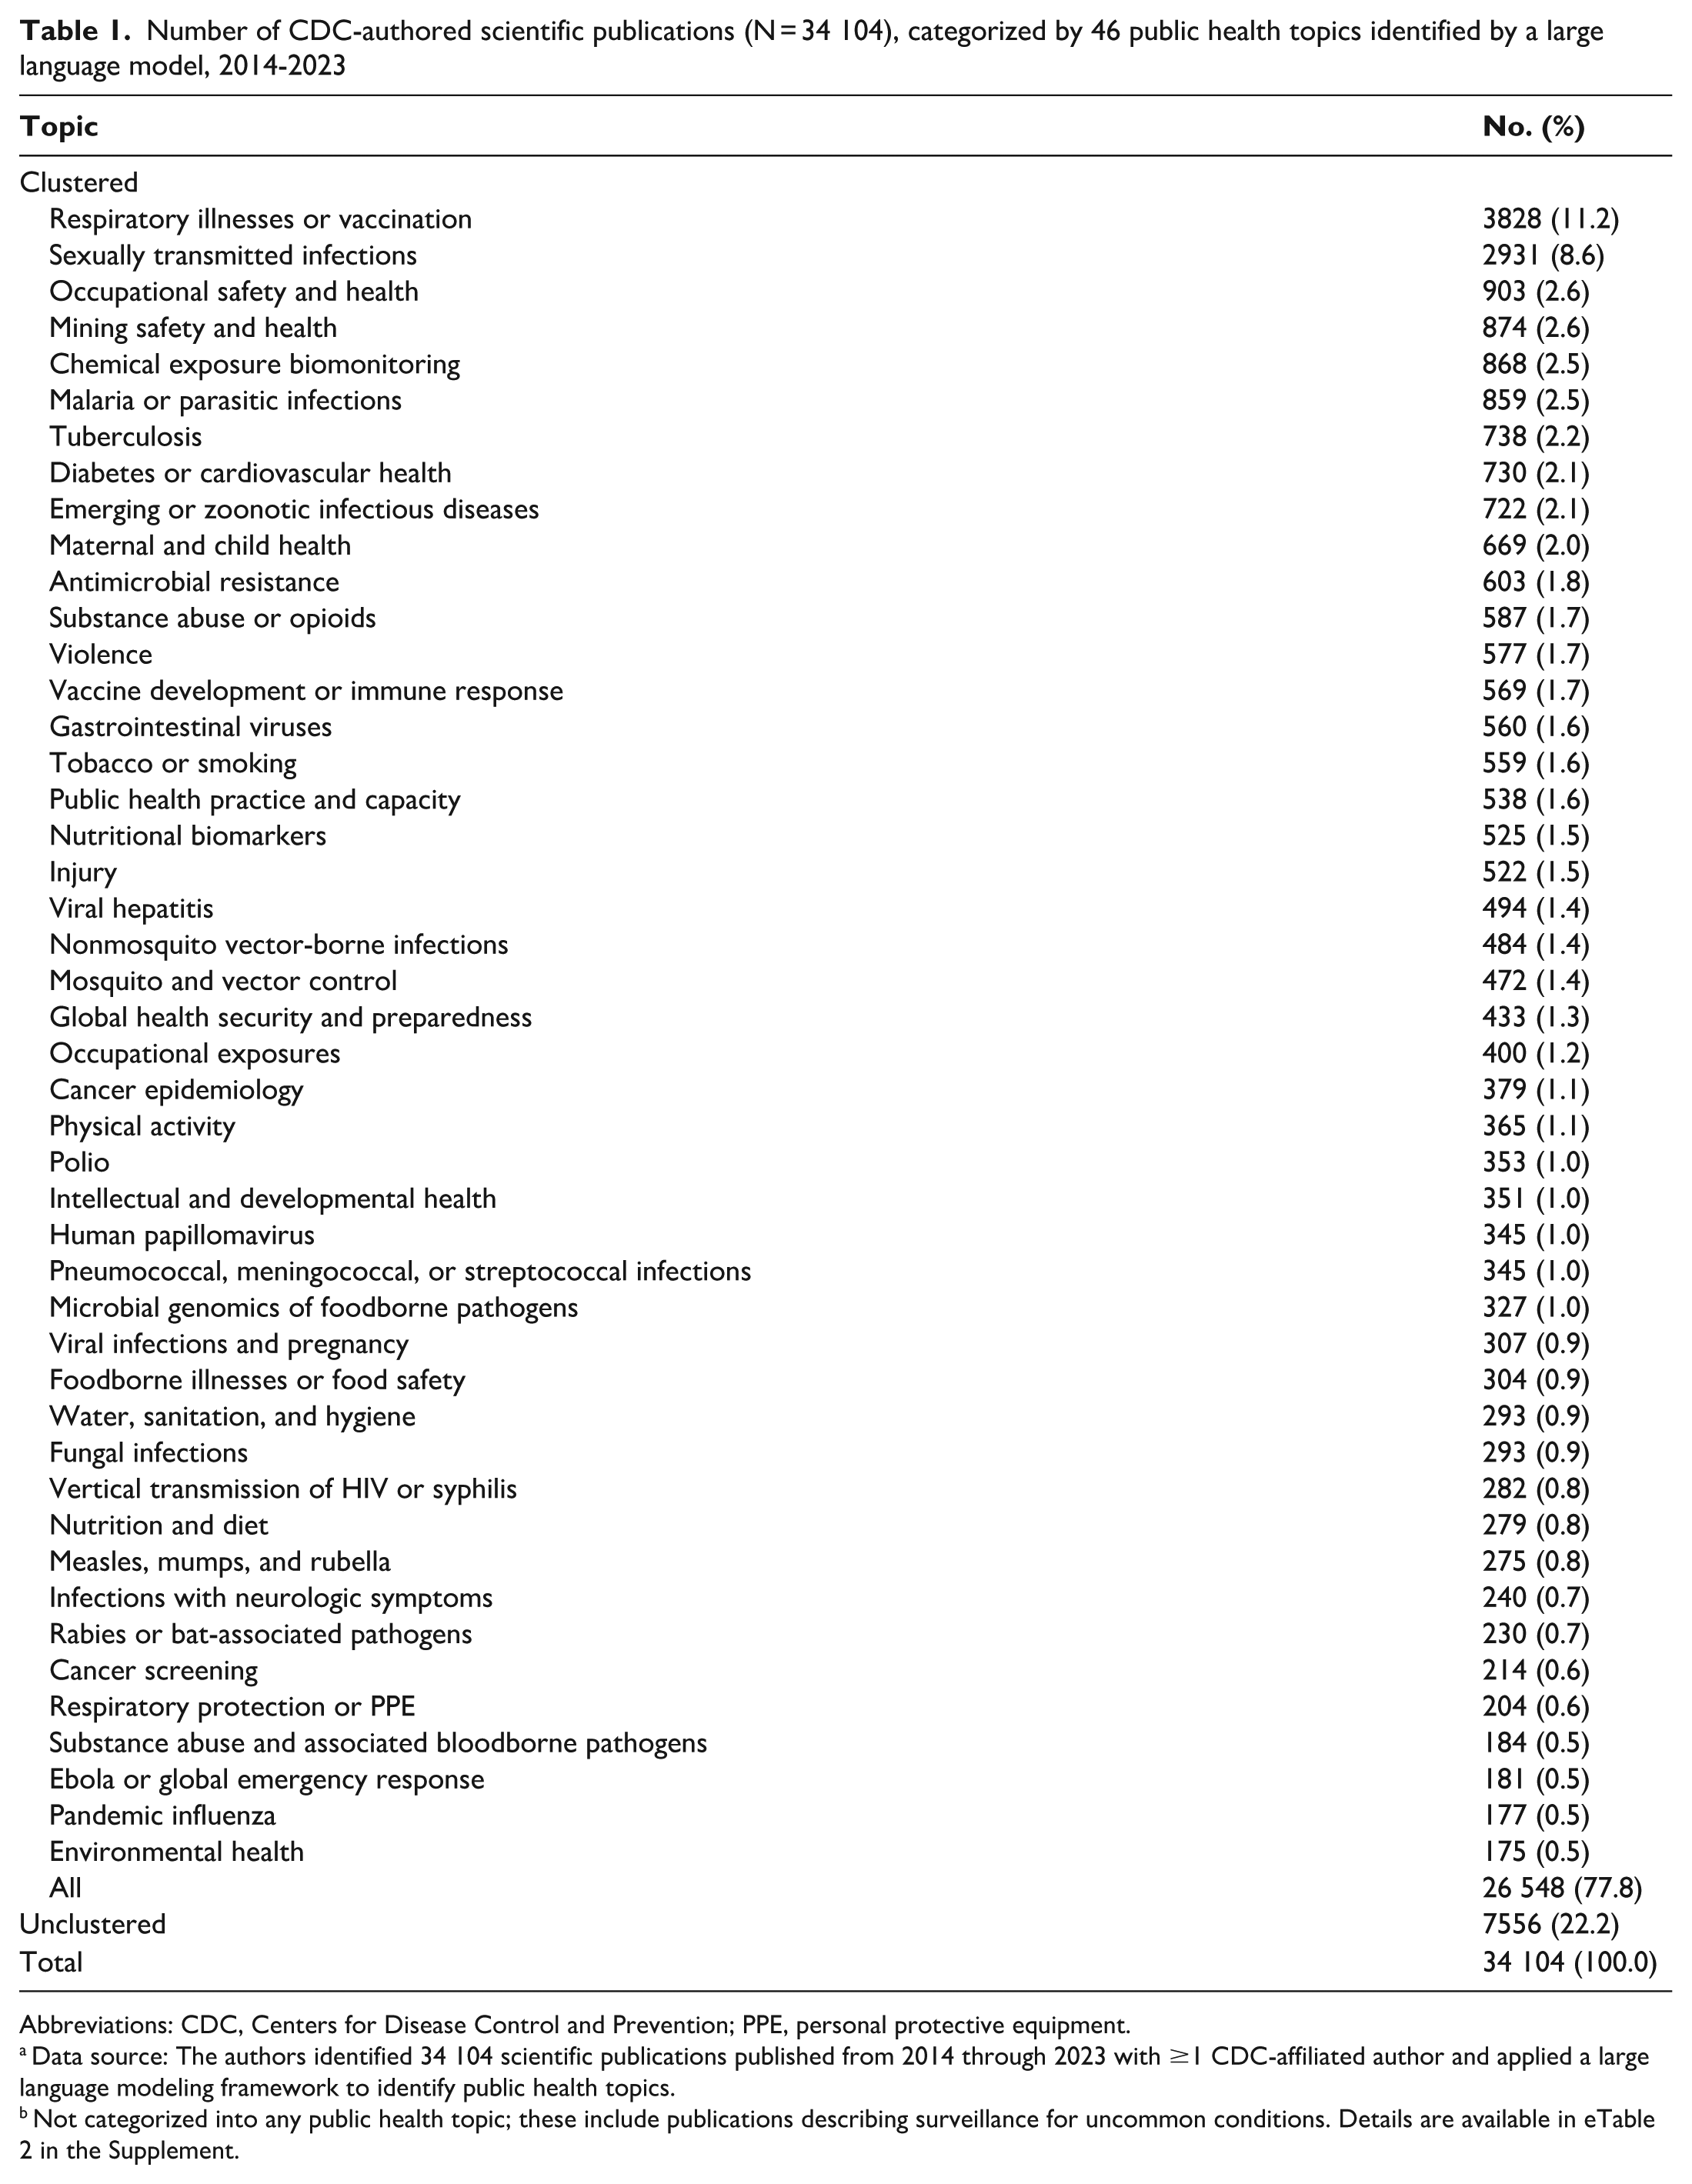
Abbreviations: CDC, Centers for Disease Control and Prevention; PPE, personal protective equipment.
Data source: The authors identified 34 104 scientific publications published from 2014 through 2023 with ≥1 CDC-affiliated author and applied a large language modeling framework to identify public health topics.
Not categorized into any public health topic; these include publications describing surveillance for uncommon conditions. Details are available in eTable 2 in the Supplement.
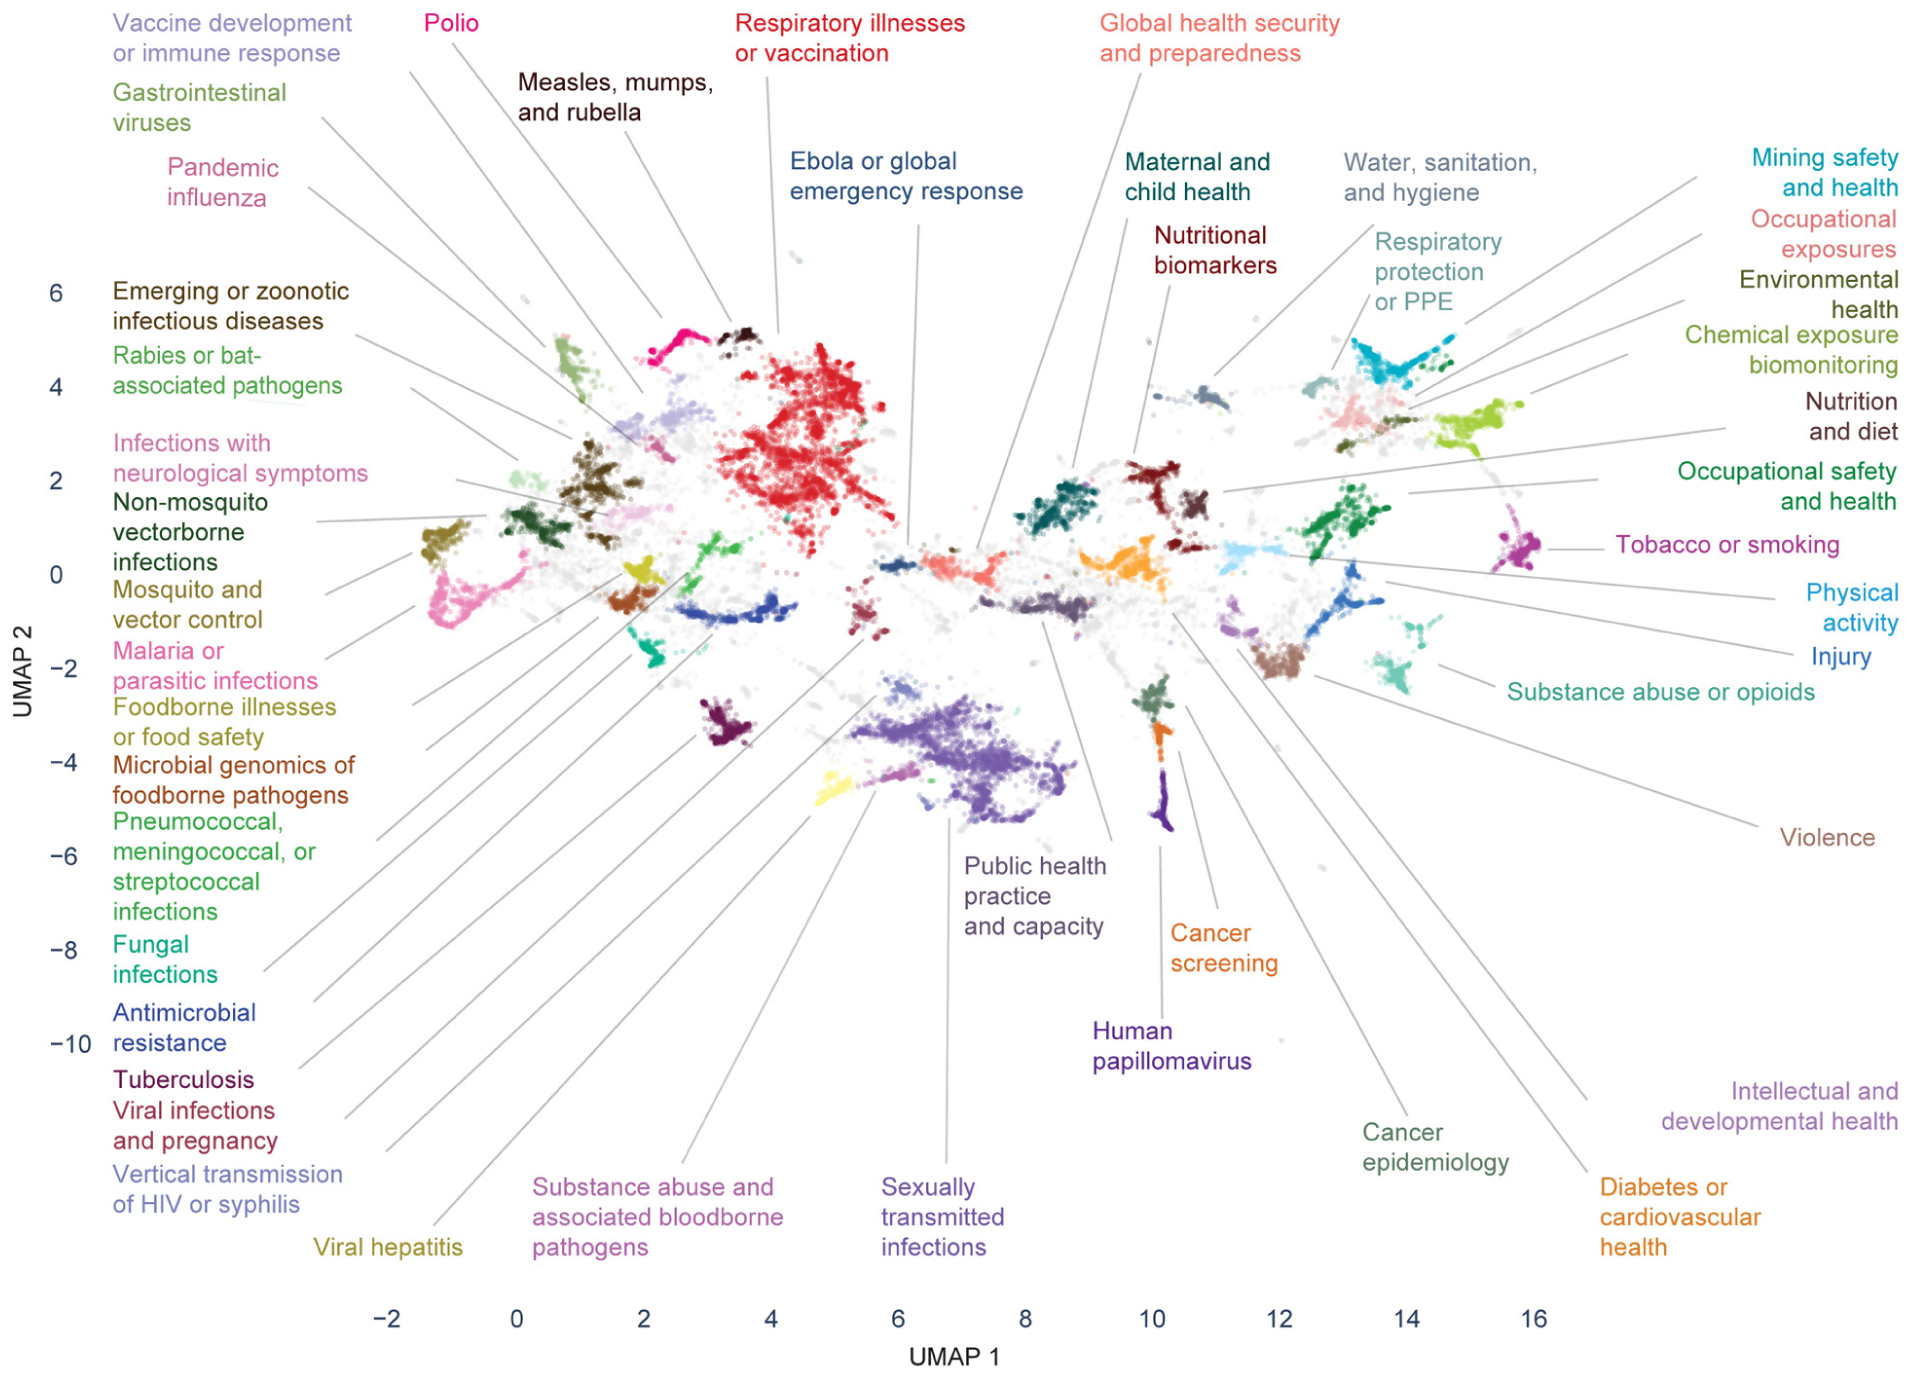
Topic map of Centers for Disease Control and Prevention–authored scientific publications by 46 public health topics identified by a large language model, 2014-2023. The 46 public health topics were identified by the optimized BERTopic topic modeling pipeline. To visualize relationships between topics, the publication embeddings were reduced in dimensionality by using Uniform Manifold Approximation and Projection (UMAP) to 2 dimensions and using the same nearest neighbors and minimum distance as the full pipeline. Similar publications are located closer together in space, while dissimilar publications are further apart. Each publication is represented as a point, and each public health topic has a unique color. Final labels for the public health topics were determined by reviewers. Gray points indicate publications that were unclustered (ie, not categorized into a public health topic by the model). Each point has an opacity of 0.25 to convey the density of points.
During the analytic period, CDC responded to several major public health emergencies, and 3 directly related topics emerged: Ebola or global emergency response (2014 Ebola response), viral infections and pregnancy (2016 Zika response), and respiratory illnesses or vaccination (2020 COVID-19 response).16,17 These topics also had the most publications in either the year of or the year after the initiation of response activities (Figure 3).
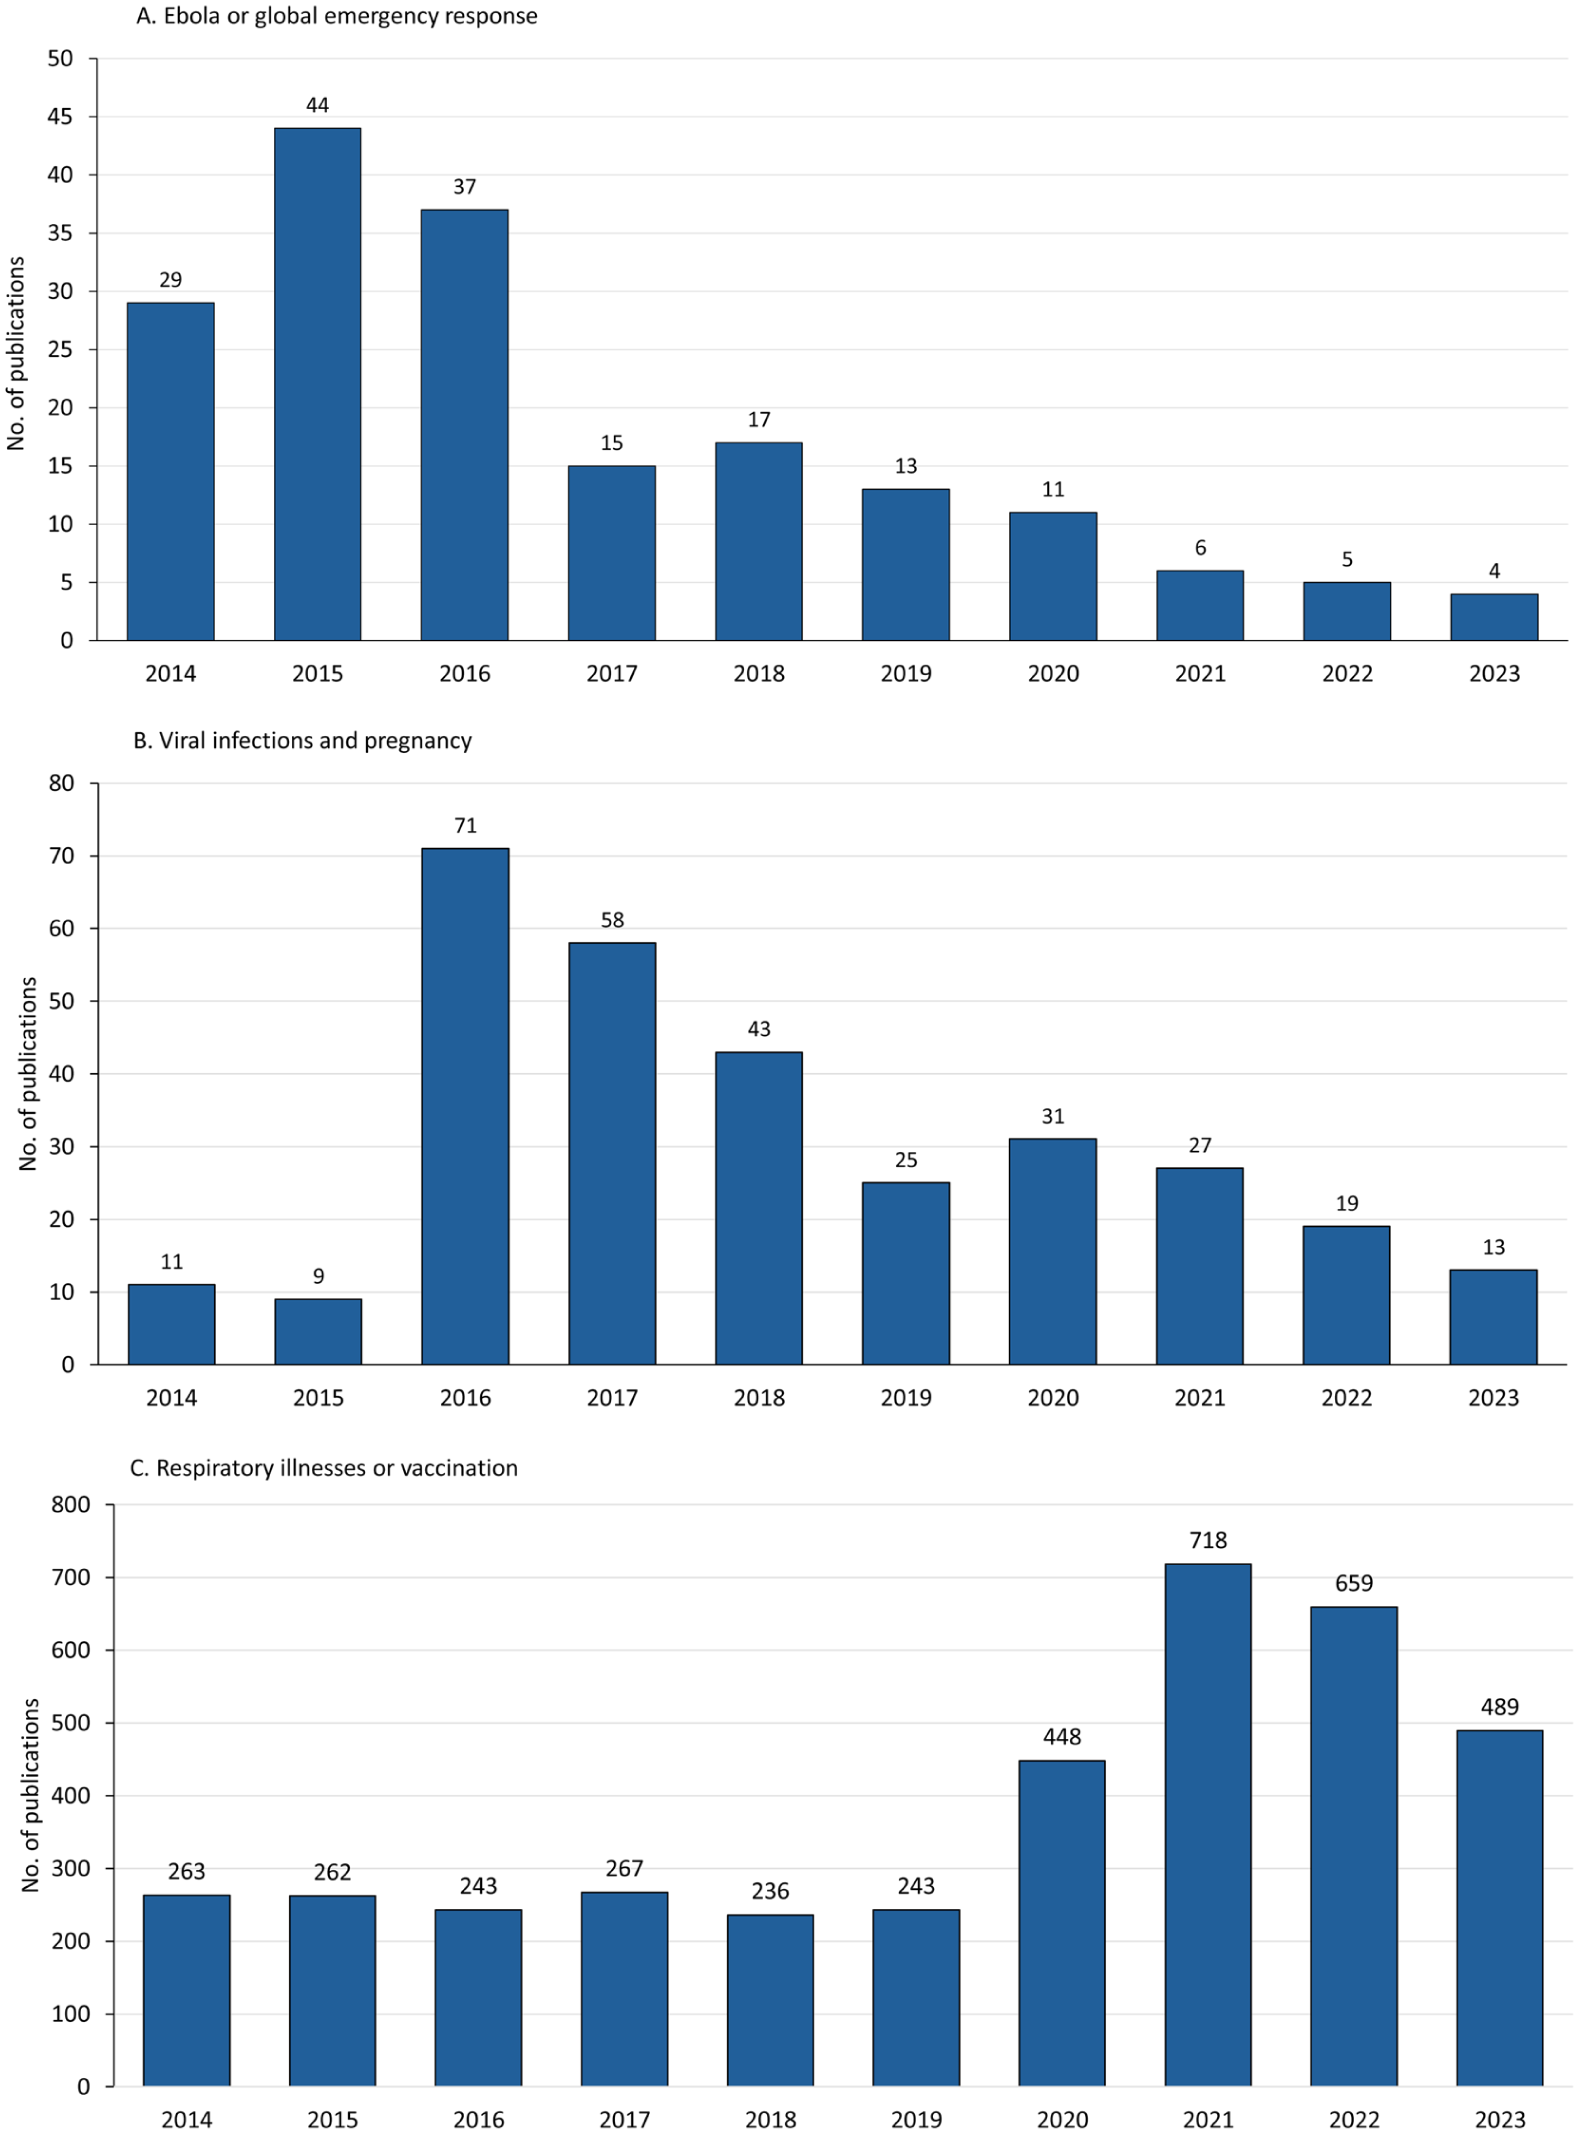
Number of publications on public health emergency response topics including (A) Ebola or global emergency response, (B) viral infections and pregnancy, and (C) respiratory illnesses or vaccination among Centers for Disease Control and Prevention–authored scientific publications, 2014-2023.
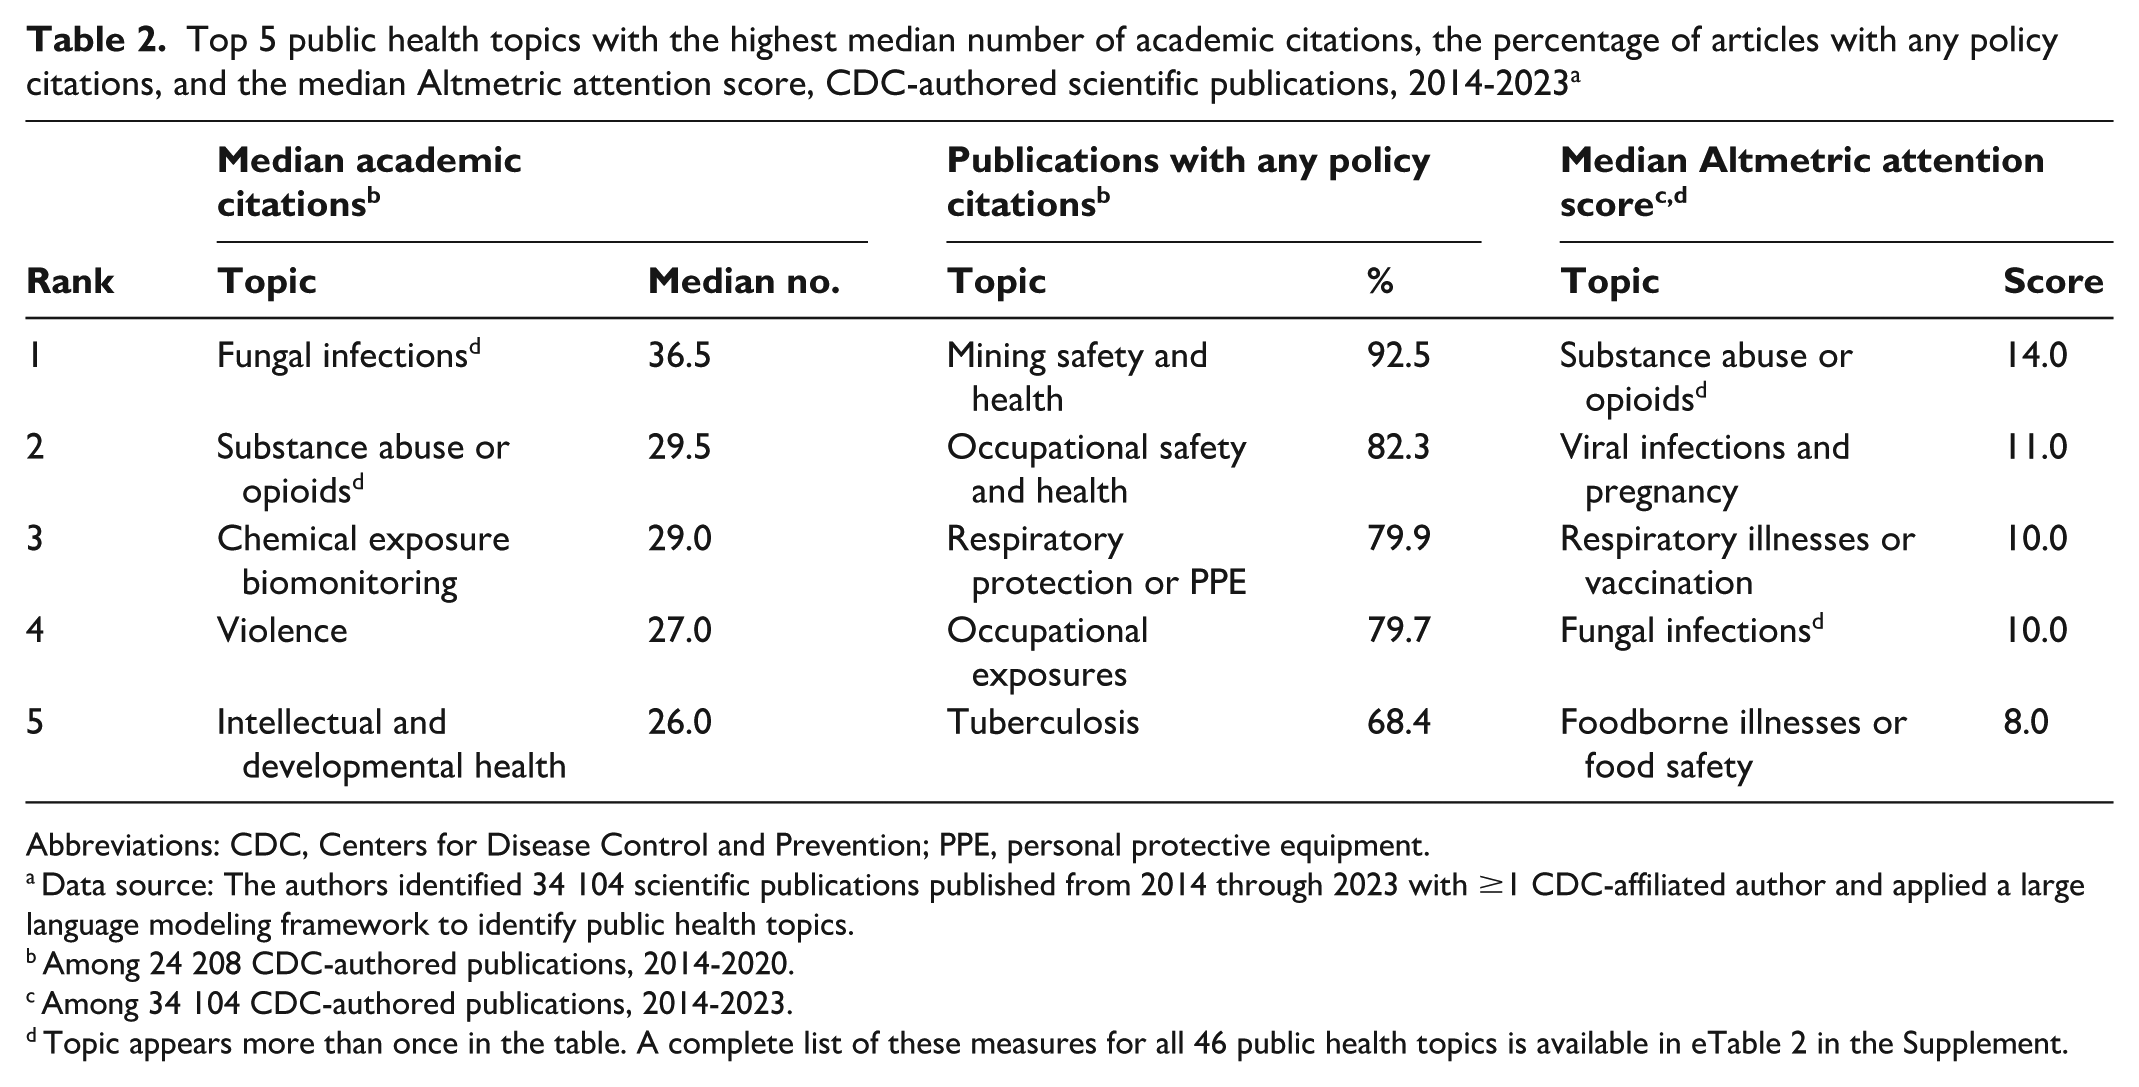
When we ranked topics by the 3 impact metrics—median number of academic citations (2014-2020), percentage of publications with policy citations (2014-2020), and median Altmetric Attention Score (2014-2023)—we found that 13 topics comprised the top 5 topics in each impact metric (Table 2). Two topics—fungal infections and substance abuse or opioids—appeared in the top 5 topics in 2 impact metrics. Of the 46 topics, 13 were represented in these top 15 rankings, demonstrating that various topics ranked highly on at least 1 of the 3 impact metrics. Conversely, no topic was ranked in the bottom quartile for all 3 impact metrics (eTable 2 in the Supplement). Some topics with a low ranking in 1 metric had a high ranking in another metric (eg, fungal infections, mining safety and health), while other topics had a broader impact, ranking in the top 10 in all 3 impact metrics (eg, respiratory illnesses or vaccination, substance abuse or opioids, intellectual and developmental health).
Top 5 public health topics with the highest median number of academic citations, the percentage of articles with any policy citations, and the median Altmetric attention score, CDC-authored scientific publications, 2014-2023 a
Abbreviations: CDC, Centers for Disease Control and Prevention; PPE, personal protective equipment.
Data source: The authors identified 34 104 scientific publications published from 2014 through 2023 with ≥1 CDC-affiliated author and applied a large language modeling framework to identify public health topics.
Among 24 208 CDC-authored publications, 2014-2020.
Among 34 104 CDC-authored publications, 2014-2023.
Topic appears more than once in the table. A complete list of these measures for all 46 public health topics is available in eTable 2 in the Supplement.
Discussion
From 2014 through 2023, CDC’s scientific publications had measurable impact across 46 public health topics. These topics spanned infectious disease, noninfectious disease, and public health preparedness and response. Nearly all publications received academic citations, most received attention in news and social media, and more than half were cited in policy and clinical guidance during the analytic period.
Of CDC-authored publications in our study, most (52.4%) were cited in public health policy or clinical guidance. In contrast, a 2021 study found that approximately 6% of all scientific publications received policy citations. 15 That study showed that among all public health publications published during 2008 to 2016 and indexed in Scopus, 28% received policy citations. A 2023 study showed that 13% of publications generated through a large, federally funded program received policy citations. 18 While direct comparisons are limited because of differing ranges for publication dates, access dates, and database sources, results from those studies provide a baseline against which we can demonstrate that, in general, CDC-authored publications have relatively high policy impact.
CDC-authored publications had higher levels of attention in news and social media than in baseline scientific publications and a comparable level of attention to other public health publications. From 2014 through 2023, approximately 69% of all publications indexed in Altmetric received attention (accessed November 27, 2024), compared with 84% of CDC-authored publications (accessed July 2, 2024). However, 87% of publications indexed in Altmetric publications during this period in the subject areas that were the top 3 most frequently tagged in CDC-authored publications (biomedical and clinical science, health sciences, and biological sciences) received attention (accessed November 27, 2024), which is comparable with CDC’s metric of 84%. These findings could highlight an opportunity for improving communication strategies to ensure CDC publications reach appropriate audiences.
A key strength of our study was consideration of 3 types of impact metrics, which together provide an overview of how publications achieved scientific and broader societal impact. Approaches that incorporate multiple types of metrics have been championed over merely analyzing academic citations or journal impact factors.19-21 Traditional bibliometric indicators are influenced by various factors, including the article’s field of study, and efforts have been made to normalize for these field-specific trends in academic citations.6,14,22 Field-specific trends for attention metrics and policy citations have also been demonstrated.15,23 Even without normalizing for subdisciplines, we find that no topic in our model ranked in the bottom quartile of topics for all 3 metrics, demonstrating that each topic had a nonnegligible impact in media attention, academia, or policy (eTable 2 in the Supplement).
The public health topics in our model reflect CDC’s past and current strategic science priorities. Our model produced topics related to several agency-wide emergency responses (Ebola, Zika, and COVID-19),16,17 and CDC scientists may have shifted priorities to ensure a high volume of publications related to these responses (Figure 3). Notably, these topics emerged from the model without explicitly instructing it to produce clusters related to the agency’s known priorities.
Topic models can be used to evaluate shifts in scientific topics and to identify opportunities to prioritize topics moving forward, whether that means initiating scientific investigations into emerging topics or finding new strategies to increase media attention or policy translation for specific topics. For example, previous work combining topic tagging with bibliometrics demonstrated the large scale and impact of CDC’s COVID-19 publications. 5
One of the strengths of topic modeling for these applications is the ability to characterize large publication portfolios quickly.24-27 Developing reliable search strategies for the entire range of topics addressed by authors at any large research institution such as CDC would likely be time and resource prohibitive. Approaches that rely on subject matter experts to categorize publications or develop systematic search strategies can also introduce bias. Other field classification systems can be too general or poorly reflect emerging topics. 25 Alternatively, topic modeling as performed in this study can be considered “unsupervised,” meaning that the model was not constrained to identify specific topics. As a result, the model may be less prone to operator bias and more acute to topics and similarities between publications that a set of systematic search strategies could miss.
Limitations
Our analysis was subject to several limitations. First, our metrics were not strictly independent of each other. For example, the number of policy citations contributes (albeit with lower weighting than news articles) to the Altmetric Attention Score. 28 Similarly, some studies have shown correlations among attention metrics, academic citations, and policy citations.18,29 Second, our analysis may not capture all CDC-authored publications (eg, any not listed in Science Clips) or their full impact (eg, any publications not indexed in Altmetric or BMJ Impact Analytics), thus underestimating the true impact of CDC science. We conducted quality checks by using internal data, which indicated that the version of Science Clips used in this study captured >95% of CDC-authored publications during the analytic period. Missingness of Altmetric data was small (~0.3% of publications) but had an outsized effect on small clusters (eg, 10% [17 of 175] of environmental health publications were missing Altmetric data). Third, mentions of a publication in the media and its academic citations do not always indicate public health impact, as some studies have previously explored.21,29-31 Fourth, our topic model was influenced by our parameter choices. The dimensionality reduction technique used in BERTopic, UMAP, is stochastic, so results vary based not only on parameter choices but also on the machine used to optimize the model and the random state chosen. 11 We set the random state for reproducibility, but stochasticity could have produced a model with a different number of topics or structure. We mitigated this limitation through a human review of our model, which demonstrated that the categories generated by our model were reasonable. Searching across random states to ensure that results are robust to this parameter would improve the optimization strategy. Fifth, not all publications in our list were classified into a topic, so we may have missed publications that could have contributed to the overall impact of certain topics. Finally, some topics in our model, especially the largest ones, included outliers that might have been removed had a systematic search strategy been used.
Conclusions
We evaluated the impacts of CDC-authored publications from 2014 through 2023 by public health topic and by using multiple measures. Topic modeling was helpful for identifying public health topics within this large scientific publication portfolio. Multiple impact metrics allowed us to evaluate how topic areas disseminated evidence and affected public health policy and clinical guidance. Our methods can be applied by other organizations seeking to evaluate the impacts of broad publication portfolios. These metrics can inform further assessment of specific topics or programmatic areas with an aim to strengthen science, policy, and communications partnerships to increase science translation that can lead to improving health and saving lives. Providing this overview of the content and impact of CDC science promotes transparency into the activities of this federal agency with partners and the public.
Supplemental Material
sj-docx-1-phr-10.1177_00333549261451188 – Supplemental material for From Research to Impact: Assessing a Decade of CDC’s Public Health Science by Topic Area, 2014-2023
Supplemental material, sj-docx-1-phr-10.1177_00333549261451188 for From Research to Impact: Assessing a Decade of CDC’s Public Health Science by Topic Area, 2014-2023 by Joy Ortega, Victoria E. Dunkley, Martha Knuth, Christie Kim, Elissa Meites, Brian B. Yoo, Katlyn Wainwright, Bao-Ping Zhu and Mary G. Reynolds in Public Health Reports®
Supplemental Material
sj-docx-2-phr-10.1177_00333549261451188 – Supplemental material for From Research to Impact: Assessing a Decade of CDC’s Public Health Science by Topic Area, 2014-2023
Supplemental material, sj-docx-2-phr-10.1177_00333549261451188 for From Research to Impact: Assessing a Decade of CDC’s Public Health Science by Topic Area, 2014-2023 by Joy Ortega, Victoria E. Dunkley, Martha Knuth, Christie Kim, Elissa Meites, Brian B. Yoo, Katlyn Wainwright, Bao-Ping Zhu and Mary G. Reynolds in Public Health Reports®
Supplemental Material
sj-pdf-3-phr-10.1177_00333549261451188 – Supplemental material for From Research to Impact: Assessing a Decade of CDC’s Public Health Science by Topic Area, 2014-2023
Supplemental material, sj-pdf-3-phr-10.1177_00333549261451188 for From Research to Impact: Assessing a Decade of CDC’s Public Health Science by Topic Area, 2014-2023 by Joy Ortega, Victoria E. Dunkley, Martha Knuth, Christie Kim, Elissa Meites, Brian B. Yoo, Katlyn Wainwright, Bao-Ping Zhu and Mary G. Reynolds in Public Health Reports®
Footnotes
Acknowledgements
The authors acknowledge the CDC Office of Science Leadership and Knowledge Management teams for their support of this project. They also acknowledge the current and past members of the CDC Publications Portfolio Work Group who contributed feedback on this project. Portions of this work were presented at the American Medical Informatics Association 2024 Annual Symposium in San Francisco, California. An early version of this article was posted as a preprint on medRxiv on March 10, 2025: ![]() .
.
Funding
The authors received no financial support for the research, authorship, and/or publication of this article.
Declaration of Conflicting Interests
The authors declared no potential conflicts of interest with respect to the research, authorship, and/or publication of this article.
Code and Data Availability Statement
Code, example notebooks, and data have been made available through a GitHub repository here: https://github.com/cdcai/analysis-bertopic-cdc-publications. CDC Science Clips is freely available as a public-facing database: ![]() .
.
Disclaimer
The findings and conclusions in this article are those of the authors and do not necessarily represent the official position of CDC.
Supplemental Material
Supplemental material for this article is available online. The authors have provided these supplemental materials to give readers additional information about their work. These materials have not been edited or formatted by Public Health Reports’s scientific editors and, thus, may not conform to the guidelines of the AMA Manual of Style, 11th Edition.
References
Supplementary Material
Please find the following supplemental material available below.
For Open Access articles published under a Creative Commons License, all supplemental material carries the same license as the article it is associated with.
For non-Open Access articles published, all supplemental material carries a non-exclusive license, and permission requests for re-use of supplemental material or any part of supplemental material shall be sent directly to the copyright owner as specified in the copyright notice associated with the article.