



Abstract
We evaluated benefits of substance use disorder (SUD) screening on employment outcomes of state vocational rehabilitation (VR) consumers in Illinois, Ohio, West Virginia, Kentucky, and Utah. Across states, 9,681 screeners matched RSA-911 records with closure status. Positive SUD screening rates ranged from 21.2% in Illinois to 50.4% in Utah. While findings varied by state, screening can improve successful employment rates. Systemwide SUD screening may be most beneficial in states that are effective in addressing SUD. Effective states serve a higher percentage of consumers with SUD diagnoses, and have employment rates that meet or exceed states with fewer consumers with SUD, indicating that SUD success rates approximate those of consumers with other disabilities. Even in states with low SUD diagnoses rates, above 20% of screened consumers had suspected SUD. We replicated findings suggesting that persons with SUD can transition successfully to employment, and at lower cost and shorter time than consumers with other conditions. We found discrepancies in all states between SUD screening results and official diagnoses. Persons with a diagnosis of SUD were somewhat more likely to achieve an employment outcome than persons who screened SUD positive without a diagnosis. We provide suggestions for VR policy and future research directions.
Persons with disabilities experience a number of risk factors for substance use disorders (SUD); and, research has repeatedly shown that vocational rehabilitation (VR) consumers are at high risk for SUD with estimated rates ranging from 22% to above 50% (Corrigan, 1995; DiNitto & Schwab, 1993; Kandel & Yamaguchi, 1987; Kreutzer, Marwitz, & Wehman, 1991; Moore & Li, 1998; Wilson, 1996; Zhang & Snizek, 2003). Active SUD negatively affects employment outcomes for all persons, but perhaps more so among persons with disabilities (Corthell & Brown, 1991; Kreutzer et al., 1991; Moore & Li, 1998).
When SUD is identified and addressed during the rehabilitation process, consumers may achieve successful employment outcomes at rates nearly comparable with disability groups without SUD. Schwab and DiNitto (1993) conducted one of the most comprehensive investigations of this issue in a statewide study in Texas. They found that VR consumers with an official VR primary or secondary diagnosis of SUD received slightly more services, were nearly as likely to be rehabilitated successfully as persons with other disabilities, received services for shorter time periods, and were less costly to serve than consumers without SUD. McAweeney, Keferl, Moore, and Wagner (2008) conducted a similar study examining the predictors of successful closure among VR consumers with SUD and found that their involvement in the VR process was shorter compared with a group of VR consumers without SUD. Using data from the 2005 Rehabilitation Services Administration (RSA-911) database, McAweeney et al. (2008) randomly sampled 940 persons; half with a primary or secondary diagnosis of alcohol or drug abuse and the other half with a psychosocial, cognitive, or mental health diagnosis. Predictors of successful closure for those with an SUD diagnosis included receiving more services (specifically diagnosis and treatment, counseling, job placement, and on-the-job support) and participating in the VR process for a shorter length of time.
Contrary to Schwab and DiNitto (1993), McAweeney et al. (2008) found the cost of providing services to individuals with SUD to be slightly higher than cost of services to consumers without an SUD diagnosis, perhaps due to the greater number of services received by the consumers in the later study. The common predictors in these two studies were the identification of SUD early in the process and participating in VR for a shorter amount of time. Shorter length of involvement in VR for these consumers may be explained by the Prochaska, DiClemente, and Norcross (1992) model of change. The very nature of recovery suggests that individuals who have gone through phases of change reach a point in recovery where they are willing and motivated to better their lives. For VR consumers, this change may be reflected in an efficient use of VR services and motivation to become employed (Prochaska et al., 1992).
Counselors face several challenges in addressing consumers’ SUD. Approximately half of state-based VR programs have formal or informal sobriety waiting periods for consumers identified with an SUD (Moore, McAweeney, Keferl, Glenn, & Ford, 2008). A sobriety waiting period requires consumers to demonstrate abstinence to qualify for VR services; typically new consumers must wait 90 or more days before receiving services. The waiting period can be problematic for persons who do not have gainful employment. There is more state-to-state variation in official SUD diagnosis rates in VR than for any other condition, with the rates ranging from 0.2% to 32% of the state VR population (Moore et al., 2008). For example, using data from 2005, Idaho reported a 1% rate for those with deafness or hearing impairment, which was the lowest reported in all states. Conversely, Indiana reported the highest rate of 8%, yielding a 7% difference. Alaska reported a rate of 0.25% for those with depression and other mood disorders, while Texas reported a rate of 8.15%, a 7.9% difference. Hawaii reported a rate of 0.20% for those with spinal cord injury, while New York reported a rate of 8.35%, an 8.15% difference (RSA, 2005). Modest state-to-state differences in disability rates are not surprising. However, state agencies report a much wider variability regarding the prevalence of their consumers who have a primary or secondary condition of SUD. The prevalence rate of SUD is almost 4 times that of the other disabilities listed above, constituting a spread of nearly 28%. This difference is perhaps due to variations in policies and procedures, methods for detecting SUDs, and base rates of SUD of persons referred to VR agencies.
Last, counselor training in and sensitivity to SUD rehabilitation is often neglected or priority is given to other training needs (Glenn & Keferl, 2008). Moreover, counselors who address SUD in rehabilitation plans can be frustrated by limited or poorly networked public resources for SUD assessment and treatment, especially for persons who have coexisting disabilities that limit treatment access (Krahn, Farrell, Gabriel, & Deck, 2006; Substance Abuse and Mental Health Services Administration, 1998).
Regardless of the policy, personnel, and fiscal conditions that challenge provision of VR services to persons with SUD, the rehabilitation process should begin by identifying SUD as a potential barrier to employment. A fundamental precept of VR is accurate assessment of strengths and barriers followed by individualized planning and services to address those conditions. Two quotes illustrate this priority. “Vocational rehabilitation principles and interventions are fundamentally the same for work related and other comparable health conditions, irrespective of whether they are classified as injury or disease” (Waddell, Burton, & Kendall, 2008, p. 5). “Vocational assessment should be used to objectively identify an individual’s abilities and strengths, and should lead to the development of a plan for coordinated interventions to capitalize on strengths, address needs and enable the person to become employed” (New York State Education Department, 2009, para. 17). These principles apply when addressing SUD (Platt, 1995; Sander, Kreutzer, & Fernandez, 1997) and empirical evidence supports successful outcomes for consumers with SUD when SUD is detected early and consumers receive appropriate services (McAweeney et al., 2008).
No widely used standard practice or screening instrument exists for identifying SUD in VR consumers (Heinemann, Lazowski, Moore, Miller, & McAweeney, 2008; Heinemann, McAweeney, Lazowski, & Moore, 2008; Moore et al., 2008). Moreover, counselors often do not routinely ask about substance use or history (Brown & Saura, 1996; Moore & Li, 1998). Standardized substance abuse screening instruments enhance detection of SUD. In a study of undetected substance abuse, DiNitto and Schwab (1993) recruited 254 applicants to the Texas Rehabilitation Commission and asked them to complete the Addiction Severity Index (ASI) or the Substance Abuse Subtle Screening Inventory (SASSI). Both instruments were more effective than the standard intake interview at detecting SUD. The ASI identified 38.4% and the SASSI 32.7% of the cases as likely SUD among consumers not diagnosed with SUD in either primary or secondary RSA-911categories (RSA, 2005) Of particular note, even among applicants who were assigned only a primary nonalcohol or drug-related disability (no secondary diagnosis determined), the screening instruments detected SUD among 31.5% of these persons (DiNitto & Schwab, 1993).
A number of instruments have been used to help practitioners identify SUD in the general population (cf. the ASI, McClellan, Luborsky, Woody, & O’Brien, 1980; the Alcohol Use Disorders Identification Test, Kelly & Donovan, 2001; the Michigan Alcoholism Screening Test, Seltzer, 1971; the Drug Abuse Screening Test, Skinner, 1982; the Chemical Dependency Assessment Profile, Harrell, Honaker, & Davis, 1991; the Structured Clinical Interview for the DSM-IIIR, Spitzer, Williams, Gibbon, & First, 1992; and the Drug Use Screening Inventory–Revised, Tarter & Hegedus, 1991). These instruments are widely used in the general population. Unfortunately, their use in rehabilitation practice is limited severely. In addition, a measure specifically designed for persons in the VR system would provide an alternative for counselors with limited education in SUD assessment or who are not comfortable screening for SUD. The SAVR-S provides an alternative for these counselors because it was created and validated specifically for VR consumers.
The Current Study
The purpose of this study was to field test a substance abuse screening instrument designed specifically for VR. Based on the findings of DiNitto and Schwab, we also sought to determine if detection of SUD could be improved by routine use of a screening instrument. We designed this study to test the impact of SUD-related screening results in five state VR programs. The study was intended to answer two general research questions:
In addition, we developed three hypotheses based on our previous research findings about SUD prevalence recorded in VR records or identified via screening but not represented in official diagnoses, as well as the research cited above by others. We were interested in replicating the findings of Schwab and DiNitto, and McAweeney et al. in Hypothesis 3 as their research is the most comprehensive on SUD screening in state VR programs.
Hypotheses
Method
Recruitment of VR Programs
We invited seven VR statewide programs to participate in the field study; selection criteria included relatively high or low rates of SUD diagnoses in the RSA-911 database, prior communication with the agency director, and CSAVR recommendation. Five states agreed to participate: Illinois, Ohio, West Virginia, Kentucky, and Utah. Two states declined due to recent budget cuts or the project’s demands on agency resources. Involvement of multiple states allowed us to evaluate the extent to which results generalize across states. The number of persons screened in these states provides sufficient statistical power for analyses, and state-to-state variations in SUD policies and procedures provide an adequate test of the screening protocol effectiveness across states. Illinois, Ohio, and West Virginia are in the lowest decile of states that identify SUD as a primary or secondary cause of impairment in the RSA-911 data (RSA, 2005). We received supplemental funding 2 years into the study and were able to include Kentucky and Utah, states that report higher rates of SUD within their VR populations (14.9% and 15.8%, respectively—in the 8th and 9th deciles) compared with the three states in the lowest deciles, Illinois (4.0%), Ohio (2.8%), and West Virginia (3.6%). We obtained Council of State Administrators of Vocational Rehabilitation Research Committee and university IRB approvals before beginning the project. The Committee observed that obtaining full counselor screener compliance within any state would be unrealistic because of large caseloads. They were also concerned that some counselors would find the request to utilize an SUD screener as an intrusion rather than an opportunity to enhance consumer outcomes. We designed the methods to reflect these concerns.
Sample
Persons 18 years or older applying for VR services in the five states were eligible to complete SUD screening.
Staff Training
We provided training to 965 VR personnel across the five states. Most training was conducted in live, 1-day sessions with 50 or fewer staff members. Six trainers delivered a modular, 6-hr curriculum that addressed background on the prevalence of SUD in VR, introduction to the screener, procedures, and rehabilitation planning for consumers with SUD. Trainers had prior experience working for VR programs, as well as university or equivalent teaching experience (Huber, Keferl, Lazowski, Heinemann, & Moore, 2011). The staff training, in concert with memos from the state directors, emphasized that declining to participate in the screening would not jeopardize VR services. Training emphasized the screener as a routine part of the intake process.
Instruments
Substance Abuse in Vocational Rehabilitation–Screener (SAVR-S)
We investigated a number of public domain and proprietary instruments for use in developing a screening instrument for use in VR and other employment-focused and clinical agencies who serve clients with disabilities. We partnered with the SASSI Institute because its research and information technology teams have experience in SUD screening instrument development research that includes persons with disabilities in VR programs; they possess strong expertise in psychometrics and test design; were able to meet the training and screening demands of the project; and were willing to create personalized, employment-focused reports from screening results. The item pool for SAVR-S items was derived from the SASSI; the SASSI compares favorably with the ASI in a study of SUD screening among VR consumers (DiNitto & Schwab, 1993). Pilot and validation phases of the study resulted in the development of the SAVR-S, a 43-item instrument written at a fifth-grade reading level (Heinemann, Lazowski, et al., 2008). SAVR-S results proved robust across administration methods, including group administrations and oral administration by VR personnel. We reported details regarding validation of the screening instrument previously (Heinemann, Lazowski, et al., 2008) and summarize them below. The SAVR-S possesses the qualities desired by VR personnel: brevity; sensitivity to alcohol, illegal drugs, and misuse of prescription medications; low reading level; automated scoring; and timely reporting of results.
Prior to field testing the instrument, we conducted a feasibility project to determine effective methods for screening SUD in a statewide VR system. Based on VR counselor and agency requirements we designed a platform whereby a brief screening questionnaire could be easily administered via a paper form and completed within 10 to 15 min, then faxed for automated scoring and the generation of a consumer-specific screening report for counselors to utilize in developing Individual Plans for Employment (IPE). Based on VR goals to target consumer needs, we customized screener content to include identification of current SUD (past 12 months symptoms) that had the ability in one questionnaire to identify consumers with likely SUD related to alcohol, illicit drugs, and prescription medication abuse. We validated the instrument by administering the draft screener and the Diagnostic Interview Schedule to 948 VR consumers in Illinois, Ohio, and West Virginia. The SAVR-S (Heinemann, Lazowski, et al., 2008) has psychometric properties similar to other rigorously developed instruments targeting SUD. SAVR-S demonstrated internal reliability of .87; stability coefficients ranging from .85 to .91; overall accuracy 84%; sensitivity 82%; and specificity 85%. These psychometric properties compare favorably with other validated SUD screening instruments. For example, Clements (1998) validated the AUDIT, MAST, and CAGE against past 12 months Composite International Diagnostic Interview diagnoses of alcohol dependence and found AUDIT sensitivity of .74, and specificity of .86; MAST (.63, .80); and CAGE (.37, .89). Importantly, the design of the SAVR-S considered accessibility for persons with a variety of sensory and cognitive disabilities such as spinal cord injury. We created and validated a separate, shorter instrument for persons who primarily communicate through American Sign Language, but that instrument was not utilized in the current study (Guthmann, Lazowski, Moore, Heinemann, & Embree, 2012).
RSA-911
The Rehabilitation Services Administration 911 Case Services Database consists of all records on VR consumer services required by the federal government of participating state and tribal agencies. The dataset is transmitted annually to RSA on all cases that have been closed within the past year; it contains information about disabling conditions, cause of impairment, number and type of case services provided, benefits status, closure status, costs of rehabilitation, and case processing dates. We obtained RSA-911 data directly from each state to include open cases not reported to RSA, as well as a linking variable that connected SAVR-S results with the VR case record.
Statistical Analyses
We computed descriptive statistics to characterize the sample and used cross-tabulations and logistic regressions to evaluate hypotheses; Tables 2 and 4 list the variables.
Field Test Procedures
State VR directors instructed counselors to invite consumers to complete the SAVR-S as part of their intake procedures. After logging on to a secure website and entering a consumer identifier, counselors printed the instrument and then faxed the completed instrument to the SASSI Institute. Counselors received test results within 24 hr by email. When screening results were positive, counselors also received instructions on how to share results with consumers and referral information.
Results
SUD screenings extended from September 2006 to September 2011 during which time counselors faxed 28,893 SAVR-S forms. These included forms that could not be matched with RSA-911 data, open cases without closure status data, cases with excessive missing data, and screening refusals. RSA-911 files contained records with closure dates through September 2010 for the original three states, December 2009 for Utah, and August 2008 for Kentucky.
Descriptive Statistics
We selected cases that were at least 18 years of age and opened on or after the date of the first counselor training session on the SAVR-S through the end of the period when agencies agreed to screen consumers. Table 1 compares individuals who were and were not invited in each state, the number of eligible cases and demographic characteristics of the samples by state. Screening rates for closed cases ranged from a low of 10.5% in Illinois to a high of 75.4% in Kentucky. The actual rate of screenings was higher; limited data availability in some states dictated the use of only closed cases for computation of screening rates. During the enrollment period, Ohio VR screened the most consumers with 11,343 screenings and West Virginia the fewest with 909. Overall, 28,893 consumers were invited to complete a screening. However, due to missing data, cases not yet closed at the time of analysis, and difficulties in matching SAVR-S identifiers with VR records we were able to match 9,681 VR closures with SAVR-S screenings. As demonstrated in Table 1, there are demographic differences between persons screened and not screened, as well as substantial state-to-state variations in these variables.
Sample Characteristics by Screening Invitation for All Closed Cases.
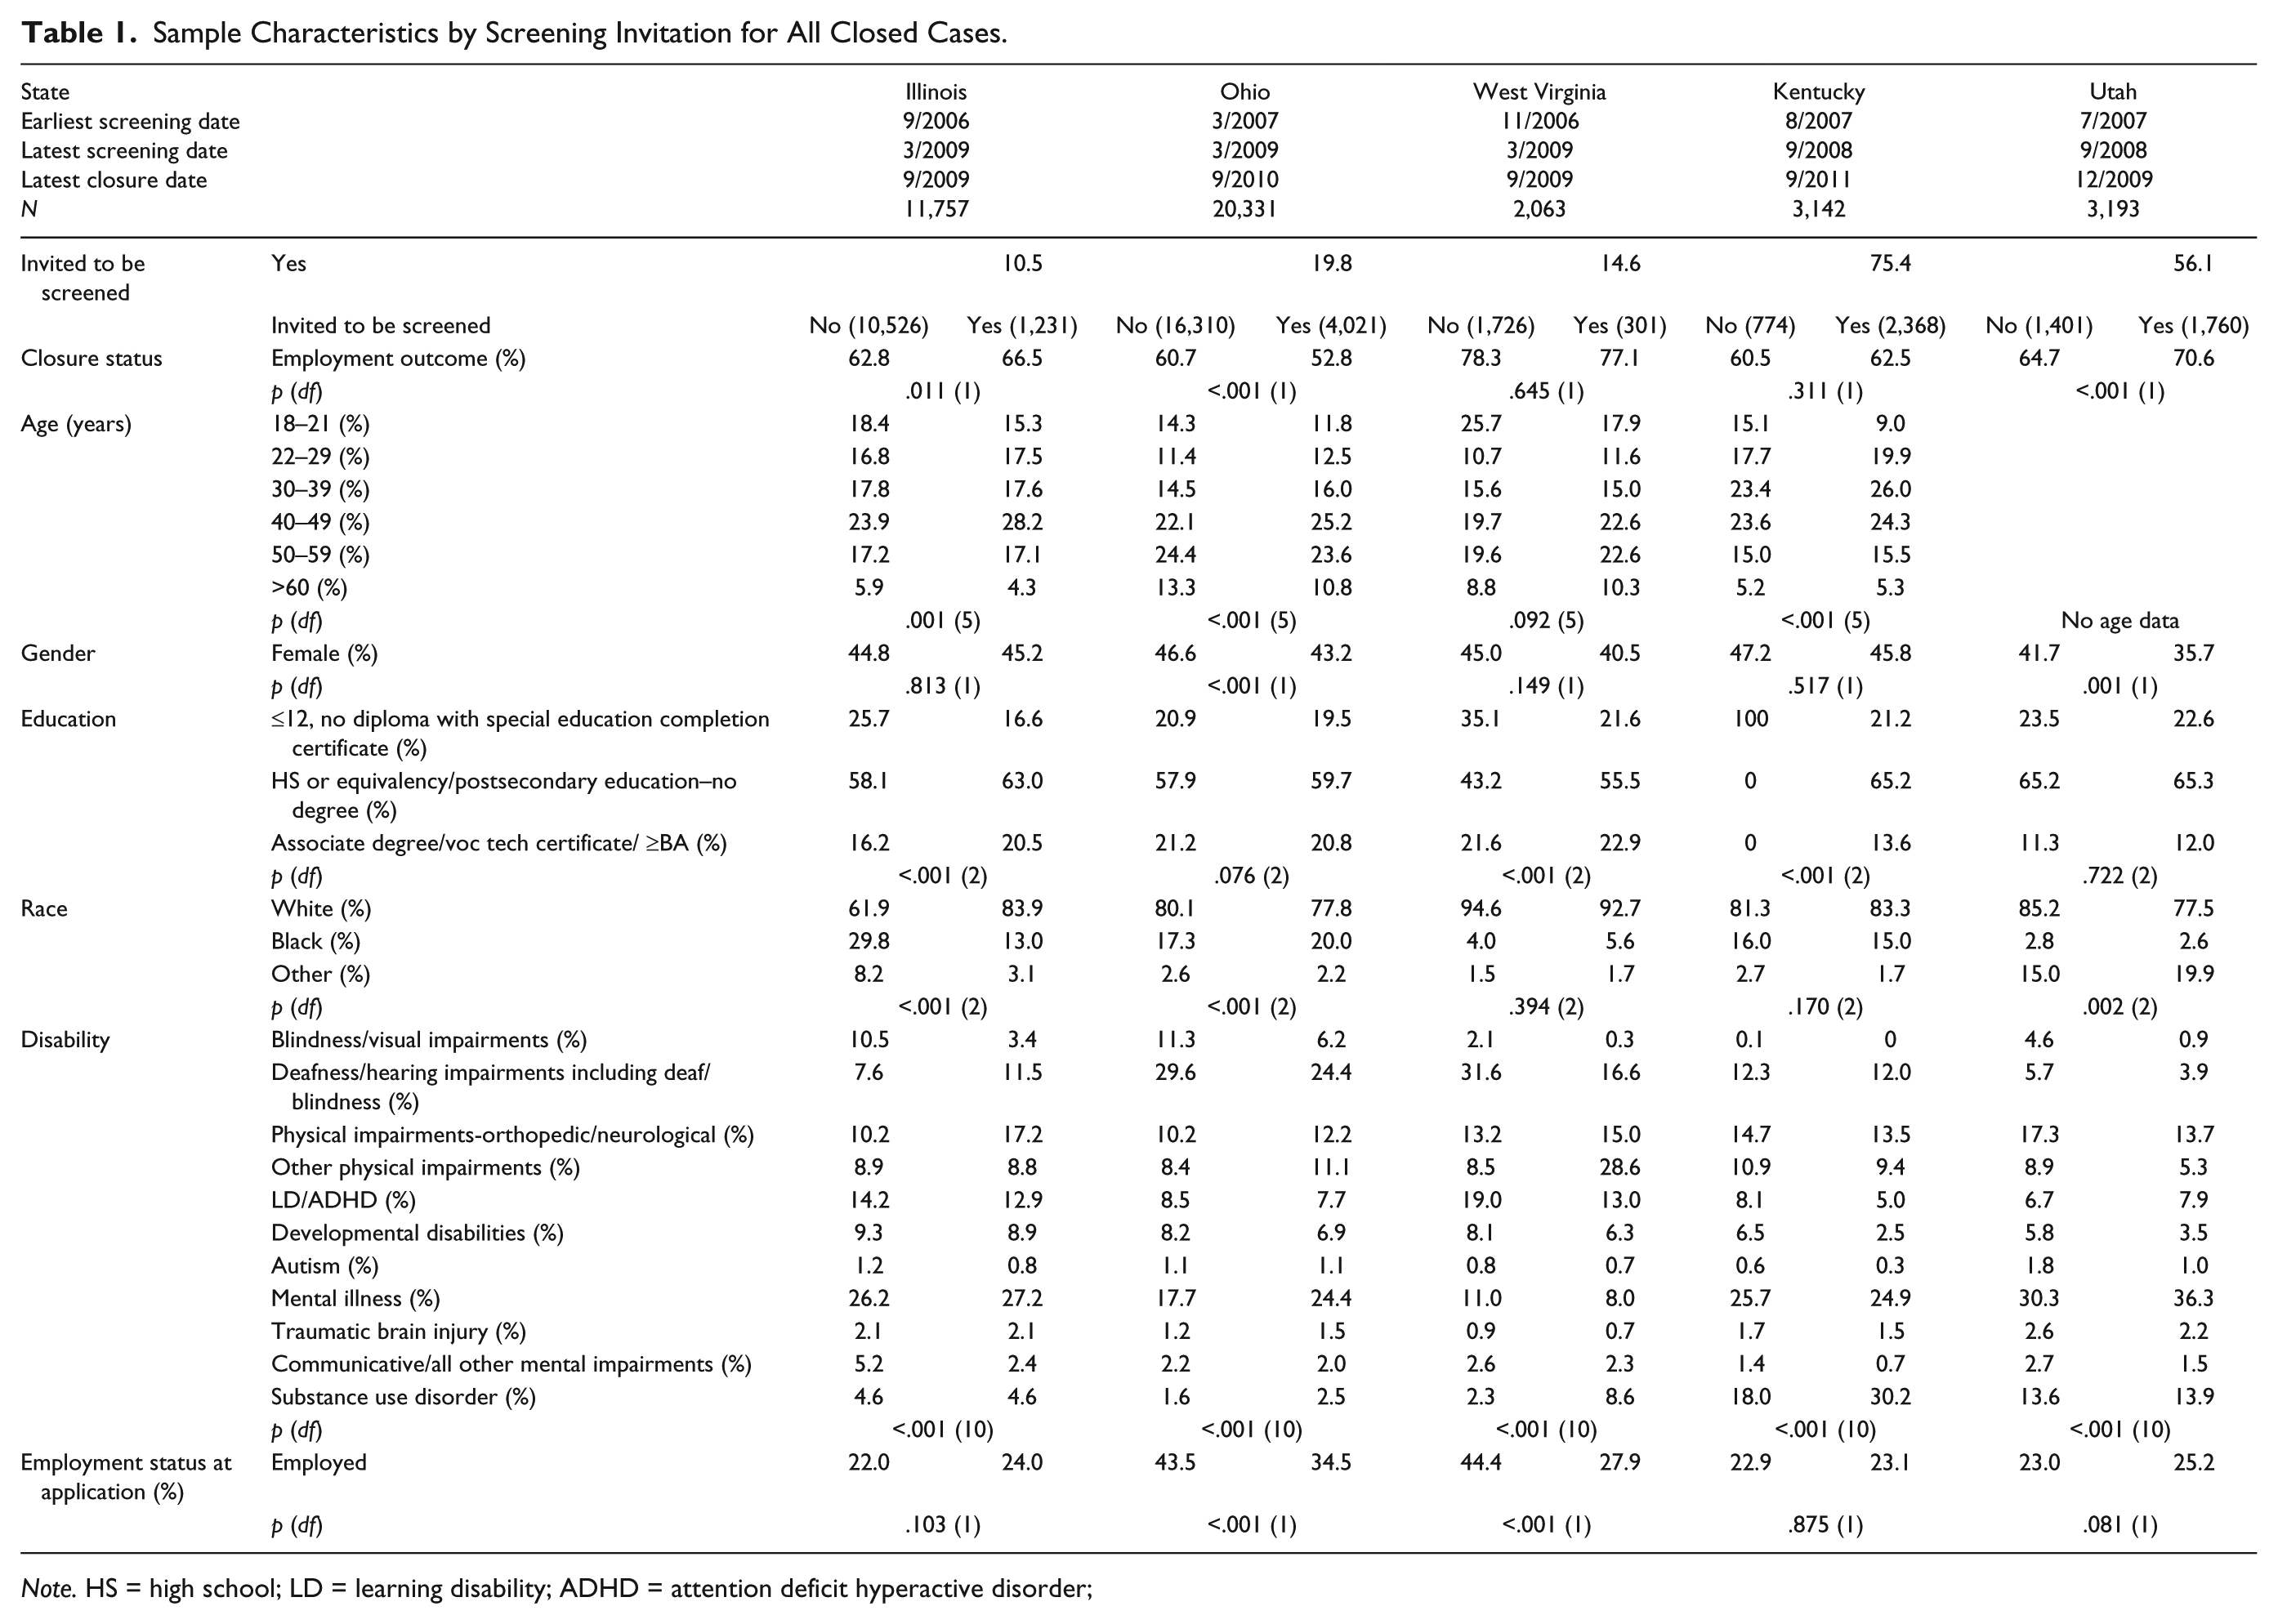
Note. HS = high school; LD = learning disability; ADHD = attention deficit hyperactive disorder;
Table 2 shows the sample characteristics for the subset of closed cases for which substance abuse screening was completed by state. For the consumers for whom we had SAVR-S results and VR records that included a case closure, the SAVR-S positive screen results ranged from 16.4% for Ohio and West Virginia to 59.5% in Kentucky. In the three states with lower SUD screen-positive rates, the screen-positive rates were higher when considering all screenings (Illinois 21.2%, Ohio 22.1%, West Virginia 22.1%), including cases that were still open and persons who exited before signing a written rehabilitation plan.
Sample Characteristics of Screened Cases With Closure Status.
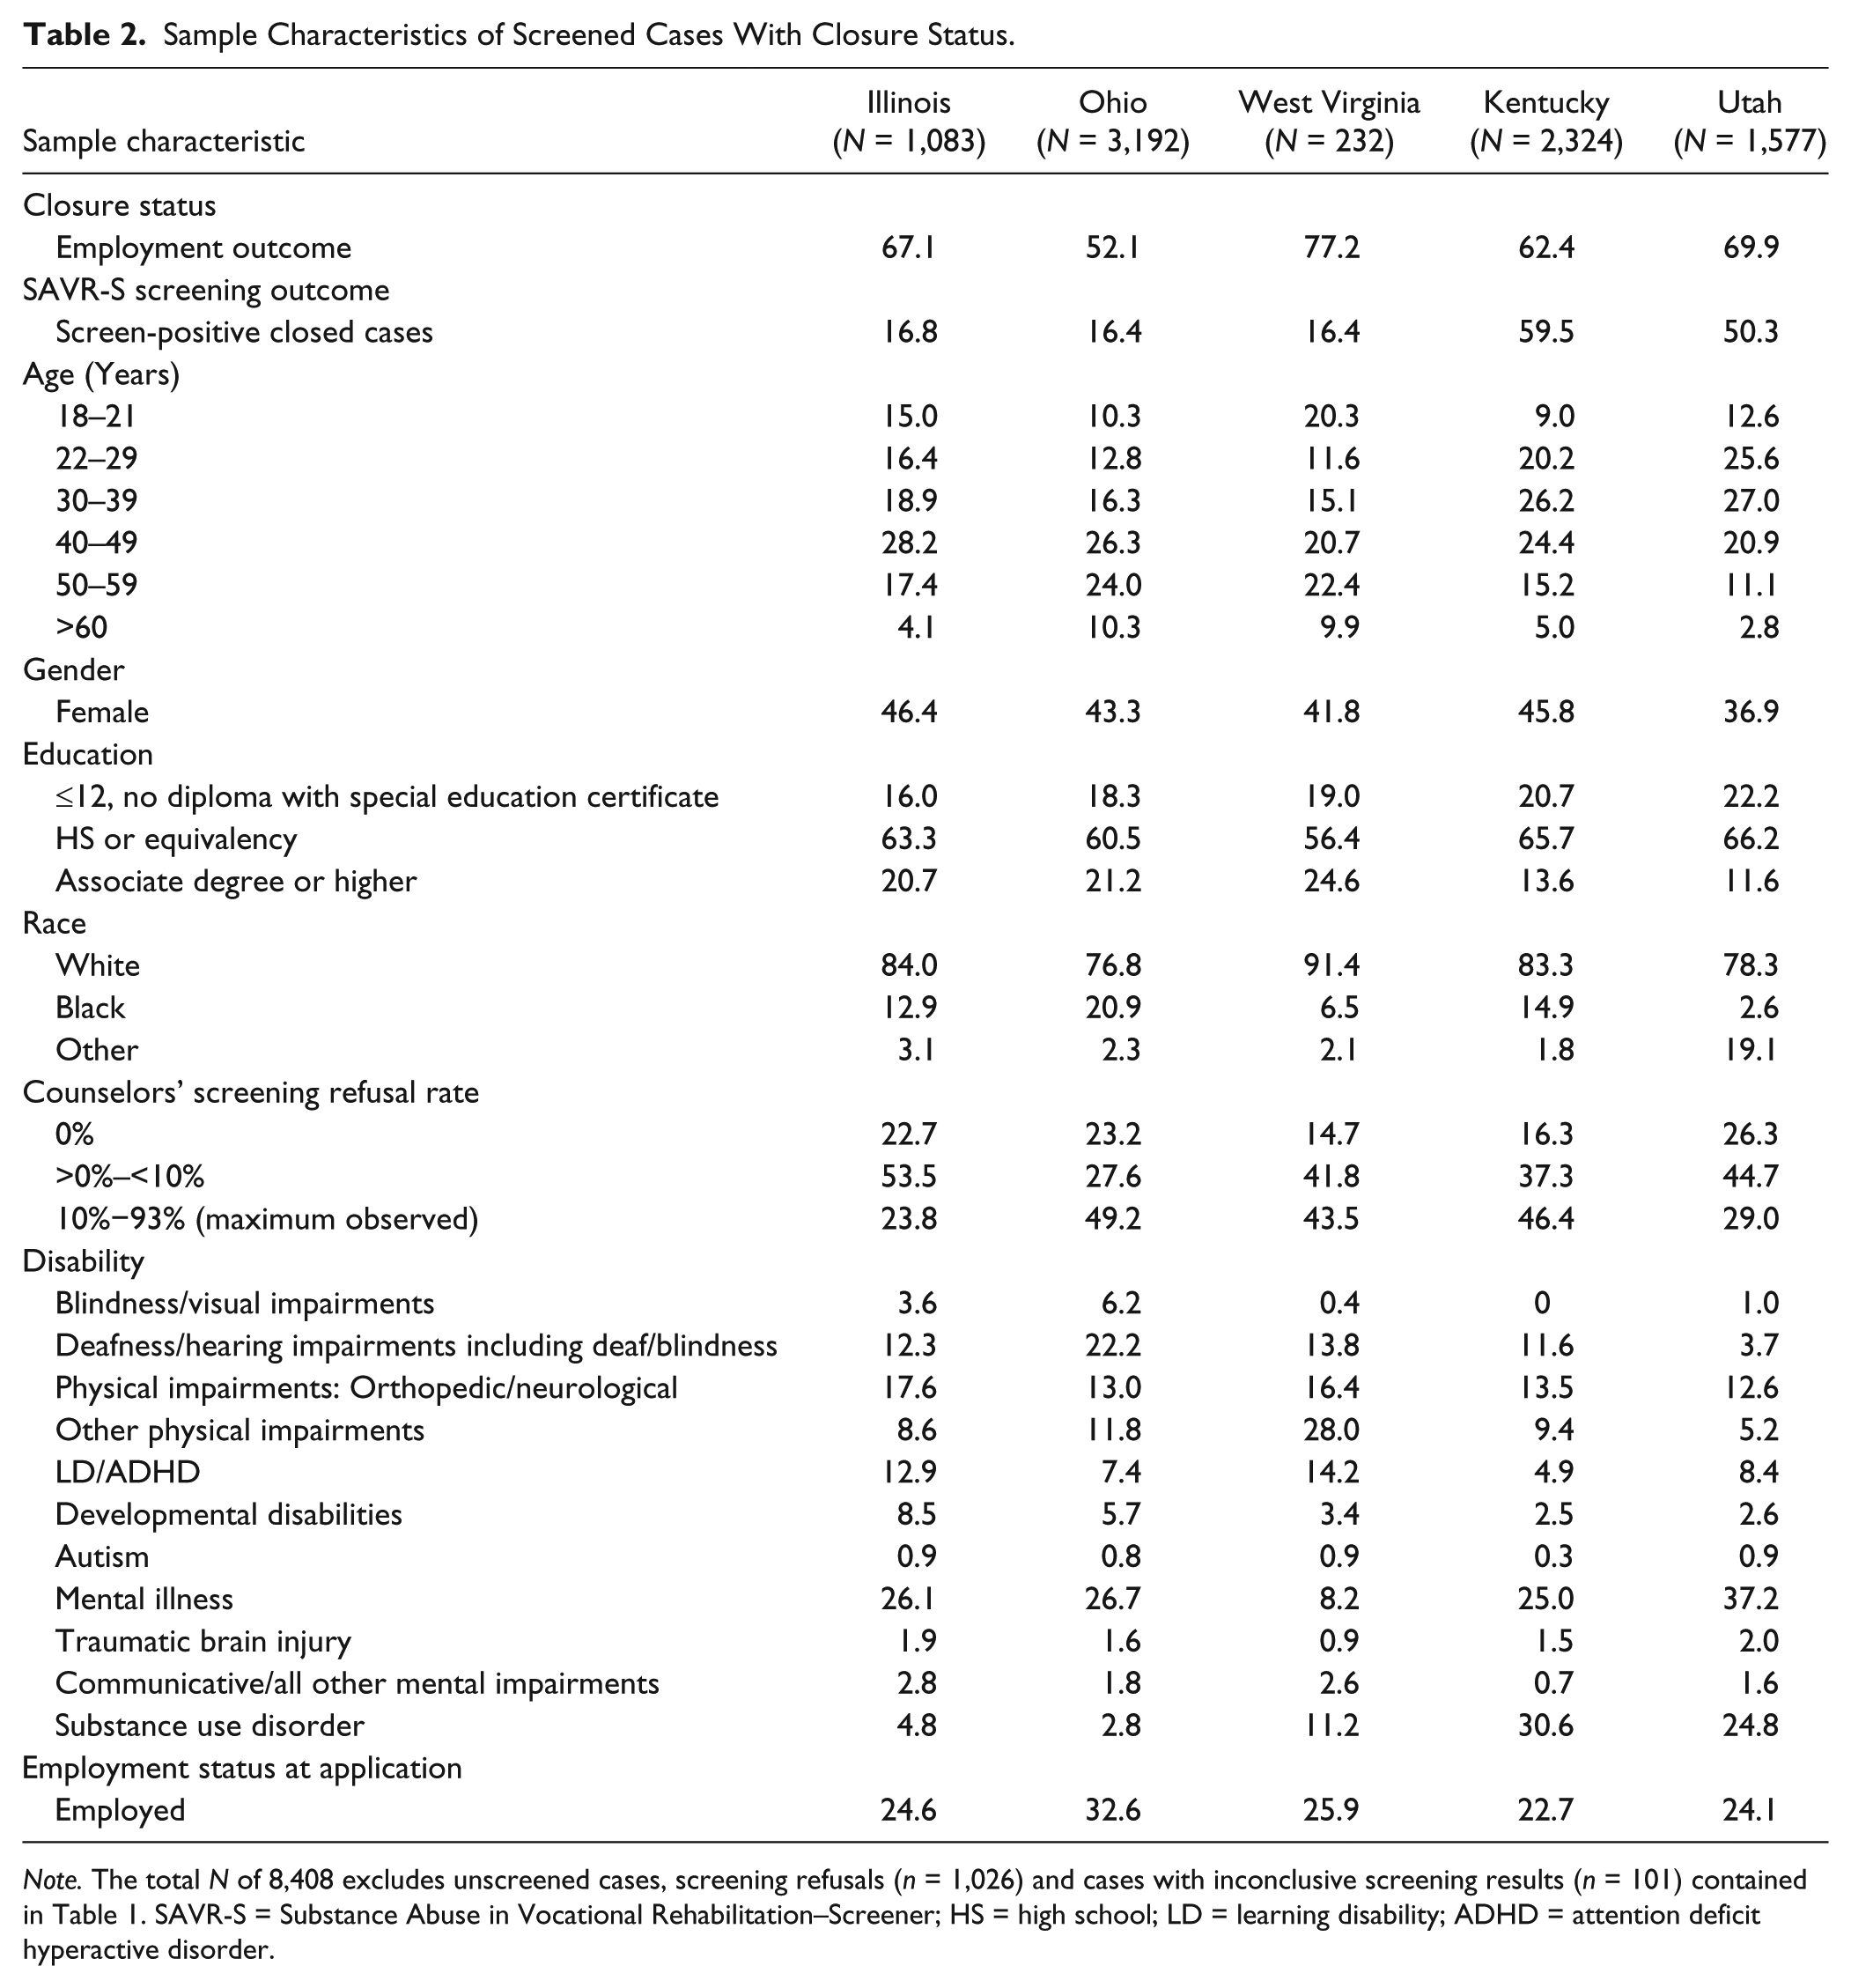
Note. The total N of 8,408 excludes unscreened cases, screening refusals (n = 1,026) and cases with inconclusive screening results (n = 101) contained in Table 1. SAVR-S = Substance Abuse in Vocational Rehabilitation–Screener; HS = high school; LD = learning disability; ADHD = attention deficit hyperactive disorder.
Hypotheses
We expected counselors who are comfortable screening for SUD would be more effective in their job, as early identification of SUD would result in their use of successful strategies for addressing SUD in the rehabilitation plan. Table 3 reports the relationships between screening invitations and employment outcomes. In three states, the associations are statistically significant, with two states in the predicted direction (Illinois and Utah). In contrast, Ohio had an 8% higher rate of successful employment for persons who were not screened than were screened.
Relationship Between SAVR-S Invitations and Successful Employment Outcome.

Note. Total N column includes cases with unsuccessful employment outcomes. The numbers in parentheses are the percent successful employment outcomes. SAVR-S = Substance Abuse in Vocational Rehabilitation–Screener.
Regression analysis of factors associated with successful closure
Consumer demographic characteristics and disability diagnoses, known predictors of VR outcomes, were included in the logistic regression model in addition to SUD screening invitation to conduct a strong test of hypothesis 1. That is, we tested whether invitation to screening was a significant predictor of closure status in a regression equation that also apportioned variance to consumer characteristics. Table 4 reports the results of logistic regression analyses predicting employment outcome for consumers served. Predictor variables included age (not available for Utah consumers; persons 18–21 years of age were the reference group), gender (women were the reference group), education (reference group: less than high school), race (White), primary disability (mental illness), employment at application (not employed), and whether consumers were invited to complete the substance abuse screening (no). The approximate variance accounted for (Nagelkerke R2) by the predictors ranged from a low of 11.4% in Utah to a high of 35.2% in Ohio. Overall correct prediction of employment status ranged from a low of 63.8% in Kentucky to a high of 78.5% in West Virginia.
Logistic Regression Prediction of Employment Outcomes for All Cases.

Note. The reference group is shown in parentheses for each independent variable; standardized regressions coefficients (odds ratios) are indicated for variables that were significant predictors in the logistic regression model. HS = high school; SUD = substance use disorder; LD = learning disability; ADHD = attention deficit hyperactive disorder; TBI = traumatic brain injury; DD = developmental disability.
As shown by the standardized regression coefficients, counselors’ invitation of substance use screening was associated with 1.31 times (or 31%) greater likelihood of employment in Utah, exp(β) = 1.31, but a 13% lower likelihood of employment in Ohio, exp(β) = .87. This outcome was demonstrated in the Table 3 univariate and Table 4 regression analyses. Primary disability was associated with employment outcome in all states, but the specific disabilities differed by state. SUD coded as a primary disability in 911 records was associated with significantly higher employment success compared with mental illness in Illinois, Kentucky, and Utah, but a substantially lower rate in West Virginia.
Table 5 shows that consumers who screen negative for SUD are more likely to achieve successful employment outcomes than persons who screen SUD positive. Except in Utah, the differences in outcomes between screen-positive and screen-negative consumers were statistically significant. Utah consumers showed no significant differences in successful closure rate for positive versus negative screener results, and their overall VR successful closure rate was the second highest of the states in the study. Utah’s successful closure rate for SUD screen-positive consumers was 68%, above twice the 33% successful closure rate in Ohio for consumers with positive SUD screens.
Relationship Between SAVR-S Screening Results and Successful Employment Outcomes.

Note. Total N column include cases with unsuccessful employment outcomes. The numbers in parentheses are the percent successful employment outcomes. SAVR-S = Substance Abuse in Vocational Rehabilitation–Screener.
Table 6 compares the rate of successful employment outcomes for consumers with positive screens with and without a cause of impairment related to SUD in the 911 files. The states with the largest percentage of reported SUD diagnoses, Kentucky and Utah, had significantly higher rates of successful employment closures for consumers who were assigned an SUD diagnosis. The consumers with and without official SUD diagnoses did not differ in employment outcomes in the three states with lower SUD rates. The differences between successful closures in diagnosed and undiagnosed SUD are addressed again in Hypothesis 3 as well as the Discussion, as these findings have implications for VR policy and practice.
Percentage of Successful Employment Outcomes for SAVR-S Screen-Positive Consumers With and Without a Cause of Impairment Related to Substance Use Disorder.
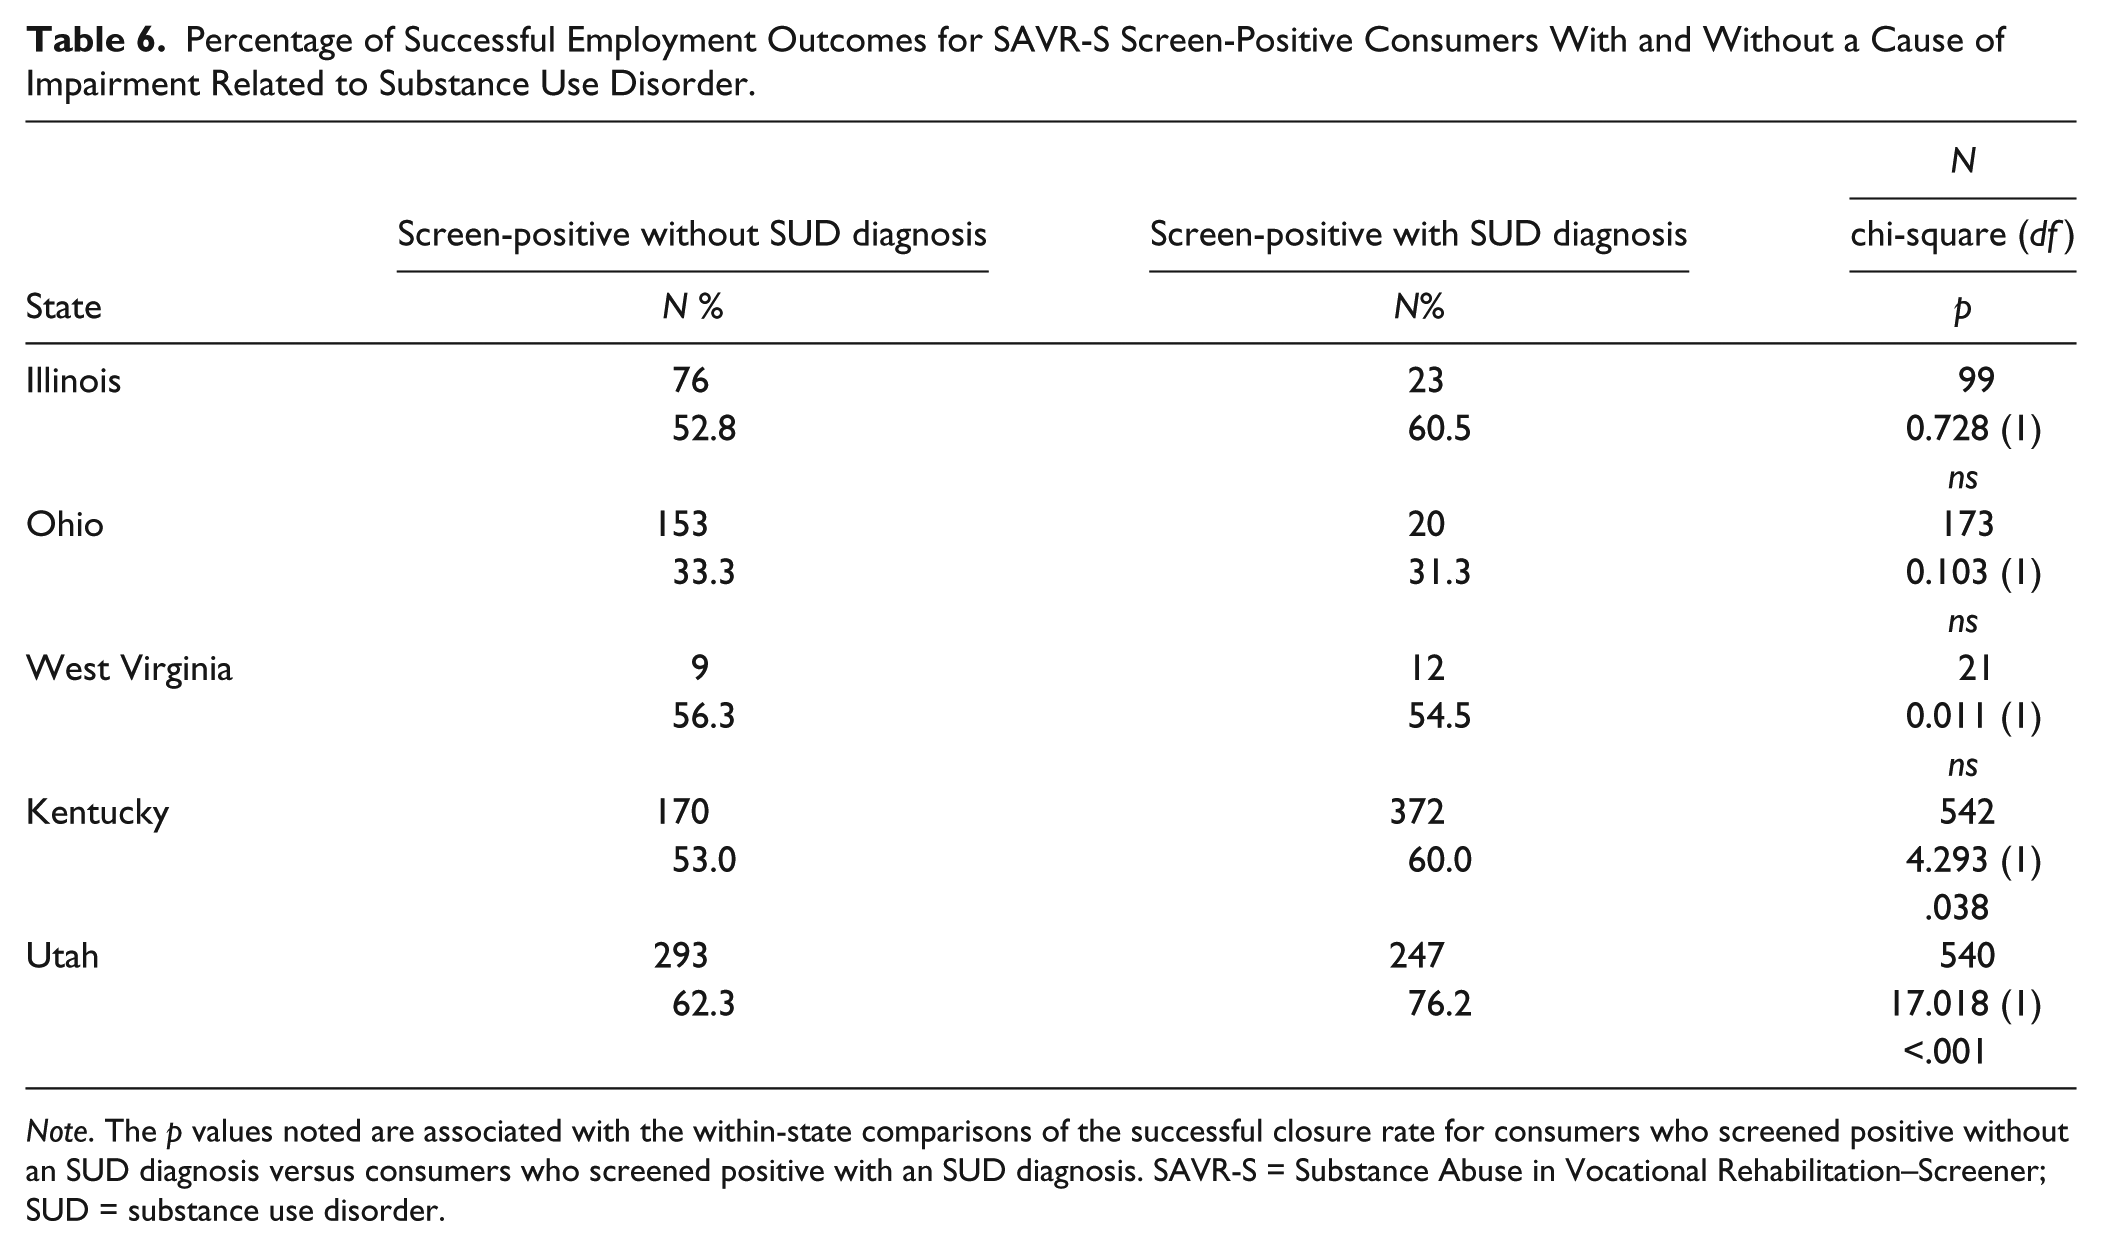
Note. The p values noted are associated with the within-state comparisons of the successful closure rate for consumers who screened positive without an SUD diagnosis versus consumers who screened positive with an SUD diagnosis. SAVR-S = Substance Abuse in Vocational Rehabilitation–Screener; SUD = substance use disorder.
The request to complete an SUD screening at VR intake could be a disincentive for completing an application or fully engaging with the VR program. Some persons may be offended by the implication that they are a substance abuser and other persons may be concerned that positive SUD screening results could prohibit them from obtaining employment assistance. We conducted two post hoc analyses to evaluate these possibilities, and review reasons for closure in VR for persons who screen positive versus negative for SUD. These results are presented in Tables 7 and 8. We classified consumers as having a short or long-term VR engagement based on when they were closed relative to service delivery, as well as classifying their reason for closure. Table 7 shows that persons who were invited to be screened in all states but Illinois did not have shorter VR contact as defined by closure status codes in comparison with persons who were not invited to be screened. In Table 8, we grouped consumers by the “reason for closure” provided by the VR counselor in the RSA-911 record. We observed a statistically significant difference in all states such that consumers who screened positive were less likely to have a favorable outcome (e.g., unable to locate, refused services, institutionalized, failure to cooperate) than persons who screen negative. The finding further informs the second hypothesis—persons with active SUD at VR application are more likely to have unsuccessful closures.
Short and Long Engagement by Screening Invitation.

Note. Closure status codes are 1: before determination of eligibility, 2: during or after trial work experience, 5: after eligibility but before services under IPE, 7: after eligibility but before IPE was developed; 3: after achieving employment outcome, 4: after services without an employment outcome.
Reason for Closure by SUD Screening Results.
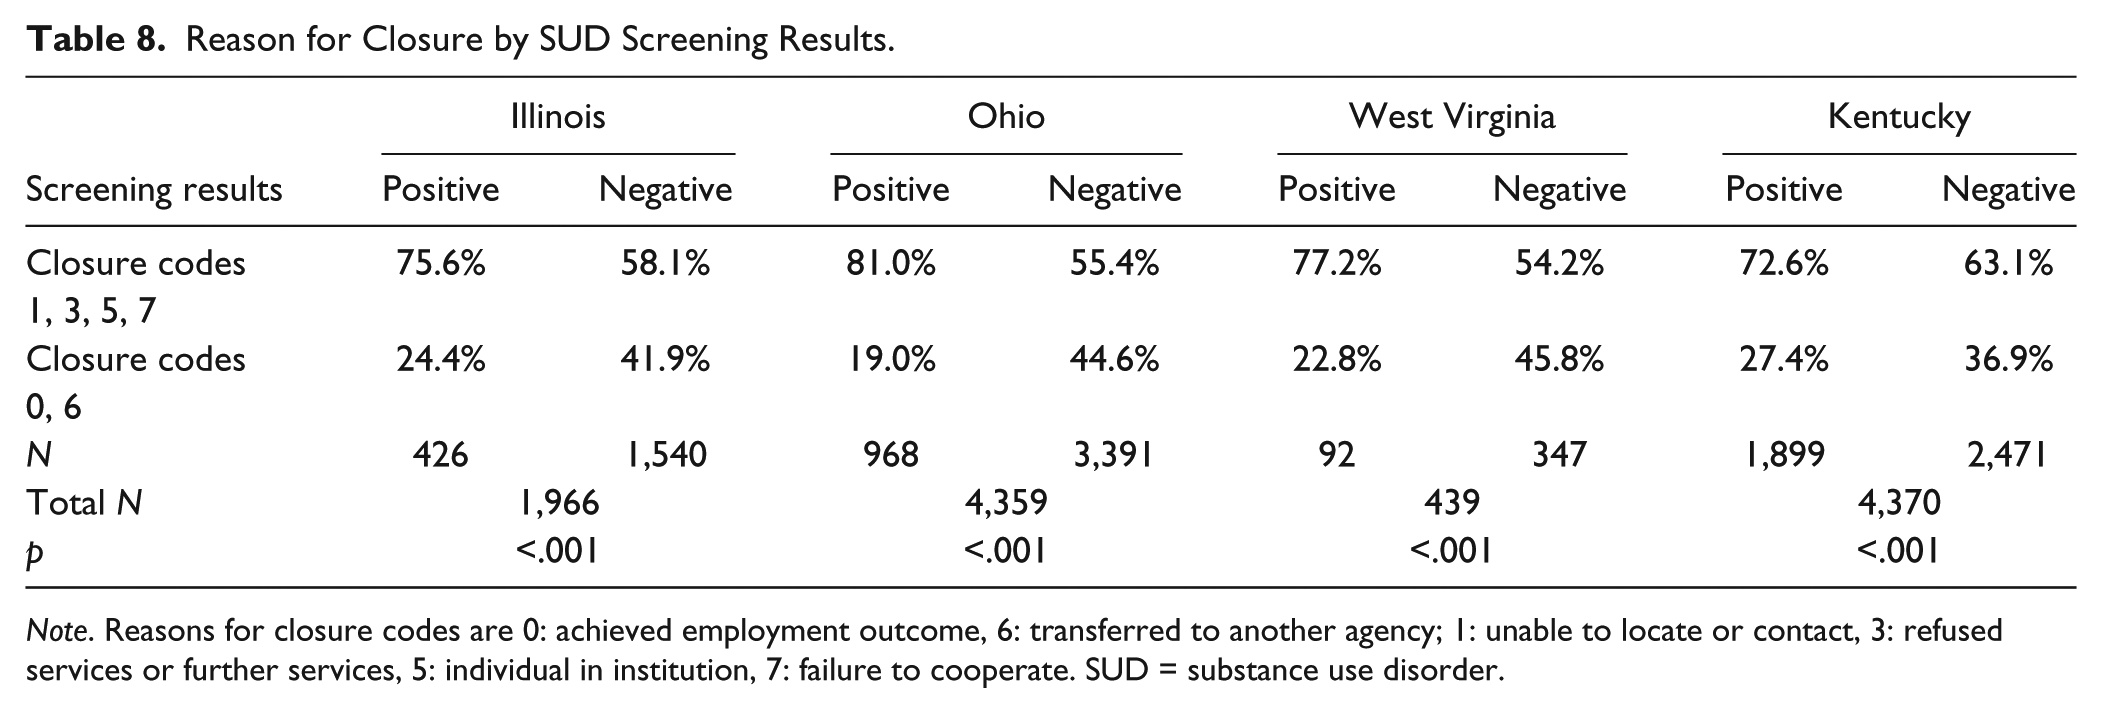
Note. Reasons for closure codes are 0: achieved employment outcome, 6: transferred to another agency; 1: unable to locate or contact, 3: refused services or further services, 5: individual in institution, 7: failure to cooperate. SUD = substance use disorder.
This hypothesis was inspired by the findings of Schwab and DiNitto (1993) and McAweeney et al. (2008) who found that consumers with a diagnosis of SUD and have successful closures receive more VR services in a shorter time and at less expense compared with consumers with other disabilities. Although Schwab and DiNitto and McAweeney et al. had conflicting results regarding the cost of services we expected that shorter time in VR would lead to less cost. We were able to test the hypothesis in all states but Utah where the number of services was unavailable. The top part of Table 9 shows that for consumers with successful employment outcomes, those with an SUD diagnosis received significantly more services in the four states with available number of services data, over a shorter period of time in three states (Illinois, Kentucky, Utah), at a significantly lower cost in Illinois and Ohio, and no difference in cost in the remaining states than did consumers without an SUD diagnosis.
Number of Services, Service Months, and Cost of Services for Consumers With Successful Employment Outcomes.
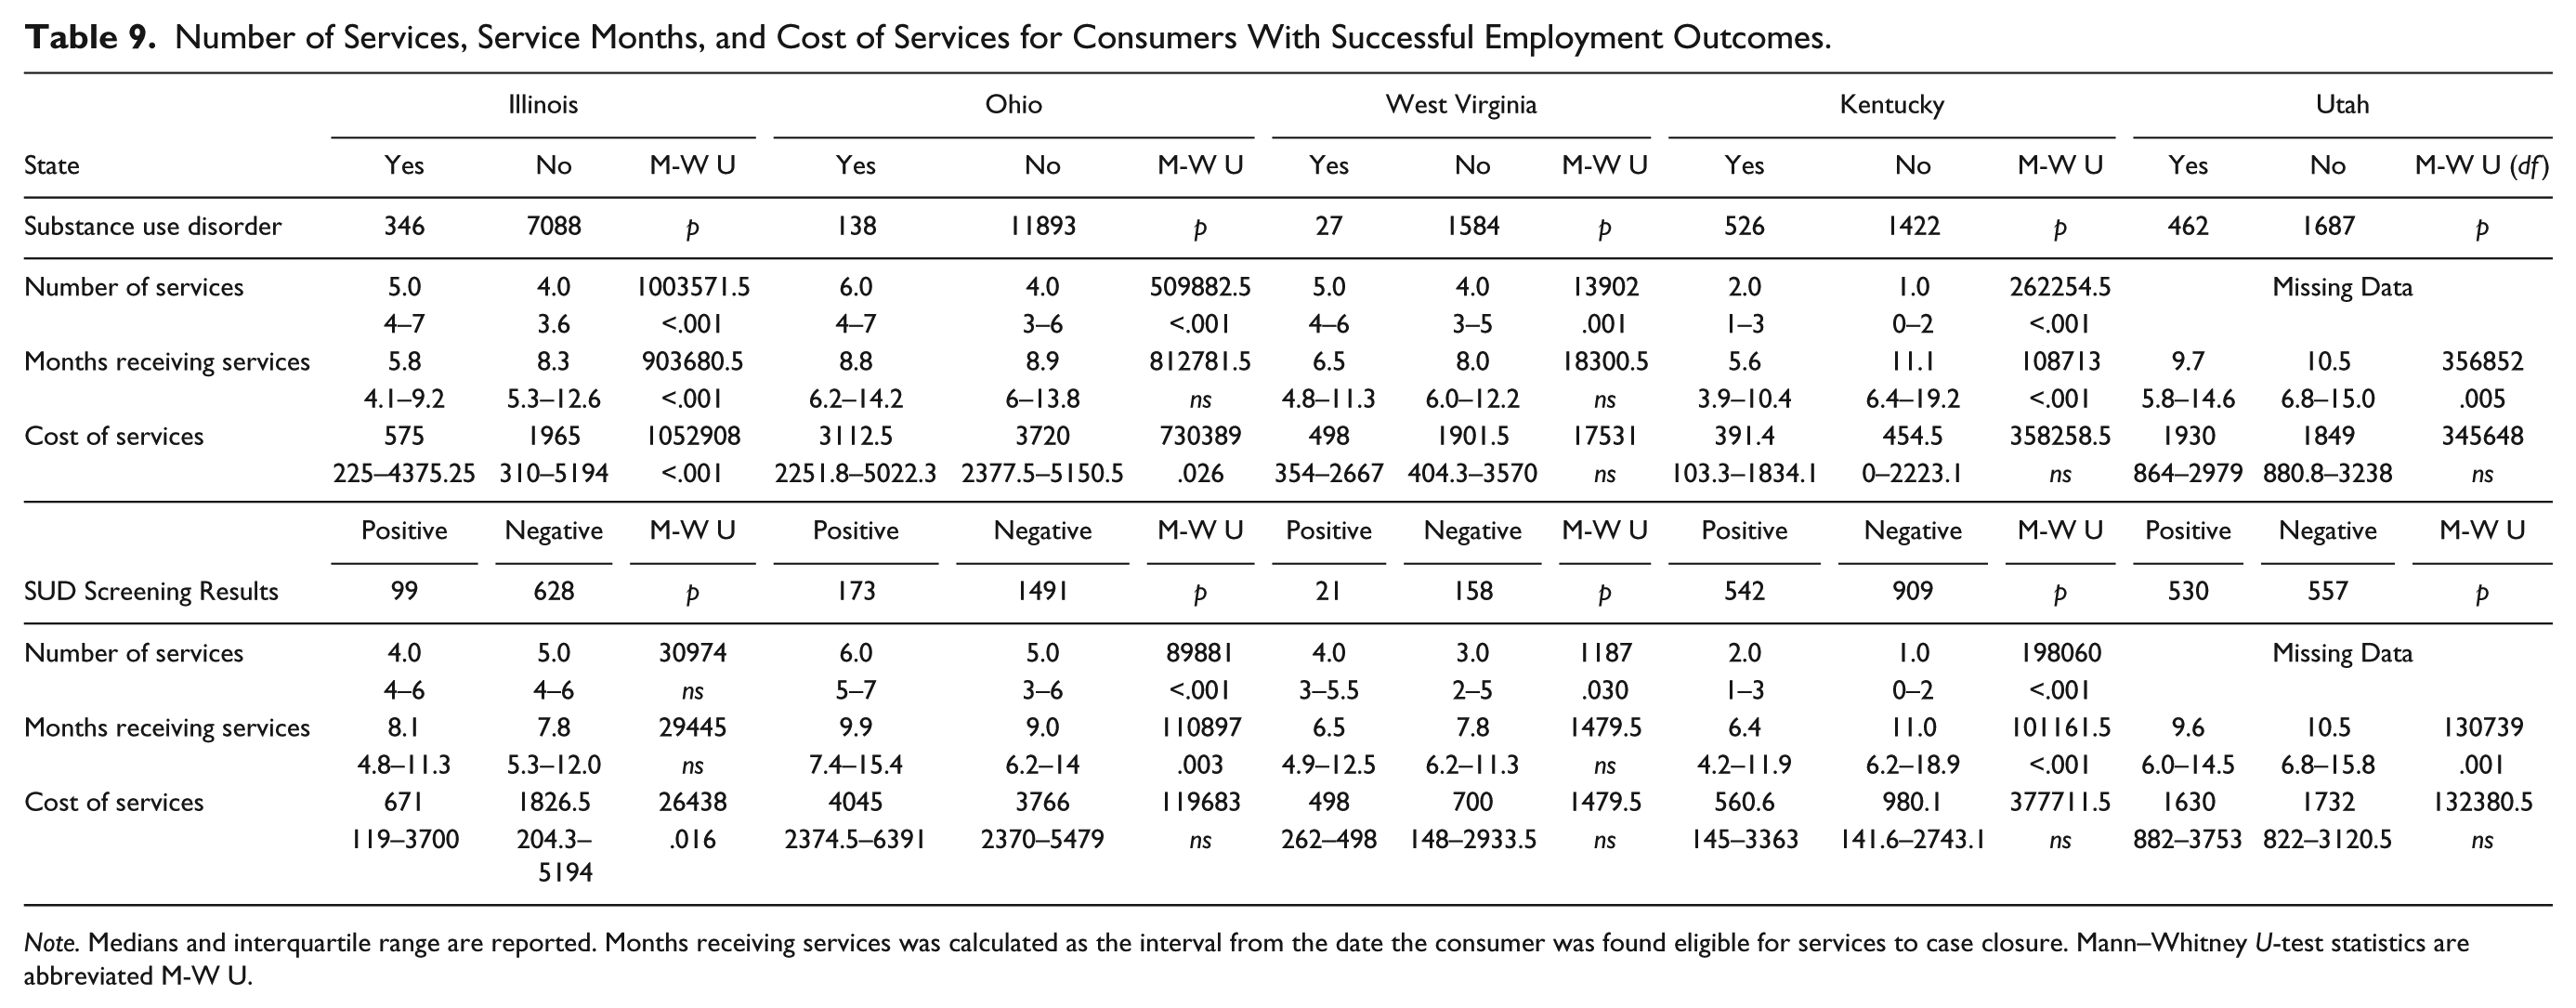
Note. Medians and interquartile range are reported. Months receiving services was calculated as the interval from the date the consumer was found eligible for services to case closure. Mann–Whitney U-test statistics are abbreviated M-W U.
The bottom part of Table 9 describes outcomes of consumers with positive SUD screens. Of the consumers closed with a successful employment outcome, consumers with positive SUD screening results received more services in Ohio, West Virginia, and Kentucky; over a shorter interval in Kentucky and Utah; and at lower cost in Illinois than did consumers with negative screening results. The associations are not as strong for persons screening positive without an official diagnosis as for consumers with an official diagnosis, but the trends are similar.
Discussion
Summary of Findings
These findings support the feasibility of using systematic SUD screening within state VR programs. The screen-positive rates in Illinois, Ohio, and West Virginia closely match the rates obtained when we validated the screener with the Diagnostic Interview Schedule in those states. In addition, overall screen-positive rates were consistent between research staff-administered screens in the validation phase and those obtained by counselors in the field trial, suggesting that consumer concerns about what counselors learned regarding substance use did not adversely affect screening results. We conclude that an invitation to complete an SUD screener does not constitute a barrier to rehabilitation for most consumers.
State-specific evidence supports the first hypothesis that universal use of an SUD screener results in a higher percentage of successful employment outcomes. The univariate analyses indicate that in Illinois, Kentucky, and Utah, persons who are screened have a higher probability of successful employment outcomes than persons who are not screened. It may not be coincidental that two of these states, Kentucky and Utah, had the highest rates of screener use by counselors (75.4% and 56.1%, respectively) and the lowest consumer refusal rates. Utah and Kentucky also had the highest state VR baseline rates for SUD as an official cause of impairment by a factor of nearly four over the other three states.
Illinois, Ohio, and West Virginia are in the lowest deciles nationally in regard to SUD listed as a cause of impairment in VR records as a primary or secondary disability, yet above 21% of all consumers screened positive for SUD in each of these states when the larger cohort of early dropouts is included in the analysis. The SAVR-S only screens for active SUD utilizing DSM criteria. In contrast to the hypothesized results, Ohio had an approximately 8% better closure rate for consumers who were not invited to complete the SAVR-S, and the lowest successful closure rate for persons who were SUD positive (33%). During the 1st year of the study, Ohio Commissioner John Connelly indicated that he and other administrators in the Ohio program were not satisfied with the success rate for persons with SUD. Utilizing within-program personnel resources as well as external consultants, they embarked on an 18-month process to revise policies, practice guidelines, and staff training materials. The scope of the current study did not allow repeated measures to evaluate the initiative’s success; however, all immediate objectives established for this process were attained by Ohio VR.
A strong and consistent finding was that VR consumers who screened negative for SUD had higher successful closure rates than those who screened positive in all states. The overall success rates and the differentials between positive and negative rates varied widely, however. Utah’s success rates were equivalent, whereas West Virginia had a 26% difference. West Virginia was the only state with a formal, written sobriety waiting period for persons with SUD; its large discrepancy may reflect this policy.
The Kentucky VR program posted the lowest refusal rate (1.4%) for SUD screening as well as the lowest rate of invalid SAVR-S responses (0.1%). Perhaps not coincidentally, Kentucky also reported the highest official rate of SUD among their state VR consumers (27%). Findings from the Longitudinal Study of Rehabilitation Services Program (Hayward & Schmidt-Davis, 2005) indicate that approximately half of VR field offices have counselors with specialized caseloads. Specializations by order of frequency from most to least frequent are school, hearing impairment, mental illness, visual impairment, and developmental disability. Although it is less common to have specialized SUD caseloads, Kentucky has several such counselors throughout the state. They assisted with training and protocol decisions when the study was initiated. Their presence in the VR system appears to facilitate prompt diagnosis and case services for Kentucky’s SUD population.
In contrast to Kentucky, the highest rate of SUD screening refusal was in West Virginia, which shares rural demographic characteristics with Kentucky. West Virginia has an official sobriety waiting period that introduces an ethical issue related to utilizing an SUD screener where a positive screen may result in denial of immediate access to VR services in spite of the consumer’s or counselor’s wishes. A larger metropolitan area in this state had a particularly high percentage of screening refusals; it may be that counselors marked “refused” on the screeners to avoid conflicts with providing immediate VR services versus placing someone on a sobriety waiting list. In our parallel study of SUD policy, we learned that the sobriety waiting period in West Virginia apparently was created in an effort to avoid paying for methadone maintenance as SUD treatment providers routinely referred their consumers to VR once they entered treatment (Moore et al., 2008). As in other states, far less methadone maintenance is provided to West Virginia residents now; however, the VR sobriety policy continues, as do the financial strains on its VR system. West Virginia closed its residential rehabilitation unit while this study was conducted, and a very strict order of selection was invoked statewide. Considering the lower average costs for successful rehabilitation for persons with SUD, a state VR program might benefit in fiscal savings if SUD is more often used as a disability diagnosis when it is appropriate.
Our replication and extension of the findings of Schwab and DiNitto (1993) as well as McAweeney et al. (2008) suggest that persons with SUD who successfully complete VR, both with an official diagnosis as demonstrated in the earlier research, or based on a positive screening result as shown in the current study, attain employment outcomes by receiving more services, but over a shorter time and with less expense than consumers with other conditions. Even when SUD was not noted as an official disability diagnosis in the case file, successful employment outcomes for consumers who screened SUD positive were associated with receiving a greater number of services while utilizing less case management time and the same or fewer VR dollars than consumers with other disabilities. These findings demonstrate that while SUD can be a barrier to employment, outcomes for VR consumers with SUD can be positively influenced by service delivery policies.
The findings also show that it may be important to distinguish consumers who screen positive for SUD with and without an SUD disability diagnosis because their success in rehabilitation may differ. Consumers who would otherwise have had an undiagnosed SUD without the screening were more numerous than consumers with an officially listed SUD, especially in states that do not proactively address SUD. Data from Kentucky and Utah showed that consumers with hidden SUD that was identified in the screening still were somewhat less likely to be successful in VR than those with official recognition. For example, the likelihood of successful outcome for Kentucky consumers was 53% for those who only screened positive for SUD and 60% if SUD was identified in the VR record; in Utah, the groups’ successful outcomes differ by 62% versus 76%. Further research is needed to identify factors responsible for the increased success rates among those with an officially recognized SUD.
Our ongoing training and field contact with state VR agencies led us to appreciate that SUD diagnoses in VR services are influenced by counselor attitudes, time restrictions, supervisor and manager expectations, written and informal agency policies, and the availability, accessibility, quality, and scope of SUD-related treatment services. During training sessions in several states, a common concern of counselors was the lack of publically funded, accessible, SUD treatment options as well as time constraints. Many counselors reported that they collect so much data already that another “form” would take up more time. For all practical purposes, Illinois ceased non-Medicaid coverage of SUD treatment during this field trial, though the legislature subsequently reinstated limited funding. In most states, rural options for SUD treatment are limited, especially for individuals who require disability accommodations. A screening tool may have more appeal to VR staff if SUD assessment and treatment options are readily accessible, especially within the short time period when counselors are gathering information and developing IPE in concert with consumers.
Future Research Directions
There is considerable variability in how and under what circumstances VR programs utilize SUD diagnostic codes. More research is needed on how experienced counselors translate SUD screening information into effective rehabilitation plans. The consumer–counselor relationship is a critical factor for employment success. Further research is needed on identifying strategies that are successful in assisting persons with undiagnosed SUD revealed during screening.
Study Limitations
Several limitations constrain our analyses and findings. Only five states participated in this study; it is not clear to what extent the results generalize nationwide. However, given the variability in state outcomes it appears as though the variation would extend to other states. As state VR agencies only report closed cases to RSA, we encountered several problems in obtaining open cases that were served during the study. Consequently, we could only use closed cases with SUD screeners in some analyses. The total number of SUD screeners that counselors administered is underreported due to missing closure data. Finally, the postscreening time interval for the last screened cases was relatively short, resulting in exclusion of some cases that were still open.
Some state client identifiers required that we create a matching variable for the SAVR-S. This solution was problematic and resulted in unmatched IDs. Information system departments in VR programs are often pressed to publish or analyze more data than their resources allow, one consequence of shrinking state and VR budgets.
In spite of a component of the training focused on the validation statistics and clinical uses of the screening instrument, some counselors were reluctant to use what they regarded as an experimental screener in rehabilitation planning. Although counselors were told by their administrators that the screener was a clinical instrument, some counselors reported in feedback sessions that they described the screener as experimental when discussing it with consumers. This description may have adversely affected the overall efficacy and utilization of the screener in development of IPEs. It appeared that more effective use of the screener occurred in states where VR administrators actively participated in staff training and shared expectations about screening.
The screener took longer than was acceptable according to some counselors, especially with the need to fax forms for scoring and interpretation. A web-based application may have increased counselors’ ease of use and the likelihood of matched records may have been greater with such a system, too.
Conclusion
The study results allow us to answer the two questions guiding this study affirmatively: The use of a SUD screener helps counselors achieve improved VR outcomes and, statewide SUD screening can be implemented effectively. The availability of a tool specifically designed to screen for SUD among VR consumers can provide counselors the comfort they may need to address this issue. There are large state-to-state variations in the RSA-911 data regarding the percentage of VR consumers with a primary or secondary diagnosis of SUD; thus, it is not surprising that the results of this field study varied considerably by state. It is likely that state SUD policies; counselor practices, education and experience; and state funding for SUD treatment all contribute to the effectiveness of SUD screening within VR programs.
Systemwide SUD screening may be most beneficial in states that demonstrate effectiveness in addressing SUD. This may be reflected by a higher percentage of SUD diagnoses within the state VR census or outcomes data indicating that SUD success rates approximate other consumers. That said, even in states with low official SUD diagnosis rates, above 20% of screened consumers were identified as having suspected active SUD with the SAVR-S. SUD continues to be a significant clinical challenge for VR. For state VR programs that are not as prepared to serve consumers with SUD, awareness building, policy and practice review, and manager training should precede initiation of systemwide screening.
There are few evidence-based practices for addressing SUD in an employment-focused context; but, abuse of alcohol, illicit drugs, and prescription medications must first be identified and diagnosed to improve the effectiveness of services. VR program administrators and counselors recognize the importance of improving service delivery for persons with SUD as evidenced by their estimates of the prevalence of SUD obtained via national polls (Moore et al., 2008). Effectively addressing SUD in VR agencies requires work on several fronts, including policy review and development, staff training, commitment of limited agency resources, and adoption of protocols to identify SUD and plan for individualized rehabilitation services. Perhaps most importantly, VR must be supported by state and federal agencies to create solid relationships with other entities serving their consumers. In particular, closer working relationships with substance abuse treatment and criminal justice agencies could provide powerful tools for improving the effectiveness of each agency.
Footnotes
Acknowledgements
This research required the dedication of numerous staff members. The authors gratefully acknowledge Kendall Stagg for assisting with research design and project management; Holly DeMark Neumann and Bridget Gerber for coordinating site visits and data cleaning; and Jae Chul Lee for assistance with analysis of RSA-911 data. Much-appreciated feedback and encouragement was provided by the Illinois Department of Rehabilitation Services (Robert Kilbury, former Director), the Ohio Rehabilitation Services Commission (John Connelly, former Director), the West Virginia Department of Rehabilitation Services (Deborah Lovely, former Director) and Drs. John Corrigan and Margaret Glenn. Finally, vocational rehabilitation counselors and community service organizations, too numerous to mention, were critical to data collection. John Connelly and Carl Suter (CSAVR) also provided constructive comments on earlier research designs and drafts. To all of them, we offer our most sincere gratitude.
Declaration of Conflicting Interests
The author(s) declared the following potential conflicts of interest with respect to the research, authorship, and/or publication of this article: The SASSI Institute produces and distributes screening reports for the Substance Abuse in Vocational Rehabilitation Screener (SAVR-S); the SASSI Institute received partial compensation for their involvement in planning the delivery platform for the study; however, neither the Institute nor the Institute-affiliated coauthor received compensation for SAVR-S screening reports conducted for this study.
Funding
The author(s) disclosed receipt of the following financial support for the research, authorship, and/or publication of this article: This study was conducted as part of the Rehabilitation Research and Training Center on Substance Abuse, Disability, and Employment, a project funded by the National Institute on Disability and Rehabilitation Research (H133B040012), awarded to Wright State University (Dennis Moore, project director; Allen Heinemann, project principal investigator).