



Abstract
State vocational rehabilitation (VR) agencies are well positioned to assist youth aged 16 to 24 years with disabilities who are transitioning from school to work. Using Rehabilitation Services Administration (RSA)-911 records matched to Social Security Administration (SSA) administrative records, this article adds to the knowledge about state VR agency provision of services to youth with disabilities and differences in outcomes based on SSA benefit receipt status. Although agencies’ statistics varied widely, almost one in six SSA beneficiaries who sought VR services had at least 1 month of benefit suspension due to work within 48 months of their VR applications, and about one in 10 VR applicants without SSA benefits at the time of their VR application received SSA benefits within 48 months. SSA beneficiaries received services from VR agencies at the same level as non-SSA beneficiaries, but the levels at which they were employed when they closed from services were lower. The results have two main policy implications. First, the level of resources to which agencies have access may be important in influencing the outcomes we measured. Second, agency differences in the proportion of SSA beneficiaries who eventually had benefit suspension due to work point to the potential for additional gains by agencies in this area.
State vocational rehabilitation (VR) agencies are well positioned to assist youth and young adults (aged 16–24) with disabilities who are at a transition crossroads, moving from school to work and facing different issues related to Social Security Administration (SSA) disability benefit receipt. VR agencies can help individuals attain their vocational goals by offering specific vocational training, soft skill development, assistance with job search activities, and financing and other supports for higher education. Effective VR services can help young adults avoid the need to seek disability benefits and help those who do receive benefits become more self-sufficient. Young adults with disabilities who receive disability benefits are typically at a greater economic disadvantage than those not receiving disability benefits, in that they work less and have lower earnings than their peers. This disadvantage may occur because these youth might have more severe health conditions affecting their ability to work, along with benefit disincentives that might limit earnings and a desire not to lose cash benefits or health coverage associated with disability benefits. Given these factors, we expect that VR outcomes for youth with disabilities vary according to the receipt of disability benefits.
This article adds to the knowledge about state VR agency provision of services to youth with disabilities and differential outcomes according to disability benefit receipt status. We do this by presenting new statistics on the SSA outcomes for youth with and without disability benefits who apply for VR services. The study answers the following questions:
In the next section, we present background information on the use of VR and disability benefits by transition-age youth with disabilities. In the “Method” section, we provide details of the data, measures, and methods used. Answers to the study’s research questions are provided in the “Results” Section. In the final section, we conclude with implications for policymakers and suggestions for future research.
Background
VR agencies are joint federal-state programs that aid those eligible for rehabilitation services in attaining employment. VR agencies have some latitude in determining the services they provide and the clientele they serve, resulting in state-level variation in VR program services, staffing, and expertise for youth with disabilities. Many agencies, recognizing the special needs of youth, have developed practices to ease the transition from school to work or postsecondary education. Agency staff often participate in secondary school transition planning for students receiving services under the Individuals With Disabilities Education Act (IDEA) or the Rehabilitation Act of 1973. For eligible youth who initiate the process, VR staff develop a service plan aimed at achieving competitive, paid employment and service provision to help individuals attain their vocational goals.
VR agencies vary substantially in the way they serve youth with disabilities and the types of services they provide (Honeycutt, Bardos, & McLeod, 2015; The Study Group, 2007). For example, on a national basis, the average number of individuals with disabilities, aged 14 to 24, who exited VR was about twice that of their older working-age peers, a statistic that reflects the strong focus of the VR system on the younger population (Stapleton, Honeycutt, & Schechter, 2010). This study also shows that agencies vary greatly in the extent to which youth receive services: The proportion of individuals with disabilities in this age range who received services varied sevenfold across states. Honeycutt, Thompkins, Bardos, and Stern (2015) confirmed differences in how agencies serve youth, from application to service delivery to closure status. On average, 8% of youth with disabilities, aged 16 to 24, applied to a VR agency, 56% of applicants received services, and 56% of those served were employed when they closed from VR after receiving services. However, behind these averages lies substantial variation across VR agencies—as much as 50 percentage points between the agencies with the highest and lowest statistics.
Young adults with SSA disability benefits are of special concern to policymakers in a broad sense and to VR agency staff in a more specific way. Youth with disabilities are eligible to receive disability benefits, either from Supplemental Security Income (SSI; a means-tested program) or from Social Security Disability Insurance (SSDI), when they meet medical eligibility criteria common to both programs. In addition, SSI eligibility depends on a means test and SSDI eligibility depends on earnings history (or, for some, their parents’ earnings record). The employment outcomes and engagement in productive activities (such as school enrollment) for youth with disabilities are typically below those of youth without disabilities, and they are even lower for youth with SSA benefits (Hemmeter, Kauff, & Wittenburg, 2009; Loprest & Wittenburg, 2007). These lower outcomes may reflect a combination of the severity of the youth’s disability and their educational attainment. Furthermore, the potential loss of some or all SSA benefits (and the associated health coverage) may discourage young beneficiaries from attempting to work, but the benefits themselves and other services available to beneficiaries may facilitate their return-to-work efforts. The potential advantages for youth leaving the benefit rolls, or not obtaining benefits to begin with, are large for both youth and the federal government, as earnings and the savings in cash and health benefits can compound over a lifetime. As a component of the SSA programs, individuals have access to incentives that encourage work, such as VR services through state VR agencies or employment networks (SSA, 2013).
The rules for benefit suspension, particularly due to earnings, vary by benefit type. Individuals whose medical condition improves can lose their benefits, no matter the type. Upon reaching age 18, child SSI recipients must successfully undergo a redetermination of eligibility based on the adult definition of disability to continue receiving cash assistance. If they do not meet the medical criteria for adults (having a condition that limits or prevents substantial gainful activity [SGA]), their income and health supports are terminated, along with their access to other programs that require disability benefit receipt for eligibility. SSI recipients with earned income above a low threshold generally lose US$1 of benefits for every US$2 of earnings. SSDI earnings rules are less restrictive if earnings are below the SGA amount (US$1,040 a month for non-blind beneficiaries and US$1,740 for blind beneficiaries in 2013); full benefits are paid indefinitely. If earnings are higher, the SSDI rules are more restrictive, except during a trial work period (TWP) consisting of 9 months during a 60-month period and an additional 3-month grace period. Cash benefits for SSDI beneficiaries cease completely if earnings exceed the SGA amount. During the 36 months after the TWP, benefits are reinstated in months when earnings fall below the SGA amount, but after that, benefits can only be reinstated through a formal reinstatement process.
SSA youth are an important focus of VR agencies for three reasons. First, beneficiaries represent a large subgroup of individuals seeking VR services. Second, agencies can receive reimbursements from SSA for services they provide to SSA beneficiaries with successful employment outcomes (O’Day & Revell, 2007). These reimbursements are an additional source of income for agencies and perhaps more likely for the transition-age population, given that younger SSA beneficiaries are more likely to have employment outcomes than older SSA beneficiaries (e.g., Livermore, Hoffman, & Bardos, 2012). Third, VR services can influence SSA receipt because VR agencies are well positioned to provide necessary services at a critical juncture, the crossroads of youth’s transitions from school to work. For beneficiaries, youth can receive the supports and training they need to obtain gainful employment and reduce or cease receiving cash benefits. For non-beneficiaries, VR agencies can potentially be a diversion program, leading youth with disabilities toward gainful employment and away from benefit receipt. For youth who meet the SSA medical criteria but not the earnings criteria for SSDI, VR agencies potentially can help youth make enough money to meet the earnings history criteria for SSDI but not earn more than the SGA amount, which makes them ineligible for SSDI.
Despite this interest, few studies have focused on understanding the relationship between VR and disability benefit receipt for transition-age youth. Evidence from a survey of current and former SSI recipients aged 19 to 23 suggests that fewer than about one in seven had ever received services from a VR agency, but those involved with VR were no more or less likely to be employed (Loprest & Wittenburg, 2007). Evidence from the Youth Transition Demonstration, a study of youth receiving or at risk of receiving SSA benefits, found that no more than 14% of SSI youth received services from a VR agency in the course of a year (Honeycutt & Wittenburg, 2014). In a separate study, SSI youth who received supported employment services through VR were more likely to be employed 2 years after completing services, and SSI youth who received education services through VR were less likely to be employed but had higher earnings up to 5 years after completing VR services (Berry & Caplan, 2010). The latter study also identified state contextual factors—the poverty rate and the agency consumer-to-counselor ratio—as influential to outcomes for youth SSI beneficiaries. More broadly, other studies have found negative relationships between SSA benefit receipt (or public income support) and employment outcomes for youth (e.g., Giesen & Cavenaugh, 2012; Gonzalez, Rosenthal, & Kim, 2011), which is consistent with the greater body of literature on the relationship between benefit receipt and outcomes for adults.
The current study addresses the gaps in the literature by identifying the rates at which VR applicants with SSA benefits (SSA VR applicants) receive VR services and eventually have any benefit suspension due to work. It also presents information on the rate at which VR applicants without SSA benefits (non-SSA VR applicants) eventually obtain SSA benefits. We present this information both in aggregate and at the state level.
Method
Data Sources
For this study, we used Rehabilitation Services Administration (RSA)-911 Case Service Report data for federal fiscal years 2004 through 2011 and SSA’s Disability Analysis File (DAF) to develop application and closure cohort files for youth and young adults who applied for VR services in fiscal years 2004, 2005, and 2006. The RSA-911 data contain information about each person who exited VR services during the year, such as demographic characteristics at the time of application, types of services received, and employment outcomes for those who received services. The DAF contains a longitudinal record for every person age 10 through the Social Security full retirement age (currently age 66) who received Social Security or SSI disability benefits at any time from 1996 onward; at the time of our analysis, it contained data through 2011. By matching these data to RSA-911 records, we were able to identify which VR youth applicants received benefits at the time they applied for VR services or within 48 months of their VR applications. Some individuals may have received benefit awards or changes in the final year of the DAF that are not reflected in the file (for instance, the award may have occurred in 2012 and been retroactive to the previous year). Therefore, we restrict our analysis to examine outcomes up to 4 years after VR application (or through 2010 for the 2006 VR applicant cohort). We defined receipt of benefits at application as being in current pay status and as receiving a positive cash benefit within 2 months before or after the month of application.
For the purpose of this study, we defined the transition-age youth population as those aged 16 through 24 at the time they applied for VR services. Only youth who had applied to VR agencies that serve the 50 states and the District of Columbia were included in the analysis. We excluded applicants to agencies that exclusively serve blind individuals (approximately 3% of all closures). Furthermore, our sample includes only individuals who were alive at the time of case closure and, because individuals could have multiple case records (reflecting multiple VR applications in 2004, 2005, and 2006), we limited the sample to only one record per individual, dropping all case records for an individual after the earliest observation.
To develop annual applicant cohorts to be followed from application to case closure and beyond, we included only youth who applied for VR services in fiscal years 2004, 2005, and 2006. This realignment allows sufficient time through 2011 (5–7 years) to observe their completion of VR services. It has the added value of comparing the experiences of youth who applied at about the same time, thereby controlling for local, state, and agency factors that could vary for individuals who close at the same time with and without receiving VR services.
Measures
Transition-age youth ratios
We first calculated several state-level measures to assess the intersection of VR agencies and SSA disability benefit programs. From the DAF, we obtained counts of the number of SSA youth aged 16 to 24 with SSI and/or SSDI benefits in April 2004, 2005, and 2006 for each state. From the matched RSA-911 and DAF, we identified the number of SSA VR applicants (youth who received SSI and/or SSDI at the time they applied for VR services) and non-SSA VR applicants.
To answer our first research question, we used these counts to calculate a series of transition ratios for both SSA and non-SSA VR applicants:
The first three ratios show the extent to which SSA and non-SSA youth apply for VR, receive services, and have successful outcomes; the latter ratio combines those ratios to provide an overall measure of application and VR involvement for SSA and non-SSA youth. It is important to emphasize that the employment outcome is that measured by the VR agency at closure and reflects a VR process outcome; it does not capture youth who obtained jobs without obtaining VR services, either before or after closure.
Two additional transition ratios examine longer-term outcomes to answer our second and third research questions. For SSA VR youth applicants, we measured the proportion who had any suspension or termination of benefits due to work within 48 months of their VR application (benefit suspension). We excluded from the numerator youth whose benefits terminate for other reasons, such as a rejection for medical improvement or based on an age-18 redetermination. For non-SSA VR applicants, we calculated the proportion who received SSI or SSDI within 48 months after their VR application (benefit acquisition).
To address the fourth research question and improve our understanding of these ratios, we calculated correlations between the ratios and between the ratios and additional state measures. These additional state measures included (a) the number of transition-age youth (from the American Community Survey [ACS]), (b) the percentage of transition-age youth with a disability (from the ACS), (c) the mean cost of purchased services per youth served (from RSA-911), (d) the VR grant allotment per working-age person with a disability (the level of federal funding a state receives for its VR agency divided by the number of people with disabilities; from the U.S. Government Accountability Office, 2009), (e) the annual state unemployment rate (from the Current Population Survey), (f) the youth labor force participation rate (from the ACS), and (g) an agency’s order of selection (OOS) status, indicating an agency’s inability to serve any but the most severe applicants (from RSA-113 records, which are cumulative case reports from VR agencies).
Analytical Approach
We rely on descriptive analyses to explore the variation in how VR agencies work with SSA youth. We chose a descriptive approach, rather than more complicated statistical analysis, for two reasons. First, we were dealing largely with population statistics, in that we observed the outcomes for all agencies and almost all VR youth applicants for the years we selected. Second, we were primarily interested in showing the range of statistics across agencies and their relationships with each other. For each of the measures, we present agency-specific values on the range across agencies and the agencies with relatively high or low values for these ratios. For demographic variable analyses, we compare the differences between specific VR groups using t tests, adjusting for significance using a Bonferroni correction for multiple comparisons. A final analytical approach compares agency- and state-level factors with the SSA transition ratios using Pearson’s correlation coefficients statistical tests where applicable. Given the small number of agencies (51), this analysis is exploratory in nature, and the results are presented to inform future research and generate ideas on how to examine the influences of these ratios, particularly in regard to individual characteristics of VR applicants, agency differences in their approaches to youth applicants, and federal and state policy changes.
Results
To What Extent Do VR Youth Applicants With and Without SSA Benefits Receive Services and Close With Employment?
VR applicants
In Table 1, we present state-level counts of youth with disabilities and youth with SSA benefits, as well as the number of SSA VR youth applicants. Each year over the period from 2004 through 2006, nearly 30,000 youth receiving SSA benefits applied for VR services. These youth accounted for 21% of all transition-age youth applicants to VR per year and 4% of SSA youth. The proportion of a state’s VR applicant pool that received SSI or SSDI at application ranged from 11% in North Dakota to 38% in Washington State, with the latter value being an outlier (Connecticut showed the next highest value at 30%). A possible source of this variation is resource limitations, as agencies in OOS may serve more SSA beneficiaries because they can only provide services for those with more significant disabilities, a category that most SSA beneficiaries fall into, and perhaps discourage individuals with less severe disabilities from applying. This issue may explain the high value for Washington State, which was in OOS during the analysis period. The variation across agencies may also reflect the level and nature of outreach by the agency to youth with disabilities, as well as state demographics, as some states contain a higher concentration of youth SSA beneficiaries than others.
VR Youth Applicants by State Agency (3-Year Average).
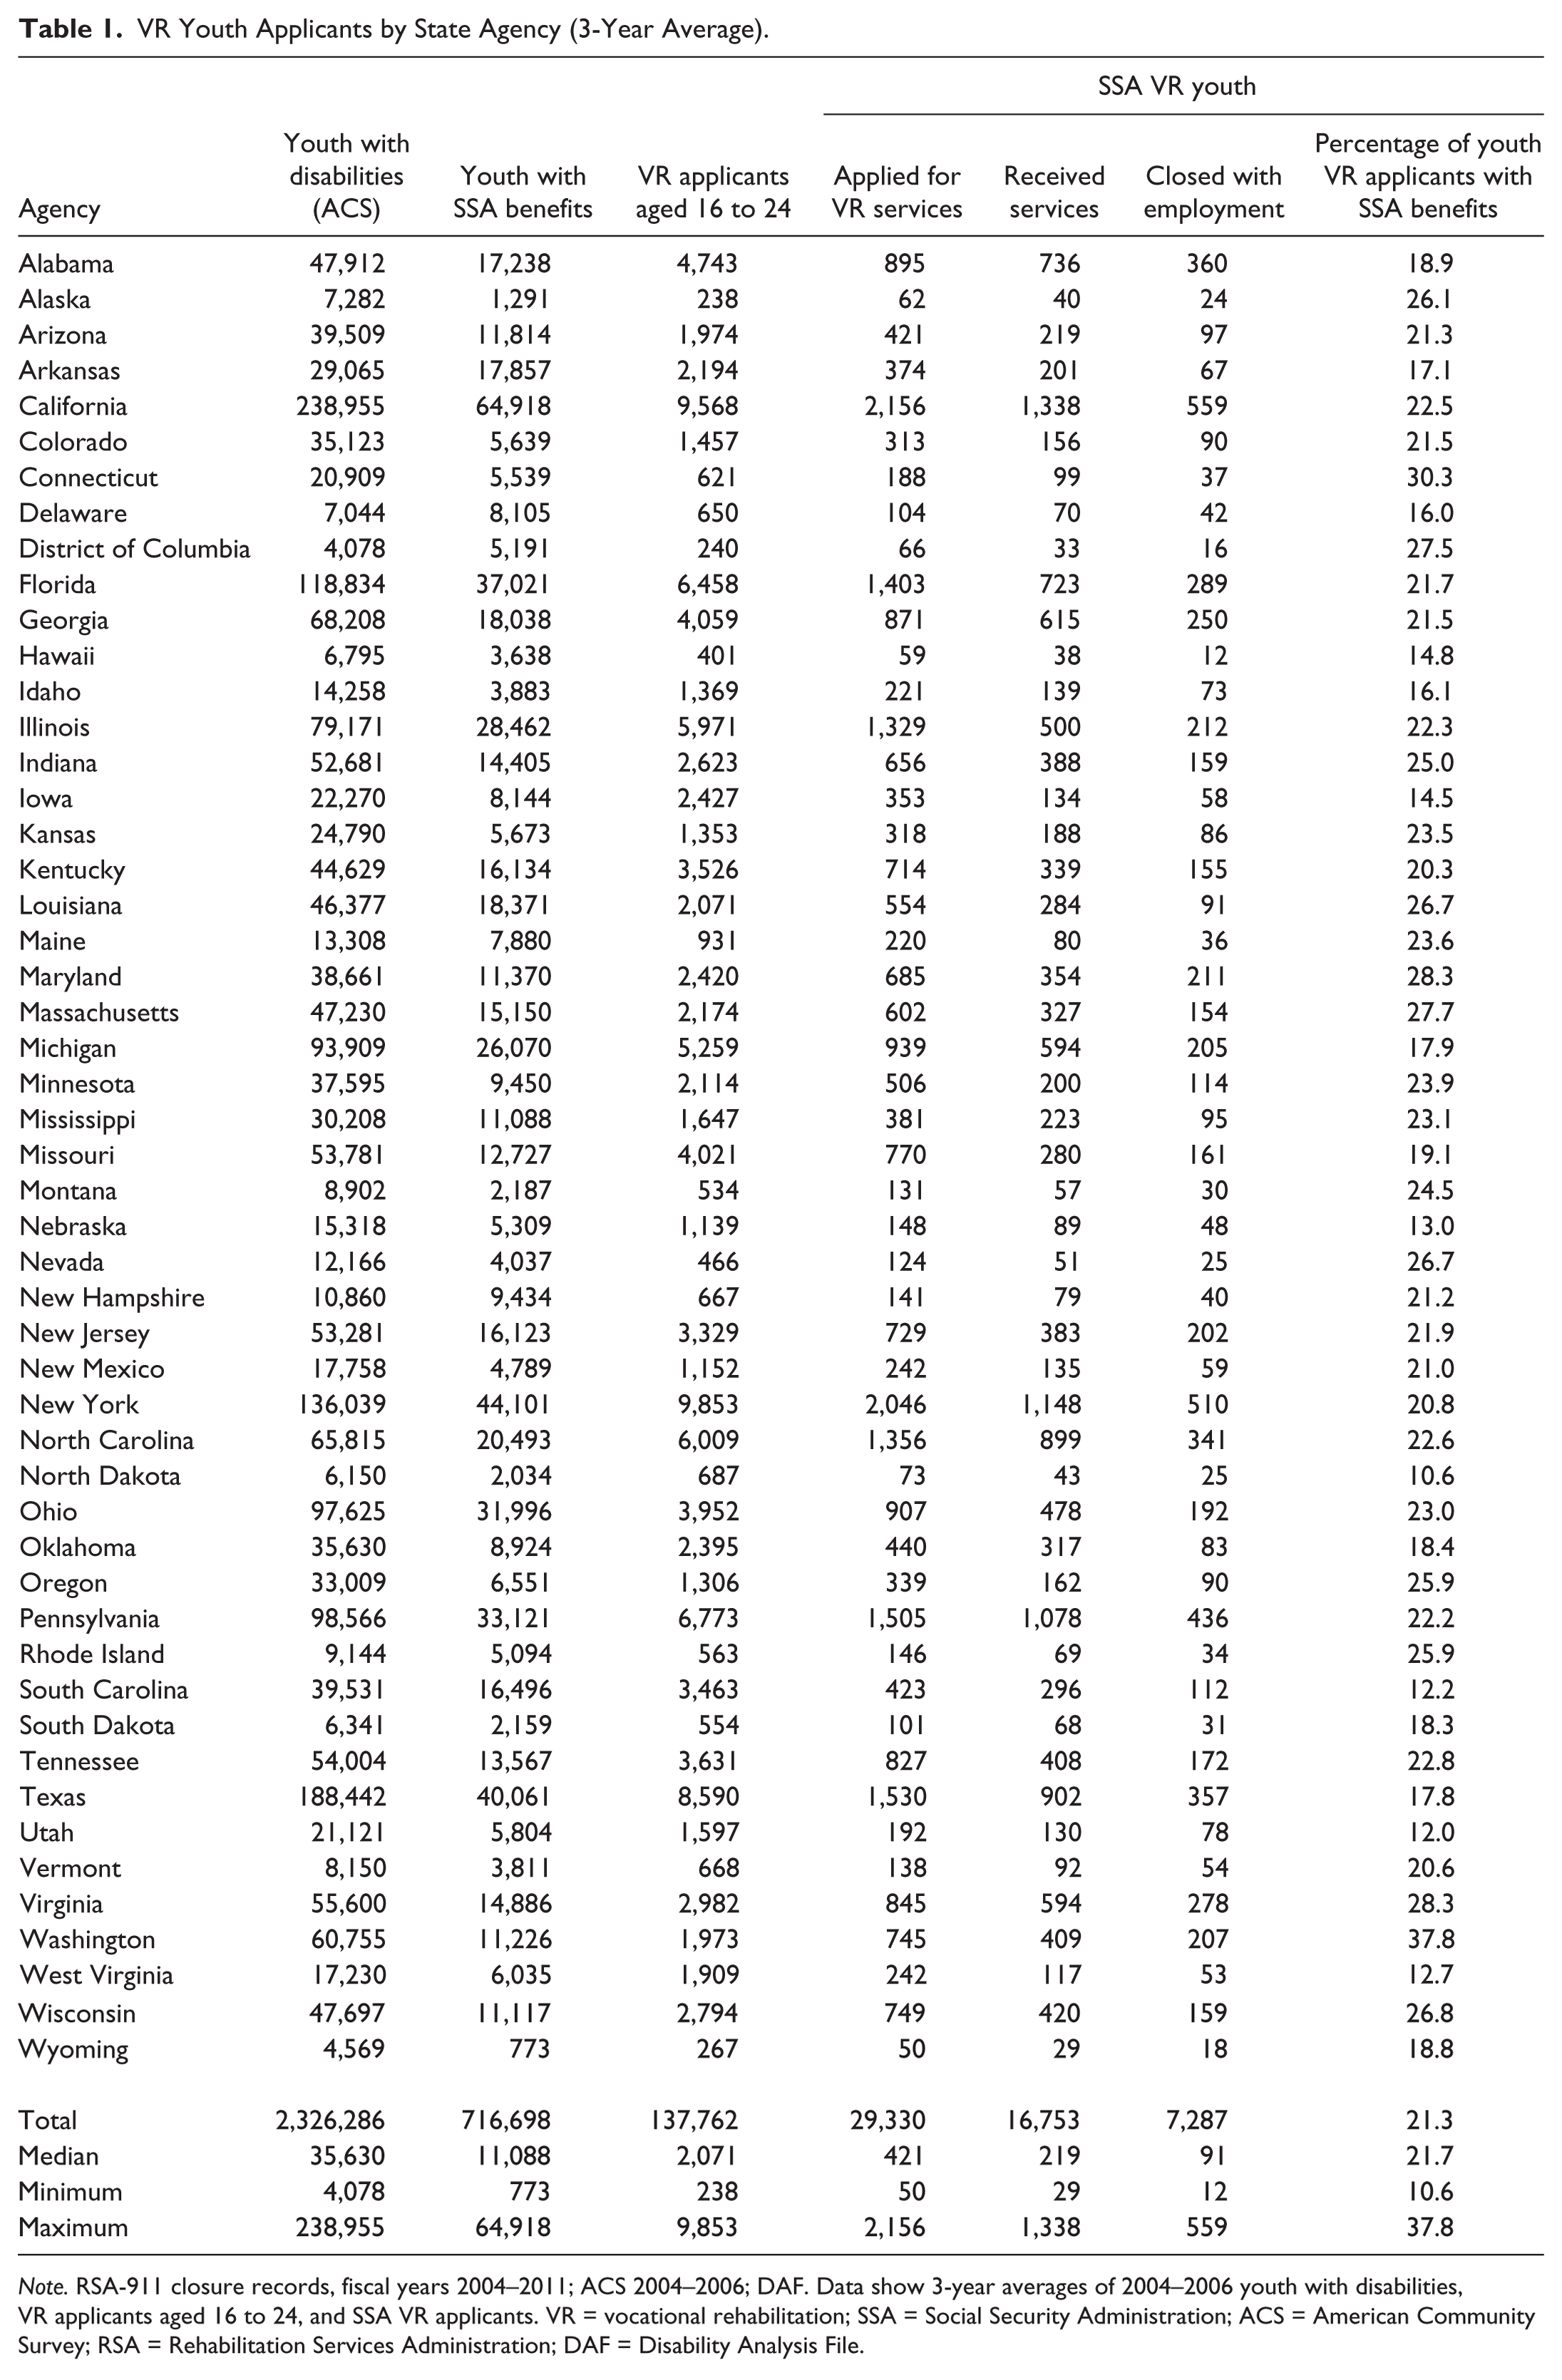
Note. RSA-911 closure records, fiscal years 2004–2011; ACS 2004–2006; DAF. Data show 3-year averages of 2004–2006 youth with disabilities, VR applicants aged 16 to 24, and SSA VR applicants. VR = vocational rehabilitation; SSA = Social Security Administration; ACS = American Community Survey; RSA = Rehabilitation Services Administration; DAF = Disability Analysis File.
The number of youth receiving SSA benefits at application can be decomposed by program participation: SSI-only beneficiaries, SSDI-only beneficiaries, and those receiving both benefits (concurrent beneficiaries; not shown). As expected, given the relatively low opportunities for employment, most SSA VR youth (76%) received SSI-only benefits. The remaining SSA VR youth were divided equally between SSDI-only and concurrent benefits.
Applicant-to-youth ratio
On average, 4% of transition-age SSA beneficiaries and 5% of youth with disabilities applied to a VR agency in a given year (see Table 2). The values on this measure across agencies ranged from 1% (Delaware and the District of Columbia) to 7% (North Carolina, Washington State, Wisconsin, and Wyoming) regarding SSA youth applying for VR services. In contrast, the ratios were slightly higher for agencies regarding non-SSA youth applications, from 2% (Alaska, Connecticut, and Washington State) to 10% (North Dakota and West Virginia).
Transition Ratios of VR Youth Applicants With and Without SSA Benefits (3-Year Average).
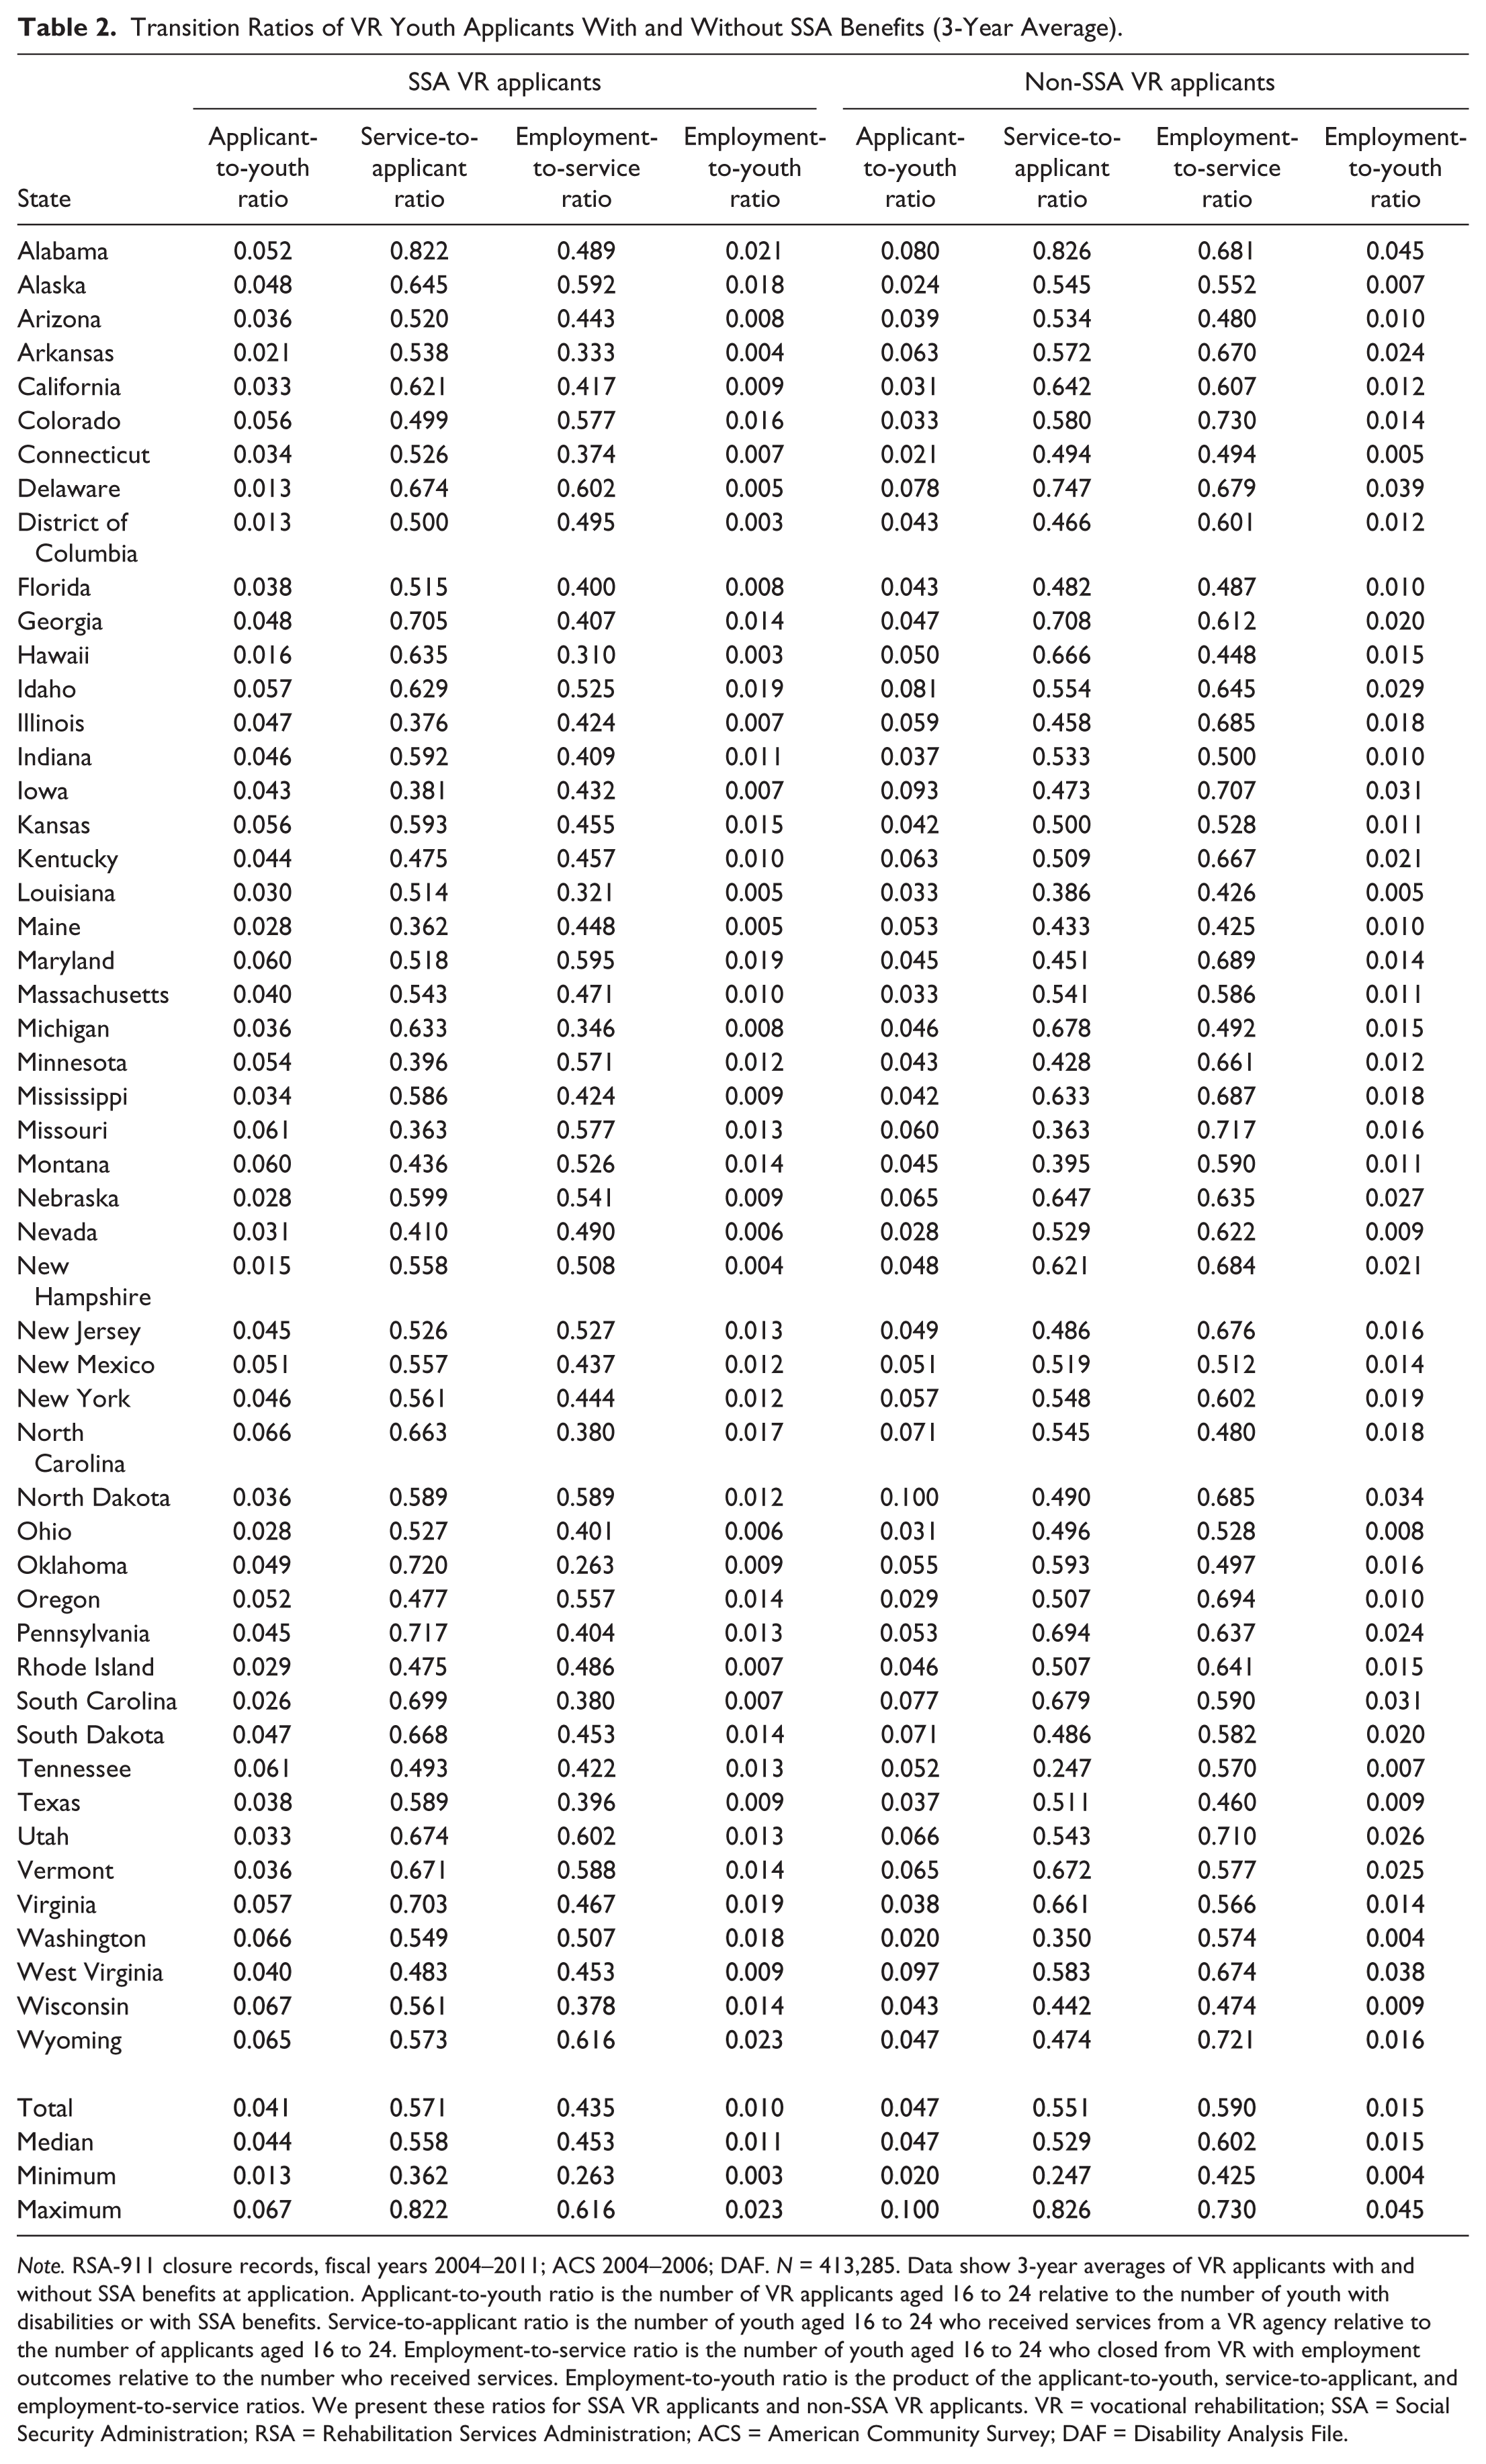
Note. RSA-911 closure records, fiscal years 2004–2011; ACS 2004–2006; DAF. N = 413,285. Data show 3-year averages of VR applicants with and without SSA benefits at application. Applicant-to-youth ratio is the number of VR applicants aged 16 to 24 relative to the number of youth with disabilities or with SSA benefits. Service-to-applicant ratio is the number of youth aged 16 to 24 who received services from a VR agency relative to the number of applicants aged 16 to 24. Employment-to-service ratio is the number of youth aged 16 to 24 who closed from VR with employment outcomes relative to the number who received services. Employment-to-youth ratio is the product of the applicant-to-youth, service-to-applicant, and employment-to-service ratios. We present these ratios for SSA VR applicants and non-SSA VR applicants. VR = vocational rehabilitation; SSA = Social Security Administration; RSA = Rehabilitation Services Administration; ACS = American Community Survey; DAF = Disability Analysis File.
Service-to-applicant ratio
Across the United States, 57% of transition-age SSA beneficiaries who applied for VR services eventually received them (see Table 2). This proportion is very close to the service-to-applicant ratio for non-SSA VR applicants (55%). We expected the ratio for SSA VR youth to be higher because most are assumed to be eligible for VR services. This statistic reflects eligibility as well as IPE development and actual service receipt. As we show later, SSA VR youth typically had higher eligibility rates; the lower-than-expected value may represent additional barriers that SSA youth may encounter regarding employment relative to other youth (such as having more severe disabilities, accessing services, and setting appropriate vocational goals), or perhaps reservation wage effects associated with SSA benefit receipt (i.e., the wage amount a youth would need to receive to work instead of receive benefits). Unobserved factors on the part of agency staff may also influence service receipt.
VR agencies had a wide range for the service-to-applicant ratio—46 percentage points between the agencies with the lowest and highest statistics. At one end of the spectrum, more than 70% of youth with benefits in Alabama, Georgia, Oklahoma, Pennsylvania, and Virginia who applied for services received them. At the other end of the spectrum, fewer than 40% of youth with benefits in Illinois, Iowa, Maine, Minnesota, and Missouri received services. We observe a slightly larger range (58 percentage points) across states on the ratios calculated for non-SSA VR applicants.
Employment-to-service ratio
Nationally, 44% of transition-age SSA beneficiaries who applied for and received VR services were employed at the time of case closure. In comparison, nationally, of all non-SSA VR youth who applied from 2004 to 2006 and received services, 59% exited from services and were employed at the time. In other words, the employment rates of SSA youth receiving VR services who at closure were 15 percentage points lower than those observed for all youth served by VR at case closure.
The VR agency in Wyoming had the highest SSA employment-to-service ratio; 62% of SSA VR youth who received services exited with employment. The Wyoming agency was closely followed by agencies in Alaska, Delaware, Maryland, and Utah, all of whose statistics were around 60%. On the low end, SSA VR applicants receiving VR services in Oklahoma were successful at achieving positive employment outcomes 26% of the time. The employment-to-service ratio focuses on the proportion of applicants who received services and whose cases were closed with employment outcomes. However, of course, employment outcomes can be influenced by economic and other conditions in the states, as well as by agency and demographic factors. The range in the employment-to-service ratios for non-SSA VR applicants was slightly smaller than that for SSA VR applicants (31 percentage points–35 percentage points).
Employment-to-youth ratio
Nationally, 1.1% of youth receiving SSA benefits who applied to VR received services and were employed when they closed from services (see Table 2). This aggregate measure is the product of the three previously discussed transition ratios. The comparable number for non-SSA VR youth applicants was 1.5%; the likelihood of youth applying for and receiving services and being employed at closure was therefore 0.4 percentage points greater for non-SSA VR youth applicants than for SSA VR youth applicants.
Wyoming had the highest statistic (2.3%), followed by Alabama, Idaho, Maryland, and Virginia. Among SSA beneficiaries in these states, about 2% exited with an employment outcome. In contrast, the agencies in Arkansas, the District of Columbia, Hawaii, and New Hampshire had the lowest values (all less than 0.5%).
For VR Youth Applicants With SSA Benefits, to What Extent Do They Stop Receiving Benefits Due to Work?
In Table 3, we show the percentage of SSA VR applicants who experienced benefit suspension within 48 months of their VR application. At 48 months after application, the proportion with at least 1 month of benefit suspension due to work was 14.2. There was variation in time off the rolls by benefit type. On average, VR youth with SSI or concurrent benefits had higher rates of benefit suspension within 48 months (13% and 26%, respectively), relative to SSDI beneficiaries (6%; data not shown).
SSA VR Applicants With Suspension of Benefits Due to Work and Non-SSA VR Applicants With Benefit Acquisition (3-Year Totals).

Note. RSA-911 closure records, fiscal years 2004–2011; DAF. Data show 3-year totals of 2004–2006 VR SSA and non-SSA applicants aged 16 to 24, the proportion of VR SSA applicants with benefit cessation due to work within 48 months (“benefit suspension”), and the proportion of non-SSA applicants who receive SSI or SSDI benefits within 48 months (“benefit acquisition”). SSA = Social Security Administration; VR = vocational rehabilitation; RSA = Rehabilitation Services Administration; DAF = Disability Analysis File; SSI = Supplemental Security Income; SSDI = Social Security Disability Insurance.
Agencies differed in their benefit suspension outcomes by as much as 16 percentage points. In eight agencies (Alaska, Arizona, District of Columbia, Massachusetts, Nebraska, Nevada, North Dakota, and Wyoming), more than one fifth of their SSA VR applicants experienced benefit suspension due to work within 48 months of VR application. In contrast, the agencies in Kentucky, North Carolina, Tennessee, and West Virginia had no more than 10% of their SSA VR applicants with any benefit suspension within 48 months.
For VR Youth Applicants Without Benefits, to What Extent Do They Start Receiving Benefits?
Among those without SSA benefits at the time of their application, 10% of transition-age youth who applied for VR acquired either SSI or SSDI within 48 months of applying for VR (see Table 3). Thus, approximately, one in 10 non-SSA VR applicants became disability beneficiaries within a relatively short time.
Agencies ranged in their percentages of non-SSA VR youth applicants who acquired SSA benefits, from 4% (South Carolina) to 21% (Washington State). Five agencies had values at or above 18%, which means about one of every five non-SSA VR youth applicants acquired SSA benefits within 48 months of applying for VR. Three of the states with the highest rates of SSA benefit acquisition after VR application were in OOS and had waiting lists for services for the analysis period. As a result of being in OOS, these states were required to serve those with the most severe disabilities, which includes those already receiving SSA benefits and those most likely to meet SSA medical criteria for benefits. On the other end of the spectrum, seven agencies had rates below 6%.
At the State Level, What Is the Relationship of SSA Outcome Statistics With Other Youth and State Characteristics?
Correlations across the SSA transition ratios indicate the extent to which the statistics are related to each other, as well as to the non-SSA transition ratios and selected state and agency characteristics (see Table 4). Three key themes emerge. First, the SSA service-to-applicant and employment-to-service ratios were highly and positively correlated with the same ratios for non-SSA VR applicants, suggesting that the patterns of processes and outcomes are similar for all VR applicants regardless of benefit status, even if the values of the ratios differ.
Correlation Matrix of SSA Transition Ratios With Other Ratios and Characteristics.
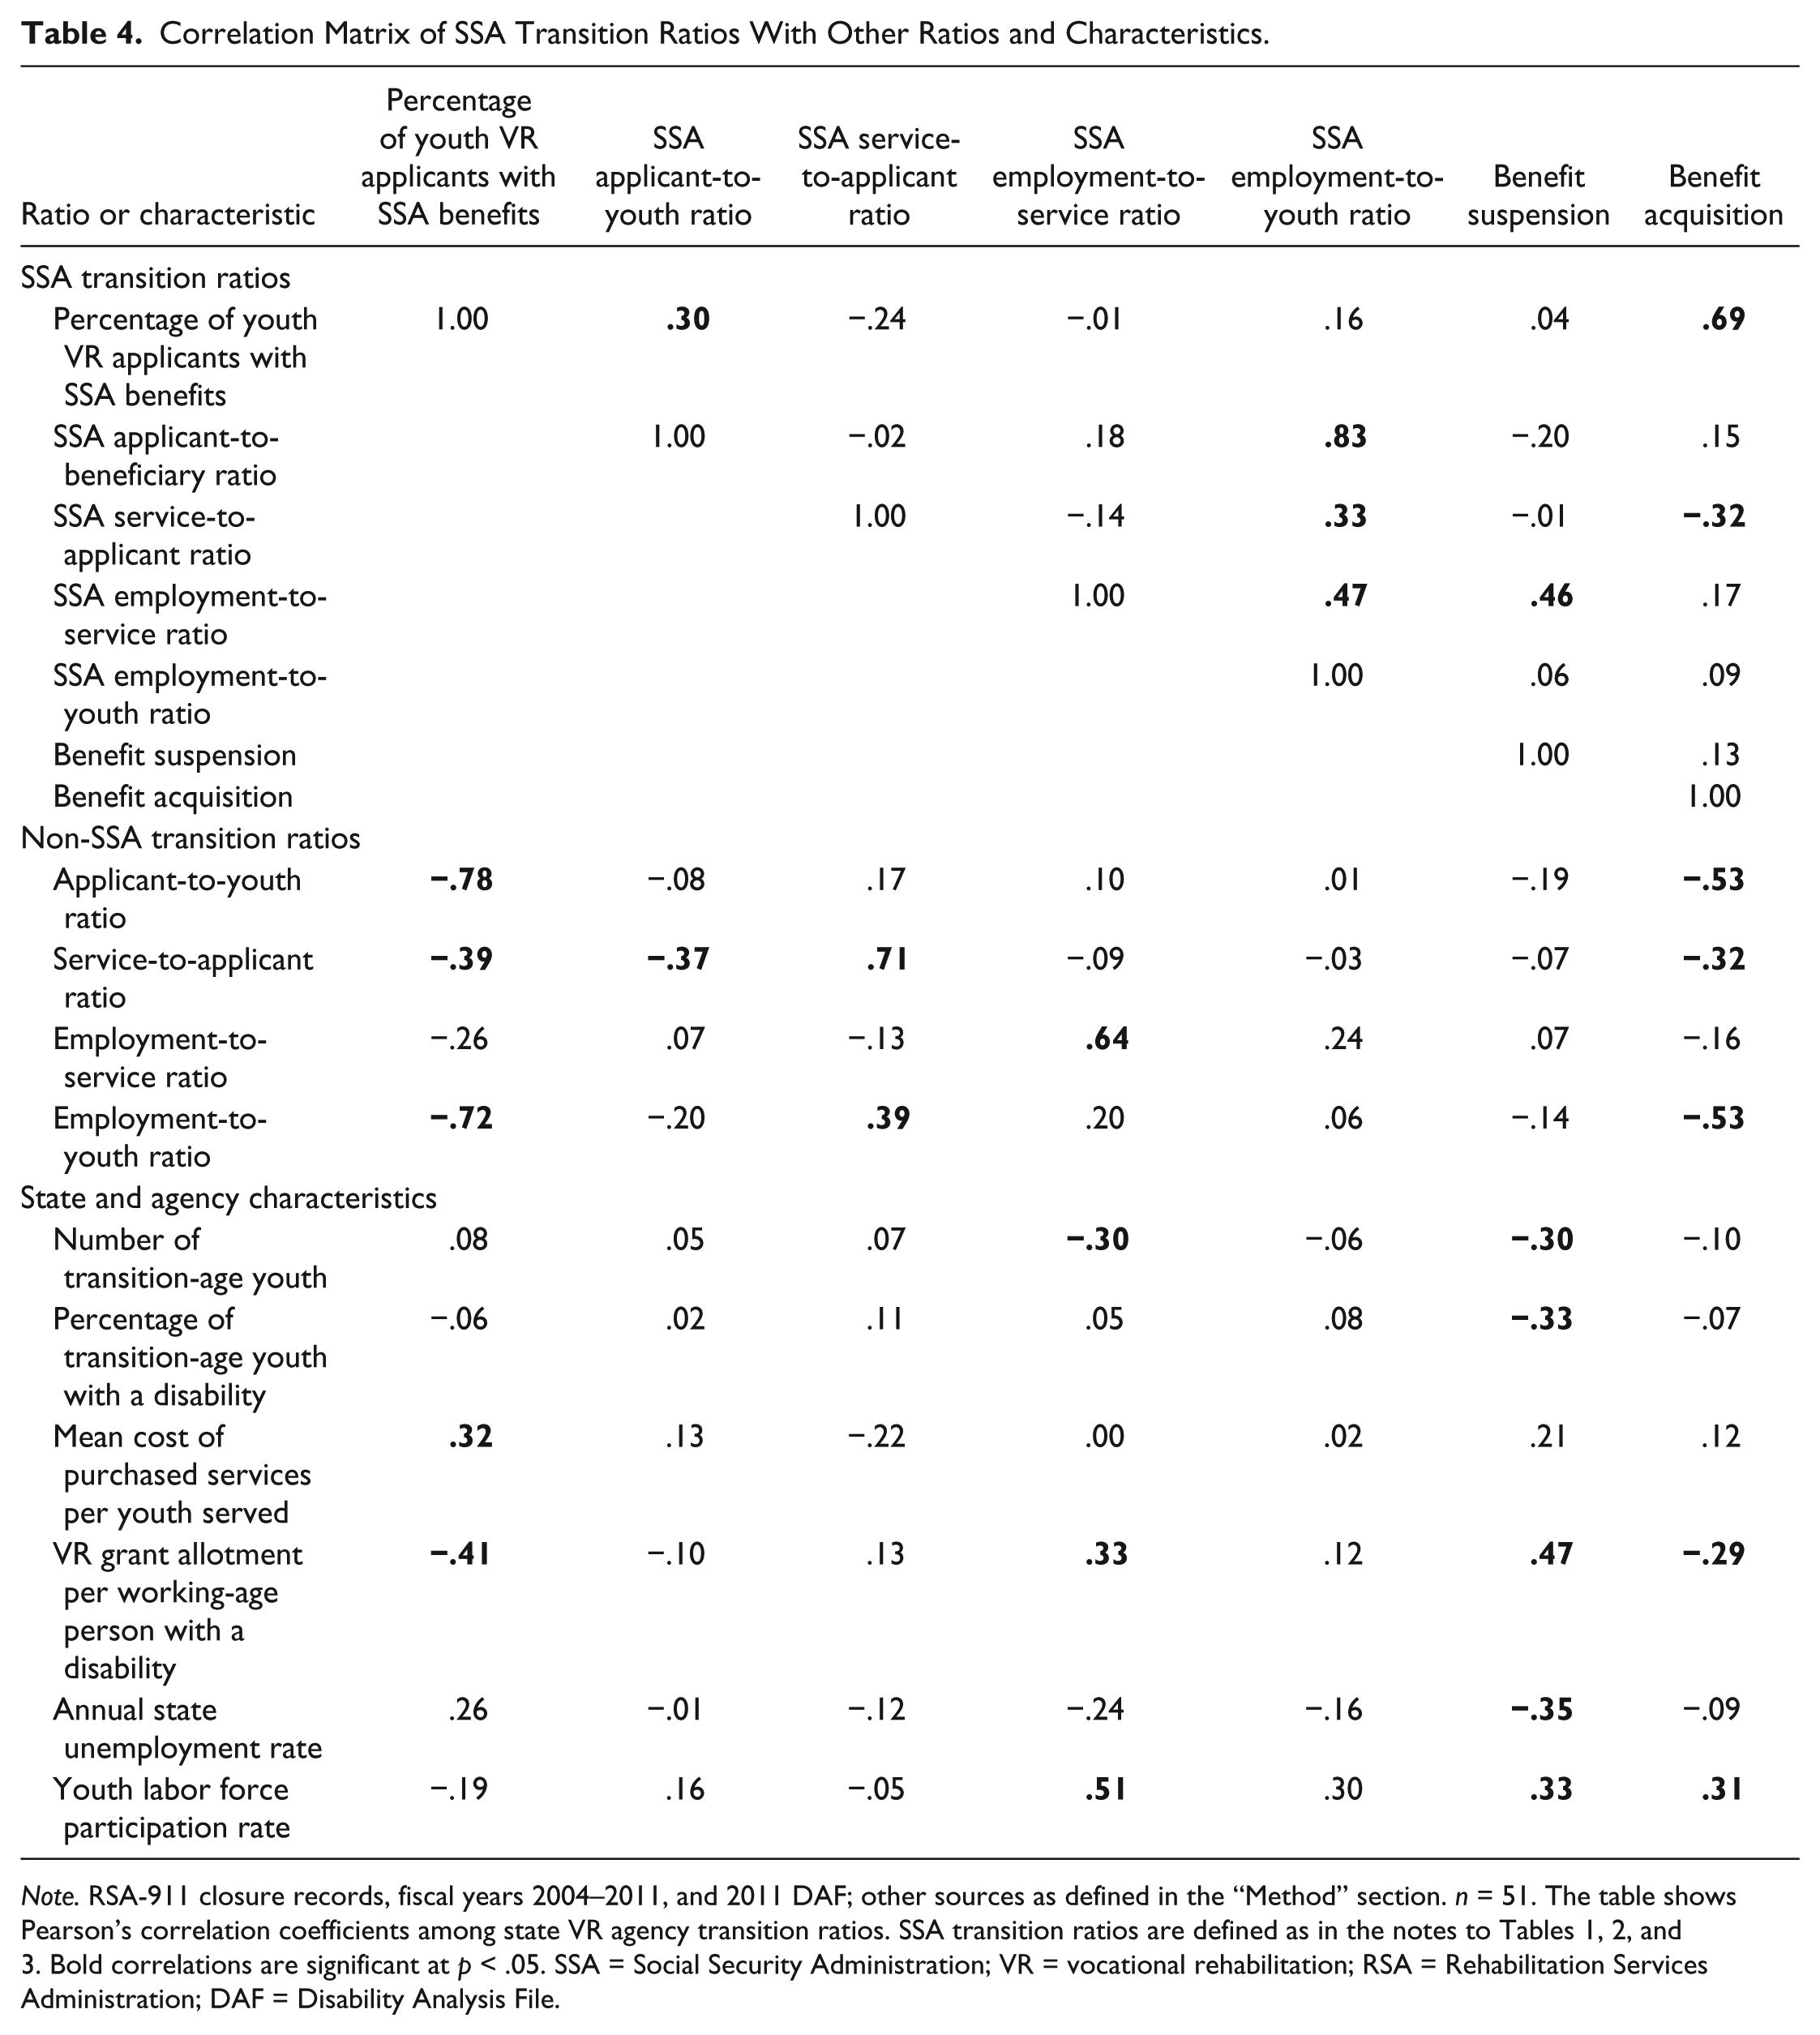
Note. RSA-911 closure records, fiscal years 2004–2011, and 2011 DAF; other sources as defined in the “Method” section. n = 51. The table shows Pearson’s correlation coefficients among state VR agency transition ratios. SSA transition ratios are defined as in the notes to Tables 1, 2, and 3. Bold correlations are significant at p < .05. SSA = Social Security Administration; VR = vocational rehabilitation; RSA = Rehabilitation Services Administration; DAF = Disability Analysis File.
Second, the proportion of SSA VR applicants with benefit suspension due to work was positively correlated with several factors, most strongly with the SSA employment-to-service ratio and the VR grant allotment per working-age person with disabilities. As might be expected, agencies where more SSA VR applicants exit VR services with a positive employment outcome are more likely to have higher ratios of SSA VR youth with at least 1 month off of benefits due to work. Available resources, in the form of the VR grant allotment per person with disability, appear to be also influential in this outcome. In addition, three factors (the number and percentage of transition-age youth in the state and the annual unemployment rate) may provide some constraints on the proportion of SSA VR youth who have benefit cessation.
Third, the proportion of non-beneficiaries who received SSA benefits within 48 months was strongly and positively associated with the proportion of VR youth with SSA benefits and, oddly, the youth labor force participation rate. It was also negatively associated with factors such as the non-SSA service-to-applicant ratio, which points to a potential pathway of agencies not serving youth and those youth subsequently seeking SSA benefits. Agencies with fewer resources, as indicated by the VR grant allotment per working-age person with a disability, also had more non-SSA VR applicants with SSA benefit receipt within 48 months.
We further explore the relationship between an agency’s available resources and its SSA transition outcomes by showing the mean statistics of the ratios by OOS status categories (see Table 5). The sample of 51 agencies is too small for statistical tests, but some patterns are suggestive of potential associations. First, agencies in OOS status and with wait lists tended to have higher proportions of youth with SSA benefits and higher SSA applicant-to-youth ratios. One possible explanation is that because agencies in OOS status will serve those with more significant disabilities first, fewer individuals with less severe disabilities (and so without SSA benefits) will be encouraged to apply, given the long wait lists for services. Second, agencies in OOS status and with larger wait lists tended to have lower SSA service-to-applicant ratios, although they had mixed SSA employment-to-service and employment-to-youth ratios. Third, agencies in OOS status with larger wait lists had poorer outcomes for applicants, as evidenced by the lower rates of SSA beneficiaries with benefit suspension due to work and the higher rates of non-SSA VR applicants acquiring benefits.
Mean SSA Transition Ratios by OOS Status.
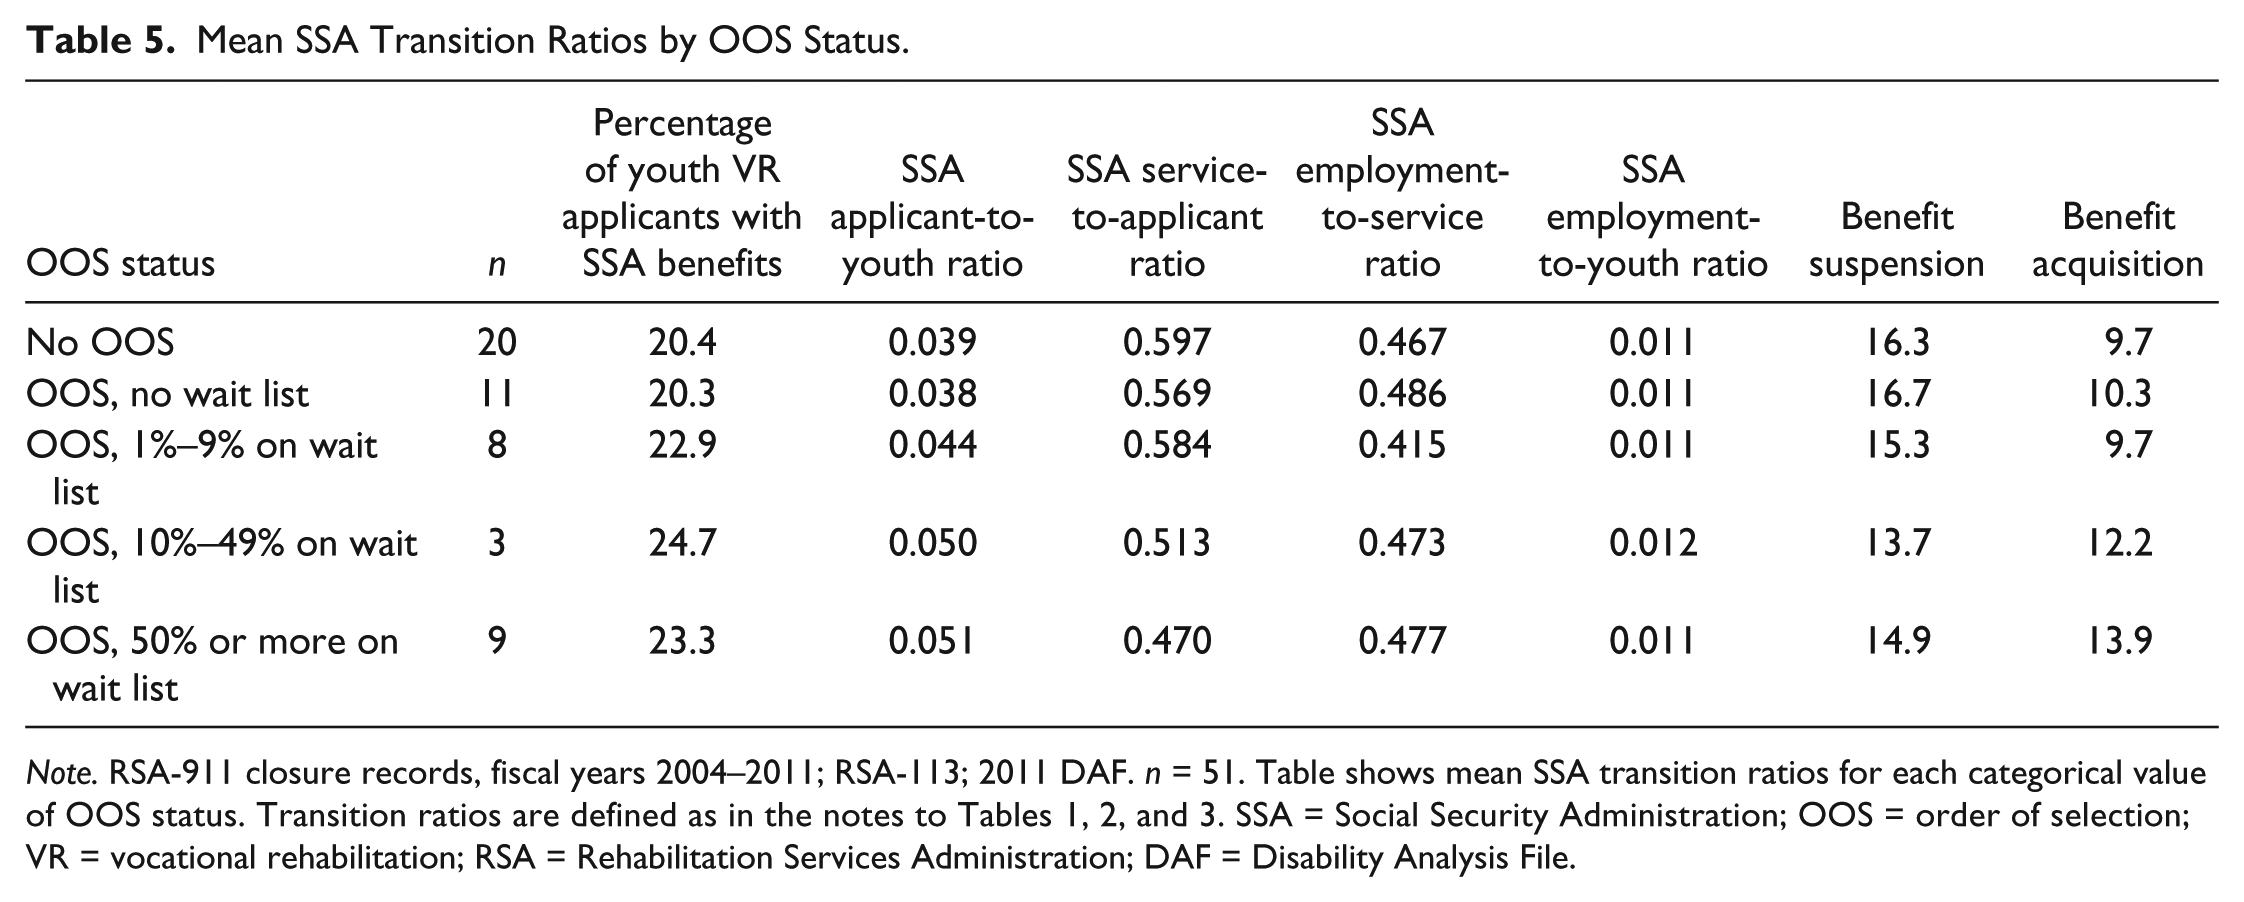
Note. RSA-911 closure records, fiscal years 2004–2011; RSA-113; 2011 DAF. n = 51. Table shows mean SSA transition ratios for each categorical value of OOS status. Transition ratios are defined as in the notes to Tables 1, 2, and 3. SSA = Social Security Administration; OOS = order of selection; VR = vocational rehabilitation; RSA = Rehabilitation Services Administration; DAF = Disability Analysis File.
Conclusion
In this study, we present information for youth with disabilities who are at crossroads in their transition path and seeking VR services, but who may or may not be receiving SSA benefits. The study extends previous research by examining the proportion of VR youth applicants with SSA benefits at application, the proportion of SSA VR youth applicants who have benefit suspension due to work, and the proportion of VR youth applicants without benefits who receive benefits relatively soon after their VR application. Our key findings are as follows:
SSA and non-SSA youth differed in the proportion of those served who exited with employment (the employment-to-service ratio), and, subsequently, our composite measure (the employment-to-youth ratio) but not other ratios, with SSA beneficiaries who apply for VR services less frequently employed when they exit VR.
Almost one in six SSA beneficiaries who sought VR services had at least 1 month of benefit suspension due to work within 48 months of their VR applications.
About one in 10 VR applicants without SSA benefits at the time of their VR application received SSA benefits within 48 months.
The state variation is large across all the SSA transition ratios: The proportion of SSA applicants who received VR services ranged from 36% to 82%, the proportion of those receiving services who were employed when they exited from services ranged from 26% to 62%, and the proportion with any loss of benefits due to work ranged from 9% to 25%.
These analyses add to our knowledge about VR delivery of services to youth at the agency level in several ways. For VR counselors and administrators, this information could assist their understanding of how youth with and without SSA benefits are served by their agency, how their agency compares with other agencies, and what the potential long-term outcomes of their youth applicants might be. Such knowledge could lead to identifying ways to improve access to services for youth, particularly in addressing potential barriers that youth with SSA benefits face. For researchers, the range in ratios we find across agencies underscores the need to consider state-level variation in agency processes and outcomes, rather than examining statistics in aggregate across all agencies. The study also demonstrates how matching the RSA-911 data with the DAF can provide critical information on which VR applicants received SSA benefits, along with long-term outcomes unavailable with RSA-911 data alone.
This study has two key limitations. First, the analysis is largely descriptive, and we cannot determine causality among the various ratios and factors included in the study. Second, the analysis focuses on state-level statistics and does not account for individual-level variation in applicant characteristics or state-level economic or other factors. Differences in these characteristics across agencies—particularly disability type and age at application for youth VR applicants and state funding of agencies—could influence the ratios presented.
Ten percent of VR applicants without SSA benefits will receive them within 48 months, though the range across agencies—from 4% to 21%—represents a fivefold difference. Part of this range may be explained by state environmental factors, as suggested by the relationship between this outcome and the percentage of an agency’s applicants with SSA benefits. It may also reflect the ability of an agency to provide services to youth with disabilities, as denoted by the association with service-to-applicant ratios for SSA and non-SSA youth. Overall, these findings suggest that VR agencies can potentially serve as an early intervention program, providing youth with disabilities the services they need to work and help avoid dependence on SSA benefits, and that some agencies may be better positioned for this task than others. From 2004 to 2006, about 325,000 non-SSA youth applied for VR services, and of these, 31,000 received SSA benefits within 48 months of their VR applications. If all agencies had proportions of non-SSA youth receiving benefits at the level of the agency with the lowest statistic (South Carolina, with 4.3%), that number would fall to less than half (to 14,000).
One factor relevant to the above statistics is the level of resources available to agencies. Whether measured by the VR grant allocation or an agency’s OOS status, agencies with more resources had better employment outcomes for SSA youth they served, had higher proportions of SSA youth with benefit cessation, and had fewer non-SSA youth eventually receiving SSA disability benefits. The issue of resources may be even more critical when considering that the expenditures (in terms of purchased costs) we observe for SSA VR youth may be higher than the expenditures for VR youth without benefits (data not shown). Agencies with higher proportions of SSA youth may therefore be at a disadvantage in providing services overall, though additional research is needed on understanding the factors that may be influencing this relationship.
There are practical implications of the state variation in outcomes for SSA beneficiaries. More than 12,000 SSA VR youth who applied in 2004, 2005, and 2006 had at least 1 month of benefit suspension due to work during the 48-month period after they applied to VR. However, not all of these suspensions can be attributed directly to VR agency services because many youth would have worked regardless of their involvement with SSA, and some youth with benefit suspensions may not have remained off the benefit rolls for long. However, if all agencies had benefit suspension due to work for their applicants at the levels of the agency with such highest rate (25% in Wyoming), the number of SSA youth with any benefit cessation due to work would have been more than 22,000. Although the associated cash benefit savings amount would not likely be sufficiently large relative to all federal disability benefit payments, these potential savings could offset additional investment in VR agencies by the federal government in promoting service delivery to transition-age youth.
Footnotes
Authors’ Note
The opinions and conclusions expressed are solely those of the authors and do not represent the opinions or policy of SSA or any agency of the federal government. Neither the U.S. government nor any agency thereof, nor any of their employees, makes any warranty, expressed or implied, or assumes any legal liability or responsibility for the accuracy, completeness, or usefulness of the contents of this article.
Declaration of Conflicting Interests
The author(s) declared no potential conflicts of interest with respect to the research, authorship, and/or publication of this article.
Funding
The author(s) disclosed receipt of the following financial support for the research, authorship, and/or publication of this article: The research reported herein was performed pursuant to a grant from the U.S. Social Security Administration (SSA) funded as part of the Disability Research Consortium.