
Abstract
We contend that the rise of mass incarceration in the United States can be framed through the lens of stratification economics, which views race- and class-based discrimination as a rational attempt on behalf of privileged groups to preserve their relative status and the material benefits which that status confers. Using the first (to our knowledge) local-level data set on incarceration rates by race, we explore the relationship between income inequality, poverty, and incarceration at the commuting zone level from 1950 to the present. Consistent with Michelle Alexander’s hypothesis that expansion of the penal system and the rise of “tough on crime” policy were efforts by privileged groups to drive a wedge into working-class political coalitions formed out of the Civil Rights Movement, we find that labor markets with greater inequality experienced larger increases in the overall incarceration rate. Furthermore, we find that relative rates of poverty play a key role in explaining differential effects of mass incarceration across race. Areas where White poverty rates were large relative to non-White poverty rates experienced no significant change in White incarceration, but an expansion of non-White incarceration. These findings have implications for policies related to economic and judicial systems.
Introduction
From 1970 to 2010, the number of persons incarcerated in state and federal prisons in the United States increased from 100 per 100,000 to nearly 500 per 100,000. To contextualize the magnitude of this increase, note that the average incarceration rate in state and federal facilities from 1880 to 1970 was approximately 91 persons per 100,000, with single-year incarceration rates never exceeding 150. Addressing the expansion of the U.S. prison population after 1970, Alexander (2010) writes that “[t]he American penal system has emerged as a system of social control unparalleled in world history” (p. 8). Despite holding only 5% of the world’s total population, the United States now holds nearly 25% of the world’s prisoners (Darity et al., 2016).
The economic and social consequences of the post-1970 prison boom—particularly among low-income households and people of color—are well documented. Formerly, incarcerated individuals face worse job prospects, lower rates of wealth accumulation, a higher likelihood of engaging in future criminal activity, and increased instability in family life (Alexander, 2010; Darity et al., 2016; Liu, 2018; Pager, 2003; Western & Pettit, 2010). Despite a large body of research on the consequences of mass incarceration, little has been written by economists about the economic correlates of the prison boom. 1 This is surprising, because at least one well-known secular trend suggests itself as an explanatory factor: the rise in economic inequality in the post-1980 period. It is well established that nearly all the gains in income and wealth in the United States after 1980 were appropriated by households at the top of the income distribution (Piketty, 2014; Piketty et al., 2018; Saez & Zucman, 2016) and that the racial wealth gap is both persistent and significant (e.g., Hamilton and Darity, 2010, 2017). Figure 1 plots the share of pretax income going to both the top 1% and bottom 50% of the income distribution from 1962 to 2014, side-by-side with the incarceration rate. While the incarceration rate skyrocketed, the share of national income claimed by the bottom 50% of the distribution fell from approximately 22% to 12%, whereas the share claimed by the top 1% rose from 10% to nearly 21%.
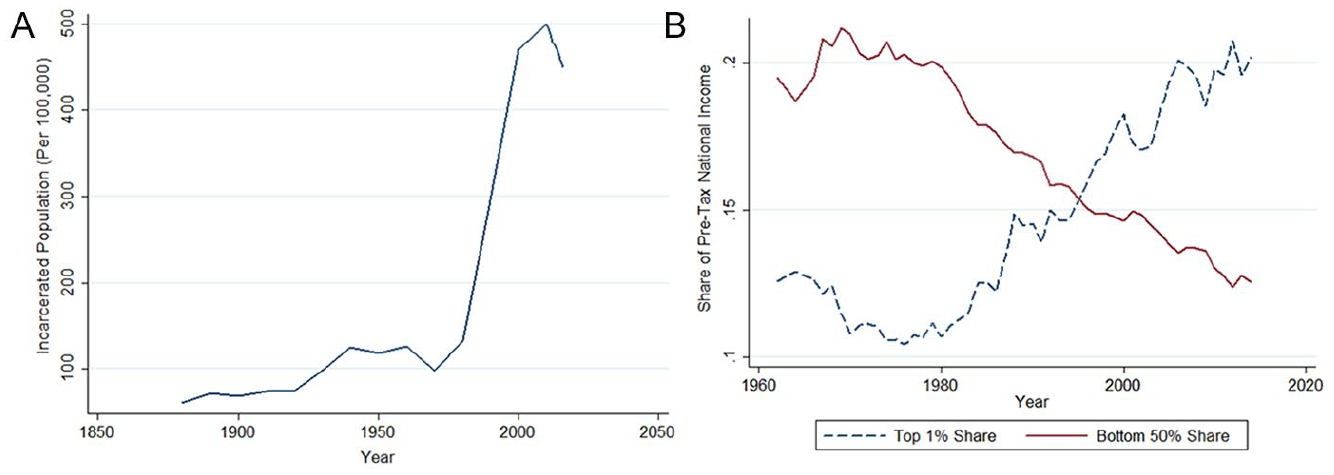
Inequality and incarceration. (A) Incarceration rate, 1880–2016. (B) Inequality, 1962–2014.
The concomitant rise of inequality and incarceration is suggestive about the political economy of the prison boom. Alexander (2010) makes the case that mass incarceration arose as a means of reestablishing a racialized social order after the downfall of Jim Crow during the Civil Rights Movement.
2
In particular, Alexander (2010) shows that “tough on crime” policy and the War on Drugs were used as a “racial bribe,” intended to drive a wedge into newly formed multiracial working-class political coalitions: Just as race had been used at the turn of the century by Southern elites to rupture class solidarity at the bottom of the income ladder, race as a national issue had broken up the Democratic New Deal “bottom up” coalition—a coalition dependent on substantial support from all voters, white and black, at or below the median income. (p. 47)
The attempt of White elites to maintain and intensify the existing system of racialized social control by adopting policies expanding the penal system in response to perceived threats—the fall of Jim Crow, the formation of new working-class political coalitions—is the kind of behavior predicted by stratification economics. Stratification economics—in contrast to the neoclassical economic theory of discrimination, which characterizes discrimination as an irrationality that will eventually be priced out of the market—argues that race- and class-based discrimination represent a rational attempt by privileged groups to maintain their relative status and the material benefits, which that status confers (Darity, 2005; Darity et al., 2015). Viewed through this lens, the simultaneous rise of mass incarceration and inequality is not only not surprising, it is expected. As economic inequality increases, so do the returns to privilege. As a result, local elite have an incentive to increase their stratification efforts—including via more restrictive penal policy—potentially leading to higher incarceration rates in areas with greater economic inequality.
In this article, we expand on the understanding of mass incarceration as a system of racialized social control—a system that “depends for its survival on the tangible and intangible benefits that are provided to those who are responsible for the system’s maintenance and administration” (Alexander, 2010, p. 72)—by examining the relationship between incarceration rates and inequality in local labor markets. In doing so, we provide the first empirical test of the Alexander Hypothesis, which asserts that factors threatening the privileged economic status of Whites after 1970 are associated with the rise of Black incarceration. Using Census microdata, we construct the first (to our knowledge) complete data set on incarceration rates by race at the local labor market level, spanning the period from 1950 to 2010. Local labor market conditions have been increasingly acknowledged as a key determinant of an individual’s lifetime outcomes (Amior & Manning, 2018; Chetty et al., 2014), and are an important backdrop upon which to assess the correlates of mass incarceration. We validate our incarceration rate estimates using a recently released data set on prison population by county-of-commitment from the Vera Institute of Justice, which covers prison populations for some—but not all—counties in the United States from 1983 onward.
Using our estimates of the incarceration rate, we examine the relationship between local inequality, poverty, and incarceration at the commuting zone level from 1950 to 2010. We examine whether—and to what extent—the expansion of incarceration in the post-1970 period was larger in areas with greater local labor market inequality. Consistent with the predictions of stratification economics and the Alexander Hypothesis, we find that labor markets with higher levels of inequality experienced larger increases in the overall incarceration rate. Furthermore, we find that relative rates of poverty play a key role in explaining the differential effects of mass incarceration across race. Areas where White poverty rates were large relative to non-White poverty rates experienced no significant change in White incarceration rates, but an expansion of non-White incarceration rates. By establishing a link between alternative measures of loss of privilege (inequality, relative poverty) and incarceration, our results provide strong empirical evidence in favor of the Alexander Hypothesis, asserting that the rise of incarceration in the United States beginning in the 1970s can be viewed as consistent with an effort (either explicit or implicit) by Whites, especially those of lower socioeconomic status, to maintain the privileges they experience from being White. 3
These findings are striking and shed light on the social consequences of economic inequality. Our results suggest that the negative social consequences of rising inequality are disproportionately borne by non-White individuals. We argue that these distributional inequities have implications for public policies related to economic and judicial systems, including for our understanding of the “Formerly Incarcerated Reenter Society Transformed Safely Transitioning Every Person” or “First Step” Act of 2018—addressed in this special journal issue—as well as understanding and responding to the 2020 riots across the United States following the death of George Floyd at the hands of police.
The rest of the article is organized as follows. The section “Literature and Theoretical Considerations” discusses the existing literature and offers some theoretical considerations. The section “Data and Estimation Strategy” discusses the construction of the data and the estimation strategy. The section “Results” presents and discusses the results. The section “Discussion and Conclusion” concludes.
Literature and Theoretical Considerations
Mainstream economics suggests rising incarceration rates are a rational response to rising crime (Becker, 1968; Frost & Clear, 2018). Despite this strong theoretical prediction, empirical evidence in favor of the neoclassical view is weak. Recent research suggests that—if the goal of criminal punishment is to reduce the future supply of criminal behavior—mass incarceration is inconsistent with its raison d’etre. Using quasi-random variation in punishment severity driven by the assignment of judges to 35,000 juvenile offenders, Aizer and Doyle (2015) find that incarceration leads to lower high school completion rates and higher adult incarceration rates, including for violent crimes. Much of the empirical literature addressing the “War on Drugs” is indicative of a battery of unintended consequences and a causal nexus seemingly unrelated to the purported goal of reducing crime (Baicker and Jacobson, 2007; Benson et al., 1995; Blumenson & Nilsen, 1998; Bluthenthal et al., 1999; Kassin et al., 2010; Koppl & Sacks, 2013; Lynch, 2012). To take one example, findings from this literature suggest that incentives linked to changes in civil asset forfeiture laws result in increased drug arrest rates—regardless of the underlying amount of criminal behavior.
In contrast, a large sociological literature—examining both causes and consequences of incarceration—suggests alternative explanations for mass incarceration, including geographic inequality, variance in political and legal institutions (particularly those relating to policing), political rhetoric, and changes in discriminatory attitudes (Pettit & Gutierrez, 2018; Pettit & Western, 2004; Wakefield & Uggen, 2010; Western & Pettit, 2010; Western & Wildman, 2008; Yates & Whitford, 2009). Simon (2012) describes “racialized threat” as a prominent explanation for mass incarceration. This literature casts “the prison as the new urban ghetto and the policies that led to mass incarceration as the new Jim Crow” (Frost & Clear, 2018). Mass incarceration is, therefore, synonymous with attempts at social control of marginal populations and thus consistent with an economic theory centered on the role of group-based stratification, whereby collective self-interest prompts individuals to act in ways to maintain relative group position in the social hierarchy (Darity et al., 2015).
Alexander’s (2010) account in The New Jim Crow, which we stress here, is perhaps the closest to a stratification-based approach to mass incarceration. In particular, Alexander’s work suggests a clear theoretical link between a loss of White privilege associated with the fall of Jim Crow, and the advent of the war on drugs, “tough on crime” rhetoric, and mass incarceration. In this article, we present two tests of the Alexander Hypothesis: the idea that mass incarceration arose as part of an effort by low socioeconomic-status Whites to maintain their position of social and economic privilege.
First, we examine the link between local labor market inequality (measured by the commuting zone–level Gini coefficient) and incarceration. As inequality rises in the post-1970 period, Whites have more to lose from Black competition in the labor market—especially in formerly segregated Southern states, where such competition was previously legally restricted. Although rising inequality might be seen to reduce threats to White status, this is likely true only in the case where (a) there are few poor Whites and (b) poor White households are not inclined to form working-class political coalitions with other racial groups. To the extent that poor Whites are forced into labor market competition with Blacks (and so face a loss of privilege), and rich Whites are faced with the specter of effective redistributive political action on behalf of multiracial working-class coalitions, Whites of varying socioeconomic status have an incentive to support the “tough on crime” politics associated with mass incarceration as a means to protect their position of privilege in the social hierarchy. Thus, we expect increases in post-1970 incarceration in response to rising inequality to have origins within local labor markets as opposed to at higher levels of geography.
Second, we examine the relationship between White relative poverty—measured as the ratio of the White poverty rate to the non-White poverty rate—and mass incarceration. As White poverty rises—relative to Black poverty—this reveals a loss of White privilege. We expect increases in relative poverty to positively affect incarceration for at least two reasons. First, if Alexander’s (2010) description of mass incarceration as a “racial bribe” is correct, both poor Whites—due to loss of privilege from increased labor market competition from non-Whites—and rich Whites—acting on class interest—have a stratification-based incentive to adopt stricter penal policy as relative poverty rises. Second, to the extent that greater poverty relates to an increase in fear of crime on the part of Whites, this fear can once again be used to justify alterations in laws (stiffer minimum sentences) and policing practices (i.e., stop and frisk), leading to mass incarceration. We therefore expect increases in post-1970 relative poverty to be associated with higher rates of incarceration within local labor markets. In addition, if Alexander’s “racial bribe” theory is correct, increases in relative poverty should have no impact on (or potentially reduce) White incarceration. Table 1 summarizes the above theoretical discussion and our empirical hypotheses.
Summary of Theoretical Discussion and Empirical Expectations.
Data and Estimation Strategy
Data
Measuring the incarceration rate
The main dependent variable in our study is the commuting zone–level incarceration rate. Data on commuting zone–level incarceration rates are constructed using the Integrated Public Use Microdata Series (IPUMS) Decennial Census Microdata for the years 1950 to 2010 (Ruggles et al., 2019). We focus on commuting zones because of our interest in the relationship between local labor market inequality and incarceration outcomes. Commuting zones are clusters of counties characterized by strong commuting ties, and were initially defined by Tolbert and Sizer (1996) with the express purpose of constructing a geographic unit that best captured the notion of a local labor market. Commuting zones have been shown to be an appropriate geographic level in which to analyze questions of long-run well-being (e.g., Chetty et al., 2014; Chetty & Hendren, 2018). Our sample frame consists of the 722 commuting zones making up the contiguous United States. We focus on the population of working-aged individuals between 15 and 64 years.
In each sample year, IPUMS classifies all housing units as falling into one of three categories: households, group quarters, or vacant units. Institutionalized individuals—including those incarcerated in state or federal prisons or local correctional facilities—are classified as residing in group quarters. For the years 1950 to 1980, the Census specifically designates whether an individual was housed in a correctional institution. For each of these years, we estimate the number of incarcerated individuals in a given commuting zone by totaling the number of individuals housed in correctional institutions. We aggregate the individual-level microdata to commuting zones following Autor and Dorn (2013). 4
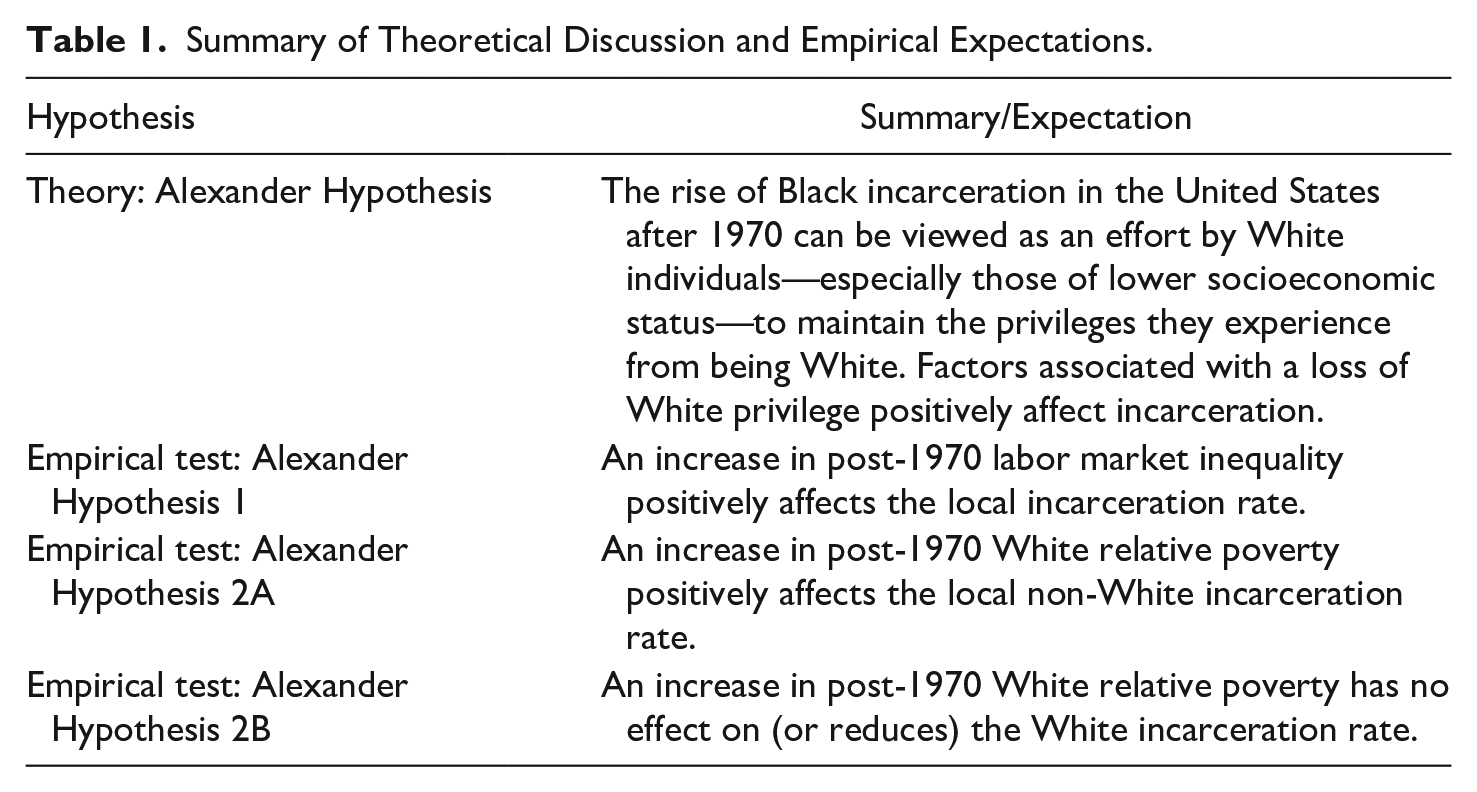
From 1990 onward, IPUMS indicates whether an individual residing in group quarters was institutionalized but does not specify correctional institutions in detail. Thus, for the 1990 to 2010 samples, we apply an adjustment factor based on the proportion of institutionalized individuals residing in correctional institutions in 1980. We calculate a unique correction factor for each state-by-race group—defined as the share of the institutionalized population belonging to each subgroup that was housed in a correctional institution in 1980. We then multiply this correctional factor by the total number of institutionalized individuals in a commuting zone to arrive at our estimate for the years 1990 to 2010. Figure 2 presents a map of our commuting zone–level incarceration rates—defined as the number of incarcerated individuals per 100,000—for the years 1950 and 2010.

Mapping the incarceration rate. (A) Commuting zone map of incarceration rates, 1950. (B) Commuting zone map of incarceration rates, 2010.
In Appendix A, we validate our incarceration rate measure using data from the Bureau of Justice Statistics and a recently released data set on incarceration by county of admission from the Vera Institute of Justice. Our estimates of commuting zone–level incarceration rates match aggregate trends and are externally validated by the Vera data. 5 Given that our measure of incarceration stands up to a reasonable degree of external validation, we now examine changes in the spatial pattern of incarceration over time. First, it is clear from Figure 2 that the geographic area that experienced the largest expansion in incarceration rates between 1950 and 2010 was the Southern United States—in particular, the Gulf states including Texas. This pattern is not surprising. It is well known that the Civil Rights movement faced heavy political backlash in the South, a stronghold area of Jim Crow. At the national level, Kuziemko and Washington (2018) show that the exodus of Southern Whites from the Democratic Party between 1958 and 1980 is entirely explained by the exodus of “racially conservative” Whites following the Civil Rights initiatives of the 1960s. Expansion of the prison population in these states is consistent with Alexander’s (2010) description of mass incarceration as a response by local elites to a loss of social control.
However, despite higher overall incarceration rates in Southern states, relative rates of incarceration—the ratio of non-White incarceration to White incarceration—are higher in Northern and Midwestern states. Figure 3 maps the relative incarceration rate across commuting zones for the year 2010. This figure suggests that—to the extent that incarceration rates expanded in the South, they did so for both Whites and non-Whites. In contrast, expansion of the penal system in Northern states appears to have concentrated largely on non-White populations. Insofar as Alexander’s (2010) hypothesis focuses on the disproportionate impact of the prison boom on people of color, Figures 2 and 3 suggest it is a Northern story.
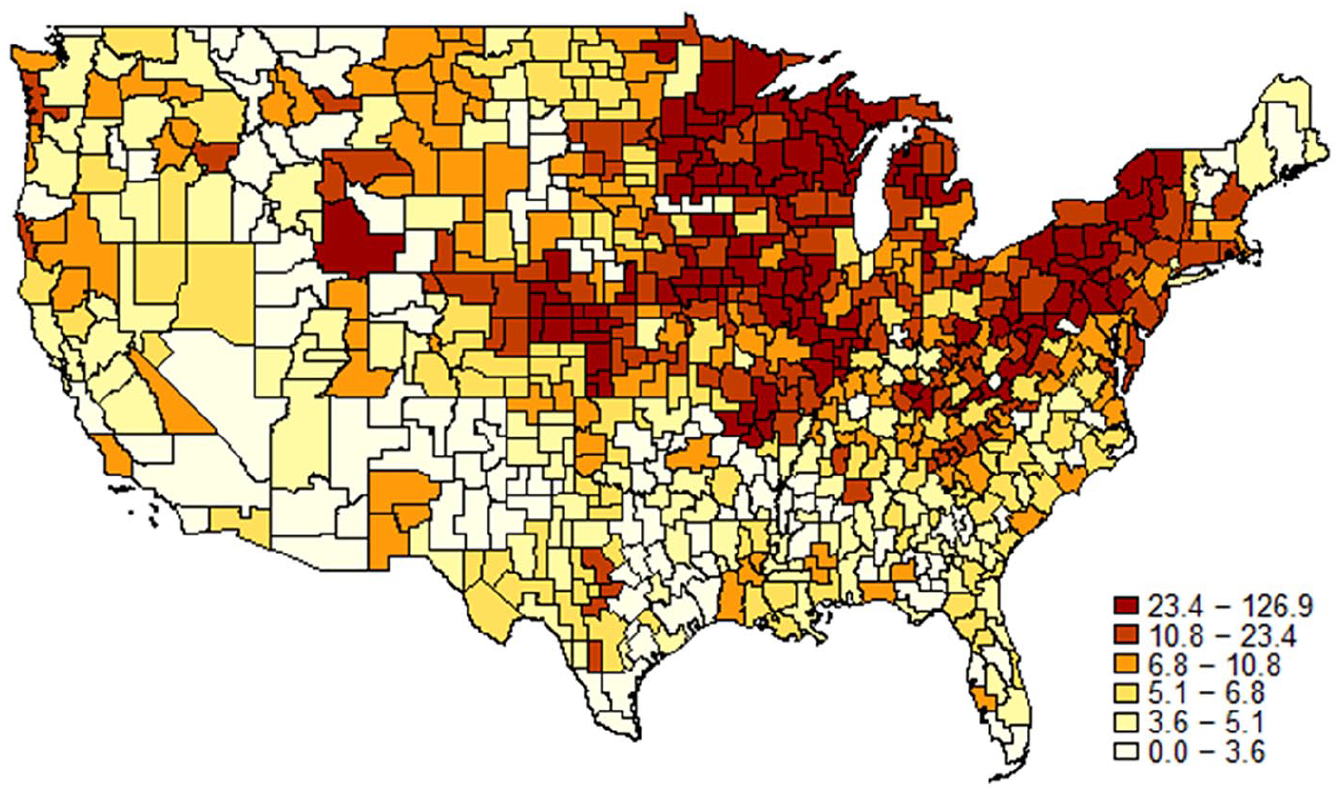
Commuting zone map of relative incarceration rates, 2010.
Measuring loss of privilege
In our evaluation of the Alexander Hypothesis—asserting a link between the loss of White privilege and the rise of mass incarceration—we adopt two measures of perceived loss of privilege: inequality and relative poverty. Two mechanisms link these variables to incarceration. First, as income inequality increases in the post-1970 period (captured by an increase the Gini coefficient), Whites have more to lose from Black competition in the labor market (brought on by the civil rights movement, affirmative action, etc.). In response to this threat, more restrictive penal policy (e.g., minimum sentencing guidelines) may be adopted. Second, as White poverty rises relative to Black poverty, a loss of privilege is revealed, invoking a potentially similar response.
Commuting zone–level measures of inequality are constructed using IPUMS Census Data (Ruggles et al., 2019). For each commuting zone, we compute the Gini coefficient across households using total household income, which includes the total pretax personal income or losses from all sources for all persons residing in a given household over the previous year. Due to top coding in the IPUMS data, our estimates of the Gini coefficient will understate the true extent of inequality. However, what is important for our analysis is not necessarily the level of inequality itself, but variation in inequality across commuting zones and over time, both of which should be preserved even in the presence of top coding. Figure 4 presents a map of the Gini coefficient across commuting zones for the year 2010. The map shows a clear spatial pattern, indicating higher average levels of inequality in Southern commuting zones. Jointly, Figures 2(B) and 4 offer prima facie support for the idea that inequality and incarceration may be correlated across space, suggesting an overlap between high inequality and high incarceration rate commuting zones, especially in the South. Figure 5 formalizes this insight, plotting the sample correlation coefficient for inequality and incarceration in the period after 1970 for all commuting zones. For many commuting zones, this correlation is strongly positive, taking on values more than .8.
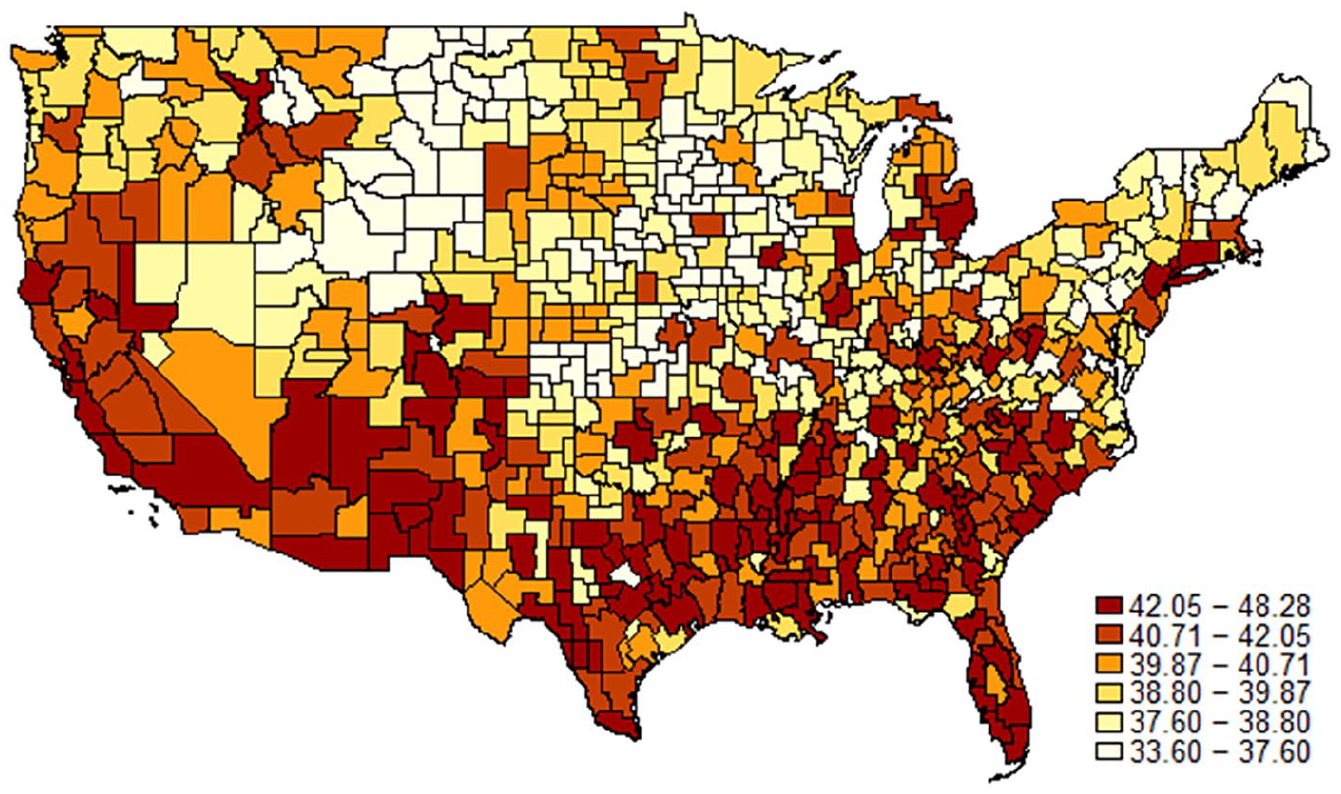
Commuting zone map of Gini coefficient for household income, 2010.
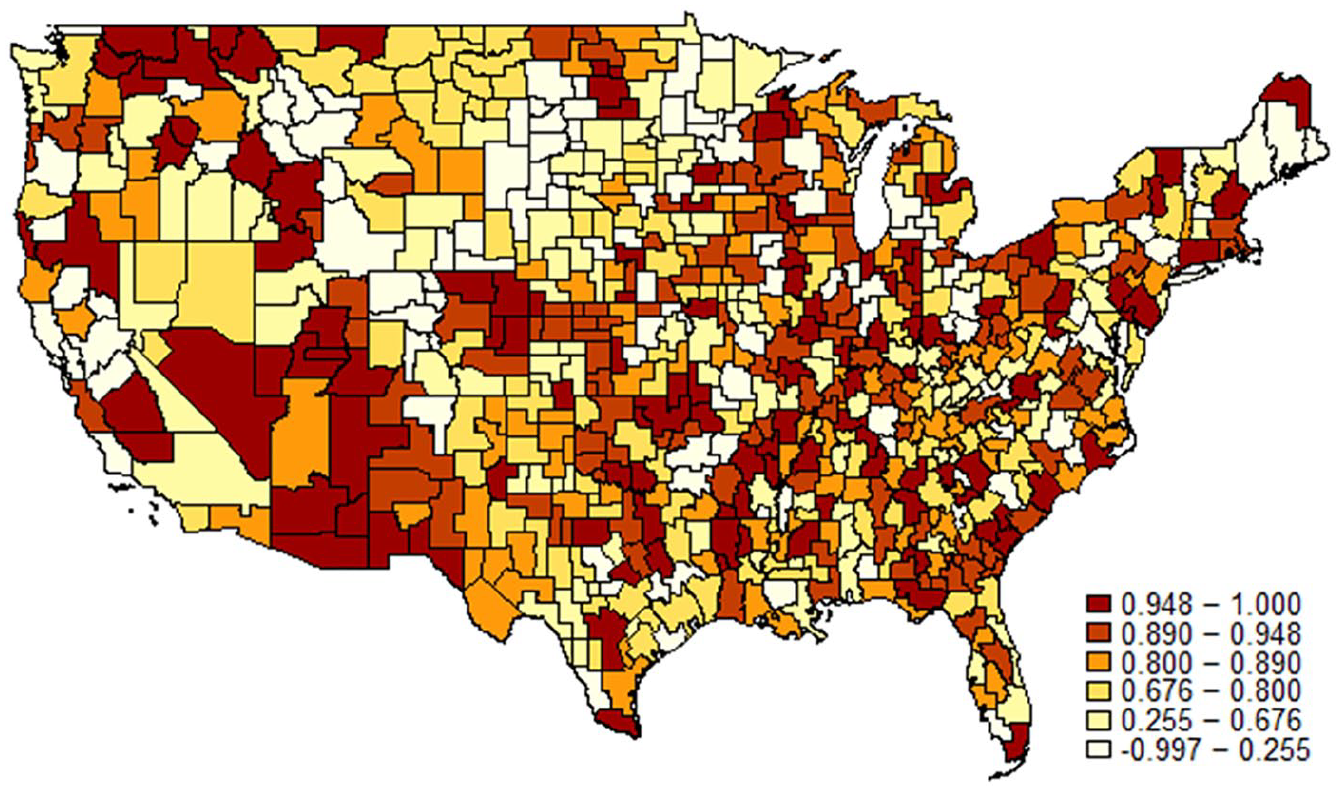
Inequality and incarceration correlation coefficient map, 1980 to 2010.
To measure relative poverty, we take the ratio of the White poverty rate in a commuting zone to the non-White poverty rate in a commuting zone. An increase in this variable is informative about changes in the relative economic status of Whites in a given labor market. Sample means for both the commuting zone Gini coefficient and White relative poverty are presented in Table 2.
Sample Means, 1950–2010.
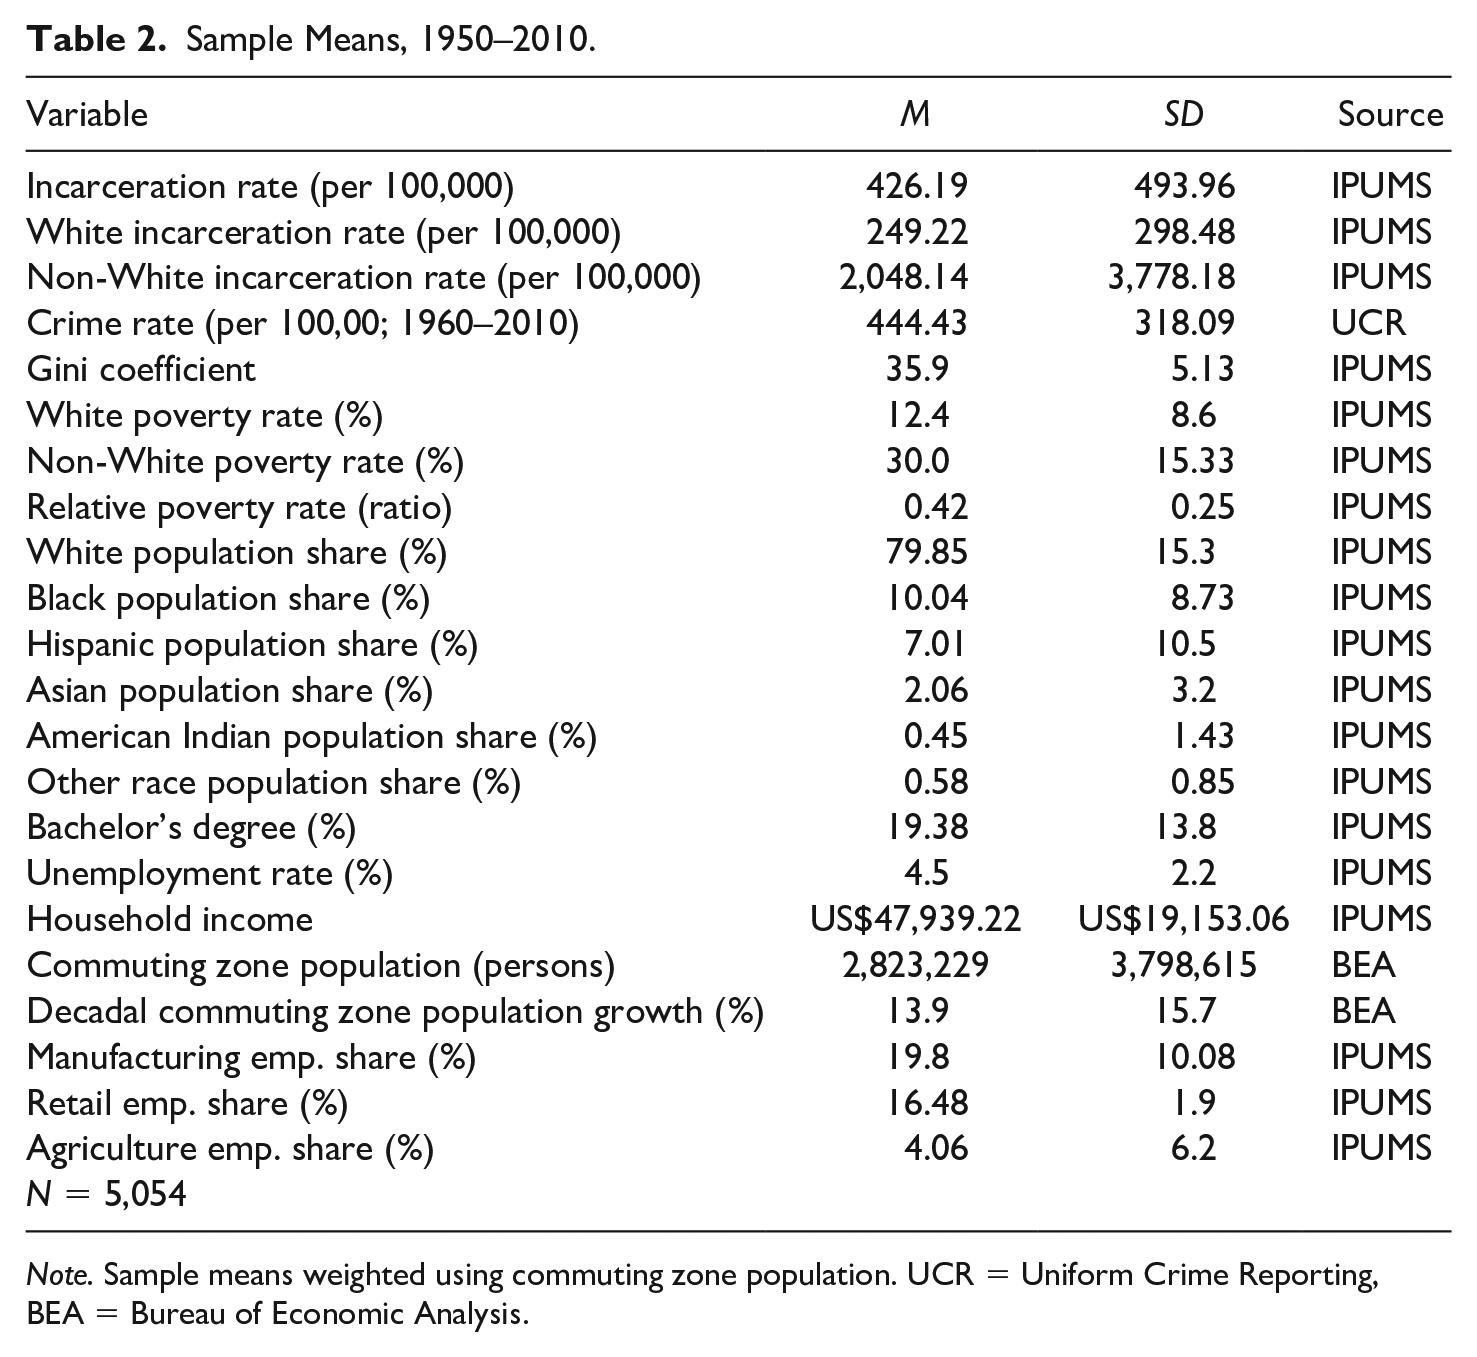
Note. Sample means weighted using commuting zone population. UCR = Uniform Crime Reporting, BEA = Bureau of Economic Analysis.
Additional controls
Crime statistics
To evaluate the relationship between inequality and incarceration in a way that addresses Alexander’s (2010) claim that mass incarceration arose as an attempt by privileged Whites to reestablish social control after the fall of Jim Crow, it is important to interrogate alternative mechanisms that might explain the relationship between inequality and incarceration. The most obvious of these mechanisms is an increase in the rate of criminal activity in response to rising inequality. If rising incarceration rates are simply a response to an increase in criminal activity, there would appear to be little evidence for a stratification-based explanation of mass incarceration. Thus, in our analysis, we include a measure of the violent crime rate as an additional control variable. We calculate the crime rate in each commuting zone as the number of violent crimes per 100,000 population, using commuting zone data on the number of violent crimes from the Federal Bureau of Investigation’s Uniform Crime Reporting (UCR) Statistics (Kaplan, 2019). 6
Local-level economic and demographic indicators
Sample means for the main variables of interest and control variables are presented in Table 2. 7 Additional variables include commuting zone population shares by race, the share of residents in a commuting zone with at least a bachelor’s degree, employment shares by industry (with industries defined according to the 1990 Census Bureau industrial classification scheme), 8 the unemployment rate, population, and decadal population growth. The table presents sample means for the entire 1950 to 2010 period.
Estimation Strategy
To assess (a) the impact of inequality on the post-1970 increase in incarceration across commuting zones and (b) whether non-White incarceration rates rose more in areas with larger concentrations of poor White households—in a fashion consistent with Alexander’s (2010) description of mass incarceration as a “racial bribe”—we exploit variation in both incarceration rates and inequality across time and across commuting zones using a two-way fixed effects approach:
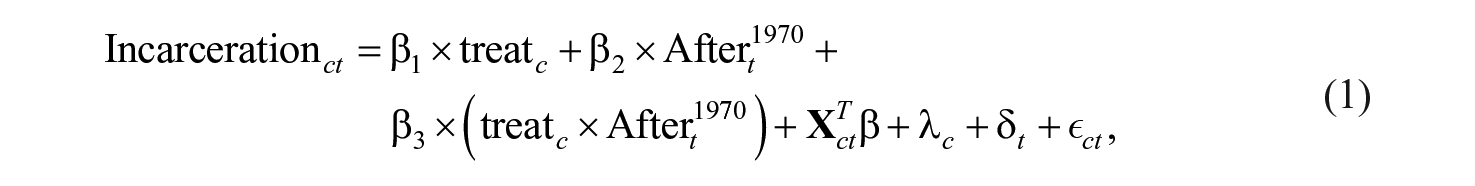
where
The remaining variables are

where the interaction between
In addition to controlling for the impact of crime on incarceration as a possible channel through which inequality affects prison populations, it is important to control for labor market outcomes that might otherwise be correlated with both inequality and incarceration. To address this concern, the above specification adjusts for time-varying local levels of unemployment, education, income, population, population growth, and industrial composition, as well as demographic controls for population shares by race. Thus, although our treatment variable—average inequality in the post-1970 period—is not randomly assigned to commuting zones, we believe that we are able to adjust for most of the confounding backdoor paths that could bias our estimate of the impact of inequality on incarceration. Nonetheless, we are cautious about overemphasizing the causal nature of the estimates obtained from the above specification, emphasizing their reduced-form nature and focusing on the bigger picture implied by the relationships we observe.
A requirement of the difference-in-differences–type specifications in Equations 1 and 2 is that the treatment and control groups satisfy the parallel trends assumption. This assumption requires that trends in the dependent variable across the treatment and control groups be parallel in the pretreatment period. If this assumption is violated, our estimate of
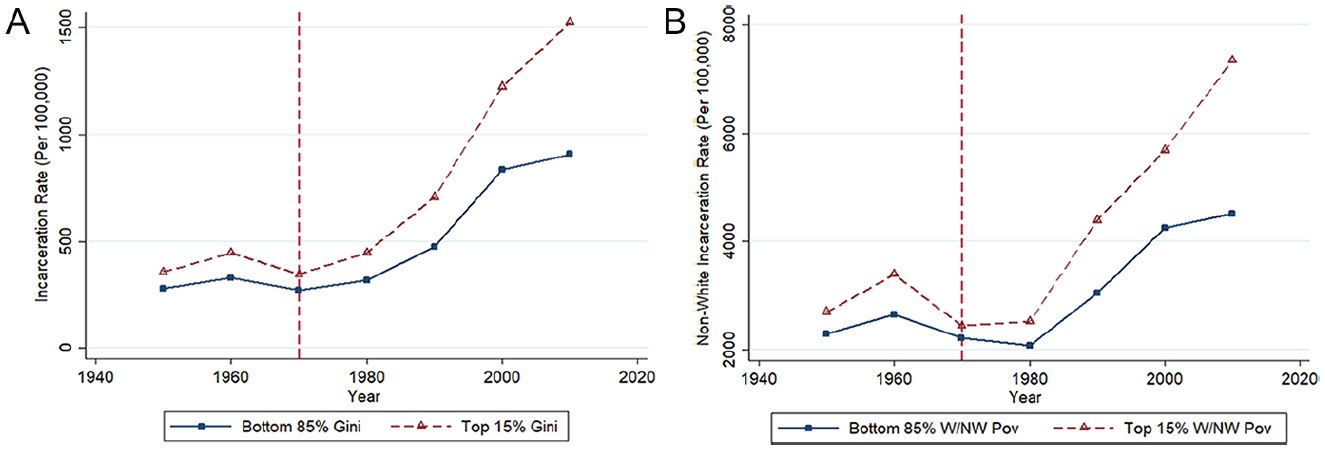
Incarceration trend plots by level of inequality and relative poverty. (A) Incarceration by Gini. (B) Non-White incarceration by ratio of White-to-non-White poverty.
Results
Inequality
Table 3 presents results from our initial estimates of Equation 1. We first look at the effect of overall inequality—as measured by the average commuting zone household income Gini coefficient in the post-1970 period—on commuting zone–level incarceration rates. Standard errors are clustered at the state level. All regressions include controls for population shares by race, total population, population growth, average household income, unemployment, average education, and employment shares by industry. Column 2 adds time-fixed effects. Column 3 adds both time- and commuting zone–fixed effects. Column 4 weights observations by the average commuting zone population over the sample period. Column 5 adjusts for the violent crime rate. Columns 6 and 7 use an alternative weighting scheme based on the similarity between the IPUMS/Census incarceration rate measure and the Vera Institute incarceration rate measure, where commuting zones with IPUMS/Census incarceration rate estimates closer in magnitude to the Vera Institute estimates are given higher weights. The alternative weighting schemes are constructed as follows. In Column 6, observations are weighted according to the sample mean of the inverse of the absolute value of the difference between the IPUMS/Census incarceration rate estimate and the Vera Institute incarceration rate estimate. In Column 7, observations are weighted by the absolute value of the within–commuting zone correlation between the IPUMS/Census measure and the Vera Institute measure. Note that neither of these weighting schemes require observations for the Vera Institute measure in all years, and thus allow for the inclusion of a wider range of commuting zones than would be available in the Vera data in any given year. The weighting schemes adjust for differences between the alternative measures of incarceration, as discussed in Appendix A.
Estimation Results, Inequality and Overall Incarceration.
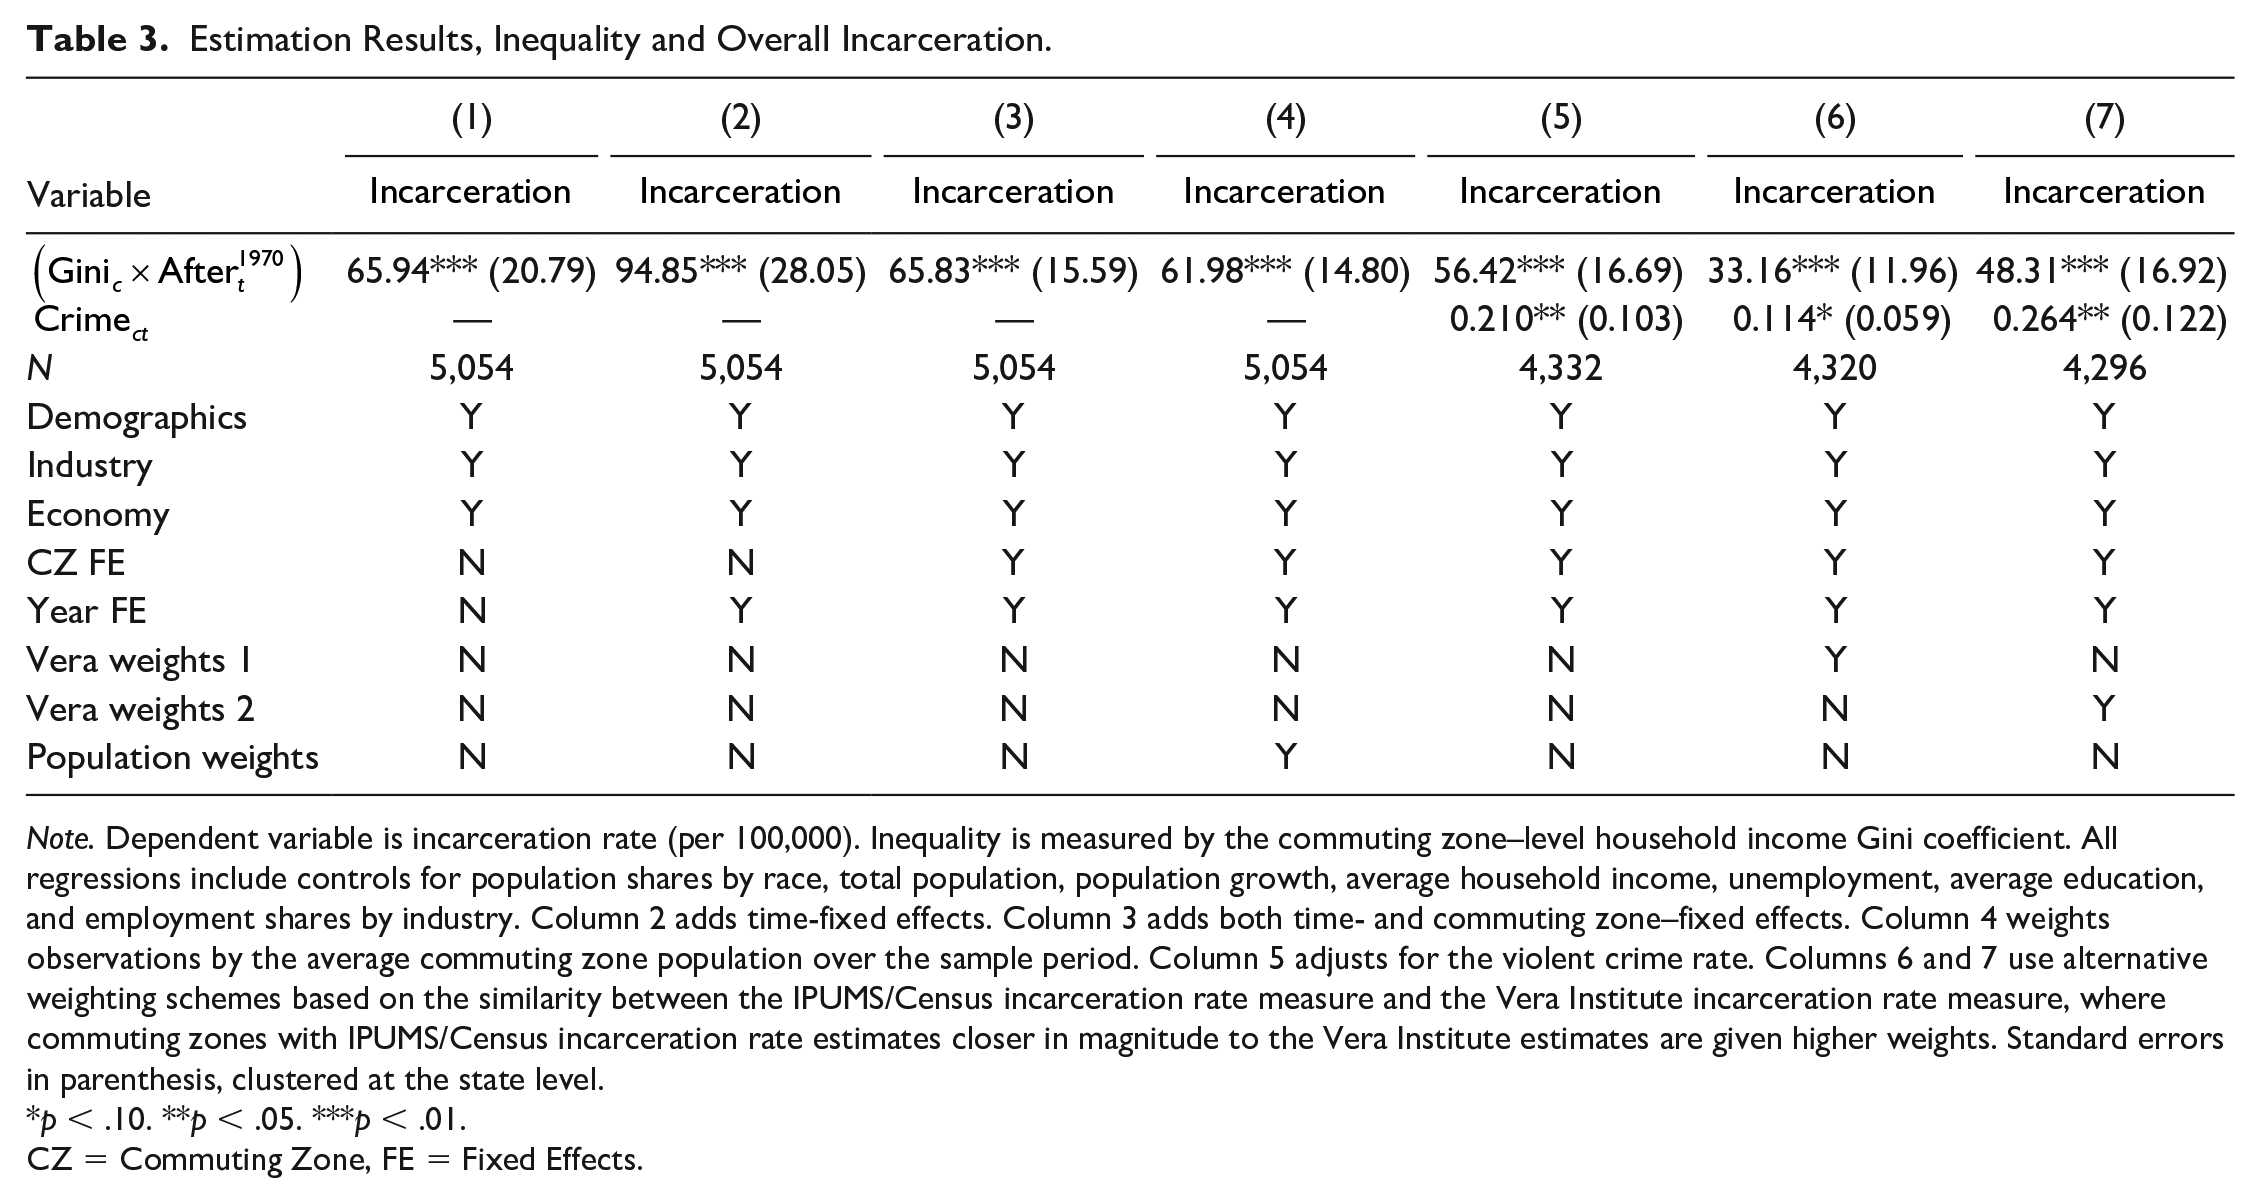
Note. Dependent variable is incarceration rate (per 100,000). Inequality is measured by the commuting zone–level household income Gini coefficient. All regressions include controls for population shares by race, total population, population growth, average household income, unemployment, average education, and employment shares by industry. Column 2 adds time-fixed effects. Column 3 adds both time- and commuting zone–fixed effects. Column 4 weights observations by the average commuting zone population over the sample period. Column 5 adjusts for the violent crime rate. Columns 6 and 7 use alternative weighting schemes based on the similarity between the IPUMS/Census incarceration rate measure and the Vera Institute incarceration rate measure, where commuting zones with IPUMS/Census incarceration rate estimates closer in magnitude to the Vera Institute estimates are given higher weights. Standard errors in parenthesis, clustered at the state level.
p < .10. **p < .05. ***p < .01.
CZ = Commuting Zone, FE = Fixed Effects.
The results suggest a statistically significant positive relationship between inequality and the rate of incarceration after 1970. Averaging across all columns, a one-unit increase in the average post-1970 household income Gini coefficient in a commuting zone is associated with an approximately 61-point increase in the incarceration rate (an increase of 61 people per 100,000). For a commuting zone at the sample mean post-1970 incarceration rate of 684.94, this represents a nearly 10% increase. This result appears robust to the inclusion of a wide variety of controls, including commuting zone- and year-fixed effects. 10 Importantly, this result is robust to the inclusion of the violent crime rate, which suggests that the increase in incarceration after 1970 was not simply a rational response to rising crime. Holding the crime rate constant, an increase in commuting zone inequality nonetheless translates into higher incarceration rates after 1970. However—consistent with the neoclassical approach—the commuting zone–level crime rate has a statistically significant, positive effect on the incarceration rate.
Even if we consider the specification with the smallest estimated effect magnitude (33.16)—Column 6, which accounts for differences in measured incarceration (due to the recorded location of prisoners) between the Census data and the Vera Institute data—the impact of inequality on incarceration is nonetheless highly statistically and economically significant, suggesting the positive relationship between inequality and incarceration is not driven merely by measurement error in the Census incarceration data.
Table 4 extends our estimates of Equation 1 over different race and ethnicity categories. We focus on differences in our parameter estimates across White non-Hispanic, non-White non-Hispanic, Hispanic, and Black non-Hispanic race/ethnicity groupings.
Estimation Results, Inequality and Incarceration by Race.
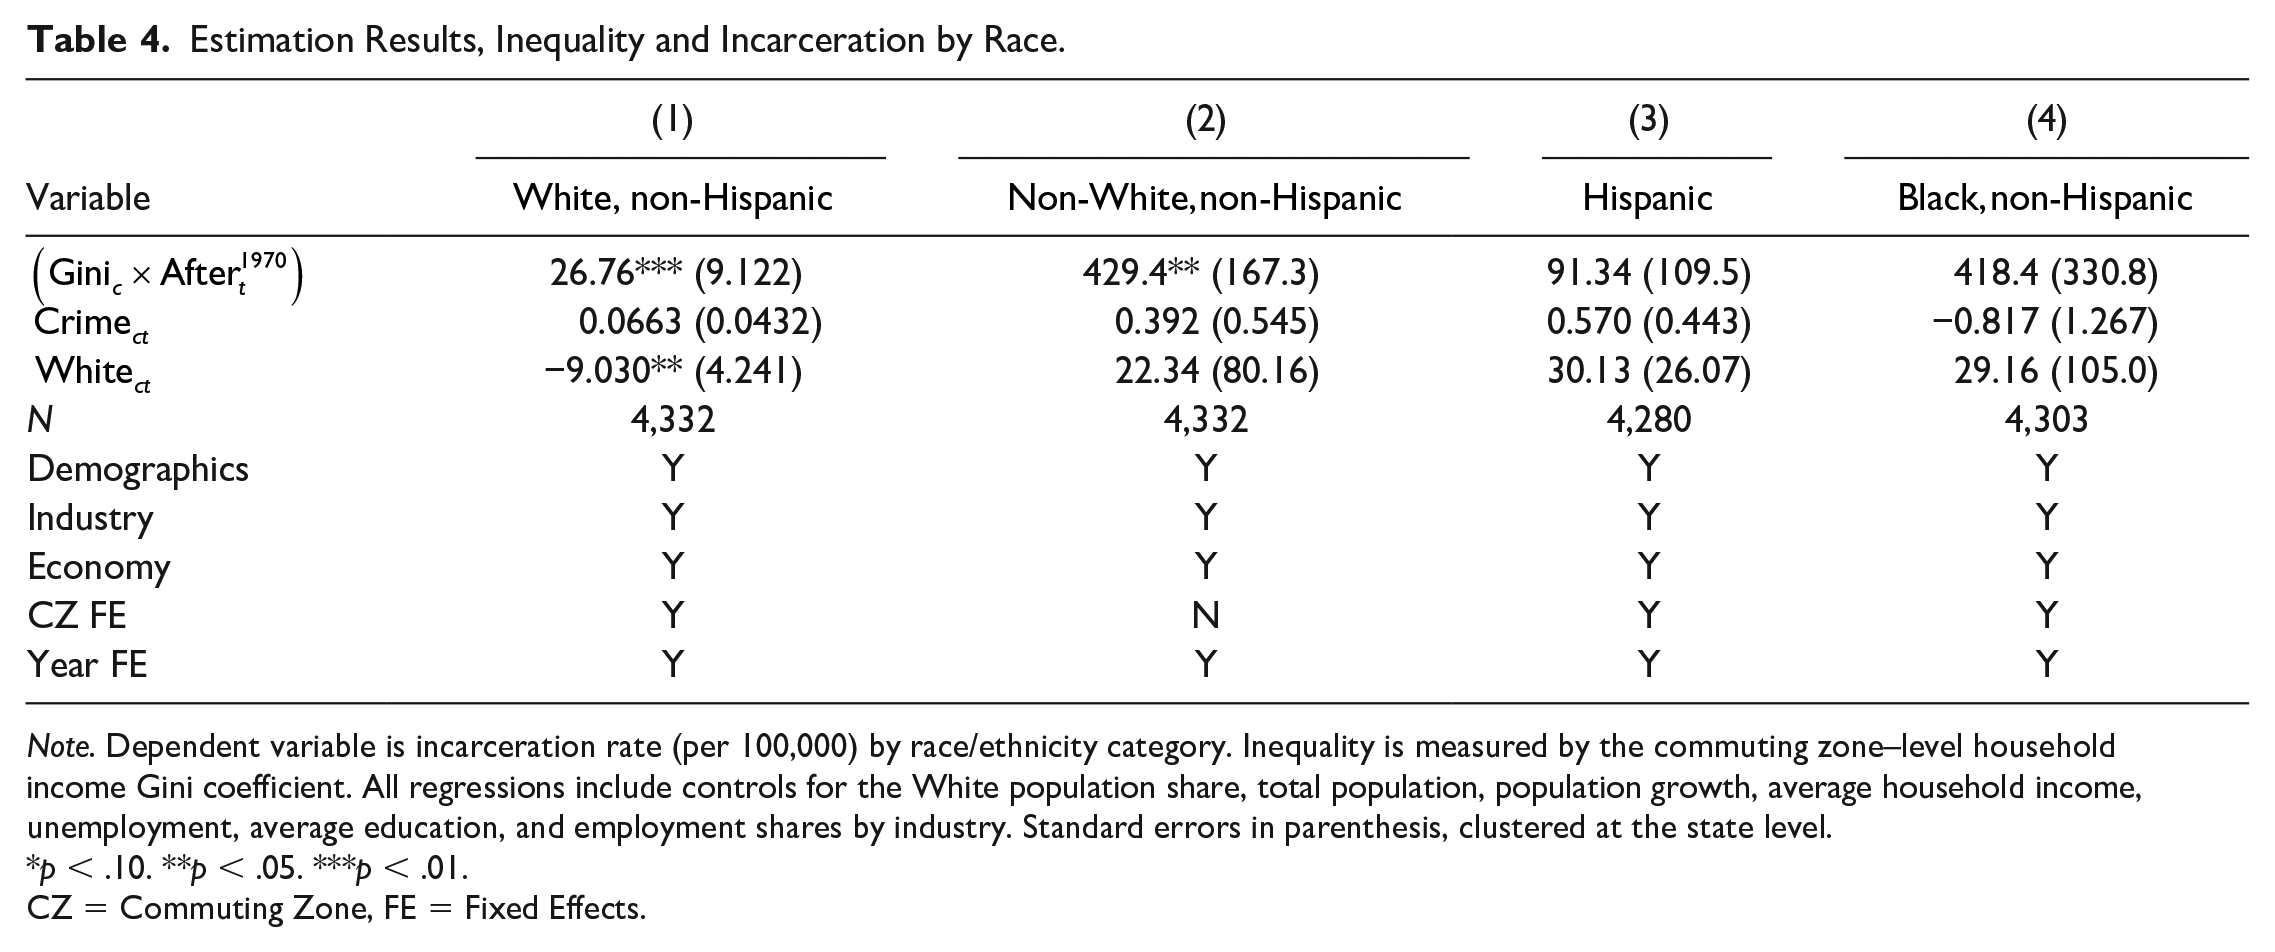
Note. Dependent variable is incarceration rate (per 100,000) by race/ethnicity category. Inequality is measured by the commuting zone–level household income Gini coefficient. All regressions include controls for the White population share, total population, population growth, average household income, unemployment, average education, and employment shares by industry. Standard errors in parenthesis, clustered at the state level.
p < .10. **p < .05. ***p < .01.
CZ = Commuting Zone, FE = Fixed Effects.
The results in Table 4 suggest that a unit increase in the average household income Gini coefficient in the post-1970 period has a larger impact on non-White, non-Hispanic incarceration than White incarceration, where the magnitudes of the coefficients suggest the bulk of the effect is driven by the impact of inequality on incarceration of Black individuals. A unit increase in the average post-1970 Gini results in an increase in incarceration of approximately 429 persons per 100,000 for non-White, non-Hispanic individuals. The coefficient for Black, non-Hispanic individuals is of similar magnitude—although less precisely estimated. In contrast, the same increase in the Gini coefficient increases the incarceration rate for White individuals by only 27 persons per 100,000, an effect smaller in magnitude than the average overall effect estimated in Table 2. These results add to the growing body of work suggesting that the social consequences of inequality are not borne equally across race/ethnicity groups, with emphasis on the negative social impact of economic inequality on minorities and people of color.
In addition to the main results presented in Table 4, it is worth drawing attention to the estimated regression coefficients on the crime rate and White population share. In every specification, the coefficient on the crime rate variable is positive but statistically insignificant, weakly consistent with the neoclassical hypothesis. Second, the White population share variable has a statistically significant negative impact on White, non-Hispanic incarceration rates. This result suggests that commuting zones where a large share of the population is White incarcerate White individuals at lower rates. In contrast, the effect of the White population share is positive, but statistically insignificant, for all non-White groups. 11 Thus, the racial composition of a commuting zone appears to have an independent effect on incarceration. In the next subsection, we extend this dimension of the analysis to explore whether or not differences in the economic standing of various race/ethnicity groups have differential impacts on incarceration rates by race in a fashion consistent with Alexander’s (2010) description of tough on crime policies as a “racial bribe.”
Relative Poverty
Table 5 presents regression coefficients from estimating Equation 1 using relative poverty—measured as the ratio of the White poverty rate to the non-White poverty rate in a given commuting zone—as the variable of interest. Specifically,
Estimation Results, Relative Poverty and Incarceration by Race.
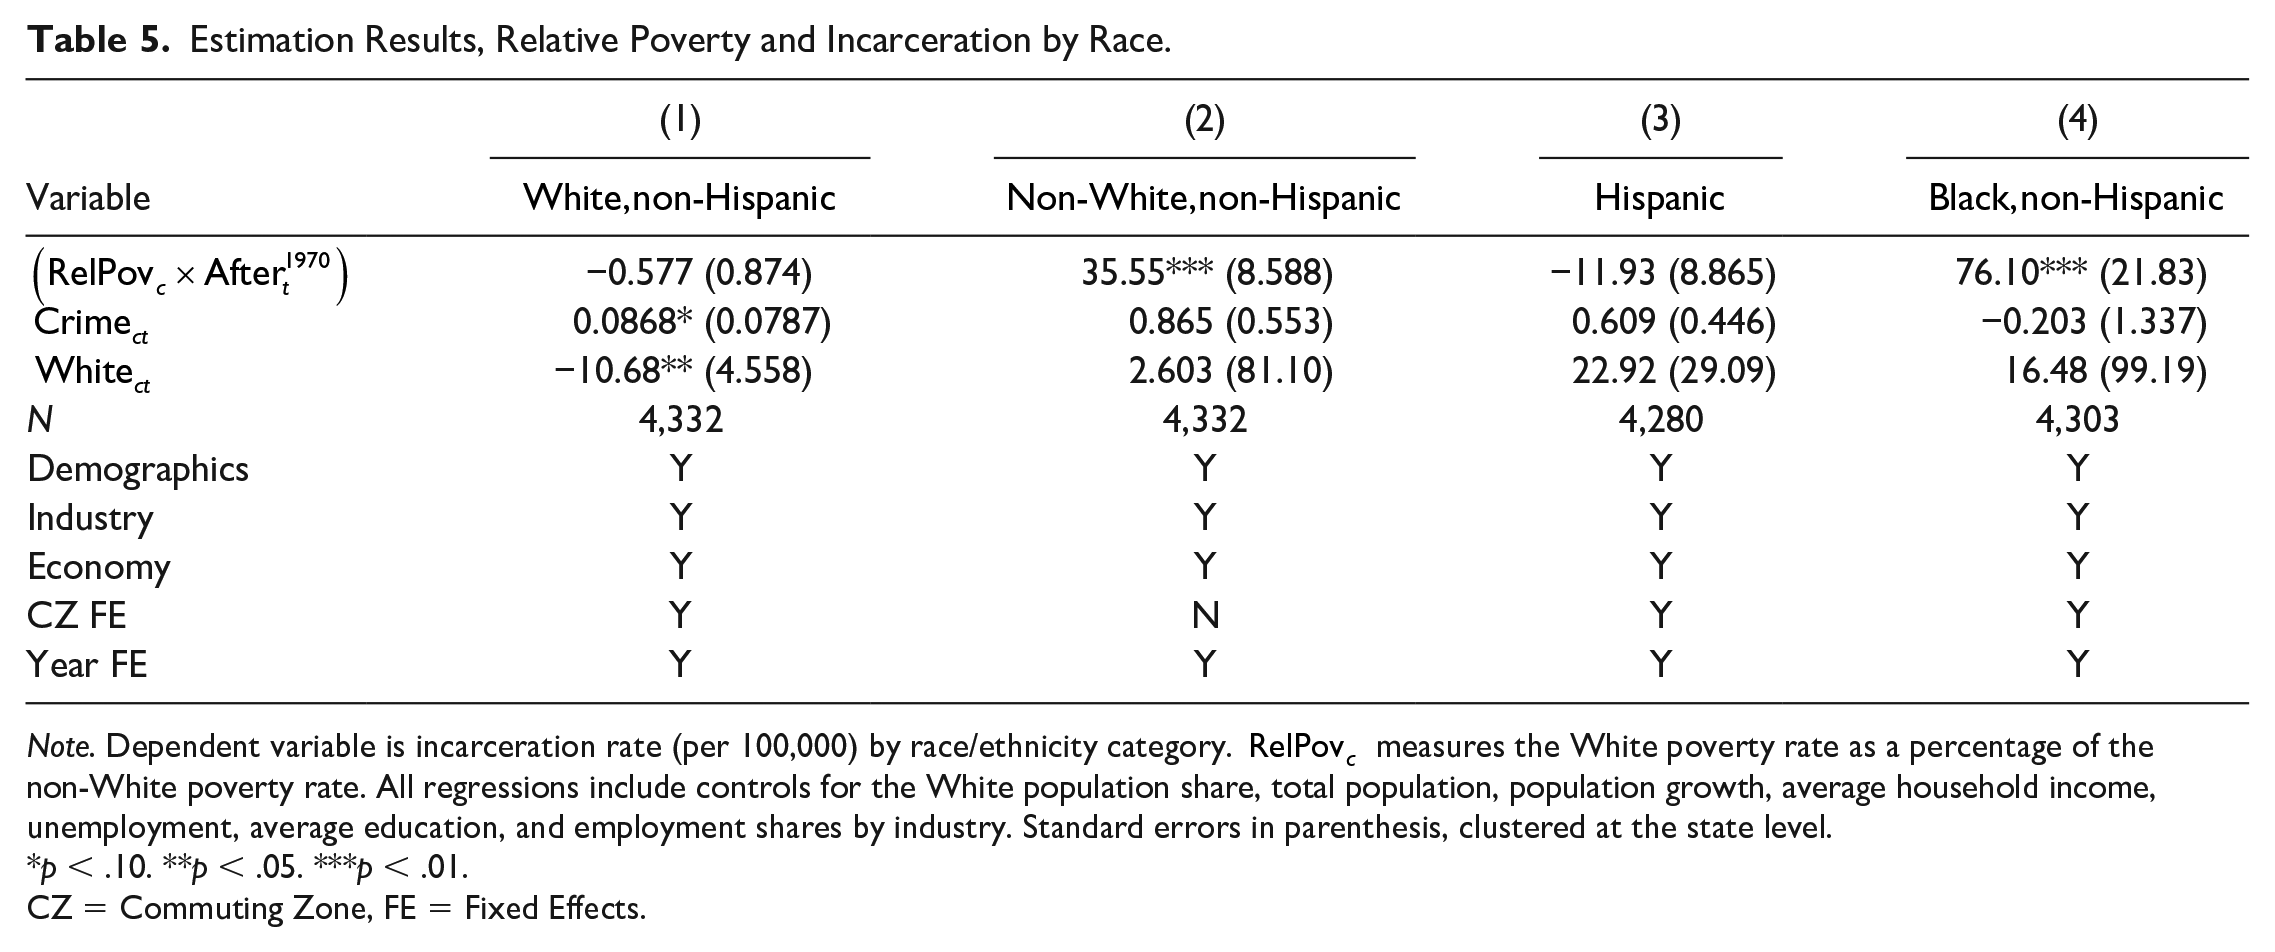
Note. Dependent variable is incarceration rate (per 100,000) by race/ethnicity category.
p < .10. **p < .05. ***p < .01.
CZ = Commuting Zone, FE = Fixed Effects.
Additional Sensitivity Checks
We begin the sensitivity analysis by extending the main specification to Equation 2, which allows year-by-year interactions between year-fixed effects and the variable of interest. This specification allows for flexible dynamics in measuring the impact of inequality and/or relative poverty on incarceration in the post-1970 period by varying the treatment effect by year. Table 6 presents the results. We report results from specifications including the crime rate variable, although we also run each of the regressions without it. We find no meaningful difference in the estimated regression coefficients on our variables of interest in either case. Columns 1 to 4 present results using average post-1970 Gini coefficient as the variable of interest. Columns 5 to 7 present results using the average post-1970 ratio of the White poverty rate to the non-White poverty as the variable of interest.
Estimation Results, Year-by-Year Effects.
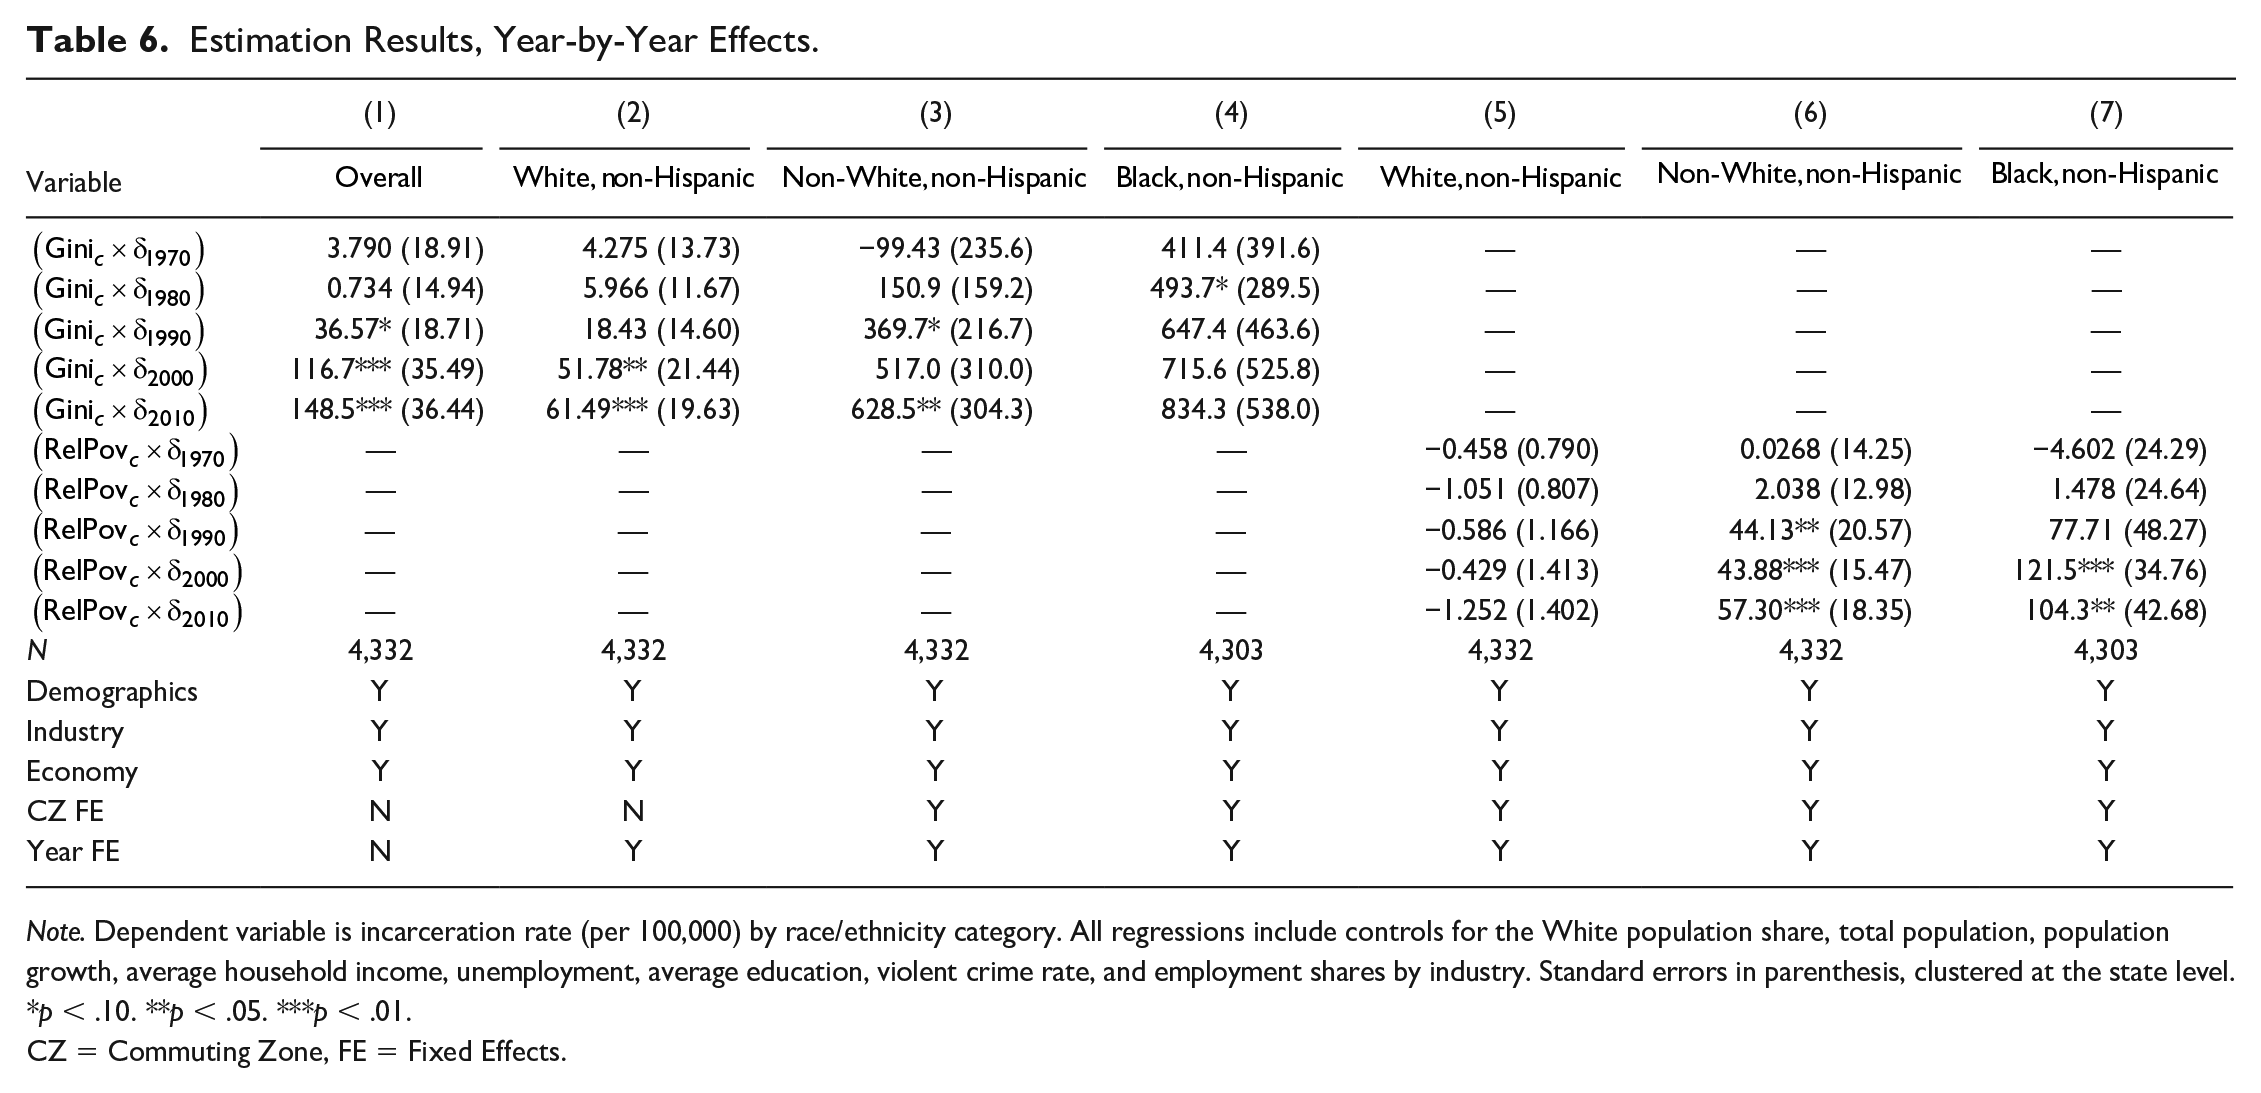
Note. Dependent variable is incarceration rate (per 100,000) by race/ethnicity category. All regressions include controls for the White population share, total population, population growth, average household income, unemployment, average education, violent crime rate, and employment shares by industry. Standard errors in parenthesis, clustered at the state level.
p < .10. **p < .05. ***p < .01.
CZ = Commuting Zone, FE = Fixed Effects.
Table 6 supports the results found previously: Higher post-1970 inequality is associated with greater incarceration rates across all race/ethnicity groups (although the effect is statistically insignificant when Black, non-Hispanics, and Hispanics are considered separately), but greater relative poverty for Whites is only statistically significantly associated with incarceration for non-Whites, and for Black, non-Hispanics in particular. The results in Table 6 also shed new light on the temporal dimension of the relationship between inequality, poverty, and mass incarceration. The estimates suggest that the effect of local labor market inequality on incarceration occurs predominantly after 1980. This finding is consistent with the overall trajectory of incarceration depicted in Figure 1, which—despite indicating an initial uptick in incarceration between 1970 and 1980—illustrates that the lion’s share of the increase in incarceration in the post-1970 period occurs between 1980 and 2010.
Finally, Table 6 lends initial support for the parallel trends assumption required for difference-in-differences. For difference-in-differences estimates to be valid, trends in the outcome variable must be parallel across treated and untreated groups in the period prior to the treatment. In this case, with a continuous treatment indicator variable (local labor market inequality), what is required is that trends in incarceration be the same across commuting zones for varying levels of inequality for all years prior to 1970. In Table 5, this amounts to requiring the interaction term featuring the 1970 year-fixed effect and the variable of interest be statistically insignificant and close to zero. This condition is satisfied across all columns. The regression coefficient on the variable of interest is statistically insignificant and small in magnitude in all cases when interacted with the 1970 year-fixed effect. However, to test the parallel trends assumption more formally, we nonetheless implement an additional placebo test across “high” and “low” treatment groups.
Table 7 presents the results of the placebo test. To implement the test, we separate the sample into “high” and “low” treatment groups—commuting zones in the top 15% of the sample distribution for inequality or relative poverty are counted as “high” treatment, as in Figure 6—and then reestimate Equation 1 using a placebo treatment date (1960), restricting the sample to the period prior to the treatment (all years before—and including—1970).
Placebo Test.
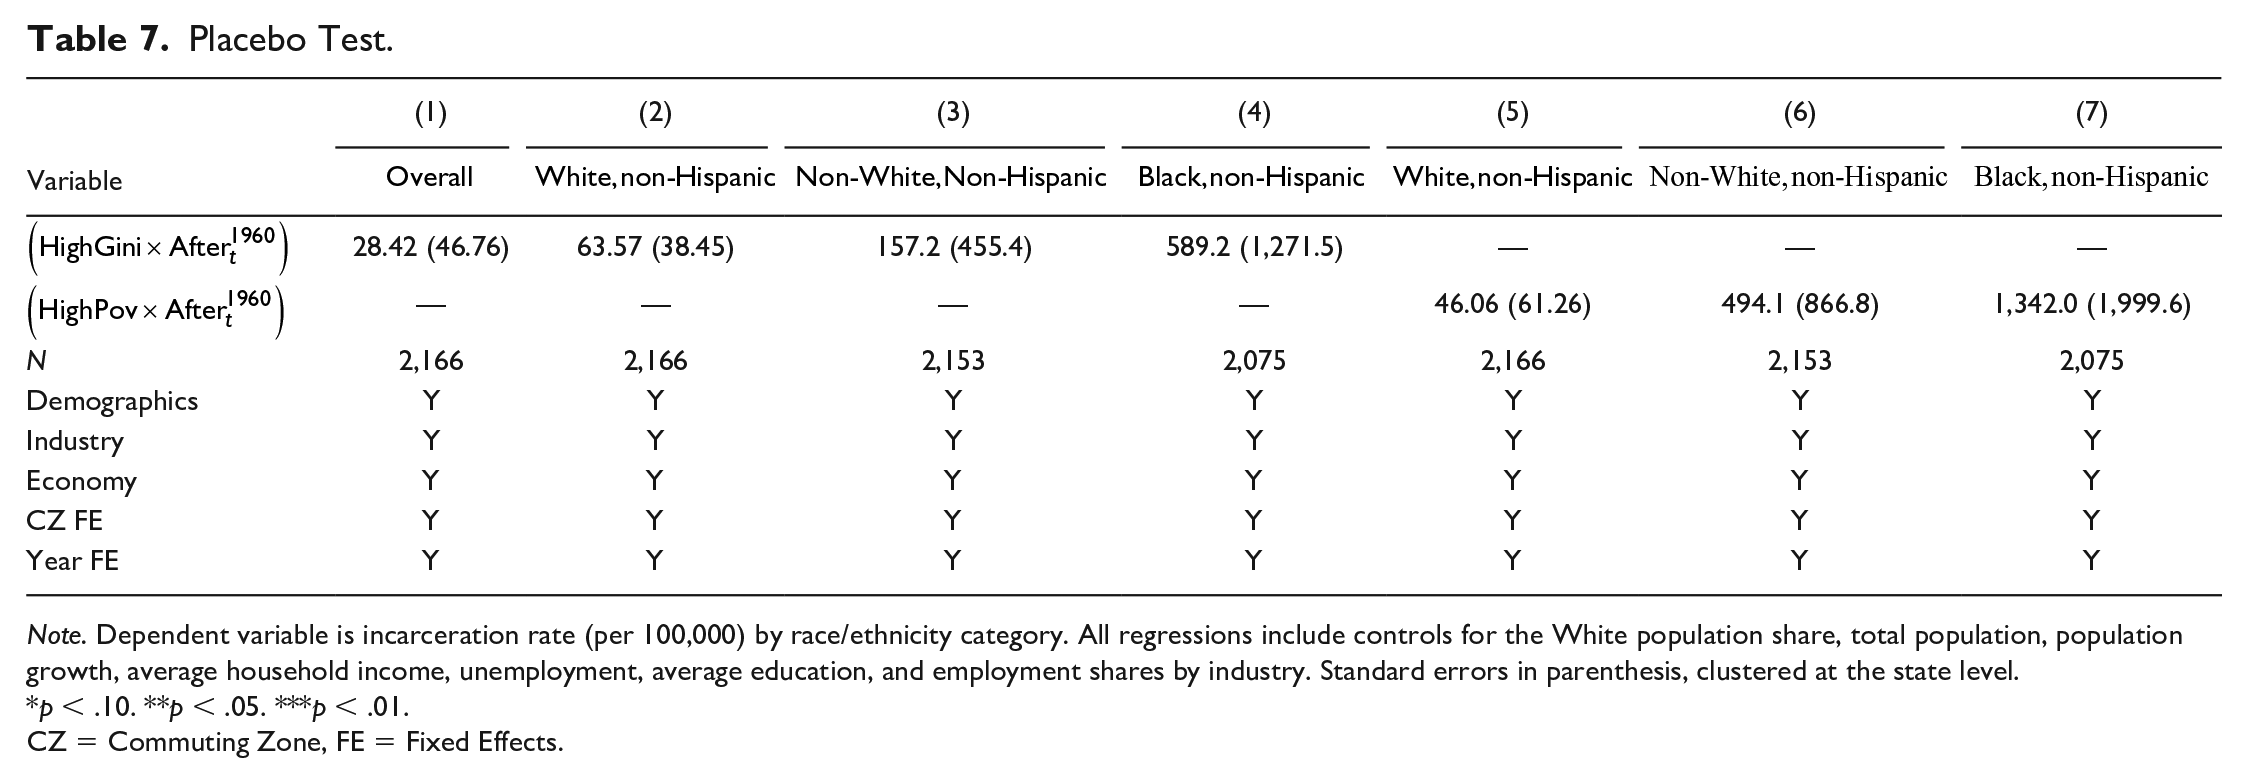
Note. Dependent variable is incarceration rate (per 100,000) by race/ethnicity category. All regressions include controls for the White population share, total population, population growth, average household income, unemployment, average education, and employment shares by industry. Standard errors in parenthesis, clustered at the state level.
p < .10. **p < .05. ***p < .01.
CZ = Commuting Zone, FE = Fixed Effects.
The parallel trends assumption is satisfied in every case. For both the inequality treatment and the relative poverty treatment, the trend in incarceration for the high treatment group is statistically insignificantly different from the low treatment group in the period prior to the prison boom.
A final robustness check concerns the degree to which selection on unobservables influences our coefficient estimates. Recognizing that assignment into the treatment category (i.e., the level of inequality) is potentially nonrandom, identifying the effect of mass incarceration on commuting zones of differing levels of inequality will—at minimum—require parallel trends in the pretreatment period. The results in Table 7 suggest this requirement is satisfied. However, we can further assess the degree to which selection on unobservables influences our results by applying the test developed by Oster (2019).
Oster (2019) shows that information about the degree of selection on observables can be used to bound coefficient estimates in the presence of selection on unobservables. In particular, Oster (2019) shows that under the assumption of equal selection—that the degree of selection on unobservables is proportionate to the degree of selection on observables—the bias-adjusted regression coefficient is given by:

where
Table 8 presents the bias-adjusted coefficients for three of our key results: the effect of inequality on overall incarceration; the effect on non-White, non-Hispanic incarceration; and the effect of relative poverty on non-White, non-Hispanic incarceration. The adjusted coefficients suggest that selection on unobservables is not a primary driver of our results. The estimated effect of inequality on overall incarceration and the effect of relative poverty on non-White, non-Hispanic incarceration are only slightly attenuated. In contrast, the effect of inequality on non-White, non-Hispanic incarceration is slightly elevated. Taken in conjunction with the results in Table 7, Table 8 suggests our estimates are robust to concerns about selection on unobservables.
Oster (2019) Bias-Adjusted Coefficients.

Discussion and Conclusion
In this article, we explore the extent to which labor market inequality is associated with incarceration at the local level between 1950 and 2010. Using decennial IPUMS/Census microdata to construct estimates of the commuting zone incarceration rate—verifying our estimates with recently released data on incarceration by county of admission from the Vera Institute of Justice—we examine the impact of inequality on the overall incarceration rate in a commuting zone, as well as the varying impact of inequality on incarceration by race. Although income inequality is associated with higher rates of incarceration for all race and ethnicity groups (although not always in statistically significant fashion), the effect is largest for non-White, non-Hispanic individuals. Furthermore, when we examine the relationship between relative poverty and incarceration, we find a strong, positive relationship between White relative poverty (measured as the ratio of the White poverty rate to the non-White poverty rate) and non-White incarceration, particularly of non-Hispanic Blacks. We find no relationship between White relative poverty and White incarceration. Our results have several important implications.
First, our results are broadly consistent with Alexander’s claims in The New Jim Crow that mass incarceration and the “War on Drugs” arose following the Civil Rights Movement as attempts by White elites to reestablish the system of racialized social control that was disrupted when Jim Crow was dismantled. The positive relationship between inequality and incarceration fits within the theoretical framework for understanding racial inequality coming out of stratification economics (Darity, 2005; Darity et al., 2015), which suggests that race- and class-based discrimination represent a rational attempt by privileged groups to maintain their relative status and the material benefits, which that status confers. To the extent that rising economic inequality confers greater rents to people in positions of privilege, local elites have an incentive to increase their stratification efforts—including via more restrictive penal policy. The positive relationship between local incarceration rates for non-Whites and White relative poverty is consistent with Alexander’s (2010) argument that at least one of the political motivations for the rise of tough-on-crime policy after the Civil Rights Movement was to function as a racial bribe that attracted poor Whites away from newly formed, otherwise diverse, working-class political coalitions. Our results constitute strong empirical evidence in favor of the Alexander Hypothesis, which asserts that the rise of incarceration in the United States beginning in the 1970s can be viewed as an effort by White males, especially those of lower socioeconomic status, to maintain the privileges they experience from being White. This result, however, does not come without caveat. Given the reduced-form nature of our empirical model, we cannot directly speak to the role of intention—an important part of the stratification narrative. Thus, although our results are consistent with the Alexander Hypothesis, additional evidence regarding the degree to which intent drives the mechanisms behind the Alexander Hypothesis is desirable. In this sense, our article represents only a first step in the empirical evaluation of the stratification approach to mass incarceration.
Still, we argue that our findings of linkages between inequality and incarceration by race matter independently of whether discrimination is implicit or explicit. Recent work has recognized implicit bias as an impactful mechanism for understanding economic outcomes (e.g., Bertrand et al., 2005; Guryan & Charles, 2013; Jost et al., 2009). Bertrand et al. (2005) go as far as concluding, However we test for it, implicit discrimination is not useful simply as a subtle alternative interpretation. If it is a powerful driver of discriminatory behavior, it should reshape the way we understand discrimination and alter our available spectrum of remedies. (p. 97)
Further highlighting complexity, Small and Pager (2020) add the concept of “perceived” discrimination as consequential for policy.
Whether or not there is explicit intent behind the relationships between inequality and disproportionate incarceration by race that we document, our results speak to the uneven social burden of rising economic inequality and the importance of positional concerns in determining who bears that burden. Although both Whites and non-Whites experienced an increase in incarceration as a result of rising inequality during the post-1970 prison boom, the magnitude of that increase—and the impact of inequality as a mechanism determining the incidence of that increase—were disproportionately born by racial and ethnic minorities. To the extent that our results on the relationship between relative poverty and non-White incarceration—although reduced form—reflect behavior motivated by race-based positional concerns on behalf of poor Whites, they suggest that (a) comparisons across groups may matter as much for positional concerns as comparisons across individuals and (b) Robert Frank’s (2005) claim that “positional externalities cause large and preventable welfare losses” is an understatement, given that additional group-based social multiplier effects are involved.
Finally, our results suggest links between economic inequality, race, and the criminal justice system, offering important insight for both those who would undertake future criminal justice reform efforts and those who work on economic policy. Our results are relevant for the starting point discussions initiated with the First Step Act of 2018 and for the importance of continued “steps” toward effective and equitable prison and criminal justice reforms. Our results are also relevant for discussions of appropriate policy responses to cases of police brutality directed at Black men such as Rodney King and George Floyd and the associated public protests.
We argue that heterogeneities affect the intersections of economic inequality and policing and prison outcomes. Reforms that aim to reverse course on mass incarceration are unlikely to have long-term success in the absence of actions that (a) assuage the identity-driven positional tensions, which led poor Whites to lend their support to the policies and politicians initially responsible for mass incarceration and (b) address inequality so as to eliminate the rents associated with positions of racial and economic privilege. As long as hierarchies based on race and economic status confer benefits to those at the top, there will be an incentive for individuals to support institutions that maintain and enforce the existing pattern of resource allocation. Rather than issues to be addressed separately, economic inequality and racial inequality—including racial disparities in the criminal justice system—must be treated as part of the same problem.
Supplemental Material
Inequality_Incarceration_Data – Supplemental material for Local Labor Market Inequality in the Age of Mass Incarceration
Supplemental material, Inequality_Incarceration_Data for Local Labor Market Inequality in the Age of Mass Incarceration by Luke Petach and Anita Alves Pena in Review of Black Political Economy
Footnotes
Appendix A
Appendix B
Appendix C
Acknowledgements
The authors thank fruitful conversations with colleagues following several conference and seminar presentations of earlier drafts, including at the American Economic Association Annual meetings, the Eastern Economic Association Annual meetings, and at Georgia State University’s Andrew Young School of Policy Studies.
Declaration of Conflicting Interests
The author(s) declared no potential conflicts of interest with respect to the research, authorship, and/or publication of this article.
Funding
The author(s) received no financial support for the research, authorship, and/or publication of this article.
Supplemental Material
Supplemental material for this article is available online.
Notes
References
Supplementary Material
Please find the following supplemental material available below.
For Open Access articles published under a Creative Commons License, all supplemental material carries the same license as the article it is associated with.
For non-Open Access articles published, all supplemental material carries a non-exclusive license, and permission requests for re-use of supplemental material or any part of supplemental material shall be sent directly to the copyright owner as specified in the copyright notice associated with the article.