
Abstract
The US racial wealth gap is substantial and growing, stemming from a history of structural racism and the intergenerational transmission of wealth. This article investigates the role of corporate equity and mutual fund ownership on the racial wealth gap over time. 92.1 percent of US corporate equity and mutual fund value is owned by white households; Black households own 1.5 percent while Hispanic households own 1.9 percent. I use the Federal Reserve's Distributional Financial Accounts to determine the changing impact of the corporate equity gap on the racial wealth gap, and to measure how shareholder payments—dividends and stock buybacks—are divided by race and ethnicity. I find that total shareholder payments made to white households during that time frame totaled $13 trillion, while $181 billion went to Black households and $212 billion to Hispanic households. I then find that the proportion of the gap in corporate equity and mutual fund ownership to the overall racial wealth gap has grown over the past three decades, from 10 percent to 23 percent. This analysis contributes to policy discussions about ending shareholder primacy and wealth inequities that are a legacy of the US's history of slavery, racism, and xenophobia.
Keywords
Introduction
The US racial wealth gap is substantial and growing, stemming from our history of structural racism and intergenerational transmission as an important means of wealth accumulation (Chiteji & Stafford, 1999; Darity & Hamilton, 2012). The 2019 Survey of Consumer Finances shows that while median family wealth for white households was $188,200, for Black households it was $24,100 and for Hispanic 1 households, $36,100 (Bhutta et al., 2020). Wealth equity is important because wealth permits economic freedom: the ability to invest in one's future and the future of one's children (Darity & Hamilton, 2012). Disparities in home ownership and debt have been investigated in the racial wealth gap literature as key drivers of the growing racial wealth gap. This article will investigate the role of corporate equities and mutual fund ownership of equities, as well as the corporate governance ideology of shareholder primacy, in increasing the racial wealth gap over time.
Shareholder primacy—the corporate governance framework for the operation of large modern corporations in which the sole responsibility of corporate leaders is to increase the wealth of shareholders—is linked directly to wealth inequality, as it increases the wealth of those who own equities while exerting pressure to reduce labor expenses (Ireland, 2005; Lazonick & O’Sullivan, 2000; Lazonick & Shin, 2020). This framework is contested as a correct understanding of corporate law and reflects a “market orthodoxy” view of the corporation as simply a nexus of contracts, rather than as a social institution (Admati, 2017). Scholars have explored the impact of shareholder primacy on corporate investment and the slowdown of the macroeconomy, as well as in terms of the income gap (Lazonick, 2014; Lin & Tomaskovic-Devey, 2013; Palladino, 2020, 2021b; Tulum & Lazonick, 2018). This article contributes both to the broader literature on financialization and shareholder primacy and to the literature on the racial wealth gap by examining the impact of shareholder primacy on the US racial wealth gap. As households of color are both more likely to be concentrated in the low-wage workforce and less likely to hold corporate equity, the impact of shareholder primacy on the racial wealth gap is doubly negative.
I use several methodologies to evaluate the impact of disparate equity ownership and payments to shareholders on racial wealth disparities. I use the Federal Reserve's Distributional Financial Accounts to determine the changing impact of the corporate equity gap on the racial wealth gap, and to measure how shareholder payments—dividends and stock buybacks—are divided by race and ethnicity. I find that shareholder payments flow disproportionately to white households: there is a Black-white ratio of 0.013 and a Hispanic-white ratio of 0.016 of total shareholder payments received over the period from Q1 2004 to Q2 2019. The proportion of the gap in corporate equity ownership to the overall racial wealth gap for Black and Hispanic households increased to 23 percent in 2019 from 10 percent 30 years ago. Both of these findings show that one consequence of the corporate ideology of shareholder primacy is a widening of the racial wealth gap in the United States.
This original analysis contributes to policy discussions about how to structure the rules for corporate equity ownership in society, and how to end wealth inequities that are a legacy of the US's shameful history of slavery, racism, and xenophobia. As noted by Insight Center for Community Economic Development President Anne Price, it is critical to focus “on the root of racial wealth inequality rather than fixating on the racial wealth gap,” because a gap can be partially closed without addressing its underlying causes (Price, 2020). This article uses the gap as a measurement device but supports a conceptual and policymaking reframing to focus on wealth equity—by confronting ongoing racism, checking the dominance of corporations that stems from neoliberal economic theory, and increasing public power (Price, 2020).
The article proceeds as follows. Section 2 describes the broader literature on the racial wealth gap and shareholder primacy. Section 3 uses data from the Federal Reserve's Distributional Financial Accounts and S&P Compustat to show in dollar value who is receiving shareholder payouts. Section 4 examines the contribution of the corporate equity gap to the broader racial wealth gap. Section 5 discusses policy recommendations that would specifically reduce shareholder primacy. Section 6 concludes.
Section 2. The Racial Wealth Gap and Shareholder Primacy
The Racial Wealth Gap in the United States
The racial wealth gap is persistent, despite gains by Blacks, Latinxs, Asian Americans and Pacific Islanders, and Native Americans in income, education, and civil rights (Nembhard & Chiteji, 2006). In part, the racial wealth gap is related to the overall growth of wealth inequality, yet economists find persistent gaps in wealth due to race and ethnicity net of other contributors to the wealth gap (Gittleman & Wolff, 2004). Structural racism and discrimination have shaped the wealth of households differently for Blacks, Latinxs, Asian Americans and Pacific Islanders, and Native Americans. African Americans have faced a long history of racism and exclusion that has prevented them from building wealth over generations, beginning with the horrors of chattel slavery. Sharecropping, Jim Crow laws, exclusion from government benefits like the GI Bill, redlining and financial exclusion (for example, when communities of color were targeted for subprime loans before the housing crisis of 2008) have all contributed to the racial wealth gap. For Latinx households, loss of land and community, and economic immigration from Latin America that has resulted in a concentration in low-income employment, have resulted in low levels of wealth. For Native Americans, forced removal from their ancestral lands, concentration on reservations, and labor market exclusions have placed the nation's original residents at a deep disadvantage (not to mention the fact that data on Native American household wealth is not provided on its own by government statistics). For Asian Americans and Pacific Islanders, whose household data is also not disaggregated in the Distributional Financial Accounts, the immigration experience has been quite varied, resulting in a complex set of financial outcomes. Due solely to the limitations of the data on race and ethnicity provided by the Federal Reserve, this paper focuses exclusively on the Black-white and Latinx (termed “Hispanic” in Federal Reserve data)-white wealth gaps.
Overall, wealth inequality is growing in the United States. According to the Federal Reserve's Distributional Financial Accounts (DFAs), the share of household wealth held by the top 10 percent went from 60.7 percent in 1989 to 69 percent in 2020. The top 1 percent on its own went from holding 23.5 percent of household wealth in 1989 to 30.5 percent in 2020, while the wealth share of the next 9 percent stayed nearly steady, rising by 1.3 percentage points. Wealth for households between the 50th and 90th percentile fell nearly 7 percentage points (from 35.5 percent to 29.1 percent), while the wealth share of the bottom 50 percent of American households also fell, albeit from a much lower starting point—from 3.7 percent in 1989 to 1.9 percent in 2020. Even in the relatively prosperous 1990s, the wealth share of the bottom 50 percent hovered around just 4 percent of total wealth, but it has been in steady decline since then. The combined 7-percentage-point loss from the 50th to 90th percentiles and the 2-percentage-point loss from the bottom 50th percentile went directly to the top 1 percent over the same time period, resulting in their 9-percentage-point increase in wealth share.
The Racial Wealth Gap
Because of the history of structural racism in the US, the households of Blacks, Latinxs, Asian Americans and Pacific Islanders, Native Americans, and mixed-race families fall disproportionately lower on the wealth distribution. The racial wealth gap persists because, as economist Darrick Hamilton says, “wealth begets wealth.” Wealth enables households to invest in their family's future, and positive asset ownership allows families to invest in assets likely to produce high returns (Zewde, 2019). Wealth compounds over time due to intergenerational wealth transmission (Chiteji & Stafford, 1999). Parents pass on wealth to their children through gifts and transfers, or through being able to pay for a child's college education or co-sign on a major loan, all of which further concentrates wealth among white households. For example, 88 percent of households receiving inheritances or inter vivos transfers were white (Feiveson & Sabelhaus, 2018). The tax system, moreover, favors wealth over income (e.g., estate taxes). Another source of the racial wealth gap today comes from wealth strippers—subprime mortgages disproportionately marketed to families of color; higher interest rates on debt; and other forms of financial exclusion (Price, 2020). In addition to its obvious economic importance, wealth gives households social and political power above and beyond its economic consequences (Zewde, 2019). Wealth concentration in a society has a deep impact on the functioning of its democracy (Flynn et al., 2017).
The DFAs show that the racial wealth gap, expressed in terms of share of net worth, has been remarkably persistent over the past 15 years. In 2004, white households held 89.8 percent of all wealth, and in 2019 they held 85.2 percent. The wealth share of Black households moved from 4 percent to 4.3 percent during that time frame, while Hispanic households’ share went from 2.5 percent to 3.2 percent (the “other” category captured most of the loss to white households, moving from 3.6 percent to 7.3 percent). All of these disparities in wealth should be contrasted to Black, Hispanic, and white households as a percentage of total households as aggregated for the Distributional Financial Accounts: as of 2019 q3, Black households were 14 percent of all households, while Hispanic households were 10 percent and white households were 65 percent. 2 (Table 1)
Net Worth and Share of All Households by Race and Ethnicity, 2020 q3.

Another common way to investigate the racial wealth gap is to consider median 3 net worth for households of different race and ethnic groups in order to lessen the effect of outlier households, and to investigate what percentage of the difference in median net worth can be directly attributed to race and ethnicity. According to the 2019 SCF, white non-Hispanic families had a median net worth of $188,200, while Black household median net worth was $24,100, and Hispanic net worth was $36,100. For all racial and ethnic groups, the mean net worth is substantially higher, reflecting the high concentration of wealth at the top end of the distribution. Median net worth fell by 30 percent during the Great Recession. Black and Hispanic household net worth fell an additional 20 percent in the 2010–2013 period, while white household wealth remained steady. Even as median net worth rose in the study period of 2016–2019, the white-Black gap in median net worth remained nearly unchanged from the 2013–2016 gap, while the white-Hispanic gap fell by $7,900 (Bhutta et al., 2020).
It is useful to compare the racial wealth gap with the racial income gap and rates of labor market participation. Much household wealth is intergenerational and not the result of savings from labor income, though for African American and Latinx families, savings from income comprise a larger share of wealth. Income is clearly stratified by race: The most recent American Community Survey shows that white non-Hispanic households had a median income of $67,937, while Black households had a median income of $41,551, and Hispanic households earned a median of $51,404 (Guzman, 2019). Unemployment remains stratified by race: The African American unemployment rate (which counts only individuals actively looking for work and not in institutional settings) has remained roughly double the white unemployment rate for decades. In their 2018 research, Paul et al. investigate the wage penalty of holding multiple “socially salient” identities, finding that “there is no single ‘gender’ or ‘race’ penalty irrespective of one's race or gender” (Paul et al., 2018). Yet despite progress in closing the income gap, the racial wealth gap remains steady.
Debt has also been an important driver of the racial wealth gap. According to the 2016 SCF, African Americans and Hispanics had debt-net worth ratios of 0.55 and 0.51, respectively, while the ratio for white households was 0.18 (Wolff, 2018). It is important to note, given the median figures, the proportions of households that have zero or negative net worth: For Black households, it is 19 percent, while it is 13 percent for Hispanic households and 9 percent for white households. Black families are the most likely to have education debt, and the most likely to have high debt-to-income ratios; 9 percent of Black families had a debt-to-income ratio of 40 percent. Net worth is, of course, assets minus liabilities; the remainder of this article will focus on the asset side of the household balance sheet, though major gaps also persist on the liabilities side.
Corporate Equity and Mutual Fund Ownership by Race & Ethnicity
This article focuses on the impact of the distribution of ownership of one asset—corporate stock—on the racial wealth gap. Examining the ownership of different assets matters because not all assets have the same rate of return: while real estate had a 4.49 real rate of return from 2016–2019, financial assets had a 9.34 rate of return (Wolff 2021). Corporate equity ownership is extremely unequal when measured both by household wealth and race in the US. While 60 percent of white households own some stock, only 33 percent of Black households and 24 percent of Hispanic households do (Survey of Consumer Finances, 2019). These basic ownership statistics mask how the actual dollar value of corporate equity is distributed, and what this means in terms of who is earning payments made to shareholders from corporate funds. While 57.5 percent of white households owned stock in 2016, 42.9 of white households held more than $10,000 worth of stock; comparatively, for Black households, 29.7 owned some amount of stock, but only 15.2 percent owned stock worth more than $10,000; for Hispanic households, the comparative figures are 26.3 percent owned some stock while only 13.1 percent of households owned more than $10,000 worth of stock (Wolff, 2018).
Before reviewing the data on the distribution of corporate equity ownership in more detail, it is useful to describe and distinguish among the different sources used in more detail, because they report corporate equity ownership in slightly different ways. All of the sources are produced by the Federal Reserve: the Survey of Consumer Finances (SCF); the Distributional Financial Accounts (DFA); and the Financial Accounts. The Survey of Consumer Finances is a triennial cross-sectional survey of U.S. households in which respondents answer a wide range of questions about household balance sheets 4 . The study, begun in 1983, most recently reported data for 2019. Households are categorized according to the respondent's reporting of demographic information, including race and ethnicity and income. Respondents report their total financial assets, including “directly held pooled investment funds,” “directly held stocks,” and “quasi-liquid retirement accounts,” which includes Individual Retirement Accounts (IRAs), future pensions, and current pensions. The Federal Reserve separately reports the Financial Accounts of the United States, which are quarterly aggregate measurements of net worth for all economic sectors, including households. Specifically, “the Financial Accounts of the United States includes data on transactions and levels of financial assets and liabilities, by sector and financial instrument; full balance sheets, including net worth, for households and non-profit organizations,” as well as for businesses. The Financial Accounts calculate aggregate holdings of the household sector residually, by subtracting the holdings of other sectors that report their holdings directly from the outstanding totals for a given asset. The Financial Accounts include the “Enhanced Financial Accounts,” which include the Distributional Financial Accounts and reporting on “Equity Issuance and Retirement” by nonfinancial businesses 5 .
The Distributional Financial Accounts is a relatively new data source that synthesizes survey findings from the SCF with the quarterly Financial Accounts to produce a more detailed snapshot of net worth (see Batty et al. (2019) for full technical documentation of the DFA). This article uses the DFA's reporting of household holdings of corporate equity by race and ethnicity. For the purposes of this article, it is important to clarify some differences in how the SCF and DFA report household holdings of corporate stock, due to the reality that increasingly, asset managers hold legal title to corporate equity while households are the economic beneficiaries of the stock's increase in value (Braun, 2021). For directly-held stock and mutual funds, which are reported by households in the SCF straightforwardly, those holdings are assigned to the category “corporate equity and mutual fund holdings” in the DFA. Directly-held mutual funds may include non-equity components, but this breakdown is not reported. However, for pooled accounts, which includes the retirement assets that households hold separately from their employer, such as IRAs, as well as trusts, and managed investment accounts, which are reported as a unified financial asset category in the SCF, the DFA assigns the portion of the account held as equity to the “corporate equity and mutual fund holdings” category, while the interest-bearing component is categorized separately 6 . Thus this category in the DFA describes the corporate equity that households have economic ownership of separately from their employer.
The Financial Accounts category and Distributional Financial Accounts category “Pension Entitlements” includes defined benefit (DB) plans, in which benefits will be paid in the future; annuities sold by life insurance companies, and the balances of defined contribution (DC) plans (such as 401(k) and 403(b) plans (Batty et al., 2019). The SCF does not directly measure accrued DB benefits or annuities, so the DFA uses data from the Financial Accounts to distribute DB plans and annuities, which comprise 70 percent of the “Pension Entitlements” category. DC plans are, for many households, their only holdings of corporate equity, if they remain with a single employer (when switching employers, individuals are generally required to roll over their 401(k) or 403(b) holdings to an IRA account, which is included in the DFA “corporate equity and mutual funds” category). The DFA reports that DC plans comprise approximately thirty percent of the category “Pension Entitlements,” but does not provide any data of what proportion of this thirty percent is corporate equity versus other types of financial instruments. For this reason, the “Pension Entitlements” category is excluded from the discussion of the distributional impacts of corporate equity holdings in the remainder of this article.
The racial wealth gap in corporate equity ownership is wide and persistent 7 . As of the third quarter of 2019, 89.3 percent of corporate equity and mutual fund value held by US households was owned by white households (while they are 65 percent of households in the Federal Reserve data). At the same time, Black households owned between 1 and 1.3 percent of total corporate equity over the period 1989–2019, while their share of households was between 12 and 14 percent. Hispanic households owned from 0.6 to 1.6 percent of corporate equity, while their share of households fluctuated between 6 and 12 percent.
It is useful to compare the dispersal of corporate equity ownership with overall assets and other key asset classes to household financial security (Chang, 2010). Table 2 presents shares of total assets, corporate equity and mutual funds, and real estate by race and ethnicity, demonstrating that corporate equity and mutual funds has a more unequal distribution as compared to assets overall and real estate. One of the most commonly understood assets that increases the wealth of the non-wealthy is home ownership and increasing home ownership for Black and Hispanic households has been the focus of much public policy. Although Black households owned between 4.6 and 5.6 percent of real estate assets over the sample period, their ownership of corporate equity ranged only from 1 to 1.3 percent. For Hispanics, real estate wealth ranged from 3.6 percent of total household real estate assets to 4.8 percent, while their share of ownership of corporate equity ranged only from 0.6 to 1.6 percent.
Wealth Shares by Race & Ethnicity (not Reporting “Other”) (Representative Quarters).
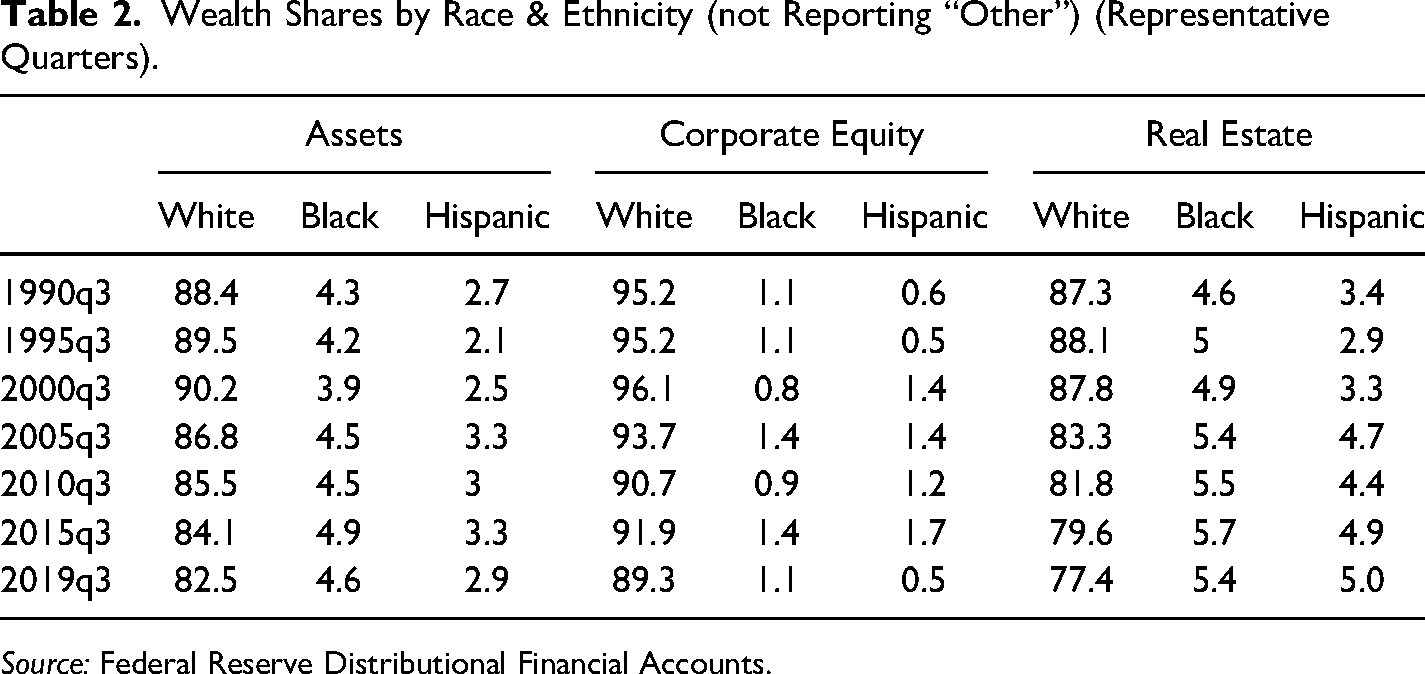
Source: Federal Reserve Distributional Financial Accounts.
Another approach to comparing corporate equity and mutual fund ownership is to look at average dollar holdings by race and ethnicity, though this does allow for skew by a small number of high-ownership households. Table 3 presents average household holdings for total assets, corporate equity and mutual funds, and real estate, comparing households by race and ethnicity 8 (these are assets without subtracting corresponding liabilities, which are also unevenly distributed). This shows that even thirty years later, the dollar value of corporate equity and mutual fund holdings by Black households in 2019 ($20,731) has not even reached the amount held by the average white household in 1990 ($23,267). The dollar holdings of Black households of corporate equity are just seven percent of white households in 2019 ($20,731 for Black households while it is $276,871 for white households); while for Hispanic households, it is fourteen percent ($39,465 for the average Hispanic household vs. $276,871 for the average white household).
Average Household Holding (Total Net Worth; Real Estate; & Corporate Equity) by Race & Ethnicity (not Reporting “Other”).
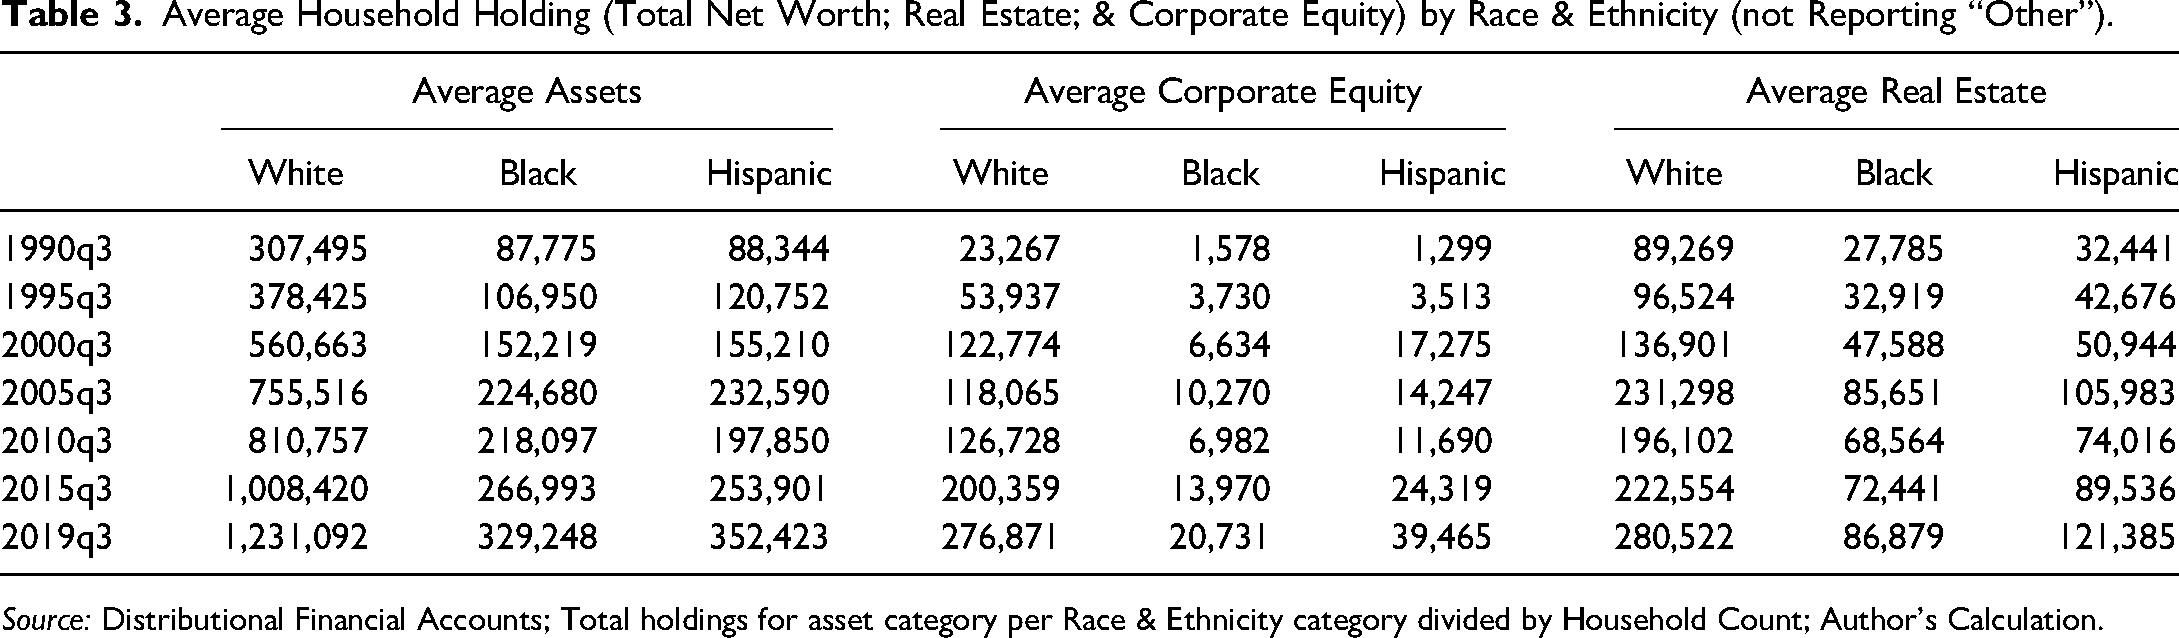
Source: Distributional Financial Accounts; Total holdings for asset category per Race & Ethnicity category divided by Household Count; Author's Calculation.
As noted above, not all corporate equity holdings are captured in the “Corporate Equities and Mutual Funds” DFA category, as some of these financial assets are held in employer pension accounts, both defined contribution and defined benefit. The challenge, as noted above, is that the “Pension Entitlements” category is not disaggregated by financial asset. Still, it is important to note that Pension Entitlements are relatively more equally distributed by race and ethnicity. For example, in 1989, pension entitlements were held 87.8 by white households; 7.3 percent by Black households; and 2.5 by Hispanic households. By 2019 q3, the share of pension entitlements held by Black households had increased to 8.5 percent (while their household share is 14 percent); for Hispanic households, it is just 3.7 percent (white households share had fallen to 78.8 percent while ‘other’ had risen to 8.9 percent). This is likely because the public sector has traditionally disproportionately employed Black workers relative to their share of the population, at the federal, state, and local levels (Cooper & Wolfe, 2020). As public sector workers are more likely to have defined benefit pensions, Black households hold a higher share of Pension Entitlements than of corporate equities. However, even if corporate equities make up part of the financial assets held inside a pension fund, a Black household does not directly benefit from the shareholder payments made in the same way that they would if the shares were directly held.
The contribution of this article is to look more closely at the impact of the disparity in ownership of corporate equity. In addition to the general drivers of the racial wealth gap, there are specific factors that reduce the likelihood that share equity will be part of Black and Hispanic household portfolios, beyond the general fact that having less wealth means a household has fewer resources to direct toward investments. The first of these factors is disparities in pay equity and labor market segmentation for Black and Hispanic workers into low-paid employment, and their higher likelihood of long-term unemployment and dropping out of the labor force. This collection of characteristics makes it more difficult for households to accumulate wealth, as they must spend higher proportions of their income on consumption (more of the literature addressing low-wage employment and shareholder primacy is explored below, although in those studies workers are not disaggregated by race). A second factor is the lower likelihood that Black and Hispanic workers will have employment that offers retirement benefits or employee share ownership (Wolff, 2018). A third factor is that a certain proportion of share ownership is intergenerational, and due to the legacy of structural racism, Black and Hispanic families will have accumulated less equity to transfer. A final issue is the relative (or apparent) risk and cost of investing in equities versus other types of assets, including home ownership or other forms of savings that have less of a potential downside (Wolff, 2018). All of these factors drive down corporate equity ownership for Black and Hispanic households, which means that the corporate governance ideology of shareholder primacy mainly benefits white households.
The Corporate Governance Ideology of Shareholder Primacy
How decisions are made in corporate boardrooms may seem a distant factor in the racial wealth gap and distributional consequences of household wealth. Yet the ideology that drives corporate decision-making—namely, that all other costs must be minimized in order to increase shareholder value—has had an impact on workers and long-term shareholders alike (Ireland, 2005; Lazonick & Shin, 2020). This framework, while contested as a matter of corporate law, is accepted practice and means that corporate executives fear actions by activist investors if they do not consistently raise share prices (Alexander, 2016). The view that shareholders have rights to the profits created through corporate activity, and that costs (including employee costs) should be minimized to increase such profits, is based on the economic theory that a corporation is simply a “nexus of contracts” and that shareholders are the only stakeholder group within the firm taking the kinds of risks that deserve a variable reward (Jensen & Meckling, 1976; Lazonick & O’Sullivan, 2000). In other words, employees, management, and bondholders have a “fixed” contract with a corporation, while shareholders invest with no security of returns. Therefore, they have the best incentive to hold management accountable, as they have the most to gain and the most to lose.
This economic framework is fundamentally flawed in several ways. First, employees, suppliers, and the broader public also take risks in their engagement with the corporation and bear the impact of cost-minimization in the name of maximizing shareholder wealth. Second, household shareholders in practice have largely diversified portfolios and thus have little interest in engaging with management for a given firm; their purchase of equity happens on the secondary market—they buy stock from other shareholders, so their funds never actually reach the corporation itself (Lazonick, 2017). Finally, corporations are businesses with public permission to operate in the form of a public charter, without which they cannot take advantage of the privileges of limited liability and perpetual existence. Because they are important social institutions, in a democratic society, the public permission to operate should come with public accountability to operate in the general public benefit (Palladino, 2019, 2021a). The distributional skew of corporate equity ownership is that, despite arguments that what is good for shareholders is most efficient for society, the benefits of shareholder primacy flow largely to the elite—and mainly white—shareholder class (Ireland, 2005).
Although early 20th-century corporate governance debates focused on the then-contested distinction between corporate ownership and control, as share ownership became dispersed and shareholders no longer played a meaningful role in business decisions, mid-century US corporations had entrenched managers as the key decision-makers, accountable to the development of the business itself and multiple corporate constituencies (O’Sullivan, 2000). Shareholders expected to earn steady dividends by holding corporate equity but did not generally seek to exercise authority vis-à-vis management (Lazonick & Shin, 2020). The rise of institutional investors and the economic stagnation of the 1970s, combined with the intellectual law-and-economics revolution, meant that in the 1980s, managers had to increasingly respond to financial market pressure to raise share prices (Lazonick & Shin, 2020). The transition from a managerial focus on “retain-and-reinvest” to “downsize-and-distribute” has contributed to the stagnation of wages for non-executive workers since the 1980s and widespread outsourcing and fissuring of the US workforce (Lazonick, 2014; Lazonick & Shin, 2020). Unsurprisingly, the shift in focus to maximizing shareholder wealth has meant a steady rise in shareholder payments, as will be discussed further in the next section.
A variety of economic effects flow from shareholder primacy. One is the downward pressure on worker wages and the loss of worker bargaining power for a share of corporate profits, as corporate leaders downsize and outsource to reduce union power and labor costs more generally (Lazonick & O’Sullivan, 2000; Palladino, 2020, 2021b). A second is that shareholder primacy has driven a constant rise in stock market value, even as corporate profits fluctuate and corporate debt increases. Due to expanding shareholder primacy, the stock market is at an all-time high. The S&P 500 Index, considered a benchmark of the state of the capital markets, has been steadily rising, and recovered quickly from the coronavirus-induced crash. Stock buybacks—a practice in which corporations repurchase their own equity on the open market in order to increase the price of remaining shares, without substantive corporate improvements—reached an estimated $800 billion in 2018 (Palladino, 2020, 2021b). This practice will be discussed in more detail below.
The next two sections will examine the impact of rising shareholder primacy and the uneven distribution of equity ownership on the US racial wealth gap. The two analyzes are distinct methods: the first explores differences in who receives shareholder payments—i.e. capital gains from shares sold and dividends—which households can then use for any financial activity; the second compares the gap in dollar value of corporate equity held by different groups to the overall asset gap to show the rising importance of corporate equity to the overall racial wealth gap. However, since there is not sufficient data to determine whether shareholders receiving shareholder payments use those funds to purchase more stock (or in what proportions they do so), there is no direct link posited here between the first analysis of shareholder payments and the second of the proportion of the asset gap that is driven by corporate equity.
Section 3. Shareholder Payments Accruing by Race and Ethnicity
Corporate equity holdings have been, according to the DFAs, “large drivers of wealth concentration” (Batty et al., 2019, p. 28). What has this meant in terms of the use of corporate funds for shareholder payments—that is, to which households are shareholder payments going? Generally, shareholder payments have been rising as a percentage of corporate assets since the 1980s, mainly driven by a rise in the practice of stock buybacks described above, which reached $6.3 trillion in the decade from 2010 to 2019 (Palladino, 2021b). Stock buybacks occur when publicly traded companies repurchase their own shares on the open market with the intent of raising existing share prices, protected from liability for market manipulation of their stock price by Securities and Exchange Commission Rule 10b-18 (Lazonick, 2014; Palladino, 2020). Stock buybacks account for an increasing portion of corporate profits: they averaged 50 percent of corporate profits from 2008 to 2017, and when combined with dividends, averaged 100 percent over the same time period (author's analysis, using S&P Compustat). These rising payments to shareholders are a combined result of deregulation, personal incentives for corporate insiders to use stock buybacks to increase their compensation, and greater pressure from institutional investors (Palladino, 2020). However, they are often justified by the general notion that the United States is a “shareholder democracy,” and everyone benefits from increasing share prices. I examine this claim in the next section.
Data and Methodology
I combine data from the DFAs on corporate equity and mutual fund ownership by race and ethnicity with data from the S&P Compustat database to calculate total shareholder payments flowing from publicly-traded corporations to white, Black, and Hispanic households from 2004 to 2019. S&P Compustat is a private database that aggregates reports that publicly traded companies are required to submit to the Securities and Exchange Commission (Forms 10-Q and 10-K. Forms 10-K (the company's annual report) and 10-Q (the company's quarterly report) give comprehensive summaries of a company's financial performance, including audited financial statements (balance sheets, income statements, and cash flow statements), as well as information on executive compensation and organizational structure. Publicly-traded companies are required to report stock buybacks quarterly on Form 10-Q by reporting the total number of shares repurchased and the average price paid per share 9 . Companies also report dividends paid as part of their financial statements. I combine two variables, corporate dividends and stock buybacks, into one metric called “shareholder payments.” Even though buybacks are more indirect forms of shareholder payment, since they accrue to share-sellers and not to all shareholders, they are an important use of corporate funds deployed in the pursuit of increasing shareholder wealth (Lazonick, 2014).
I combine these variables to find quarterly shareholder payments in nominal dollars. I then use the share of corporate equity and mutual fund ownership by quarter by race and ethnicity to find the total dollars made as shareholder payments to a given racial or ethnic group per quarter. The purpose of this exercise is to demonstrate how the income that accrues based on equity ownership is distributed. Because data on stock buybacks only became available on a quarterly basis in 2004, I use data from 2004–2019 for this analysis.
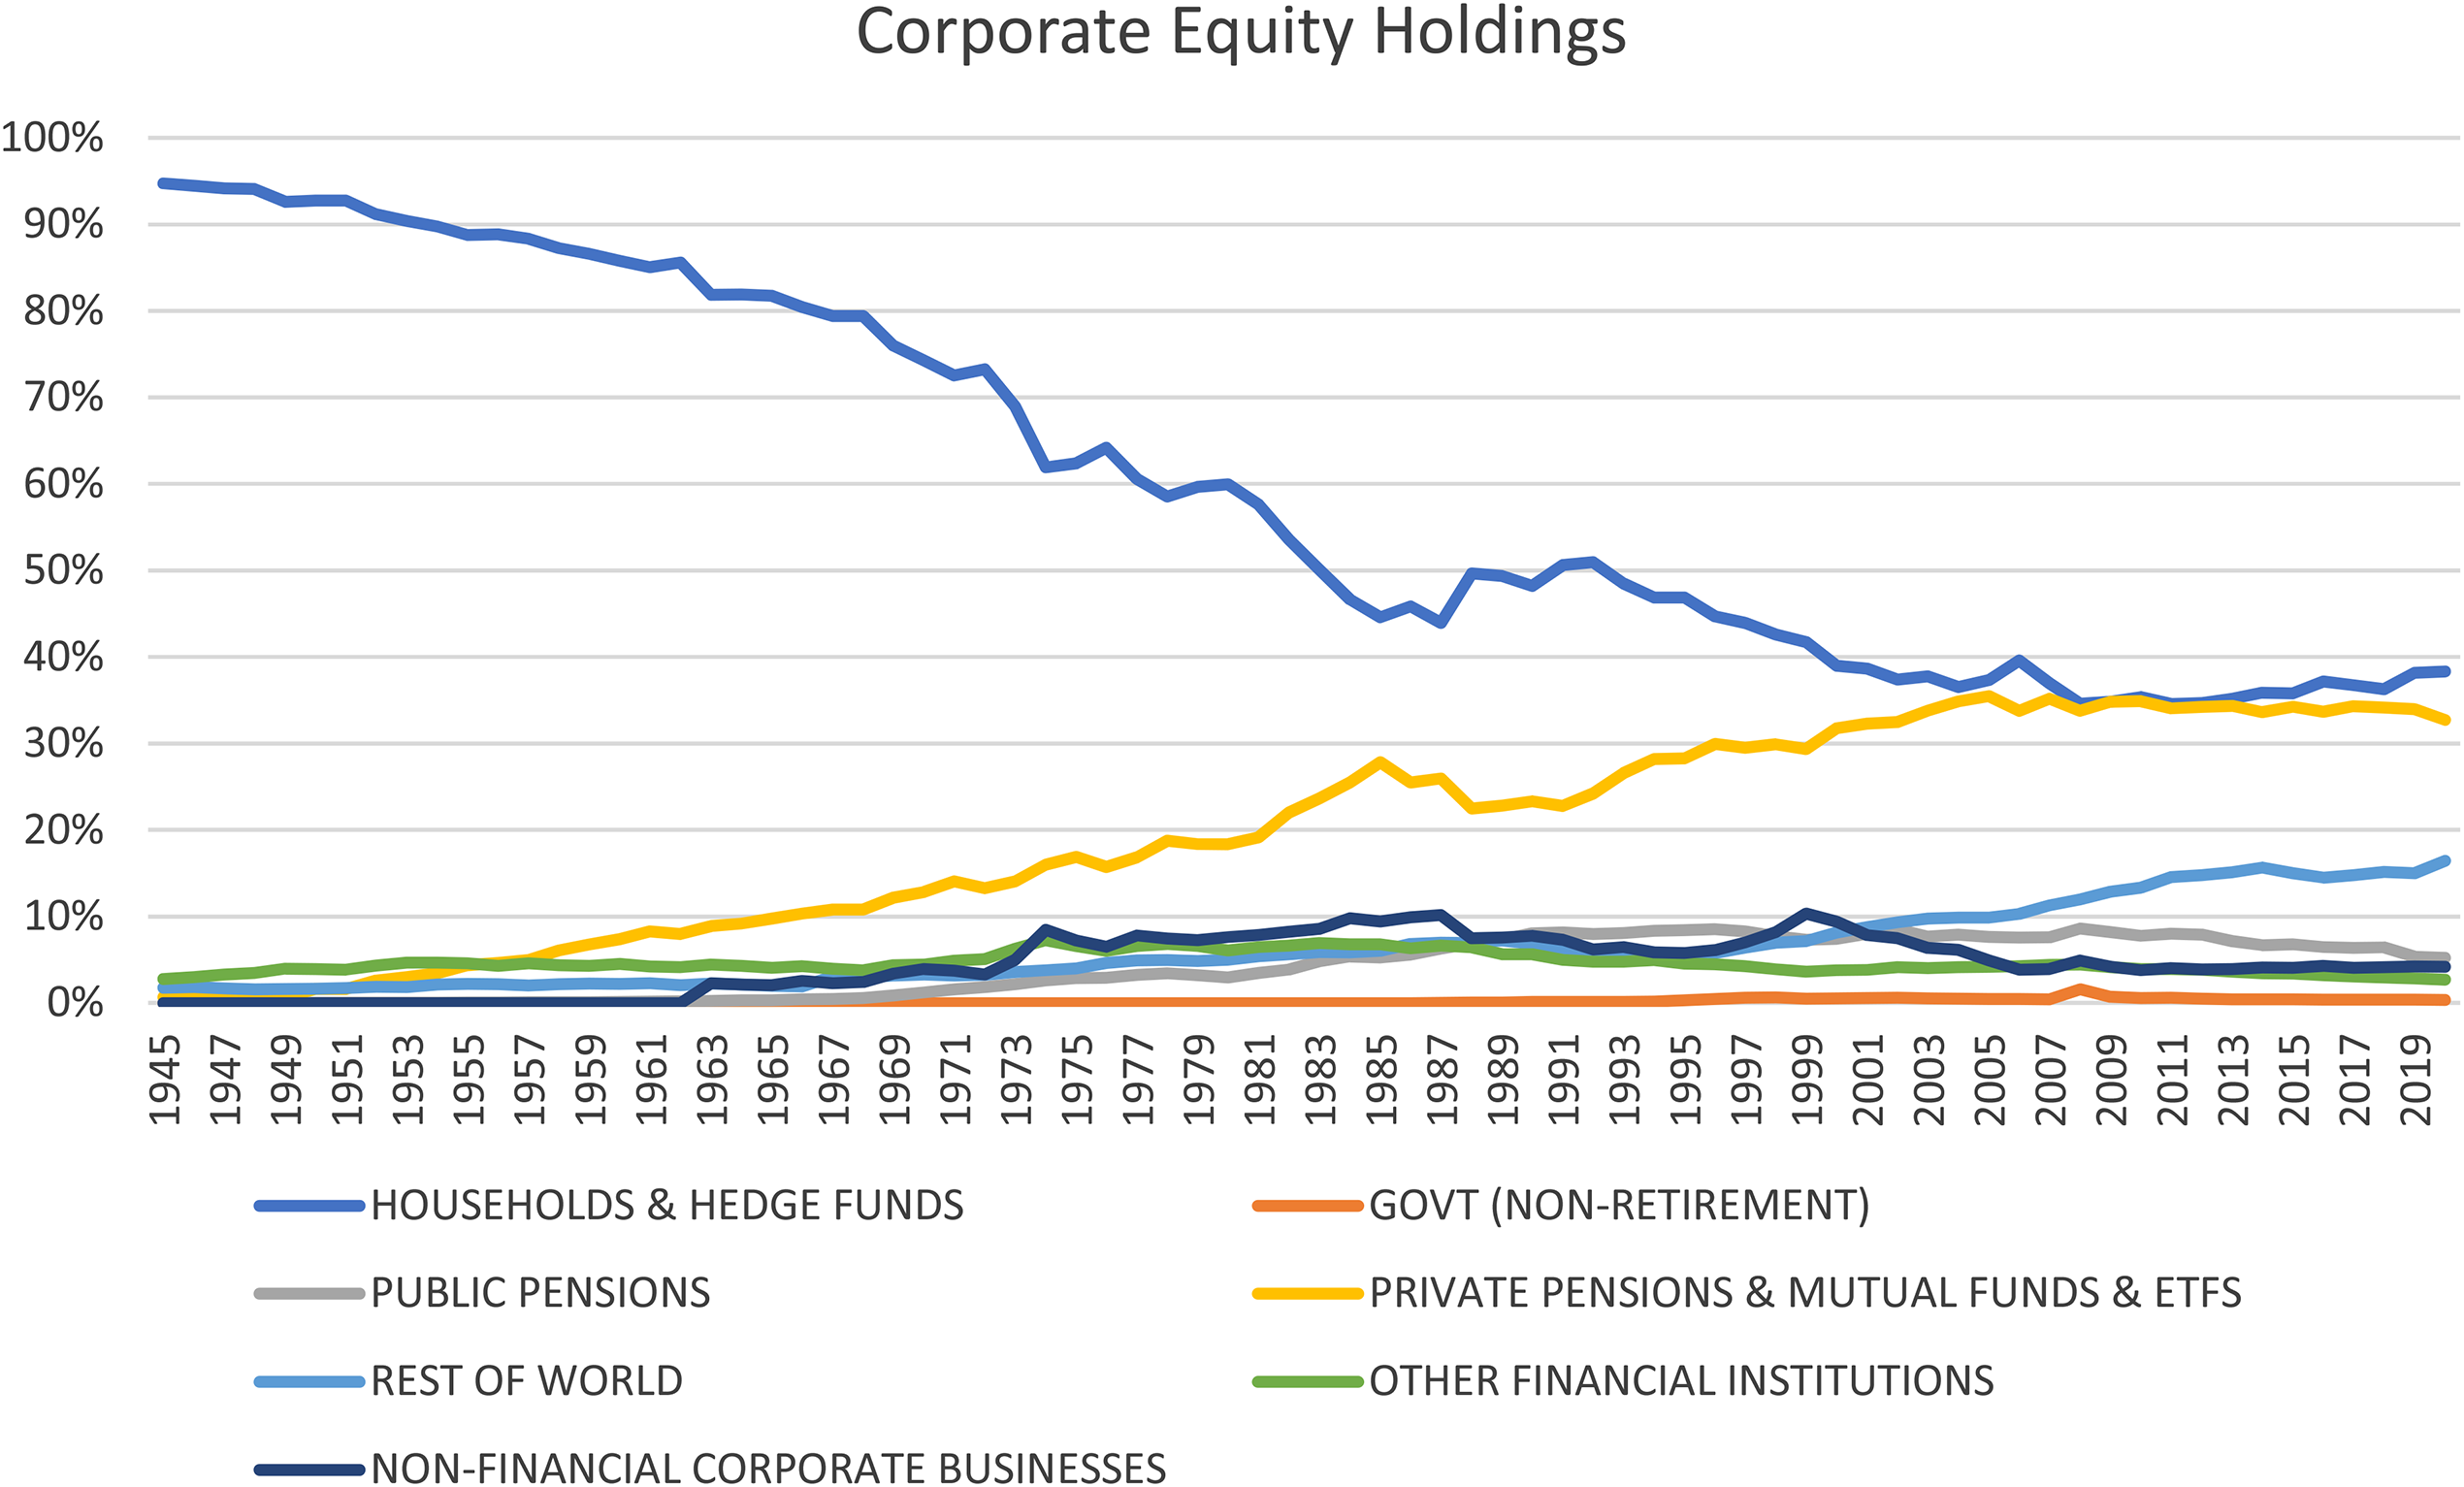
A complication to any analysis of corporate equity holdings is, as discussed above, the rise of asset management, which means that household economic beneficiaries of corporate equity are not the same as the asset managers who hold legal title to the stock, but do not receive the economic benefits (Bebchuk & Hirst, 2019). Data from the Federal Reserve shows the long-term decline in direct holdings by households and the rise of private pensions, mutual funds, and exchange-traded funds (along with foreign holdings). Federal Reserve Financial Accounts of the United States, Table L.223 (“Corporate Equities”).
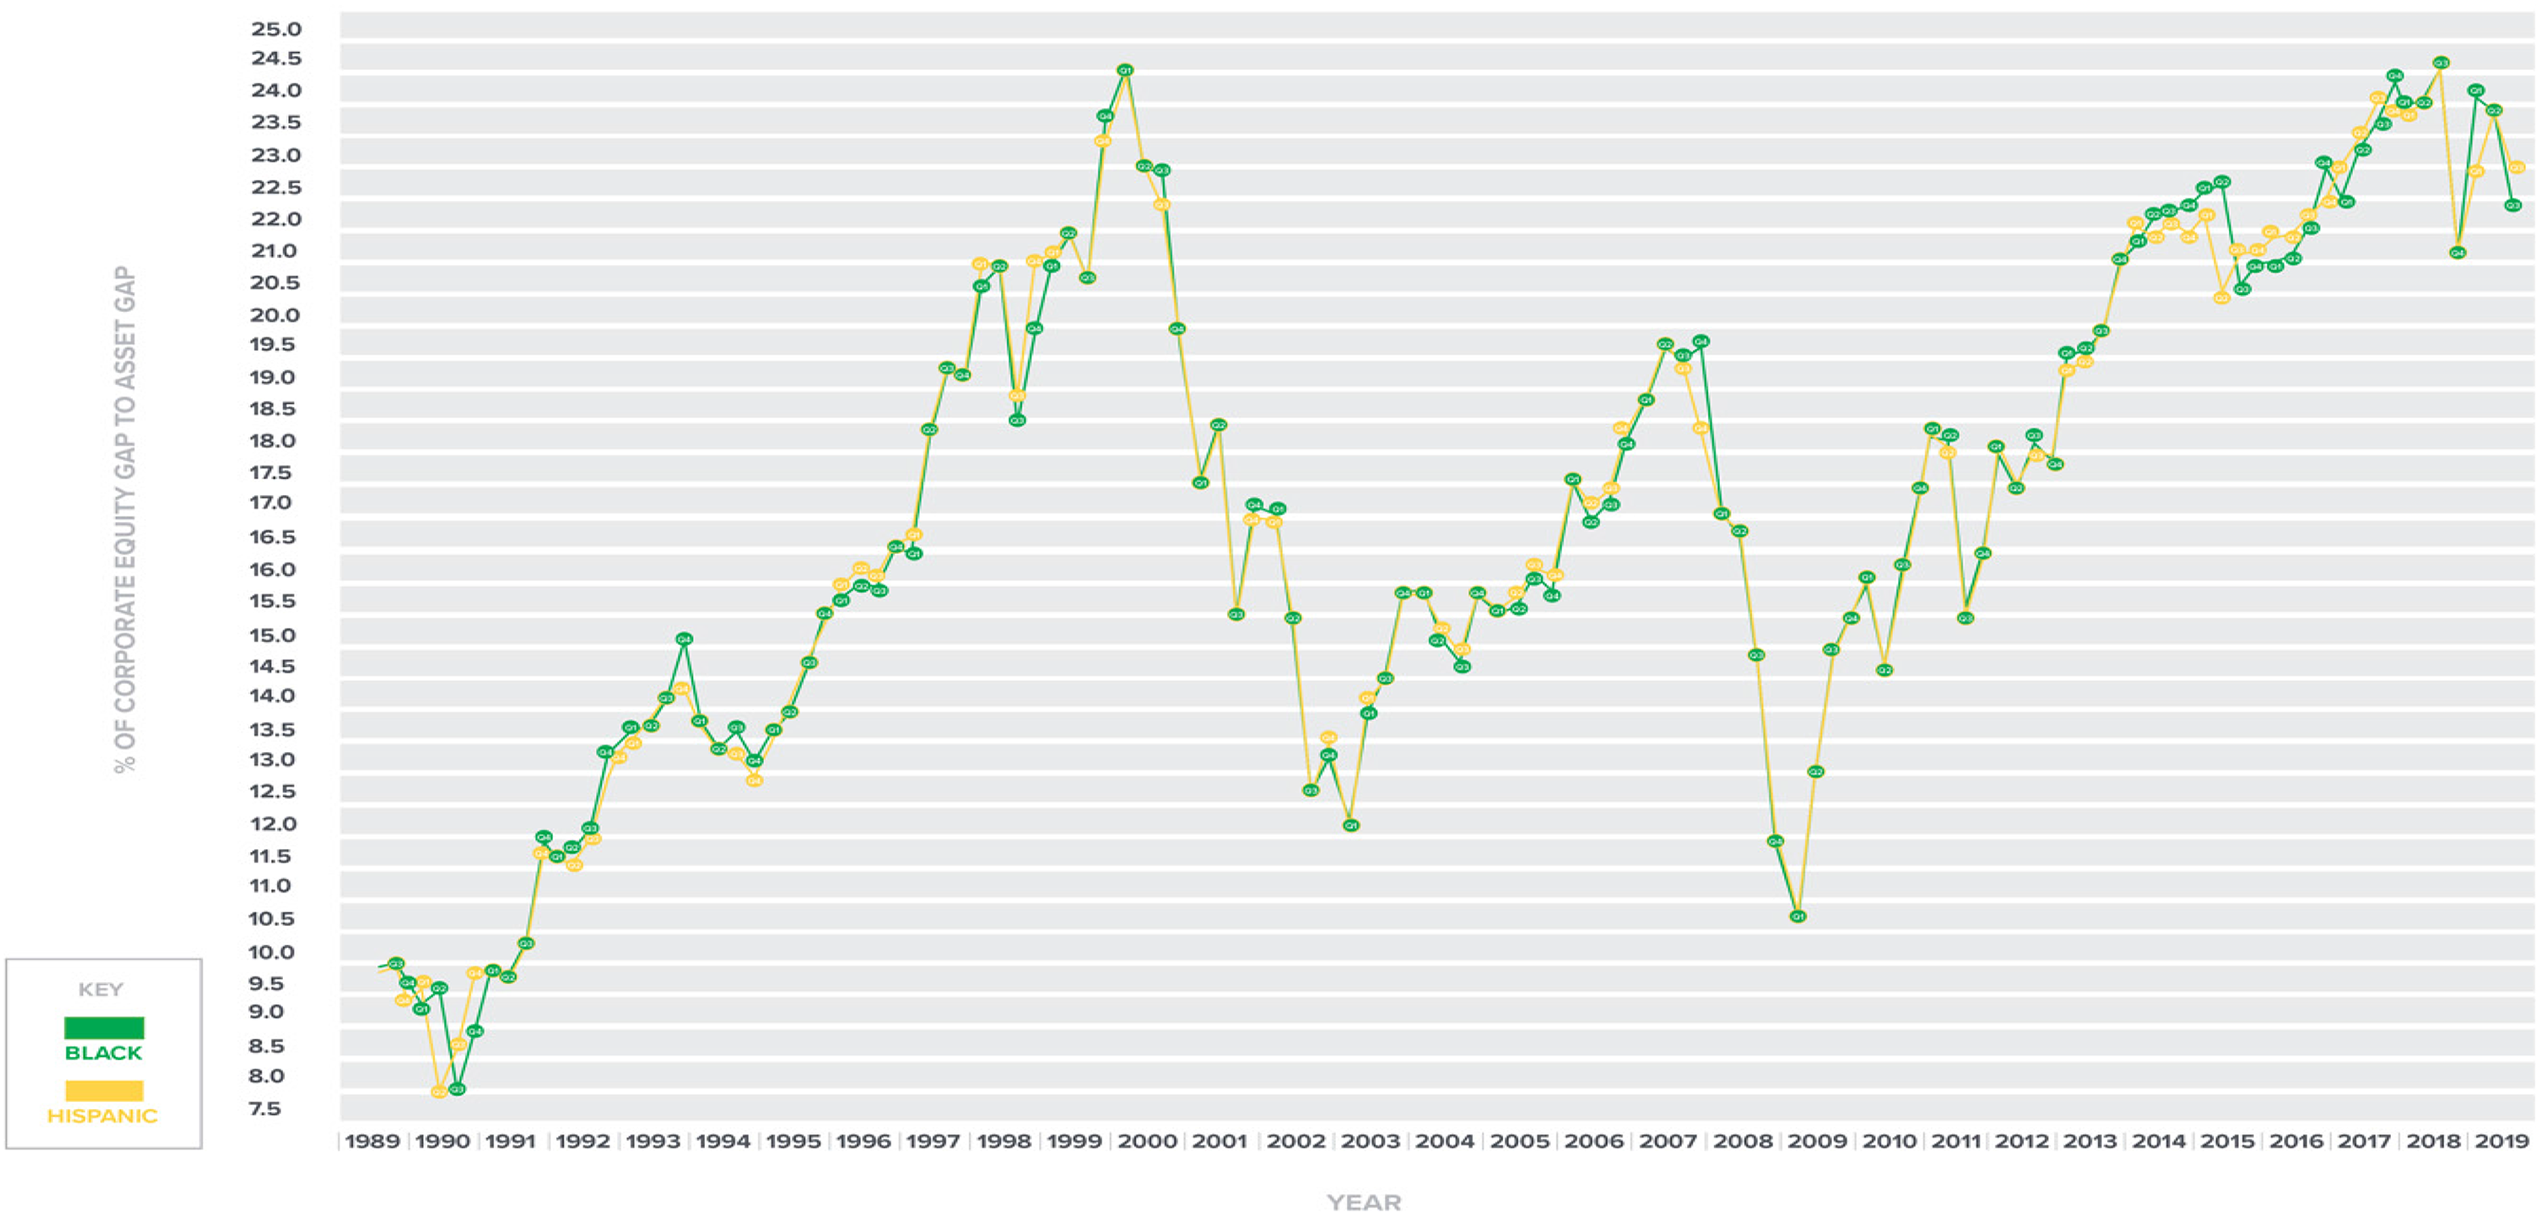
The corporate equity gap by race and ethnicity as a portion of the racial asset gap, 1989-2019. Source: Distributional Financial Accounts.
In this section, because the purpose of the calculation is to express payment flows to shareholders that differ by race and ethnicity, households that are beneficial owners of equity but do not hold legal title cannot be distinguished by race, as the DFA does not clearly distinguish how funds are held (i.e., directly and indirectly). I reduce the shareholder payments earned by the ratio of household ownership of corporate equity to total corporate equity assets for that quarter, which ranged between 34 and 39 percent over the 15-year period (Federal Reserve Financial Accounts Table L.223). This will undercount household assets that are held by institutional investors who invest directly with portfolio companies; due to the rise of institutional investors, more and more household equity is held indirectly (Bebchuk & Hirst, 2019). However, the focus here is on the distribution of shareholder payments among households by race and ethnicity; including additional categories, such as mutual funds, as part of the analysis would increase the dollars that are assumed to households, but do not change the ratio.
Results
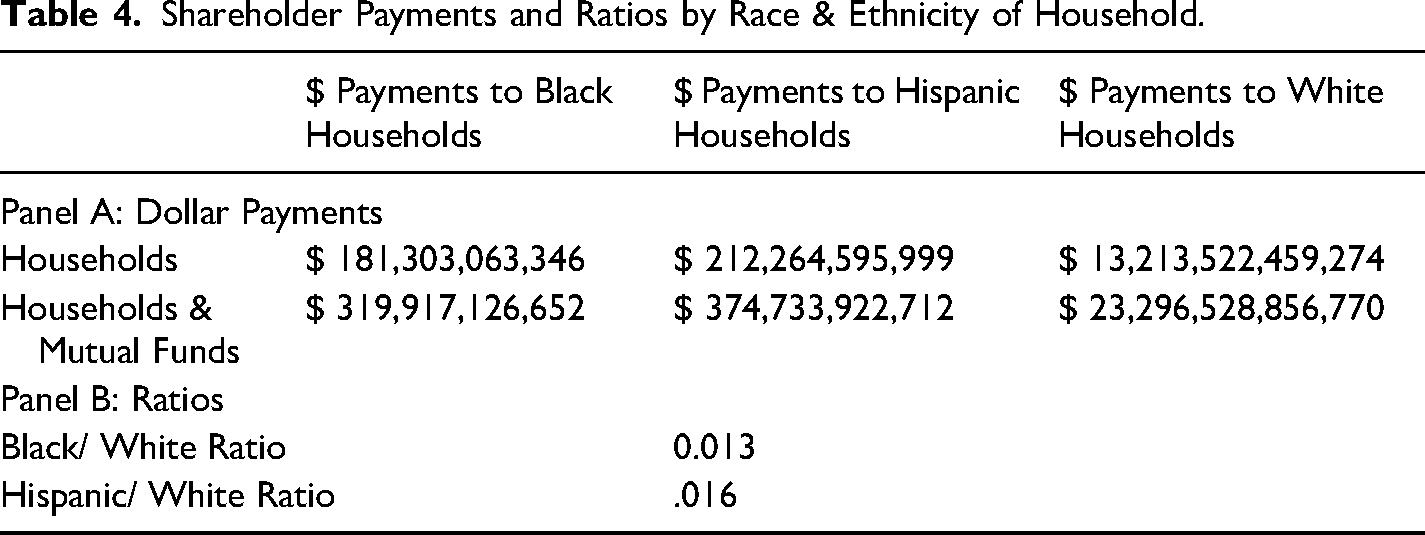
Total shareholder payments over this period, made to shareholders of publicly-traded companies, total $39 trillion, which includes $8.9 trillion spent on open-market share repurchases and $30.6 trillion spent on dividends. When reduced by the percentage of corporate equity held by households according to the Federal Reserve in a given quarter (averaging 36 percent), this results in total shareholder payments of $14 trillion (or $25 trillion if including corporate equity held by households and mutual funds 10 ). Total shareholder payments made to white households during that time frame totaled $13 trillion (again, focusing on the portion of overall corporate equity that households hold), while $181 billion went to Black households and $212 billion to Hispanic households. This results in a Black-white ratio of 0.013 and a Hispanic-white ratio of 0.016 for total shareholder payments made over the period from Q1 2004 to Q2 2019. If shareholder payments are allocated among households based on the portion of corporate equity held by households and mutual funds, the ratios remain the same. In this case, though, $319 billion in shareholder payments would be allocated to Black households, $374 billion to Hispanic households, and $23 trillion to white households.
This measure gives a clear sense that shareholder payments, in the form of corporate dividends and stock buybacks, are flowing disproportionately to white households. As total shareholder payments topped $1 trillion in six different quarters since 2013, this prioritization of shareholder payments by corporate leaders shows one of the major effects of the gap by race and ethnicity in corporate equity ownership. The full results are presented in the Appendix.
Section 4. Contribution of Corporate Equity Ownership to the Racial Wealth Gap: Has It Risen Over Time?
In this section, I examine the portion of the overall racial wealth gap that is a result of the gap in corporate equity and mutual fund ownership, finding that its contribution has risen over the past 30 years. This suggests that the disproportionate holdings of corporate equity by white households, combined with the increased attention to shareholder value by corporate leadership, are increasingly important when analyzing the US racial wealth gap. Though the gap is not directly due to the disparity in shareholder payments described above, as it cannot be stated with any certainty whether shareholder payments result in more shareholding, it is useful to look in this section at the importance of corporate equity as an asset class relative to the overall gap in asset by race and ethnicity.
Data and Methodology
Using the Federal Reserve's Distributional Financial Accounts data on the dollar levels of wealth by race and ethnicity allows calculations of how the gap between Black and white corporate equity and mutual fund wealth has contributed to the overall racial wealth gap over time. First, I calculate the assets gap between Black and white households and Hispanic and white households in nominal dollars for a given quarter, as reported by the DFAs. Next, I calculate the dollar gap for the same period in the specific wealth category of corporate equities and mutual funds. Finally, I calculate the percentage that the corporate equities gap represents of the total assets gap for a given quarter, in order to understand how corporate equities as an asset class have contributed to the racial wealth gap over time. I focus exclusively on assets, as the changing ownership of corporate equity does not affect the liabilities side of a net worth analysis.
Contribution of Corporate Equity to the Racial Asset Gap
I find that the contribution of ownership of corporate equities to the racial wealth gap has grown over time, even as levels of corporate equity ownership have grown overall. In the third quarter of 1989, the first quarter for which data are available, the corporate equity ownership gap between Black and white households was $1.95 trillion, and the gap between Hispanic and white households was $1.96 trillion. As the overall asset gap was $20 trillion, the contribution of corporate equity disparity to the racial wealth asset gap for each of these types of households was 9.73 percent.
This ratio has climbed steadily since then. By 1995, the ratio of the corporate equity gap to the racial wealth asset gap had reached 15 percent for both Black and Hispanic households, with a corporate equity gap of $4.4 trillion and an asset gap of $28.5 trillion for Black-white households; and $4.5 trillion and $29.1 trillion for Hispanic households. For Black households, the ratio first passed 20 percent in 1998, fell to a low of 12 percent in 2003, and has remained above 20 percent since 2013; it has followed a similar trajectory for Hispanic households. Although Black families now own $378 billion in corporate equities and mutual funds, and Hispanic families own $487 billion, white households now own $23 trillion. The contribution of corporate equity ownership to the racial wealth gap for Black and Hispanic households had increased to 23 percent in 2019, a sharp increase from 10 percent 30 years ago. This comparison over time shows the importance of shareholder primacy to maintaining the racial asset gap. Results from representative quarters, at five-year intervals, are presented in Table 4.
Shareholder Payments and Ratios by Race & Ethnicity of Household.
Although the corporate equity gap as a proportion of the racial wealth gap has risen over the past 30 years, there have been reversals, particularly during the financial crisis and subsequent Great Recession of 2007–2010. The equity-total gap fell from 17.25 percent and 16.93 percent in 2008 q1 for Black and Hispanic households, respectively, to 10.71 percent and 10.57 percent by the first quarter of 2009. This was driven by a decline in the total asset gap, which fell 11 percent, while the corporate equity gap fell by only 4 percent (as the dramatic fall in household assets was most marked in the housing sector). The equity-gap percentage was back to 18.44 percent and 18.07 percent for Black and Hispanic households by the first quarter of 2011, and has stayed above 20 percent since 2013, in line with the recovery and subsequent consistent climb of the stock market, in contrast to the slower recovery in home ownership value. The swing in importance of corporate equity to the racial wealth gap around the Great Recession affirms the point that disparities in corporate equity ownership by household race and ethnicity may have different impacts on the overall racial wealth gap than other asset classes, including housing.
Percentage of corporate equity Gap to the racial asset Gap.
Corporate Equity Gap as a Percentage of Total Racial Wealth Gap, Representative Years.
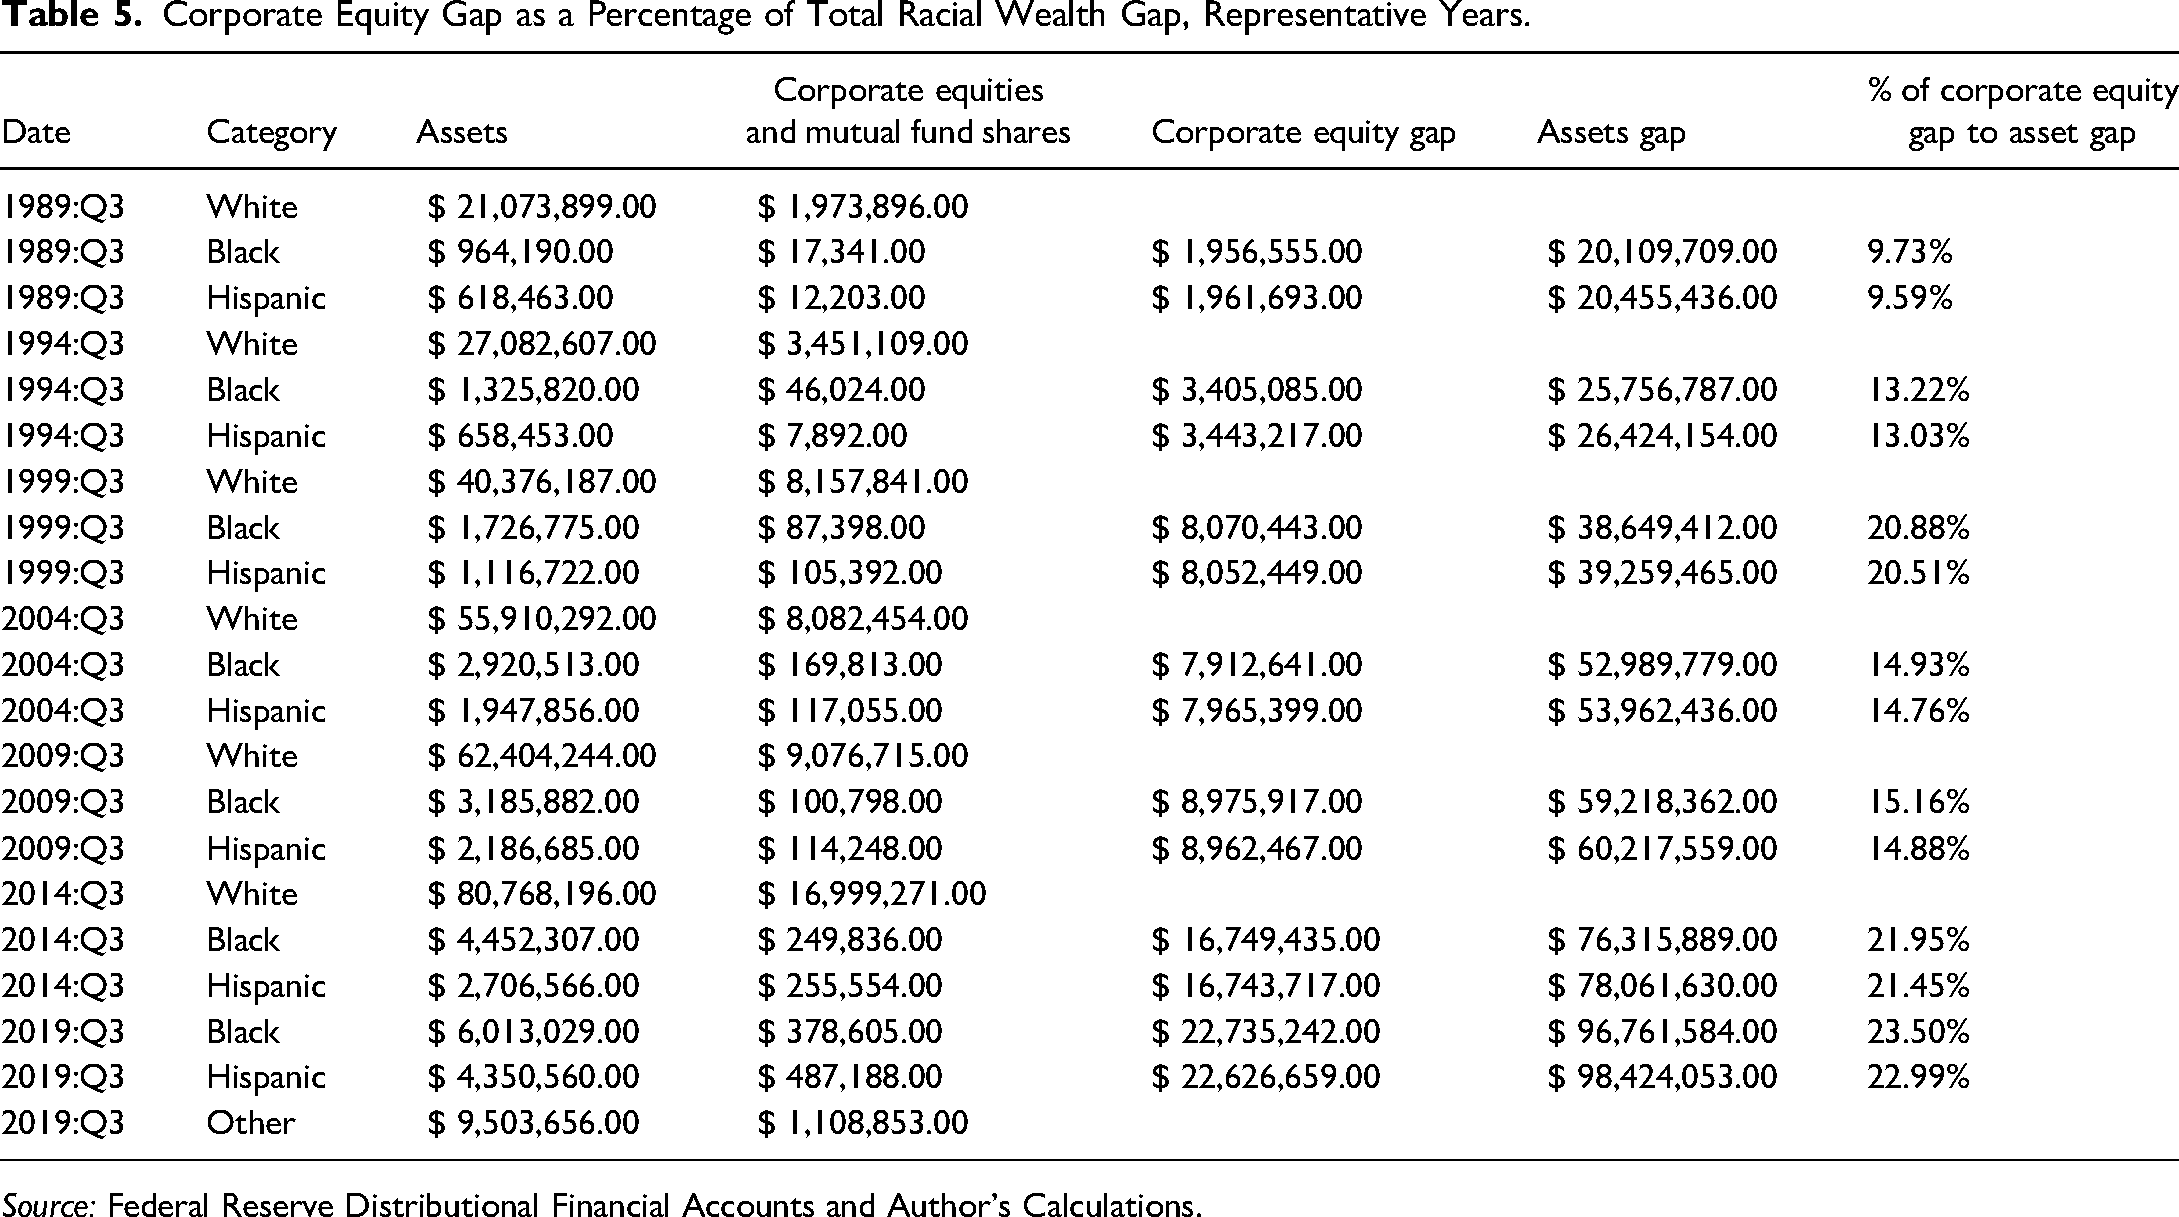
Source: Federal Reserve Distributional Financial Accounts and Author's Calculations.
Section 5. Policy Recommendations
Moving toward wealth equity in the United States will require different policies targeted to the various drivers of wealth disparities, including policies that reduce the ability of the wealthiest households to capture the majority of value produced by corporations at the expense of that corporation's workforce; build wealth assets for households of color; fairly tax the wealthiest households and capital ownership; and curb the wealth-stripping mechanisms that disproportionately impact families of color (Darity et al., 2018; Price, 2020).
This article has focused on just one of the many interwoven mechanisms at play: the focus inside the largest US corporations on increasing shareholder wealth at the expense of other productive uses of corporate funds, including labor compensation. Although roughly 30 percent of Black and Latinx households own some stock, the total dollar value of their holdings is not even 5 percent of total outstanding equity in taxable accounts. Thus the focus on increasing shareholder wealth by corporate managers, accompanied by the squeezing of labor compensation, means that undoing shareholder primacy must be part of the strategy toward racial equity.
Shareholder primacy is a policy choice: US policymakers can choose to reform corporate and securities laws to shift corporations toward balancing the interests of multiple stakeholders, allowing shareholders to earn a fair return while reducing the ability of share-traders to earn gains from speculation and financial practices that reduce innovation (Lazonick & Shin, 2020; Palladino, 2021a.) A broad literature discusses strategies to increase worker power through collective bargaining rights. The focus in this section is on two additional areas of policy reform: moving corporate governance away from shareholder primacy and toward governance by stakeholders, in order to reduce the flow of corporate profits to wealthy white shareholders; and substantive policy reforms directed at partially equalizing capital ownership.
Policies to end shareholder primacy in corporate governance include reframing the purpose of the corporation to operate in the general public benefit; reforming the fiduciary duty of boards of directors so that they are responsible for considering the impact of their decisions on all stakeholders, including the broader public and community, employees, suppliers, and customers (which means that the costs of doing business cannot be transferred to these stakeholder groups in the name of increasing shareholder wealth); and including key stakeholders—first among equals, employees—in governance and board participation (Jacoby, 2001; Palladino, 2021a). Corporate charters can require corporations to operate for the general public benefit, and can require corporate directors to take into account the impact of their decisions on all corporate stakeholders. This is the approach taken by benefit corporations, and prevents directors from justifying actions that have a negative impact on some stakeholders for the sake of improving share prices (Alexander, 2018). Employees participate in corporate board decision-making throughout Europe, and this system of “co-determination” has been found to have positive impacts on inequality and innovation (Jager et al., 2019). In order to create accountability for corporate directors, large corporations should be required to obtain a federal corporate charter in addition to their state charter so that federal agencies can regulate compliance: this is the approach taken in Senator Elizabeth Warren's Accountable Capitalism Act.
A second set of policies that would move corporations away from shareholder primacy places limits on stock buybacks and executive compensation, and reforms tax policy. First, stock buybacks should be curbed or limited (Lazonick, 2014; Lazonick & O’Sullivan, 2000; Lazonick & Shin, 2020; Palladino, 2020, 2021b). Second, executive compensation should no longer be tied to short-term share prices—a practice that has given executives outsized personal interest in increasing shareholder wealth in the short-run at the expense of long-term corporate productivity and innovation (Lazonick, 2019). Finally, tax policy should be reformed to increase the length of time that equity must be held to disincentivize short-termism; furthermore, capital gains taxation should be reformed so that income from capital is taxed in the same manner as income from labor; a wealth tax should be instituted; and a financial transaction tax can dampen speculative transaction activity (Piketty, 2020).
Another area for reform is to attempt to make wealth more equitable through grants of financial assets targeted to communities of color. One general approach is to ensure that future generations are endowed with universal capital accounts (Darity & Hamilton, 2012; Piketty, 2020). Darity and Hamilton propose “baby bonds” as a clear mechanism to build wealth for young people born to economically disenfranchised families, who are disproportionately in households of color, though corporate equities would not necessarily be part of the asset allocation of the baby bonds grants (Darity & Hamilton, 2012). Considering financial markets specifically, the establishment of public investment accounts and a public investment platform could democratize access to equity capital (Palladino, 2021a). Public investment accounts—which are similar to (and inspired by) the “baby bonds” proposal—are a mechanism to redress structural racism and its impact on intergenerational wealth transmission by engaging public funds in grants of equity to individuals based on household net worth. A public investment platform would create a public mechanism for capital market activity. Both proposals seek to transform equity ownership into a mechanism for shared prosperity. A related policy intervention would be to establish employee ownership funds, or mandatory shared employee ownership trusts that grant employees as a group the right to dividends declared and a voice in corporate governance (Gowan & Lawrence, 2019). However, without affirmative steps to reduce wealth concentration at the top and to empower workers and other corporate stakeholders, widening equity ownership may serve to reinforce, rather than reduce, shareholder primacy, though it might serve to reduce wealth inequality.
Ending shareholder primacy through new federal corporate laws would reduce the racial wealth gap in two ways: reducing the ability of white, wealthy households to act as share-sellers and capture short-term gains that increase the wealth at the top; and restructuring bargaining power inside publicly-traded corporations so that non-executive employees, who are disproportionately from Black and Latinx households, can hold corporate equity in retirement accounts or employee equity trusts, thus participating in the wealth gains that accrue from equity ownership. An increase in employee power would also indirectly affect the racial wealth gap by enabling Black and Latinx households to accrue increased savings and labor compensation.
In addition to policies that combat the contribution of shareholder primacy to the racial wealth gap, there are many policy proposals that address racial wealth inequities more broadly (for a useful summary, see Darity et al., 2018; Price, 2020). Darity and Mullen propose economic reparations to US descendants of slavery (Darity & Mullen, 2020). Policies that range from reducing predatory lending to improving access to home ownership, ending labor market discrimination, and reforming the criminal justice system are all deserving of adoption. It is critical that policy solutions do not continue the “neoliberal disclosure by upholding personal responsibility narratives and strategies of entrepreneurial liberation and other fallacies” (Price, 2020). True solutions require addressing root causes—stemming from hundreds of years of white gain at the direct expense of people of color—and undoing entrenched neoliberal economic theory and policymaking.
Section 6. Conclusion
This article seeks to draw out the connection between the corporate governance ideology of shareholder primacy and the racial wealth gap between American households. I first summarize the range of factors, described in a rich body of literature, that cause unequal ownership of corporate equity and mutual funds: the legacy of structural racism and discrimination that caused wealth to be concentrated among white households (Darity et al., 2018; Darity & Hamilton, 2012; Price, 2020). While wealth in the United States is deeply stratified by race and ethnicity, ownership of the specific asset of corporate equity is even more starkly stratified. I discuss the harms of shareholder primacy, in which the drive to increase shareholder wealth occurs in part through downward pressure on labor compensation and employment, which disproportionately affects workers of color, who are concentrated in low-wage employment. Shareholder primacy thus affects Black and Latinx household wealth in two directions: channeling corporate earnings to the wealthy white households who are the disproportionate holders of corporate equity and cutting the workforce and holding down compensation growth in order to increase shareholder payments.
The article provides an original analysis of the contribution of shareholder primacy to the racial wealth gap by utilizing the Federal Reserve's Distributional Financial Accounts to examine the flow of shareholder payments by household race or ethnicity and the impact of the gap in corporate equity and mutual fund ownership on the total racial wealth gap. Regarding the flow of shareholder payments (in the form of dividends and stock buybacks), I look specifically at payments made by publicly traded corporations that are reported in their 10-K and 10-Q disclosure forms. I find a Black-white ratio of 0.013 and a Hispanic-white ratio of 0.016 for total shareholder payments made over the period from Q1 2004 to Q2 2019. I then look at the corporate equity gap as a proportion of the overall gap in households’ assets by race and ethnicity and find that the contribution of corporate equity ownership to the racial wealth gap for Black and Hispanic households increased to 23 percent in 2019, a sharp increase from roughly 10 percent 30 years previous.
These findings mean that one of the many strategies to move toward wealth equity must be to combat shareholder primacy, which rewards wealthy white households with the gains created through a workforce that includes low-wage Black and Latinx workers. The orientation of corporate leaders toward increasing the wealth of shareholders is a policy choice. Corporate and securities laws can be reformed: policymakers can change the balance of power inside corporate governance by placing an affirmative duty on corporate leaders to consider the impact of their decisions on multiple stakeholders, include stakeholders—like employees—on the corporate board, and require large corporations to charter federally in order to enforce such duties (Palladino, 2019, 2021a). Policies to curb corporate power and ensure that corporate value is shared by those who create it are a necessary but insufficient solution to the systems that perpetuate racial wealth inequities.
Footnotes
Declaration of Conflicting Interests
The author(s) declared no potential conflicts of interest with respect to the research, authorship, and/or publication of this article.
Funding
The author(s) disclosed receipt of the following financial support for the research, authorship, and/or publication of this article: This work was supported by the Kellogg Foundation,