
Abstract
Public attention has focused on especially Black Housing Choice Voucher Recipients’ (HCVRs) residential mobility and whether and to what extent crime is influenced as a result. This paper adds to the growing empirical literature on this question by focusing on the race of HCVRs and examining whether changes in Black HCVRs presence in suburban areas over time is followed by changes in crime rates among the 100 largest metropolitan areas in the country. Multiple data sources are used to examine this question including data on voucher holders from the U.S. Department of Housing and Urban Development's (HUD) Picture of Subsidized Housing, on crime from the Uniform Crime Report (UCR) Offenses Known and Cleared by Arrest compiled by the FBI, and on important demographic data from the Census Bureau. First difference regression methods as well as lead and lag dependent (and independent) variable analysis, among other methods, are used to assess whether Black HCVRs influence crime in suburban areas. The results of the analysis indicate no support for the Black HCVRs – suburban crime hypothesis, consistent with previous research. The evidence indicates positive, statistically significant relationships between White HCVRs and suburban crime. However, lead and lag analysis suggests the relationship is not causal. If anything, the evidence points to White HCVRs moving to suburban areas where crime is increasing. Fears of increased crime resulting from increased presence of HCVRs are therefore not well supported by the studies’ results, and should allay any concerns about unintended crime costs of the HCV program.
Introduction
The question of whether Housing Choice Voucher Recipients (HCVRs) cause crime is a central debate in urban affairs in recent years. This is partly because changes in the Housing Choice Voucher (HCV) program that relaxed where HCVs can be used led to expansion in the types of neighborhoods to which recipients search for and rent housing. The HCV program is the largest federal rental assistance program, serving a little over 2 million low-income households. 1 Prior to the mid1990s, it was extremely difficult for HCVRs (or at the time Section 8 recipients) to use the certificate/voucher anywhere other than in the jurisdiction of the issuing housing authority, resulting in the concentration of recipients living in mostly racially segregated, central city neighborhoods that were also economically disadvantaged (Wallace et al., 1981). However, during the 1990s, the Department of Housing and Urban Development (HUD) implemented a number of policy changes that affected the locational choices of HCV recipients, thereby influencing recipients moves across the broader metropolitan area including to the suburbs (Covington et al., 2011). 2
As HCVRs move to new neighborhoods, a number of claims through mostly journalistic accounts have been leveled that they cause crime in doing so. The most important of these is arguably Rosin (2008) whose Atlantic Magazine article “American Murder Mystery” implicates the HCV program (as well as all other HUD subsidized housing programs) as a source of crime increases in Memphis, Tennessee as a result of low-income households using vouchers to move into previously safer neighborhoods. In addition, the New York Times reported on the Los Angeles bedroom suburban cities of Lancaster's and Palmdale's claim that their cities were increasingly the dumping ground of the county's poor as a result of the increased presence of HCVRs there, and were suffering as a result partly in the form of higher crime (Medina, 2011). 3 Moreover, in a Wall Street Journal commentary entitled "Raising Hell in Subsided Housing," Bovard (2011) charges that HUDs subsidized housing programs, including the HCV program, ruin neighborhoods by increasing crime, among other factors.
Race is an underlying if not explicit theme in these narratives. In all accounts, claims that HCVRs are causing crime follow mostly Black HCVRs moves into mostly White suburban areas. Yet, the extant literature on whether HCVRs cause crime fails to examine these relationships by race of the HCVR and the racial concentration of the neighborhood (Ellen et al., 2012; Hendey et al., 2016; Lens, 2014; Mast & Wilson, 2013; Van Zandt & Mihatre, 2013). With a few exceptions (Hendey et al., 2016 for property crime; Mast & Wilson, 2013), much of the existing research finds little evidence that HCVRs as a whole cause crime (Ellen et al., 2012; Lens, 2014; Van Zandt & Mihatre, 2013). Despite this, there is no direct evidence on whether Black HCVRs cause crime, especially when they move to predominantly White suburbs.
This paper examines whether Black HCVRs moves into mostly White suburban areas increases crime rates among the 100 largest metropolitan areas in the country. This study adds to the literature in important ways. First, it provides direct evidence on the claim that Black HCVRs cause crime, in particular in those areas where they are more likely to be noticed, i.e., in predominantly White suburbs. Second, it includes places among the largest 100 metropolitan areas, thus improving on questions of external validity relative to previous work. Since arguably the influence of HCVRs on crime could vary by city or place characteristics such as size, studies that are limited in the number of areas included in the analysis are also limited in producing more, generalizable estimates of the potential connection between HCVRs and crime. Third, it attempts to gain insight on causality by examining lags of crime rate changes and leads of HCVR changes.
Can Housing Voucher Recipients Cause Crime?
To start, the answer to the general question of whether HCVRs cause crime is theoretically ambiguous. On the one hand, there are a number of plausible factors that could link HCVRs to increased crime, and these factors may be more relevant for Black HCVRs because they tend to live in disproportionately impoverished and predominantly minority neighborhoods. Among these, economists and sociologists decades ago developed and tested hypotheses on the link between poverty (required for HCV eligibility) and crime (Becker, 1968; Merton, 1938). Both approaches predict that poor individuals, of whom a disproportionate share are Black, will be more likely to commit crimes. This is because there are expected income benefits from crime relative to that from legal work, accounting for the risk of incarceration and other criminal penalties or of injury and possibly death. Crime in high poverty areas, where HCVRs and Blacks are more likely to live, is therefore expected to be higher there than elsewhere.
Empirical studies have validated the connection between family income and criminal activity (Bjerk, 2007; Hsieh & Pugh, 1993). Many studies have also found a relationship between the poverty rate in a neighborhood and the crime rate (Hannon, 2002; Krivo & Peterson, 1996; Stults, 2010). In concert, these causal factors may create a situation whereby the expected number of crimes committed by members of the new HCV-holding household will exceed that committed by the prior residents of the unit that changed occupancy, generating a net increase in the neighborhood's crime rate.
Property crime may become elevated as a consequence of HCVR growth as a result of greater opportunity to commit such crimes if they move to areas with higher incomes than that in their previous neighborhoods (Lim & Galster, 2009). Moreover, it is plausible that HCVRs live in neighborhoods where they are poorer on average than nonHCV households since vouchers allow households to afford more housing than they would otherwise. Voucher holders who move into a neighborhood have lower incomes than the households who would have otherwise moved in. Moreover, several theories suggest that crime will grow with inequality, either because wealthier households and their property present targets to low-income households or because neighborhoods containing people of diverse backgrounds and limited shared experiences are likely to be characterized by greater social disorganization, which can reduce social control and lead to increases in crime (Shaw & McKay, 1942).
In addition, individuals in HCV households, particularly adolescent youth, may have engaged in or have ties to others who engaged in crime and may import these behaviors and friends to their new neighborhood. For example, teens in HCV households may have preexisting connections that bring them into conflict with gang members already established in the area, thereby generating more crime (Hagedorn & Rauch, 2007; Popkin et al., 2000; Venkatesh, 2004). Moreover, moving to a new neighborhood is disruptive (Hagedorn & Rauch, 2007), and scholars have demonstrated that frequent residential moves for young people lead to increased likelihood of committing violent crimes (Haynie & South, 2005; Sharkey & Sampson, 2010).
This may be especially true for those moving from public housing projects, as Rosin (2008) contends. There is existing evidence that crime rates are elevated in public housing developments for a variety of reasons (Goering et al. 2002; Hanratty et al., 1998; Rubinowitz & Rosenbaum, 2000), and thus it is not implausible to hypothesize that residents using vouchers to leave distressed public housing developments are more likely to commit crimes – or have friends who are more apt to commit crimes – than the individuals already living in the voucher holders’ destination neighborhoods. However, evidence from the Moving to Opportunity (MTO) experiment suggests that youth who leave public housing may reduce their criminal behaviors when they leave (Kling et al., 2005).
Finally, HCVRs could cause crime through increases in turnover in a community, which may also lead to elevated crime as social networks and norms break down. Sampson et al. (1997) report a strong association between residential instability and violent crime in Chicago. Other indicators, such as White flight, are associated with higher crime (Taub et al., 1984). To the extent that in-migrating HCVRs commit more crimes in their destination neighborhood, they may encourage longer-term residents to commit more crimes themselves. This process of recruiting neighbors into criminal acts may proceed through role modeling or changing local collective norms about the acceptability of illegal behaviors. Livingston et al. (2014), for example, found an increased propensity of individuals to commit their first crime if they lived near neighbors with previous criminal records.
On the other hand, there are good reasons to believe that HCVRs do not cause crime including among Black HCVRs. For one, local housing authorities are permitted to screen voucher applicants for criminal records. As a consequence, voucher holders will be less likely to engage in criminal activity than other individuals with similar incomes who do not receive housing assistance (US Department of Housing and Urban Development (HUD), 2001).
A second reason is that a sizable number of voucher holders actually remain in their same unit when they first use their vouchers (Covington et al., 2011; Feins & Patterson, 2005). For these households and given steady state turnover in these areas, new vouchers add economic resources to neighborhoods, which in turn could dampen crime.
Third, reverse causation of voucher holders moving to neighborhoods where crime is already increasing could be at play, as demonstrated elsewhere (Ellen et al., 2012; Lens, 2014). Rents in neighborhoods with high or rising crime are likely more affordable, and as a consequence will be demanded by voucher holders trying to minimize the portion of rent they must pay given the value of the voucher (Sard and Rice, 2014). In this instance, rising neighborhood crime causes increases in voucher holders, not the reverse.
Finally, it is plausible that an observed positive relationship between crime and HCV holders may be spurious if the growth of both factors in a neighborhood is caused by other (often hard-to-measure) neighborhood characteristics. For example, a neighborhood park with good recreational facilities may attract families holding HCV to live nearby, but it also may attract illegal activities unrelated to HCV families, with a potential increase in crime.
To the extent that HCVRs do not cause crime for these reasons, claims that crime increases when Black HCVRs move in would be based on the perceived criminality of Black people more generally, and not on real observed increases in crime rates. These (false) perceptions would be consistent with other work that documents racial fears of Black people by employers, realtors, neighbors, and other agents based on the false or widely out of proportion threat of criminality (Holzer et al., 2006; Pickett et al., 2012; Quillian & Pager, 2001).
Despite the predictive ambiguity of theory regarding this question, the few papers that have investigated the general question of whether HCVRs cause crime have found little support for the idea, with at least one exception. Lens (2014), using panel data on over 200 US cities and suburbs and fixed effects to control for unobserved place characteristics, finds a weak or non negative relationship between violent crime rates and HCVRs. Ellen et al. (2012), examining 10 large cities, concluded that neighborhoods with increases in HCVR households did not experience increases in crime. Instead, they concluded that any positive association between voucher holders and crime was driven by voucher households’ tendency to move into areas where crime was already increasing. This latter finding is consistent with other work using different methodologies or data (Keels et al.,, 2005; Popkin et al., 2012; Van Zandt & Mhatre, 2013).
Hendey et al. (2016), use 1999–2008 quarterly data from Chicago census tracts to test this allegation with a dynamic panel model designed to overcome the challenges of omitted variable and endogeneity biases. They find no support for the proposition that growth in HCV holders leads to growth in violent crime rates. However, they do find it is positively associated with growth in property crime rates but only in higher poverty neighborhoods or if HCVs exceed a threshold concentration.
On the other hand, Mast and Wilson (2013) using annual data from 2000 to 2009 for Charlotte-Mecklenburg County in North Carolina and quantile regression models with year and census tract fixed effects, find that voucher households are associated with increased crime, and that estimates of this effect vary with the neighborhood crime level. Their focus on one metropolitan area however limits the external validity of their findings.
Despite this growing body of evidence that HCVRs do not cause crime, there remains questions about the influence of HCVRs on crime by the race of the recipient, especially in predominantly White suburban areas. As indicated, at least as of now, there is little research investigating the question of whether these results differ by the race of the HCVR or by the type of areas, such as White suburbs, to which HCVRs move.
Data and Methods
To answer the central question of whether Black HCVRs cause crime especially in White suburbs, I use data from a variety of sources. I use data from 2000 to 2018 because of the availability of unique data on HCVRs and crime that are matched geographically to census places within the largest 100 metropolitan areas in the county. 4 I use data on voucher holders from 2000 to 2008 because it is a period right before the housing crash leading to the Great Recession, and because it gives enough time to observe voucher holder moves through 2018. The latter period provides a time-period long enough to conduct the lead analysis described below. The data on voucher holders comes from the U.S. Department of Housing and Urban Development's (HUD) Picture of Subsidized Housing for 1990, 2000, 2007 and 2018, and I use it to measure the number of people (and households) using Housing Choice Vouchers (HCVs) by all places in metropolitan areas. In addition, I use 2000 and 2008 Census data to measure housing and demographic place characteristic variables that include the percentage of rental housing that is fair market rental (FMR), population size, and the percentage of residents that are Black, Latino, foreign born or poor. Finally, the crime data comes from the Uniform Crime Report (UCR) Offenses Known and Cleared by Arrest compiled by the Federal Bureau of Investigation (FBI) for 2000 and 2008.
HUD's Picture of Subsidized Housing data is used to describe the characteristics of HUD assisted housing recipients including the type of housing program (HCVR or other), and population characteristics of the assisted households (such as race of recipient) at the census tract level. The main HCV variable is measured as the percentage of the total population that is HCV recipients (HCVRs) in 2000 and 2007, periods right after and before major recessions that could themselves could influence crime. 5 Unlike Van Zandt and Mhatre (2013), Mast and Wilson (2013) and Ellen et al. (2012), I model crime rates rather than counts because I have accurate census population estimates for 2000 and 2008. Still, analysis not shown here of HCVR and crime counts produced no dissimilar qualitative results.
I measure crime rates using 2000 and 2008 data from the (UCR). The UCR data provide counts of crimes reported to the police for each police agency (referred to as a reporting unit in the UCR data) by month. To calculate crime rates, 12 months of crime data were aggregated to create annual estimates for 2000 and 2008. 6 In all tabulations, crime rates are measured as criminal incidents per 100,000 residents.
I use the UCR data to estimate rates of serious felony crimes. Felony criminal incidents involving victims are officially categorized into the following seven mutually exclusive categories: murder, rape/sexual assault, robbery, aggravated assault, burglary, larceny/theft, and motor vehicle theft. For much of the analysis, I aggregate incident types to present findings for two general categories of crime. Conventional aggregations generally group the first four felonies under the banner of violent crime. The latter three felony offenses are commonly referred to as property crimes, since the objective of each is to unlawfully acquire the property of another without physically encountering the victim. In addition, we improve upon previous research by providing results for each of the individual crimes listed above where appropriate. 7
Note that the voucher data are reported at the census tract level and the crime data at higher levels of geography including places, Minor Civil Divisions (MCD), and unincorporated portions of counties. To conduct the analysis, census tracts are aggregated to these larger geographies. For the most part, reporting units/police agencies correspond to places. Places refer to incorporated jurisdictions - such as cities, towns, and villages - as well as census-designated places - unincorporated areas delineated by the U.S. Census Bureau for statistical purposes. For example, the Oakland Police Department is a single reporting unit. In instances where there are multiple police agencies within a place, we aggregate crime data from all reporting units to create a place-level total. 8
Reporting units may also correspond to a MCD. The Census Bureau uses MCDs to designate the primary governmental and/or administrative divisions of a county, such as a civil township, precinct, or magisterial district. MCDs exist in 28 states and the District of Columbia. For the remaining states, the Census Bureau designates MCD equivalents, called Census County Divisions (CCDs), for statistical purposes. 9 Police agencies covering areas not located within a place but located within an identifiable MCD/CCD are aggregated to the MCD level. Finally, police agencies covering unincorporated areas of counties that lie outside of these two geography types are combined into a balance-of-county aggregate. 10 After matching reporting units to the relevant geography, I identified roughly 5,500 separate geographic units within the 100 largest metropolitan areas that appear in the UCR data.
Finally, I match community-level crime data to data from the decennial census and the American Community Survey (ACS). Specifically, data are employed from the 2000 Census of Population and Housing Summary File 3, and the 2005- 2009 ACS five-year estimates. 11 I use these data to estimate the proportion of community residents that are Black, Latino, foreign-born, or poor in each year. For identifiable census places and MCDs, we match corresponding estimates from the decennial census or ACS directly to the UCR data. Roughly 75 percent of the population of the metropolitan areas included in this study resides within a definable place or MCD. For the unincorporated balance-of-county observations, county-level average values are assigned. 12 If the voucher subsidy accurately reflects local housing costs, voucher holders should theoretically be found in nearly all neighborhoods (typically measured as census tracts) with rental housing available at or below fair-market rents (FMRs).
As noted, I include the largest 100 metropolitan areas in the sample; as a result, approximately 5,500 places/units are observed in the data. This facet of the research improves upon previous studies: more metro areas are included than in previous studies and thus a more precise general estimate of the potential impact of HCVR on crime can be estimated. Moreover, the larger sample size of metropolitan areas and places allows me to examine the potential heterogeneity of the influence of HCVRs on crime by, among others, city/suburban status, and the race of the HCVR.
Table 1 presents basic descriptive statistics of crime rates and HCVR presence (and by race of HCVR) in 2000 and 2008. The data are weighted by the metro areas population size. Of course, unweighted data treats equally metro areas with population sizes as little as 500 to as large as over 5 million, and thus interpretation could be misleading since more populous areas are more likely to have higher crime rates and HCV presence (confirmed in the data though not shown here).
Crime Rates (per 100,000) and Percentage of Population with Housing Choice Vouchers or Poor, 2000 and 2008.

Note: Voucher data is from 2000 and 2007.
Data is weighted by place population.
*Indicates change significant at 5 percent level.
The weighted data in Table 1 reveals that both violent and property crime rates declined over this period across the 100 largest metropolitan areas, by nearly 4 percent for violent crime and nearly 9 percent for property crime. 13 Only the change in property crime is statistically significant. The data are consistent with other studies that show declines in both crime indexes in the U.S. over this period (Kneebone & Raphael, 2011). On the other hand, HCVRs presence in metro areas increased for HCVRs as a whole and by the race of the HCVR, especially for Black HCVRs. The presence of Black HCVRs increased by 3 percentage points over this period. The increase in voucher use over this period is consistent with previous results and is driven partly by annual incremental funding increases for additional vouchers and voucher increases to designated populations (such as veterans) by congressional mandate (GAO, 2012). Still, in the in the largest 100 metropolitan areas as a whole, the data indicate crime rates declined while voucher holder presence increased.
Panel B displays these changes by the central city/suburban status of the place. Both violent and property crime rates are higher in cities than suburbs in both periods, but crime rates declined more in cities over this period, consistent with previous research (Kneebone & Raphael, 2011). Note also that the relative shares of the population that are HCVRs are only slightly higher in cities than suburbs. This is especially true for HCVRs that are Black or Latinx. However, the share of the population that are Black (and Latinx) HCVRs in the suburbs grew significantly over this time period and nearly as much as in cities. Still, the data indicate the general pattern that voucher holder presence increased over this period, especially for Black HCVRs in cities and suburbs, while crime rates declined in both cities and suburbs (except for violent suburban crime which remained virtually flat). This evidence portends a negative or non-relationship between HCVRs and crime, especially for Black HCVRs. Regression analysis is needed, however, to control for other factors that could confound this relationship.
Table 2 further probes changes in crime rates and HCVRs presence over the 2000 to 2008 period by the type of suburbs, defined by racial representation. I define minority suburbs as suburban places where the minority population is over 50%, while White suburbs are those places where the White population is over 50%. The remaining suburban places are defined as mixed; those suburban places that are neither 50% or more minority nor more than 50% White. 14 The data in Table 2 indicate that while both property and violent crime rates fell in mixed and White suburbs from 2000 to 2008 (and increased slightly in minority suburbs over this period), none of the changes were statistically significant.
Crime Rates (per 100,000) and Percentage of Population with Housing Choice Vouchers by Suburban Type, 2000 and 2008.
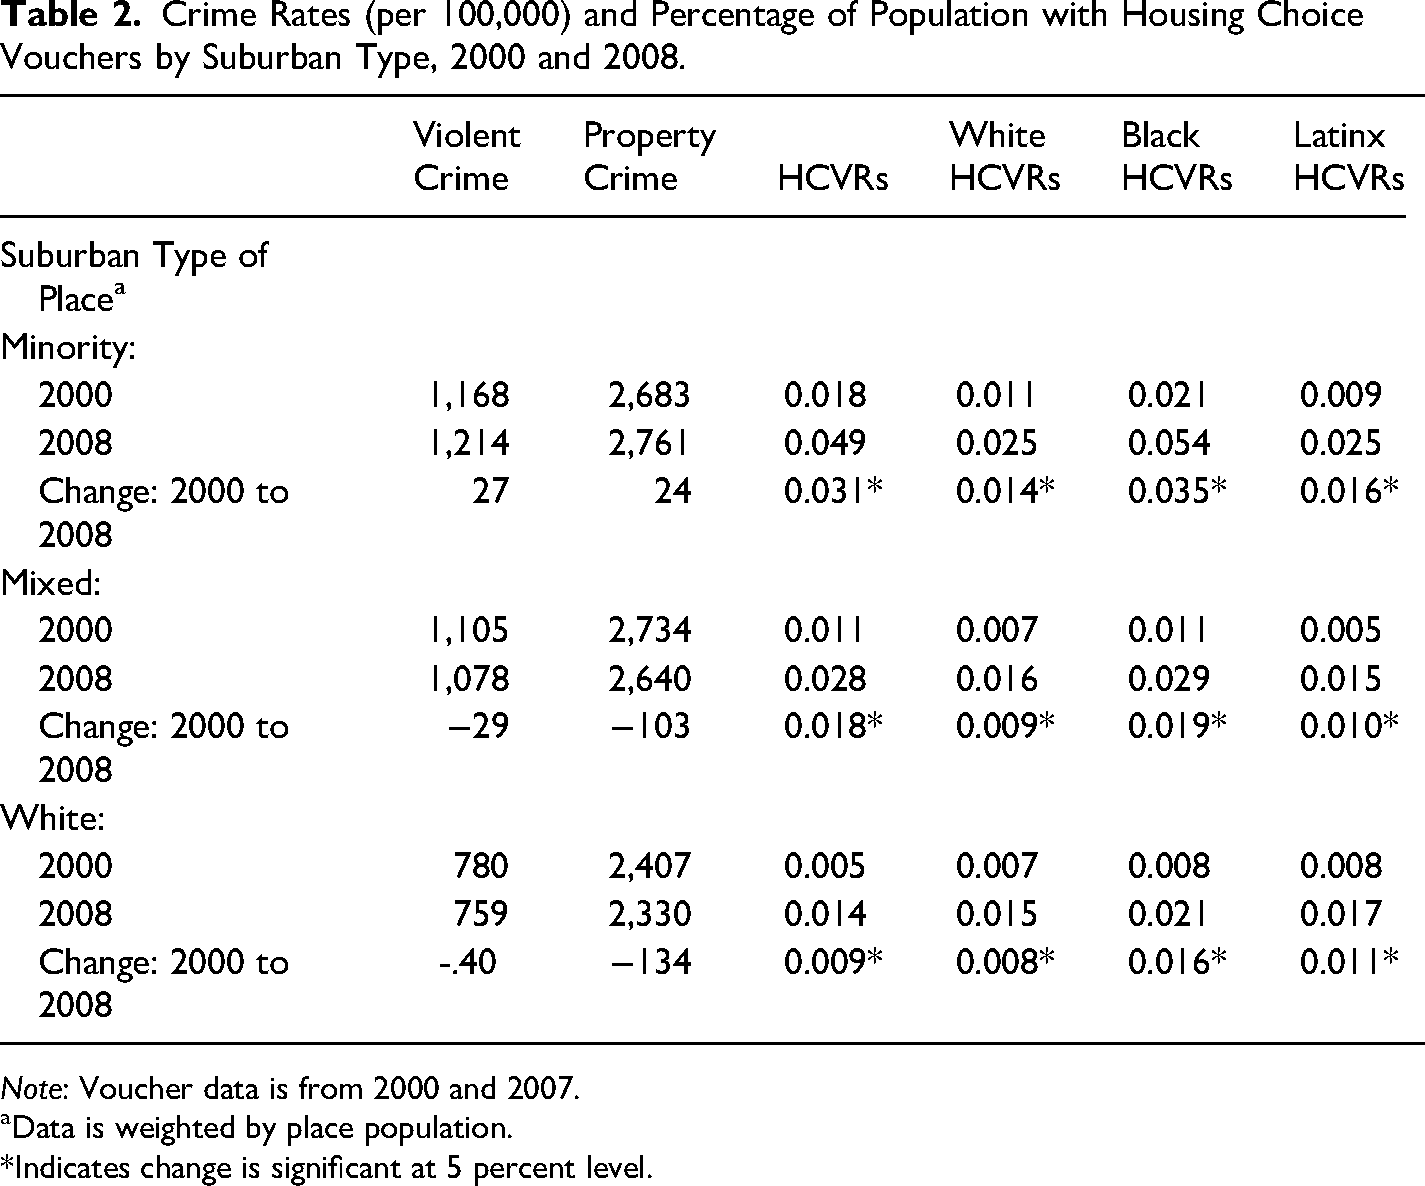
Note: Voucher data is from 2000 and 2007.
Data is weighted by place population.
*Indicates change is significant at 5 percent level.
On the other hand, the presence of all HCVRs and that for each race increased in each suburban area type from 2000 to 2008 by statistically significant levels. Most importantly, the presence of Black HCVRs increased in White suburbs over this period, while both property and violent rates declined there, though not by statistically significant amounts. This preliminary evidence suggests a negative relationship between the presence of Black HCVRs in White suburbs and crime rates, though again regression analysis is needed to rule out confounding factors that could affect this relationship.
Estimating Relationship Between Black HCVRs and Crime in White Suburbs
Before I examine the potential influence of Black HCVRs on crime rates across different residential locations, I first identify a general relationship between housing choice voucher use and crime rates to examine whether the results are broadly consistent with those in the literature. To the extent that they are will provide greater confidence in the results of the analysis by the race of the HCVR and residential location. However, identifying this relationship is a challenge. Many place characteristics that are associated with the presence of voucher households (such as its poverty rate) may also directly influence crime rates. For example, growth in poor populations could influence both the presence of voucher holders and crime, so that the influence of voucher use on crime could be spurious through poverty.
Alternatively, high crime rates could lead to less attractive neighborhoods (that leads to lower rents), which in turn could lead to an increase in the presence of voucher holders (through lower rents or increased landlord willingness to rent to voucher holders), which would be consistent with reverse causation. I address these concerns by employing a variety of modeling strategies including first-difference regressions, adding metropolitan fixed effects, controlling for observable time-varying covariates that also influence crime rates, and using lags of crime rates and leads of voucher use to gain inference on causality.
In the first part of the analysis, I estimate a general model of HCVRs and crime to establish whether the estimates comport with prior research. To do so, I first identify the influence of HCVRs on crime using first difference regression analysis. The advantage of this approach is that the potential influence of fixed place characteristics on crime are controlled. Further, I include metropolitan area fixed effects to control for metropolitan area specific crime trends occurring over the 2000 to 2008 period that influence within metro area crime trends. Including these ensures that coefficients are estimated using only the variation in the housing choice voucher and crime rates occurring across communities within each of the metropolitan areas.
The models also include controls for a host of observable time varying place characteristics that are directly related to crime. These include place size, the percentage of the place population that is Black (or Latinx), and most importantly the poverty rate of the place, variables that are demonstrated to be highly correlated with crime (Ellen et al., 2012; Kneebone & Raphael, 2011; Raphael & Sills, 2005). 15 Moreover, I include the percentage of the place's rental units that are up to 50 percent of fair market value (FMR) to control for rental housing supply that influences the locational choices of HCVRs. The availability of rental housing has been shown to be one of the biggest factors determining the location decisions of HCVRs (Teater, 2009).
To conduct the analysis, I convert the HCVR rate variable to equal the number of voucher recipients per 100,000 people per place to make it equivalent in scale to the crime rate variables.
16
I use the following general equation to estimate the impact of HCVRs on crime rates:
I lag the measure of voucher users by one year to mitigate concerns about potential problems from reverse causality and to allow for more accurate estimates of the potential impact of voucher holders on crime. Reverse causality is a greater threat when voucher use and crime are measured in the same year since voucher holders are likely to live in higher crime areas (Ellen et al., 2012). In addition, lagging the measure of voucher use provides time for crime to occur as a result of changes in voucher holders’ presence since the crime data measures crime throughout the entire year and the count of voucher holders in the HUD data captures the number of voucher holders in an area at the end of the year.
Table 3 presents regression results for both violent and property crime rates based on equation (1). 19 I weight the regressions by population size across places. 20 Weighting the regressions in this way allows more populous places (with larger numbers of HCVRs) to have more influence in estimating the relationship, so that it (appropriately) reflects the relationship between changes in HCVR presence on crime of places with more people (and HCVRs) rather than that of the typical place. Moreover, weighting by population size also takes into account the variance in the change in violent and property crime rates that are observed to be dependent on population size.
Regression Coefficient Estimates of the Change in Violent and Property Crime Rates, 2000 to 2008 a .
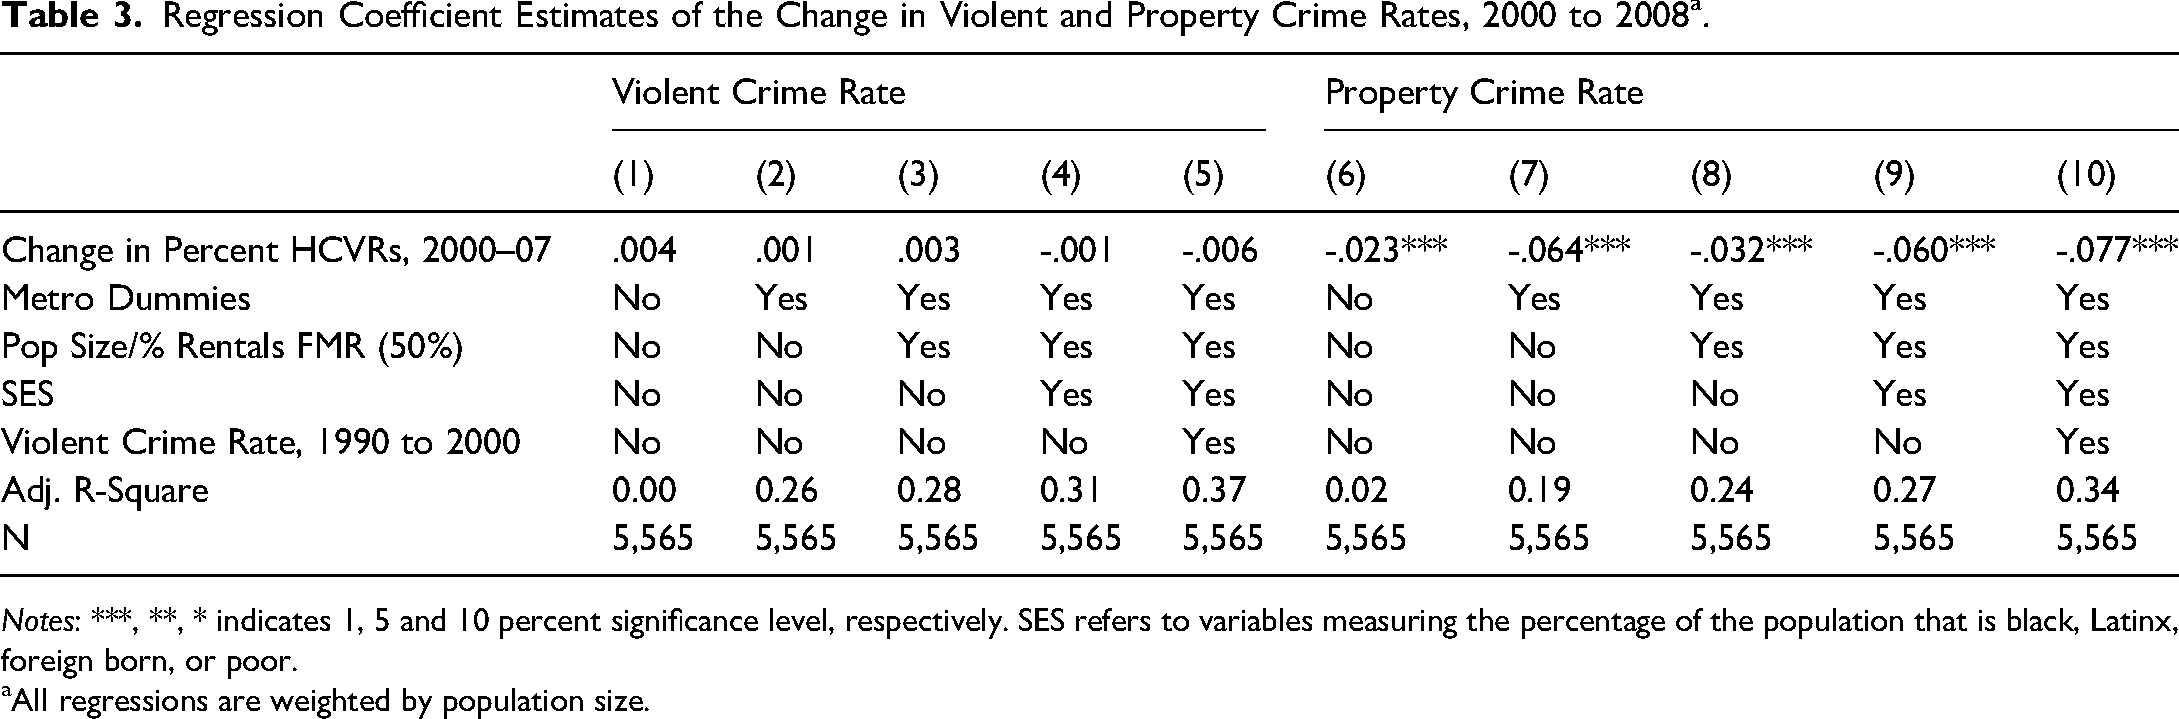
Notes: ***, **, * indicates 1, 5 and 10 percent significance level, respectively. SES refers to variables measuring the percentage of the population that is black, Latinx, foreign born, or poor.
All regressions are weighted by population size.
The first five columns show these for violent crime, while columns (6) through (10) does so for property crime. The first column displays a simple bi-variate relationship between violent crime and HCVR presence. The simple bi-variate coefficient between violent crime and voucher use rates is positive with a coefficient of 0.005, but is not statistically significant (at any level), indicating that there is no relationship between violent crime rates and the average HCVR. Column (2) includes metropolitan fixed effects, and the coefficient estimate is largely unaffected, indicating that overall metropolitan area specific crime trends over the 2000 to 2008 period do not affect the association between HCVR presence and crime (which cannot be caused by the change in HCVR presence in a specific place).
Next, in column (3) I include controls for the percentage of rental units in the place that fall at or below 50 percent of fair market value. The coefficient estimate of HCV on crime is largely unaffected by their inclusion. Column (4) adds the demographic variables to control for characteristics of places that may be associated with crime. The addition of these is a stricter test since HCVRs are disproportionately poor, Black, and Latinx. The coefficient estimate for HCVRs turns negative, but remains statistically insignificant. Finally, the fully specified model in column (5) includes the violent crime tend from 1990 to 2000. The results show that the main coefficient becomes more strongly negative but remains statistically insignificant, indicating that place specific preexisting crime trends do not affect the relationship.
Columns (6) through (10) repeat these exercises for the property crime rate. The simple bi-variate coefficient between property crime and voucher use rates in column (6) is −0.022 and statistically significant (at the .01 level), indicating that an increase of about 20 HCVRs per 100,000 people is associated with a decrease of about 1 property crime per 100,000 people – that is voucher use is negatively associated with property crime. The negative and statistically significant coefficient is not accounted for by metropolitan or housing characteristics nor by the socioeconomic characteristics of places. The coefficient is also not accounted for by the property crime trend from 1990 to 2000.
Combined, these results provide little evidence for the general hypothesis that HCVRs cause crime, and are consistent with the bulk of previous findings in the literature. 21 Hence, there should be greater confidence in the results presented below by the race of the HCVR and its interaction with residential location.
Below, I examine the central question of the influence of HCVRs on crime rates by the race of the HCVR, in particular in suburban areas characterized their racial concentration. This analysis will follow the general model specification in equation (1) by estimating each model separately by the race of the HCVR and interacting it with suburban location. This specification takes the following form: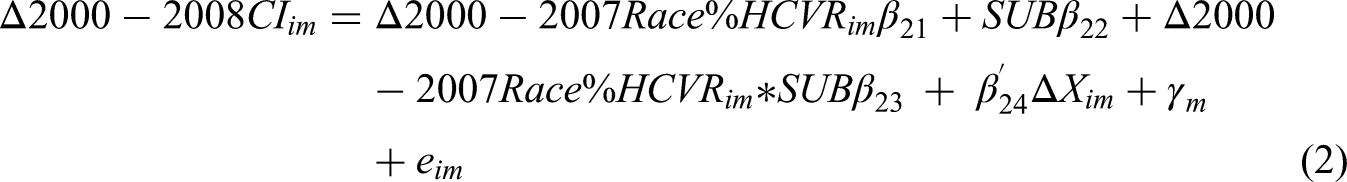
This analysis will first examine the results by the race of the HCVR, then the interaction between the race of the HCVR and having a suburban residential location, and then followed by interactions between the race of the HCVR and having a suburban location distinguished by its racial concentration.
Table 4 present results of regressions of the change in violent and property crime rates as a function of the change in HCVR presence by race of the primary HCV holder. 22 Panel A through C show separate model results for each respective racial group, and are estimated using the fully specified model, weighted by population size. As noted, weighting by population size accounts for the highly uneven presence of HCVRs across places characterized by population size, and that the variance in the change in bot violent and property crime is dependent on population size.
Regression Coefficient Estimates of the Change in Violent and Property Crime Rates by Race of HCVR, 2000 to 2008.
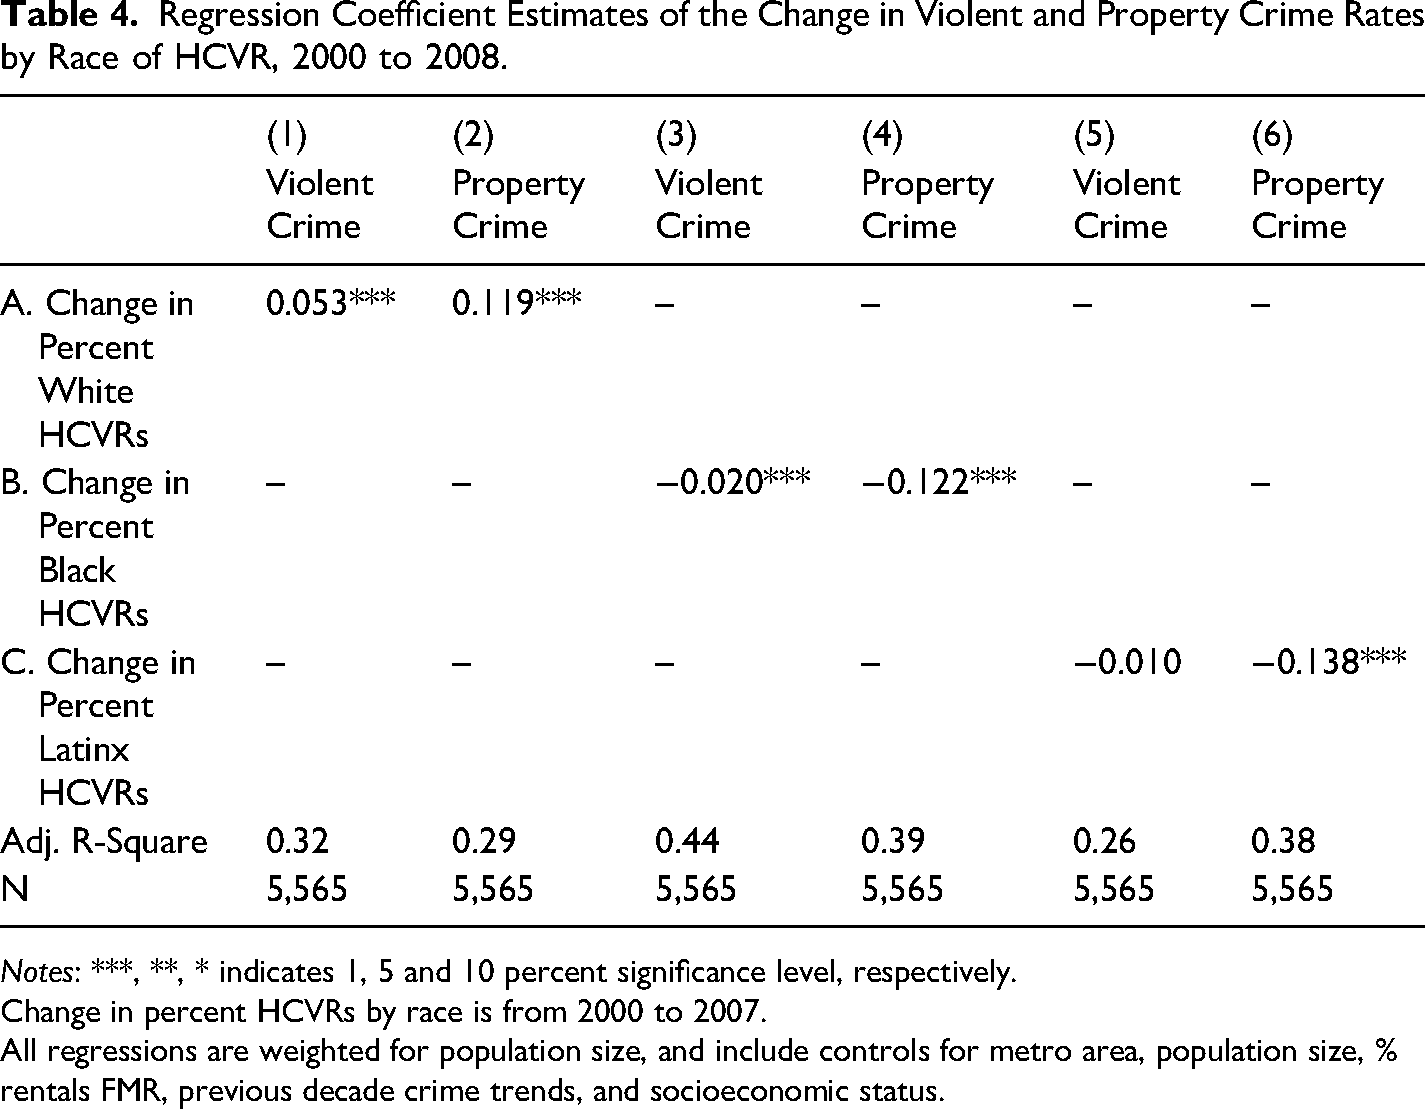
Notes: ***, **, * indicates 1, 5 and 10 percent significance level, respectively.
Change in percent HCVRs by race is from 2000 to 2007.
All regressions are weighted for population size, and include controls for metro area, population size, % rentals FMR, previous decade crime trends, and socioeconomic status.
Given that crime rates are positively associated with the percentage of a place that is Black, and to the extent that Black HCVRs are located in or move to primarily Black neighborhoods, we might expect that the change in crime rates are positively associated with the change in the presence of Black HCVRs in the area. The results in Table 4, however, do not support this expectation. In fact, the change in both violent and property crimes rates from 2000 to 2008 are negatively and statistically significantly associated with the change in the presence of Black HCVRs. This is also true in the case of the change in the percent of HCVRs that are Latinx.
On the other hand, I find a positive and statically significant (at the .01 percent level) association between the changes in violent and property crime and the changes in the percentage of HCVRs that are White. The magnitude of the coefficients indicates that an increase of about 50 White HCVRs per 100,000 people is associated with an increase of about 1 violent and about 2 property crime per 100,000 people.
Whether these results for White HCVRs are causal is an important question. I note that the distribution of HCVRs by race over place size is likely affecting these results. This is because Black and Latinx in comparison to White HCVRs are more likely to live in the top quintile of place size where crime rates fell over the period, while White HCVRs are more likely to live in the lower quintiles where crime rates rose. Moreover, Galvez (2010) reports that while the average neighborhood poverty rate for voucher holders is similar to that for poor MSA residents as a whole, for poor White households, the average neighborhood poverty rate for voucher holder is higher than that for the typical poor White. Below, I use lead and lag analysis to further examine whether there is evidence to suggest these results are causal.
Table 5 presents results based on models where the race of the HCVR variable is interacted with the suburban location variable. A priori, I have no expectation of the direction and magnitude of the potential effects. On the one hand, as Tables 1 and 2 demonstrate, HCVR presence grew slightly more significantly in the cities than suburbs for Black and Latinx HCVRs; precisely those areas where crime rates declined the most from 2000 to 2008. On the other hand, point in time crime rates are higher in these places. White HCVR presence grew more in suburban (than central city areas) areas where change in crime rates was insignificant.
Regression Coefficient Estimates of the Change in Violent and Property Crime Rates by Suburban Location Status of HCVRs, 2000 to 2008.

Notes: ***, **, * indicates 1, 5 and 10 percent significance level, respectively.
Change in percent HCVRs by race is from 2000 to 2007.
All regressions are weighted for population size, and include controls for metro area, population size, % rentals FMR, previous decade crime trends, and socioeconomic status.
As before, the regression results shown in Panels A to C are for each respective racial group, and for both violent and property crime rates. All regressions are based on the fully specified model. The results of the interacted coefficients are not significant for Black (or Latinx) HCVRs for either violent or property crime indicating no relationship between that Black and Latinx HCVRs and crime rates in suburban (or central city) areas. On the other hand, the results do indicate that White HCVRs positive influence on crime rates occur in suburban rather than central city areas.
Table 6 presents results based on models where the race of the HCVR variable is interacted with the suburban location variable summarized by its racial representation. This specification provides insight into the main research question of whether the results for suburban status differ by the racial characterization of the suburban place, and is a direct test of whether Black HCVRs influence crime rates in White suburban areas. Again, I have no expectation of the direction and magnitude of the potential effects. The growth in HCVR presence is strongest for all racial groups, including Blacks, in minority suburbs. However, there are no statistically significant changes in either violent or property crime rates from 2000 to 2008 in minority, mixed or White suburban areas, and point in time crime rates are lower in these areas than in cities.
Regression Coefficient Estimates of the Change in Violent and Property Crime Rates by Race and Suburban Type Location of HCVR, 2000 to 2008.
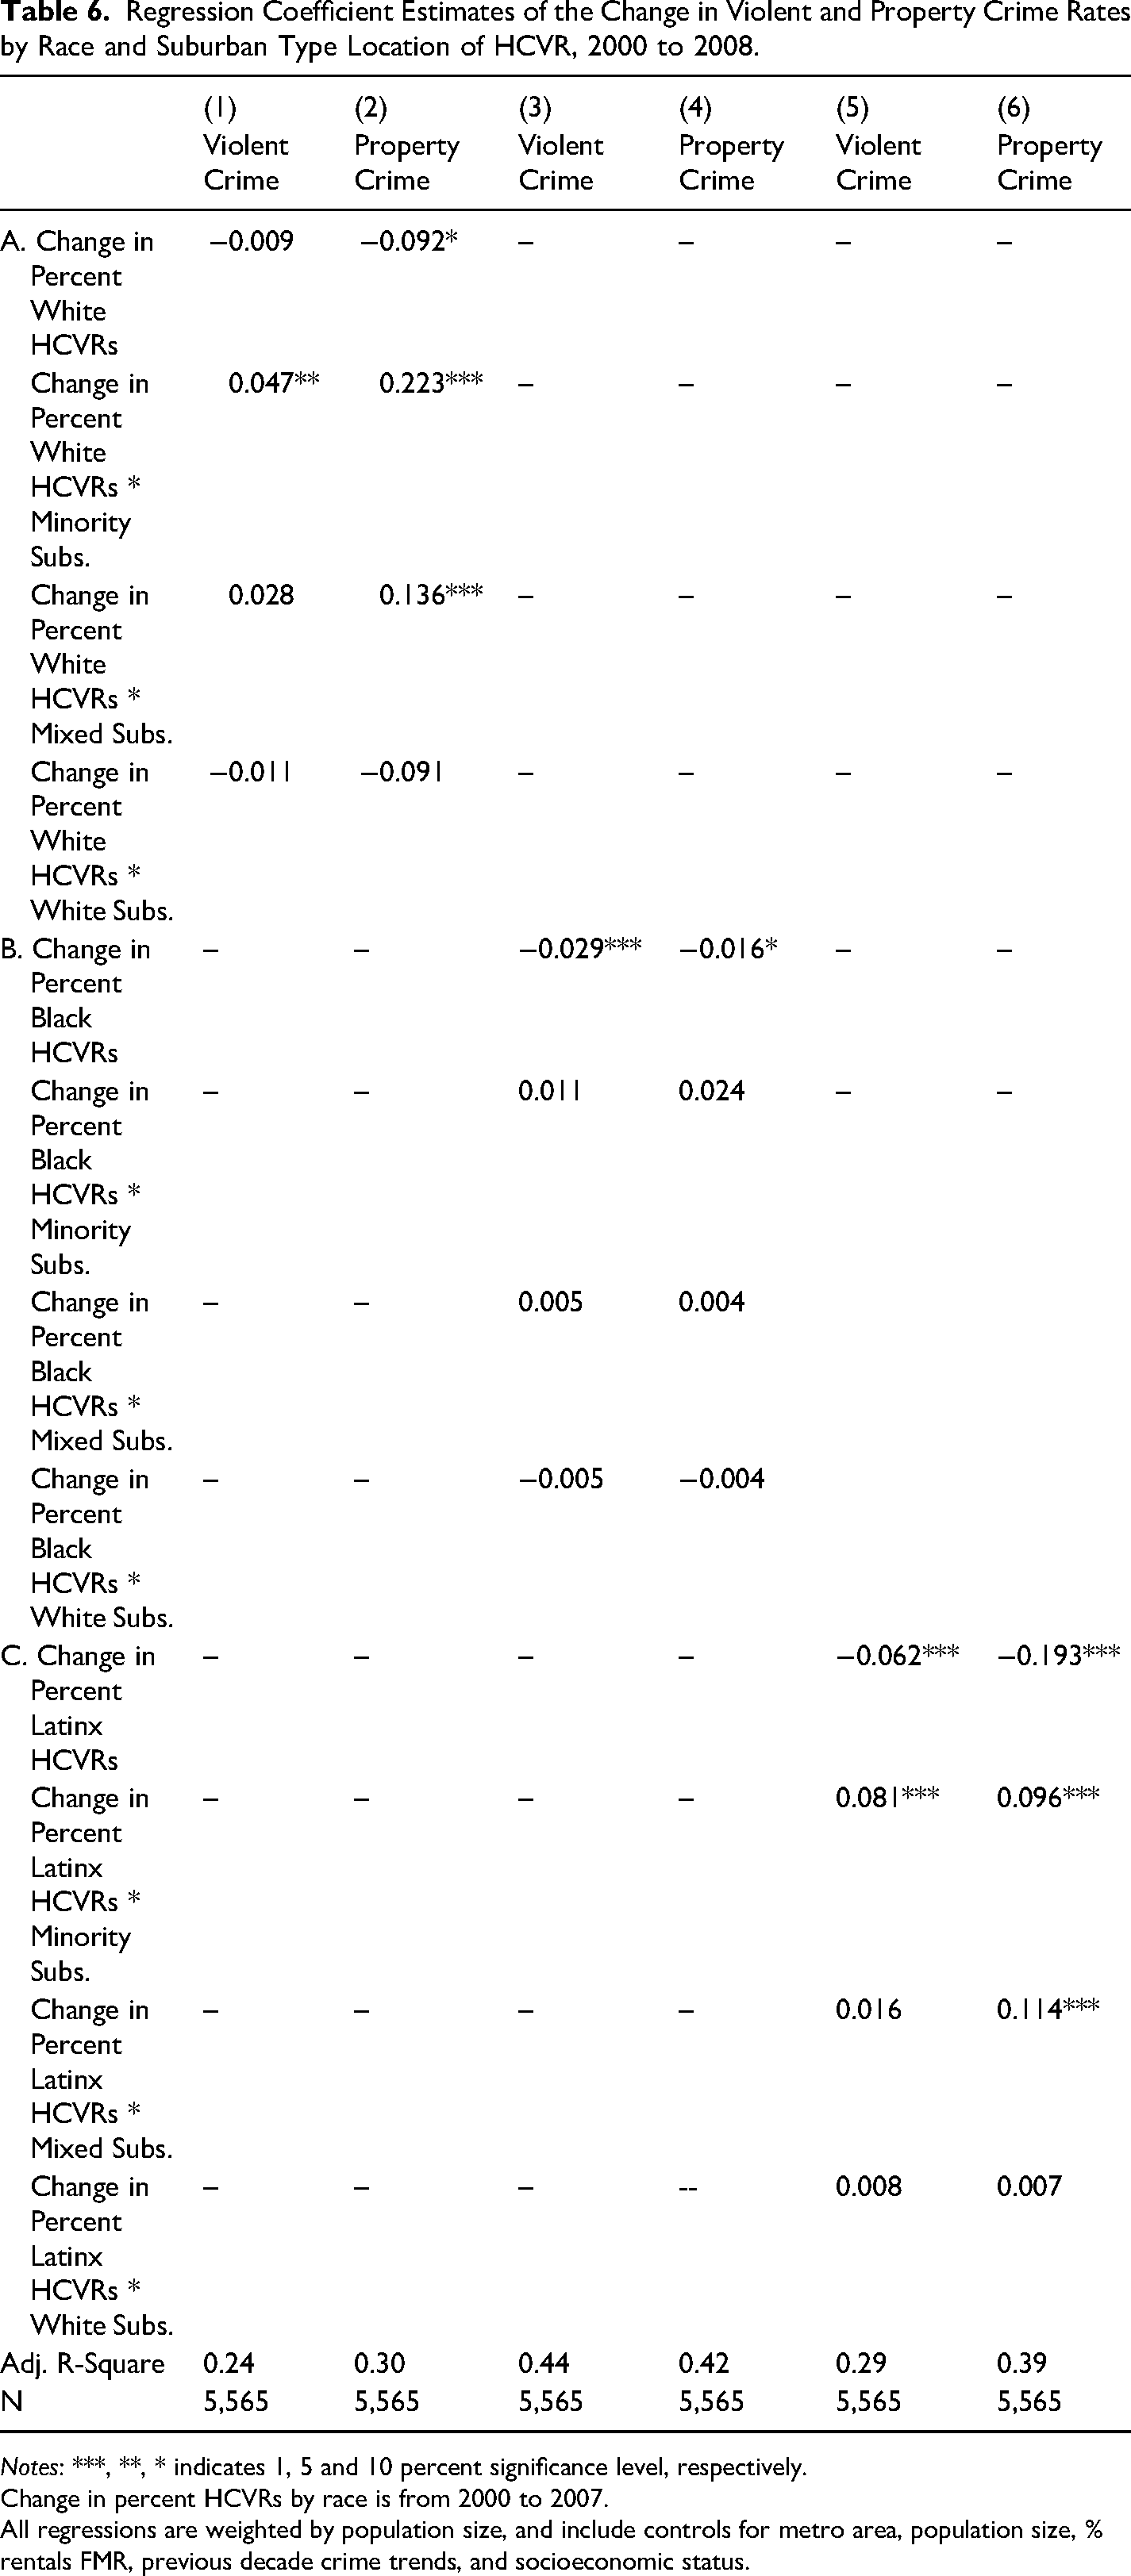
Notes: ***, **, * indicates 1, 5 and 10 percent significance level, respectively.
Change in percent HCVRs by race is from 2000 to 2007.
All regressions are weighted by population size, and include controls for metro area, population size, % rentals FMR, previous decade crime trends, and socioeconomic status.
As before, the regression results shown in Panels A to C are for each respective racial group, and for both violent and property crime rates. All regressions are based on the fully specified model. The results of the interacted coefficients are not significant for Black (or Latinx) HCVRs for either violent or property crime indicating a non-relationship between Black and Latinx HCVRs and crime rates in White, mixed or minority suburban areas. On the other hand, the results for White HCVRs further clarify that the positive influence of their presence on crime rates in suburban areas occurs in majority minority and racially mixed suburban areas.
Lags and Leads
To summarize, I find no evidence that Black HCVRs influence crime rates in suburban areas, defined generally or characterized by their racial representation. However, I do find that White HCVRs positively influence crime rates in suburban areas, in particular in majority minority or racially mixed suburbs. I use lags and leads of important variables to further tease out whether these positive and statistically significant results are causal; that is, to gather more evidence to see if white HCVRs moves are endogenous to crime rates.
The strategy uses lagged crime rate variables and lead HCVRs’ moves. I use lag crime rate variables because growth in HCVR presence over the 2000 to 2007 period should not influence changes in crimes rates from a period prior, in this case from 1990 to 2000. Moreover, the choice of use of a lagged dependent variable is further strengthened by the timing of the changes in the use of HCV that expanded the allowable places where such voucher could be used. Many of these changes were introduced in the late 1990s, after the measure of lagged crime rates begins. Thus, the conclusion that the positive and statically significant results of the change in White HCVRs and suburban crime rates is causally related would be strengthened if the change in crime rates between 1990 and 2000 are unrelated or negatively related to the current change in HCVRs.
Equation (3) below provides the model specification for this strategy: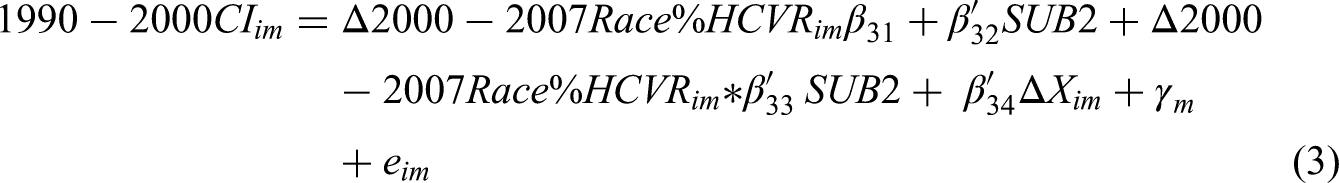
Following Lens (2014) and Ellen et al. (2012), lead measure of HCVR moves are entered into the analysis based on the observation that HCVRs who have not entered a place cannot be causes of crime in the current period, i.e., 2000 to 2008. Fortunately, I also have data on HCVRs for 2018, and thus can measure the change in HCVRs presence over two years, between 2008 and 2018.
Equation (4) below provides the model specification: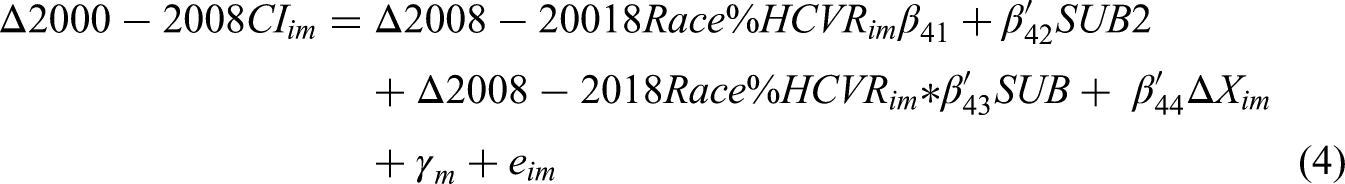
Table 7 presents the lag and lead results based on these specifications, which includes all control variables previously identified (except crime trends the decade prior for the lag models) and are weighted by the (respective) number of HCVRs. Panel A to C present model results for the respective (race/ethnicity) HCVR groups, and the first two columns report results for the violent crime rate and the last two columns for the property crime rate.
Regression Coefficient Estimates of the Change in Crime Rates: Lags and Leads.

Notes: ***, **, * indicates 1, 5 and 10 percent significance level, respectively.
Change in percent HCVRs by race is from 2000 to 2007.
All regressions are weighted by population size, and include controls for metro area, population size, % rentals FMR, previous decade crime trends (for lead models), and socioeconomic status.
Panel A.1 reports the lag results for White HCVRs, the main group of interest. The results of the lag analysis do not support the hypothesis that White HCVRs cause increased crime rates in suburban areas because the coefficient results are neither significantly negatively related nor unrelated, indicating a likely spurious relationship. 23 The results of the interaction terms indicate that the change in White HCVR presence in minority and racially mixed suburbs is positively and significantly associated with changes in violent and property crime rates the decade prior. If anything, these results are more consistent with the idea that White HCVRs are moving to suburban places where crime rates were already increasing.
Moreover, evidence from the lead models in Panel A.2 for White HCVR provides further support for this idea. The results indicate that the coefficients on changes in White HCVR presence in minority and mixed suburban areas between 2008 and 2018 are positive and significant, indicating that White HCVRs moves to suburban areas are unrelated to crime rates. Since the additional White HCVRs in suburban areas between 2008 and 2018 cannot cause crime in the 2000 to 2007 period, if anything this result is again more consistent with the idea that White HCVRs are moving to suburban areas where crime rates are increasing. 24
This is not the case for Black (and Latinx) HCVRs, as demonstrated in Panel B.1 (and C.1). The lag and lead results (for both violent and property crimes) are still more consistent with the null hypothesis of no effect of HCVRs on suburban crime for these groups. The results indicate that the change in Black HCVR presence in minority or mixed suburbs is in some cases negatively and, in some cases, significantly associated with changes in violent and property crime rates the decade prior. This indicates that Black HCVRs are moving to suburban places where crime rates were already decreasing. This pattern is largely true for Latinx HCVRs too. As before, there are no significant results for Black or Latinx HCVRs in White suburban areas.
One potential reason for this difference in outcomes between Black and White HCVRs is in the poverty levels of typical areas where voucher holders live. The average poverty rate for Black HCVRs is higher than that for Whites (17 percent) or poor Whites generally (15 percent), but similar to the average for all poor metro area residents (22 percent). This suggests that the voucher may allow Black households to access lower-poverty neighborhoods than they would without the voucher; and of course lower-poverty neighborhoods are associated with lower violent and property crime rates (Hannon, 2002; Krivo & Peterson, 1996; Stults, 2010). However, this is not the case for White HCVRs: the typical White voucher household lived in a tract with poverty rates slightly higher than the average for poor White metro area residents (Galvez, 2010).
Conclusion
The HCV program policy changes in the 1990s that relaxed the locational constraints imposed on recipients’ use of vouchers broadened the types and areas of residential neighborhoods to which the voucher holders could move, especially for Black HCVRs. This, coupled with moderate expansions of the HCV program in the late 2000s and with anecdotal evidence of landlord's recruitment of voucher holders to backfill weak demand for housing during the Great Recession (Medina, 2011), surely prompted HCVRs, especially those of whom are Black, to move to neighborhoods where they had not previously lived, such as in White suburbs. As a result, the changing character and demographics of neighborhoods, particularly suburban ones, led to concerns among existing neighbors, ultimately embodied in journalistic inquiries, about whether voucher holders, and especially Black holders, cause crime (Bovard, 2011; Medina, 2011; Rosin, 2008).
There is no doubt that race plays a central narrative in these accounts. Black HCVRs moves into especially White suburban areas is likely highly visible and noticed by neighbors. The new Black tenants are likely to spark racial fears of some White neighbors through their perceived criminality of Blacks. These (mostly false) perceptions of being criminally prone are consistent with those documented in other domains including fears by others of Blacks’ birdwatching in parks, driving in cars, sitting in Starbucks, riding in airplanes, shopping in stores, etc. In this context, these perceptions are likely to spark charges of heightened crime when Black HCVRS moved in, as evidenced by media scrutiny of these claims.
In this paper, I directly tested the hypothesis of whether Black HCVRs cause crime in White suburban areas by using voucher data as well as actual crime data from the FBIs Uniform Crime Reports for places in the 100 largest metropolitan areas in the U.S. I find no evidence that Black HCVRs influence crime in suburban areas. Indeed, I find no evidence that HCVRs cause crime more generally. This latter result is consistent with many other studies in the literature including those using different methods (Ellen et al., 2012; Lens, 2014; Van Zandt & Mihatre, 2013).
On the other hand, the results to show that White HCVRs influence crime rates in minority and racially mixed suburban areas. However, further probing of the data through lag and lead analysis suggested that these results were not consistent with the idea that White HCVRs cause crime in these areas. Instead, the evidence was more consistent with the idea that White HCVRs are moving to areas where crime is increasing, not the other way around. One potential explanation is that rental prices in these areas are lower or because property owners recruit HCVR because of weak demand for housing there, among other factors. Nevertheless, fears of increased crime as a result of greater Black HCVR presence are therefore not well supported by the results in this study, and should allay any concerns about unintended crime costs of the HCV program.
These results are important to public policy. To the extent that voucher holders cause crime, or better, add to marginal increases in crime, the cost of such vouchers would include the unintended consequence of increased crime in neighborhoods to which they move, in addition to the financial, administrative and other opportunity costs of the program. These costs of course would be weighed against the benefits of housing vouchers, of which many have been documented, to assess the cost-benefit viability of the program. Including crime costs into the calculation would no doubt raise the cost of the program relative to its benefits, increasing uncertainty of whether it meets this benefit-costs test, and, potentially more importantly, add to concerns about the program thus weakening political support for it. The results provide no evidence that such unintended crime costs should be included in benefit-cost analysis of the HCV program.
Footnotes
Declaration of Conflicting Interests
The author(s) declared no potential conflicts of interest with respect to the research, authorship, and/or publication of this article.
Funding
The author(s) received no financial support for the research, authorship, and/or publication of this article.
Notes
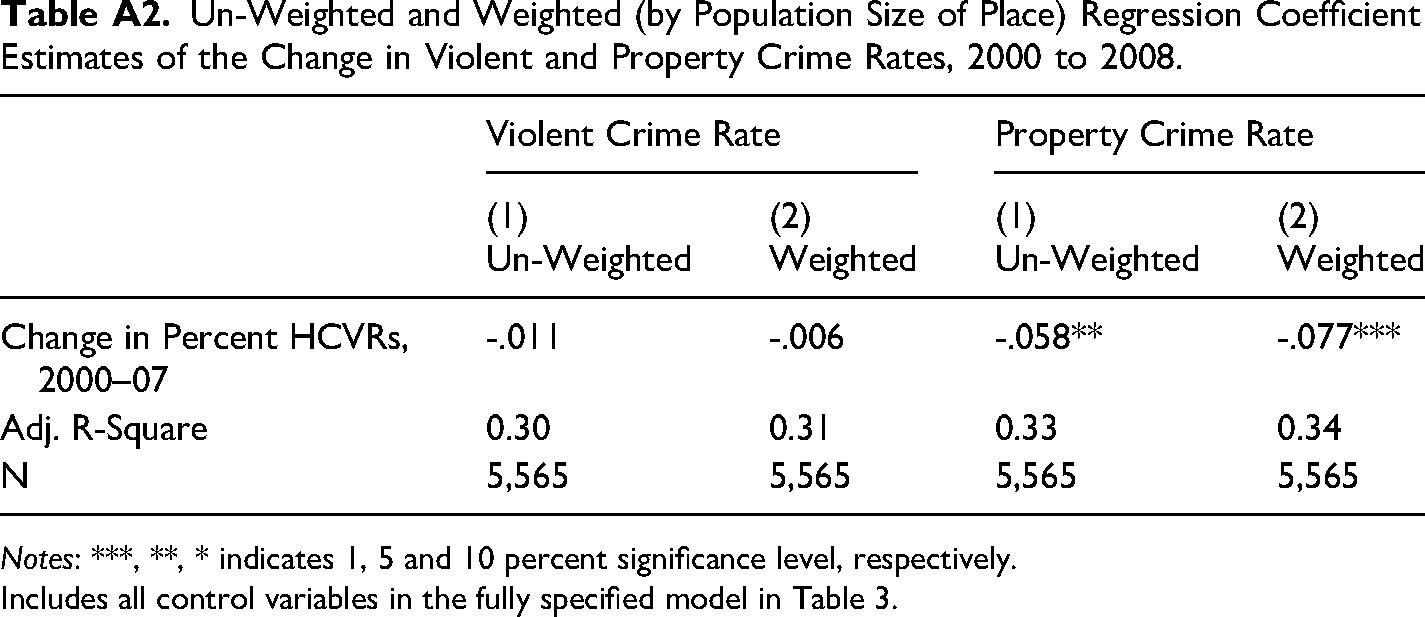
Un-Weighted and Weighted (by Population Size of Place) Regression Coefficient Estimates of the Change in Violent and Property Crime Rates, 2000 to 2008.
| Violent Crime Rate | Property Crime Rate | |||
|---|---|---|---|---|
| (1) |
(2) |
(1) |
(2) |
|
| Change in Percent HCVRs, 2000–07 | -.011 | -.006 | -.058** | -.077*** |
| Adj. R-Square | 0.30 | 0.31 | 0.33 | 0.34 |
| N | 5,565 | 5,565 | 5,565 | 5,565 |
Notes: ***, **, * indicates 1, 5 and 10 percent significance level, respectively.
Includes all control variables in the fully specified model in Table 3.