



Abstract
Previous research that considered African Americans as a homogenous group has determined that they are reluctant to invest in equities and corporate debt bonds, resulting in lost opportunities to build wealth. This study explored financial literacy, age and generational cohort identity, and socioeconomic factors as possible limitations to African Americans’ engagement in financial markets to build wealth. Financial risk tolerance is usually measured using three basic approaches: (a) assessing investment portfolio assets; (b) assessing responses to subjective questions; and (c) assessing responses to hypothetical questions with specific scenarios. The third approach was utilized in this study by conducting a multidimensional risk analysis with a 13-item assessment that addressed the constructs of investment risk, risk comfort and experience, and speculative risk. African Americans appear to be no different from any other group of Americans when provided with education to improve their financial literacy and financial risk tolerance levels, which are critical for reaching long-term wealth goals.
Keywords
The changing financial landscape has mandated that individuals take responsibility for their long-term financial needs. Previous research has concluded that most Americans do not embrace financial markets as a tool for wealth building (Chatterjee et al., 2017; Lusardi, 2005; Yao et al., 2005). This trend is primarily seen in African American households (Fang et al., 2013; Stevenson & Plath, 2002), which have progressed over the past century and a half in pursuing financial independence; some have already achieved this, while the majority still work toward it. Previous studies have found that some segments of the African American population still experience the burden of restrictive financial obligations and low stock ownership (Hanna et al., 2012, 2015; Herbert et al., 2005), low homeownership, and an average income barely above the poverty benchmark (Hanna & Lindamood, 2008).
This study explores financial literacy, generational groups, and socioeconomic factors as possible reasons for African Americans not engaging in financial markets. A significant factor in African Americans’ investment choices is the lack of understanding of risk tolerance (Chattopadhyay & Dasgupta, 2015; Irandoust, 2017; Stevenson & Plath, 2002; van Rooij et al., 2007; Yao et al., 2011). This study's findings indicate that other factors—specifically financial literacy—drive investment asset selection. African Americans appear to have many layers of financial risk tolerance, no different from any other cohort of Americans, when provided with financial education. This study clarifies how different cohorts of African Americans view financial risk tolerance and suggests measures that could impact financial risk tolerance in investment asset selection.
Using wealth as a standard, the middle-class status of African American households is particularly delicate. Furthermore, regardless of class position, African American families are sharply missing from the uppermost quintile (Addo & Darity, 2021; Hoover & Yaya, 2010). When building wealth, an individual's investment portfolio must maximize returns while being diversified enough to minimize risk. Assessment of risk tolerance levels is critical for optimum asset allocation within an individual's investment portfolio. Financial risk tolerance levels determine an individual's appetite for investing in high-risk instruments as part of a portfolio to grow wealth. For example, African American investors with a low risk tolerance level may fail to meet their long-term investment goals and miss opportunities to invest in equities. Likewise, African American investors with a high-risk tolerance may unnecessarily lose wealth by not investing in short-term investments (Sultana & Pardhasaradhi, 2015).
Understanding differences in national generational cohorts is essential when studying the financial well-being of households striving to achieve security (Hanna et al., 2015). Previous research has uncovered a considerable divide between African American and White households (Fang et al., 2013; Hanna & Lindamood, 2008; Hanna et al., 2015; Herbert et al., 2005). Examining the drivers within each national generational cohort increases the opportunity to resolve this disparity, thereby increasing the need for diverse dataset collection methods to identify the drivers of financial risk tolerance. Most researchers have surveyed consumer finance datasets as their data source of choice. For example, Hanna et al. (2015) reviewed previous research covering the period 1996 to 2015; every study but two analyzed consumer finance dataset surveys. This study consisted of original survey data collected from African Americans over 3 years. A crucial concern in the current body of research is that it lumps together African Americans as a homogeneous group with identical financial characteristics. This study assessed African Americans’ financial-literacy levels and the socioeconomic traits that drive their financial risk tolerance behaviors.
A recent headline, “Stocks are soaring, and most Black people are missing out” (Choe, 2020), explores African American reluctance to embrace the financial markets. This reluctance is not new; should we care?
The shift from pensions to retirement type accounts has been a disaster for lower-income, African Americans, Hispanic Americans, non-college-educated, and single workers, who together add up to a majority of the American population (Morrissey, 2019). African Americans rely more heavily on Social Security because of a lack of other income in retirement. Proposals to scale back the popular Social Security system and replace a part of it with private accounts are unlikely to maintain these protections for African Americans to the same degree (Spriggs & Furman, 2006).
Technology has changed how we spend and manage money—including the logistics of investing. The rise of investing apps and online tools has made the investing process practically color blind (Young & Young, 2022). Taking part in the financial markets is more accessible and open today. The question remains—why are African Americans reluctant to embrace financial markets in wealth accumulation?
The remainder of this paper is organized as follows: the literature review and conceptual framework are discussed in sections “Literature Review” and “Conceptual Framework of Financial Risk Tolerance,” respectively. Methodology, empirical results, and concluding remarks are presented in sections “Results Across Risk Tolerance Levels,” “Discussion” and “Conclusion and Implications,” respectively.
Literature Review
Financial Risk Tolerance
Financial risk tolerance is “the maximum amount of uncertainty that someone is willing to accept when making a financial decision” (Grable, 2000, p. 625). The combination of an individual's personality characteristics and socioeconomic background explains, in part, their path to financial success. Grable's (2000) study concluded that demographic, socioeconomic, attitudinal, and other factors can explain only 22% of a person's financial risk tolerance level. The author presented a combination of subjective scenarios and investment choices to obtain a measure of financial risk tolerance related to the concept of economic risk aversion. Confirming earlier studies, respondents who demonstrated good knowledge of fundamental personal finance issues tended to be more risk tolerant. Asking survey questions that gauge one's willingness to assume risk in given situations, Yao et al. (2005) separated financial risk tolerance measures into techniques based on observing risky behaviors. The model's focus was on the willingness to take financial risks rather than portfolio allocation, as financial risk tolerance may better predict future financial behavior than the current portfolio allocation, especially for African Americans with few or no investments. The African Americans surveyed were more than 300% more likely to take substantial investment risks than their White counterparts (Yao et al., 2005).
After controlling for the other variables in the model, Fang et al. (2013) showed that African American respondents were still significantly less likely than the majority of respondents to exhibit some risk tolerance. The study suggested that the actual differences between African Americans and the rest of the population in terms of their likelihood of being in the lowest risk tolerance (highest risk aversion) category might be due to the unwillingness of low-income respondents to risk any loss of income. Thus, the authors concluded that African Americans were significantly less likely than the rest of the population to have some risk tolerance or high-risk tolerance.
A significant shortcoming of the various financial planning measures of risk tolerance—including the Survey of Consumer Finances question related to risk tolerance—is that the concept of financial risk tolerance is not thoroughly connected to economic theory. Hanna et al. (2001) found that actual household behavior does not necessarily match economic models, because most households with deficient levels of liquid assets were not likely to hold high levels of risky assets. The idea that owning high-return assets, such as stocks, can significantly improve a household's net worth was posited by Hanna and Lindamood (2008). Additionally, White households have historically been much more likely to hold stocks than African American households. If African American households were more likely than White households to be inexperienced investors, they would also be more likely to withdraw from stock investments in response to a sharp decline in the market. Hanna et al. (2001) concluded that the economic concept of risk aversion is inversely related to risk tolerance: when risk aversion increases, risk tolerance decreases.
Financial technologies provide products and services online and constitute the most prominent group among financial services providers. Digital services are offered in all relevant domains of personal finance, including investment advice, credit management, and payment services. New providers transfer a high degree of responsibility to customers, requiring them to make more independent decisions than they would in a traditional retail banking relationship. West and Worthington (2014) found that individuals generally reduced their risk tolerance over time; any likely increase in risk tolerance was indicated by higher levels of education, wealth, good health, and self-employment. Königsheim et al. (2017) found that risk attitudes play a fundamental role in accepting financial risk for two reasons. First, as with financial capability, risk preferences have a direct impact on individual financial decisions and the likelihood of using unfamiliar financial products, which are often assessed as riskier than familiar products. Second, risk attitudes usually correlate with the willingness to use new technologies and the readiness to adopt new banking technologies.
Financial Literacy
Financial literacy measures the extent to which a person has mastered essential financial knowledge and acquired the capability to effectively make short- and long-term financial decisions (Remund, 2010; Wang, 2017). More specifically, financial literacy refers to a basic understanding of financial markets, credit management, and other personal finance topics (Hill & Perdue, 2008; Yong & Tan, 2017; Young, 2013). Previous studies found that financially literate individuals are more likely to participate in financial markets than less financially literate individuals (Hastings & Mitchell, 2010; Hung et al., 2009; Kim et al., 2005; Lusardi & Mitchell, 2011, 2008; Young et al., 2017).
Chatterjee et al. (2017) confirmed that financial literacy is negatively associated with being risk-averse and positively associated with being moderately risk tolerant, in terms generally associated with saving for children's college education. The authors concluded that financial literacy plays a vital role in helping individuals with high-risk tolerance financial decision-making, thus confirming that financial literacy was associated with individual risk tolerance levels. Awais et al. (2016) found that investors choose the risk levels that influence their financial decisions. Increased investment experience and financial literacy will lead to embracing higher risk tolerance; investors will then choose risky investment securities to match their higher levels of risk tolerance. A wise investor learns from experience to tackle risky situations and handle them appropriately. Increased levels of financial knowledge, along with an increased ability to analyze investment options and manage portfolios efficiently, allow investors to improve their capacity to jump into risky investments that will earn them higher returns.
Generational Groups
Urbancova and Fajcikova (2019) concluded that significant variations in age exist in various fields of study. Being older is perceived as a positive differentiator. For example, in the education and health sectors, older people tended to have more knowledge essential for their particular fields. Yao et al. (2015) found that age indirectly affects the motives for wealth preservation and for saving to purchase a home through perceived retirement adequacy, presence of related children, household type, and net worth.
Generational research suggests three significant elements found in cohort theory: life stage, shared beliefs and behaviors, and common location in history (Larson et al., 2016; Wolburg & Pokrywczynski, 2001; Yao et al., 2011). Generational cohort theory (Larson et al., 2016) proposes that major historical financial events and societal changes impact individuals when the events occur within their formative years, thus creating distinct behavioral and psychological (e.g., financial) profiles for each generational cohort. Cohorts are defined somewhat differently to generations in that they do not adhere to a birth year but are defined by external events that impact them during late adolescence or early adulthood (Larson et al., 2016; Schewe et al., 2000).
Yao et al. (2011) determined that individuals with similar experiences are likely to exhibit a similar willingness to take financial risks that differ from individuals of another generational cohort. For example, most Generation Y cohorts were in high school when Black Monday happened in October 1987, or when the dot-com bubble collapsed in March 2000. Consequently, their attitudes toward risk might differ from those of Baby Boomers who were in their prime saving years when these events occurred. Both Yao et al. (2011) and Ameriks and Zeldes (2004) asserted that knowledge acquired through first-hand experience has a more substantial influence on an individual decision than knowledge acquired secondhand. Cohort effects would significantly influence financial risk tolerance levels. These findings can be construed as evidence that generational cohort differences play a significant role in the formation of risk attitudes.
Demographic and Socioeconomic Factors
Fisher and Yao (2017) analyzed gender differences in relation to financial risk tolerance and concluded that women were significantly less likely than men to report tolerance for any level of financial risk above the lowest level. The multivariate analysis demonstrated that a gender difference exists when determining risk tolerance, even after adjusting for variables such as age, income, and long-term saving goals. The results indicated that economic factors and demographic characteristics serve as control variables in the relationship between gender and risk tolerance. Although net worth increased risk tolerance for both men and women, it did not affect women as much as men. Shusha (2017) investigated the effects of demographic characteristics on financial risk tolerance. The study found that financial literacy had a positive impact on financial risk tolerance and that education patterns that supported the financial background of respondents were more likely reflected in their high level of willingness to take a risk. Financial literacy appeared to moderate financial risk tolerance for the respondents, regardless of demographic characteristics.
Speelman et al. (2013) determined that demographic factors—mainly gender—and behavioral factors—such as the belief that previous high returns are an indicator of future returns—sway decision-making. Gender is a critical issue, and women are at a disadvantage in their ability to accumulate sufficient funds for retirement as a result of more disrupted work patterns and lower incomes throughout their careers. It seems likely that these disadvantages are reinforced by a gendered tendency to make sub-optimal investment strategy choices. Cantillon et al. (2016) found that female control of finances leads to a conservative approach to financial activity. By contrast, male control of finances did serve to protect the financial interests of men. Chavali and Mohanraj (2016) found that gender was the only demographic variable that impacted investment patterns.
Stevenson and Plath (2002) studied the proportional holdings of risky financial assets of African American portfolios. The absence of corporate debt and equity securities in African Americans’ investment portfolios indicated low risk tolerance. Referencing numerous previous studies, the authors concluded that African Americans, as decision-makers, lack understanding of financial markets and risk tolerance related to socioeconomic factors.
Grable and Joo (2004) found a relationship between financial risk tolerance and a person's environmental factors. More specifically, net worth, marital status, education, household income, and financial knowledge were significant. The authors suggested that the mere existence of environmental factors (e.g., high income, net worth, and financial knowledge) empowered a person to take sizable risks and, in turn, led to an appreciable accumulation of additional environmental factors.
Chattopadhyay and Dasgupta (2015) concluded that aged investors were more risk-averse than their younger, inexperienced counterparts, and that there is a positive and somewhat significant impact of age on their risk tolerance levels. Married investors with children and other dependents were more risk-averse than unmarried investors without dependents and had a lower level. More highly educated respondents demonstrated higher risk tolerance than their less educated counterparts. The authors concluded that demographic characteristics and socioeconomic factors appeared to provide only a starting point in assessing investors’ risk tolerance levels and their impact on their risk attitudes.
Conceptual Framework of Financial Risk Tolerance
This study analyzed the many layers of African American financial risk tolerance by decompressing financial capabilities across the three levels of financial risk tolerance. Financial-literacy levels were studied to determine any relationship that may exist between African Americans’ financial capabilities and their financial levels. A more significant question was whether the environmental factors of generational cohorts impacted financial decisions. Demographic and socioeconomic factors likely played a role in the development of personal financial risk tolerance levels. This study's primary purpose was to identify factors that were likely to have a limiting effect on African Americans’ willingness to embrace financial risk to build wealth.
The financial model guides this study. According to previous research, financial literacy, age, generational cohort, and socioeconomic factors contribute to financial risk tolerance (Figure 1) (Chattopadhyay & Dasgupta, 2015; Irandoust, 2017; Sultana & Pardhasaradhi, 2015; Wang, 2017). Additionally, demographic and socioeconomic factors are effective in measuring the likelihood of financial risk tolerance. For example, previous studies found that females have lower financial risk tolerance than males, and married couples have demonstrated greater financial risk aversion than unmarried individuals (Chattopadhyay & Dasgupta, 2015; Grable & Joo, 2004).
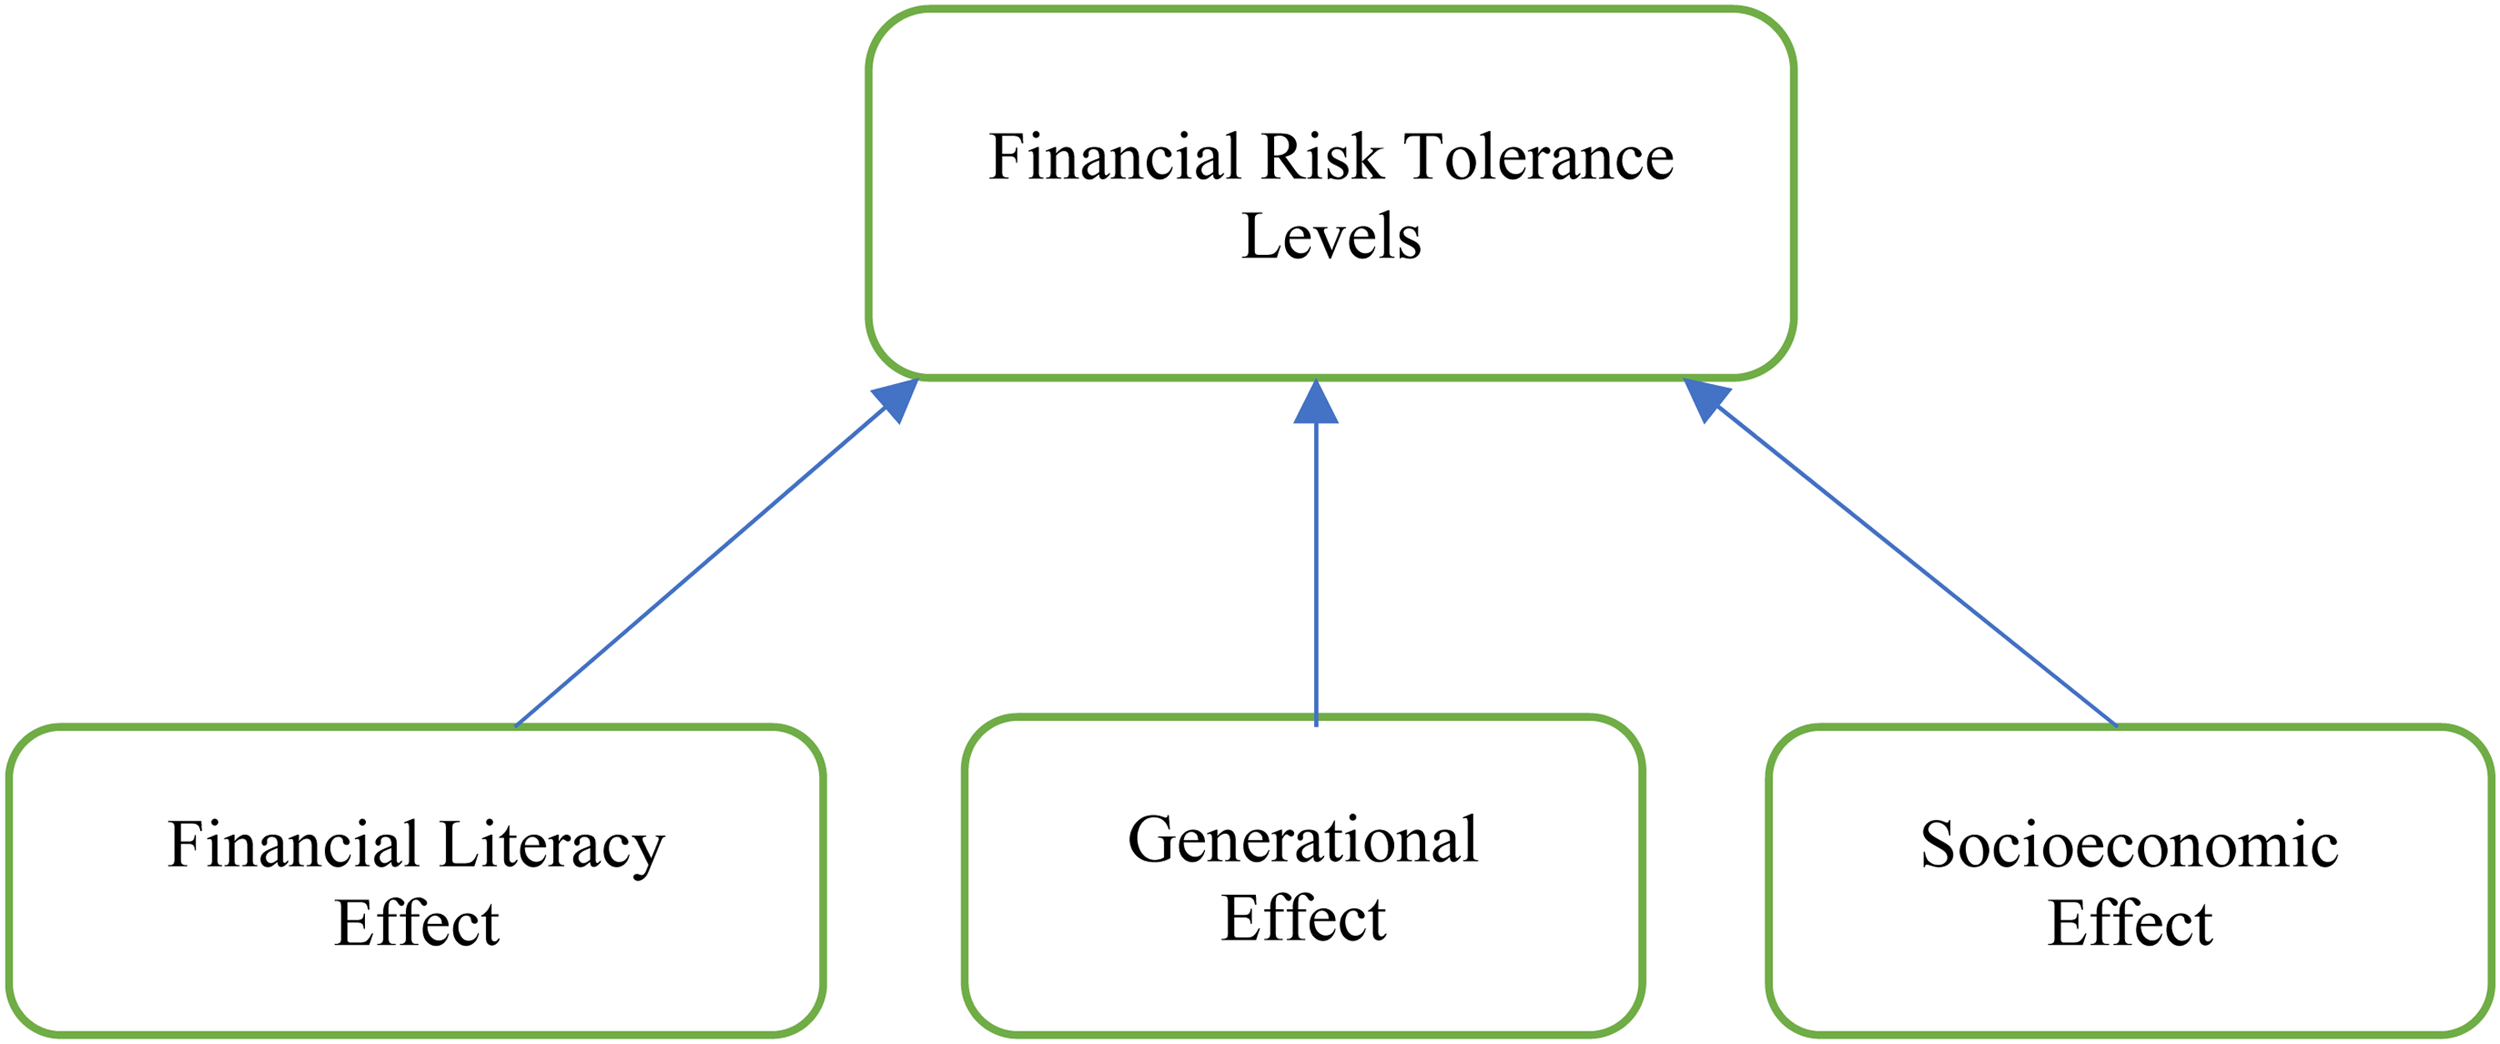
Conceptual framework: financial literacy, generational, and socioeconomic effects on risk tolerance.
Research Questions
There is evidence that African Americans are unwilling to embrace moderate or high-risk paths that could lead to higher net worth (Chatterjee et al., 2017; Chavali & Mohanraj, 2016; Fang et al., 2013; Hanna & Lindamood, 2008). Net worth accumulation for African Americans may directly relate to their levels. Although financial literacy has been used to study wealth accumulation across ethnicities, existing research does not explicitly explore the association among African Americans and their reluctance to embrace financial risk. This study expands existing research by testing a dynamic measure of risk tolerance—financial levels—and its relationship to financial literacy, generational groups, and socioeconomic factors. The first research question addresses whether financial literacy levels relate to greater acceptance of increased financial risk levels by African Americans (low literacy level versus high literacy level) among the three cohorts. The second question addresses whether generational African American cohort groups have different willingness to accept higher financial risk levels (Gen Z: 18-24, Gen Y: 25-39, Gen X: 40-54, Baby Boomers: 55 and older). The third question addresses among the three cohorts whether education levels and household income levels remain significantly related to the willingness to accept higher financial risk levels, while controlling for gender, employment status, and marital status. The research hypotheses are as follows:
Methodology
We chose this study due to the increasing lack of diversity in investment assets among African Americans (Hudson et al., 2017, 2018; Yao et al., 2005; Young et al., 2017). This analysis focuses on the acceptance of financial levels (Chatterjee et al., 2017), which have been associated with greater participation in financial markets to improve wealth accumulation (Chatterjee et al., 2017; Finke and Huston, 2004; Young et al., 2017). Financial risk tolerance is usually measured using three basic approaches: (1) assessing investment portfolio assets; (2) assessing responses to subjective questions; and (3) assessing the responses to hypothetical questions with specific scenarios (Roszkowski & Grable, 2005; Shusha, 2017). The third approach was utilized for this study by conducting a multidimensional risk analysis with a 13-item assessment that addressed the constructs of investment risk, risk comfort and experience, and speculative risk. Grable and Lytton (2003) validated this measure by comparing a composite score of its 13-item scale with asset allocation choice (Grable & Lytton, 1998, 2001, 2003).
The dependent variable for the analysis was a measure of financial risk tolerance developed by Grable and Lytton's (1999) survey instrument study. The questionnaire used a scale of 0 to 39 to determine the respondents’ financial risk tolerance levels. Three binary variables were created based on the survey's responses: low, moderate, and high-risk tolerance. The respondents who scored 25 points or fewer were coded as low levels (Yes = 1; No = 0). The moderate group consisted of the middle third, with risk tolerance scores from 26 to 28 points (Yes = 1; No = 0). The high-risk group at the high end of the scale (top third), consistent with Grable and Lytton's (1999) study, were respondents who scored 29 points or higher (Yes = 1; No = 0).
Financial Literacy Characteristics
The following question measured a respondent's financial-literacy level:
Suppose you had $100 in a savings account, and the interest rate was 2% per year. After five years, how much do you think you would have in the account if you left the money to grow? Imagine the interest rate on your savings account was 1% per year and inflation was 2% per year. After 1 year, how much would you be able to buy with the money in this account? If interest rates rise, what will typically happen to bond prices? A 15-year mortgage typically requires higher monthly payments than a 30-year mortgage, but the total interest paid over the life of the loan will be less. (True or False). Buying a single company's stock usually provides a safer return than a stock mutual fund. (True or False).
An additive scale ranging from 0 to 5 was derived from responses to five financial capability questions. These five questions have been accepted as an industry standard for measuring financial knowledge. The respondents were considered more financially knowledgeable if they answered four or five questions correctly, scoring at least 80%. Those answering three or fewer questions correctly were less financially knowledgeable, scoring 60% or less (Hudson et al., 2017, 2018; Lusardi & Mitchell, 2006; Robb & Woodyard, 2011; Young et al., 2017). The financial knowledge questions used in this survey are well-known and used consistently within previous literature (Chen & Volpe, 2002; Lusardi & Mitchell, 2006; Rowley et al., 2012; Young, 2013).
Generational Characteristics
As stated earlier, generational cohorts were measured as category variables, as follows: (a) Gen Z, aged 18 to 24; (b) Gen Y, aged 25 to 39; (c) Gen X, aged 40 to 54; (d) Baby Boomer, aged 55 and over.
Socioeconomic Characteristics
An online financial risk tolerance survey was used to collect a variety of information, including data related to a respondent's socioeconomic characteristics (e.g., ethnicity, gender, age, etc.). The following variables were included as independent variables: gender, marital status, income level, education level, and employment status. In addition to gender, a binary variable was included to identify married and not married status. Categorical measures of annual household income levels were: (a) less than $50,000; (b) $50,000 to $150,000; and (c) greater than $150,000. Also, categorical measures of education level were: (a) some college or less; (b) college graduate; and (c) postgraduate. Lastly, categorical measures of employment status were: (a) full-time; (b) self-employed; (c) retired; (d) student; and (e) others.
Data Analysis
This study was conducted to estimate the likelihood of having low risk tolerance compared to each of the other risk tolerance levels in isolation. The association between financial risk tolerance levels, financial literacy, generational groups, and socioeconomic factors was investigated in two ways. First, a binomial logistic regression was conducted to establish a baseline relationship between the risk tolerance financial components and the likelihood of low financial risk tolerance. This analysis provided further information on how low financial risk tolerance is associated with financial literacy, age, generational group, and socioeconomic factors (Hudson et al., 2017; Snedker et al., 2002).

Multinormal logit regression was used to test the study's hypotheses comparing three groups of risk takers across three sets of risk impact effects: (a) those who were determined financially literate compared to their non-financially literate counterparts (financial literacy effect); (b) those who were grouped by generation order of birth (generational effect); (c) those who were grouped by gender, marital status, income, education, and employment (socioeconomic effect). We were interested in two specific comparisons. The first is the difference between those who scored as low-risk and those who scored as moderate-risk. We hypothesized that those who scored as low-risk are less likely to be financially literate, less likely to belong to the older generational cohorts, and more likely to be negatively affected by socioeconomic factors. The second is the difference between those who scored as low-risk and those who scored as high-risk. We hypothesized that those who scored as low risk are less likely to be financially literate, less likely to belong to a generational cohort, and more likely to be negatively affected by socioeconomic factors (Benlagha & Karaa, 2017; Pinder, 1996; Seay et al., 2016).
For this study, financial risk tolerance was assumed to be a function of financial literacy levels, generational cohorts, and other socioeconomic characteristics, such as income group, education levels, and employment status (Figure 1).
Risk tolerance level = f (financial literacy level, age and generational cohort, socioeconomic factors)


This study's data was obtained from a 2017 to 2020 online survey using an electronic survey tool administered by the researcher (Qualtrics© software, Provo, UT, USA, 2017), with a convenient sample population consisting of students, alumni, and business professionals associated with a small urban university in the southeastern United States. 1 The online survey questionnaire was based on Grable and Lytton's (1999) revisited risk tolerance assessment instruments. The data set consisted of 570 African American respondents. After adjusting for incomplete responses, the final sample set consisted of 556 African American respondents, who were asked to complete the risk tolerance and financial literacy sections of the survey, along with a set of demographic questions.
Results Across Risk Tolerance Levels
Sample Characteristics
The sample characteristics in Table 1 were based on African Americans who completed the survey (n = 556). The sample consisted of a convenience sample and had limited generalizability to the African American population, which placed some limitations on the study. Overall, the sample set was dominated by female respondents (70.3%). Unmarried households had a 2.5:1 advantage overall; these unmarried households heavily weighted to the lower financial risk level, with about 70% of respondents classified as having moderate or low risk levels. Surprisingly, the low financial literacy group maintained a dominant position at every level of risk tolerance, especially at the low end of the scale, with 78% of respondents, compared to 66.7% overall. Generational cohorts were more evenly distributed, except for Generations Z and Y, which had 10% more respondents than each of the other groups. Additionally, Generations Z and Y were favored (1.6:1) in the low risk tolerance category. For income level, the dominant group of respondents fell within the less than $50,000 and less than $150,000 groups (47.3%) and constituted the largest group across all levels of financial risk tolerance (48.5%, 45.4%, and 47.7%, respectively, across risk tolerance levels). The number of postgraduate respondents (49%) was comparable to college graduates (21.9%); respondents with less than a 4-year college degree (29.1%) when combined with college graduates represented the majority (51%). From an employment perspective, respondents working full-time comprised 47.2% of the dataset, with students being the next largest group (20.5%).
Demographic and Socioeconomic Characteristics of African American Survey Results.

Two logistic regression analyses were performed on three African Americans’ cohorts; this technique allows the moderating effects to be studied by introducing interaction terms produced by two or more variables into the logistic regression model (Menard, 2002). Each independent variable's contribution and the significance of its logit coefficient β (odds ratio [OR]) were evaluated by the log-likelihood ratio test, one of the most effective tests. The OR can be interpreted directly to indicate an independent variable's effect on the odds (likelihood) of success. The percentage change in the odds can also be calculated using the following formula: (100 × [OR − 1]) (Menard, 2002).
Logistic Regression Results
The binary logistic regression model that predicted the likelihood of low risk tolerance levels of African Americans in the full sample can be found in Table 2. Consistent with the literature, low financial literacy levels are positively associated with low financial risk tolerance levels (Hastings & Mitchell, 2010; Hung et al., 2009; Kim et al., 2005; Lusardi & Mitchell, 2011, 2008; Young et al., 2017). More specifically, the odds of respondents having low financial literacy were 90.8% (p < .001) greater than having high financial literacy. Generational cohort did not have a significant association with respondents’ risk tolerance levels, resulting in a departure from findings in previous literature that older adults are less risk-tolerant than young respondents (Ameriks & Zeldes, 2004; Larson et al., 2016; Schewe et al., 2000; Yao et al., 2011). Income levels had the next most significant effects. Respondents with an income level of less than $50,000 were 62.7% (p < .01) less likely to be classified as a low risk-tolerant respondent. However, there were marginally more significant results (p < .10) when respondents’ income eclipsed the $50,000 point; the odds drop to them being 43.2% less likely to be classified as having low-risk tolerance. Interestingly, retirees were 75.5% (p < .01) less likely to be classified as low-risk-tolerant respondents. No significant differences were found in levels of education, marital status, or gender.
Binary Logistical Analysis of the Likelihood of Being Financially Low-Risk Tolerant (Financial Literacy Effect, Generational Effect, and Socioeconomic Effect).

Note. 1: †p < .10, *p < .05, **p < .01, ***p < .001; OR = odds ratio; Note 2: The exponentiated coefficient minus one and times 100 gives the percentage increase or decrease due to a one-unit change in the independent variable.
Multinomial Logistic Results
The purpose of the second stage of the analysis was to better isolate the link between the risk tolerance levels and financial literacy effect, generational effect, and socioeconomic effect. The results of the multinomial logistic regression analysis can be found in Table 3.
Multinomial Logistical Analysis of the Likelihood of Being More Financially Risk Tolerant (Financial Literacy Effect, Generational Effect, and Socioeconomic Effect).

Note. 2: †p < .10, *p < .05, **p < .01, ***p < .001; OR = odds ratio; Note 2: The exponentiated coefficient minus one and times 100 gives the percentage increase or decrease due to a one-unit change in the independent variable.
Low-Risk Versus Moderate-Risk
The first model (Table 3: moderate risk column) specifically investigated the differences between African Americans who scored a moderate risk tolerance level and those who scored a low risk tolerance level. An analysis of the financial literacy levels showed that low-risk tolerant respondents were 125.2% (p < .01) more likely than the moderate risk takers to score at a low financial literacy level. Membership in generational cohort groups was not significant for respondents who scored in the moderate-risk group. Unexpectedly, gender, employment status, marital status, education level, and household income levels did not significantly impact respondents’ risk tolerance levels compared to moderate to low-risk takers.
Low-Risk Versus High-Risk
The second model (Table 3: high risk column) within the multinomial logistic analysis estimated the likelihood that an African American person would score in the low-risk tolerant group compared to the high-risk tolerant group. An analysis of African Americans’ financial literacy levels and risk tolerance revealed that when high-risk takers are compared to low-risk takers, high risk-tolerant respondents were 134.5% (p < .001) less likely to score at a low financial literacy level. Membership in generational cohort groups was not significant for respondents who scored in the high-risk tolerance range. Conversely, when reviewing high risk takers, gender played a significant role: male respondents were 85.7% (p < .05) more likely to be classified as high risk-tolerant than female respondents. As expected, household income of less than $50,000 contributed significantly to the likelihood of being a low-risk taker. The respondents in this income group were 62.9% (p < .05) less likely to be classified at the high-risk tolerance level than respondents with more than $150,000. Additionally, respondents with household incomes between $50,000 and $150,000 were 46.7% (p < .10) less likely to be classified at the high-risk level than low-risk respondents. Interestingly, retirees were 72.2% (p < .05) less likely to be classified as low risk tolerant respondents. Further, generational cohorts, education level, and marital status did not appear to significantly impact respondents’ risk tolerance at the high-risk level.
Discussion
This study explored the relationship between financial literacy, generational groups, socioeconomic factors, and African Americans not engaging in financial markets. It was conducted through the lens of African Americans’ investment choices, which indicate an individual's financial risk tolerance levels (Chattopadhyay & Dasgupta, 2015; Irandoust, 2017; Stevenson & Plath, 2002; van Rooij et al., 2007; Yao et al., 2011). Analysis of the convenience data obtained from the 2017 to 2020 online Qualtrics survey found support for research Hypothesis 1, suggesting that financial literacy is negatively associated with low financial risk tolerance levels. Specifically, the results from Table 2 (low-risk versus all other risk levels) and Table 3 (low-risk versus moderate and high-risk) found that African Americans who correctly answered at least four of five questions on financial literacy mastery were significantly less likely to be low risk tolerant. African American respondents with a high level of financial literacy negate the trends put forward in the literature across all levels of financial risk tolerance. The financial-literacy analysis results support the rejection of the hypothesis that African Americans’ financial-literacy levels are negatively related to their willingness to take higher risks in building wealth. This finding is contrary to Lusardi's (2005) conclusion that financial education does not affect African Americans’ portfolio choices. Financial literacy is concerned with more than personal budgeting and reviewing one's credit score (Remund, 2010; Wang, 2017). Understanding essential financial concepts such as compound interest, the impact of inflation on buying power, and diversification is required for individuals to take the right steps toward financial success. The respondents who mastered these concepts embraced moderate to high levels of risk tolerance.
Surprising results were found related to Hypothesis 2, which suggested that generational factors would be negatively related to low financial risk tolerance levels. The results indicated no significant relationship between a respondent's generational factors and an individual's low risk tolerance level. The most unexpected findings imply that being young adults, compared to older adults, did not affect the respondent's financial risk tolerance level. However, Baby Boomers appeared to be the most likely respondents to be classified as highly risk-tolerant. The generational cohort group analysis results did not support the hypothesis that African Americans’ generational cohort groups negatively influence their willingness to take higher risks in building wealth.
Mixed results were found in relation to Hypothesis 3, which suggested that socioeconomic factors would be negatively related to low financial risk tolerance levels. As hypothesized, the results indicated a negative relationship between a respondent's self-reported household income and low financial risk tolerance. However, from Table 3, high-risk tolerant males are about 2:1 more times likely than females to be low-risk tolerant. The most surprising socioeconomic factor was household income, which had a significant impact when comparing respondents earning more than $150,000 to less than $50,000 at the low and high-risk tolerance levels. Household income appears not to be a limiting factor when evaluating African Americans’ financial risk attitudes. Formal education seemed not to significantly impact the financial risk tolerance equation across all risk tolerance levels. However, respondents with formal education are less likely to be low risk-tolerant and more likely to be high risk-tolerant, but not significantly. Financial risk tolerance levels do not equate to formal education but are instead a separately developed skillset.
Female respondents appeared to follow the findings of the literature at the low and high-risk tolerance levels. The findings supported previous research by Stevenson and Plath (2002) that referenced numerous studies in which female African American decision-makers lacked understanding of financial markets and risk tolerance levels. Marital status, employment status, and formal education levels failed to demonstrate a significant relationship when compared to low-risk takers.
Conclusion and Implications
This study is of specific importance to policymakers, financial educators, financial counselors, and financial planners. From a policy perspective, this research suggests that low risk-tolerant African Americans have a systematically lower understanding of basic financial concepts. Parameter estimates from logistic specifications indicate that the likelihood of risk-seeking behavior was affected most by financial literacy and gender and, to a lesser extent, by income groups. African American women live longer than African American males, and in many families, they handle the financial resources; it would appear that bridging the gender gap is a means of financial survival (Young et al., 2017).
African Americans appear no different from any other group of Americans when provided with financial education that can improve financial literacy and financial risk tolerance levels, which are critical for reaching long-term wealth goals. The fact that financial risk tolerance is strongly related to financial literacy has critical implications for wealth building. Findings from this study provide some insight into the significance of financial risk tolerance diversity among African Americans. In particular, financial risk tolerance was positively associated with financial literacy levels, which suggests evidence that there is a tangible benefit in financial education. All Americans, including African Americans, would benefit from financial education, and financial planners—as community partners—have an opportunity to expand their client base by engaging in financial education.
Overall, this research reinforces concerns noted in previous studies about African Americans’ ability to embrace different levels of risk in wealth-building opportunities (Chatterjee et al., 2017; Hanna et al., 2012; Herbert et al., 2005; Lusardi, 2005; Yao et al., 2005). This study reinforces Hamilton and Darity’s (2017) conclusion that improved access to higher education alone does not significantly address the wealth gap. Further, not all financial education has the same outcomes, and the focus of the training must move toward financial capabilities, not just consumer awareness. The world of financial services can often be intimidating. As the economic landscape is ever-changing and with more freedom available, it's easy to assume that families benefit from understanding their finances. Financial policymakers, in requesting financial education options, should consider multiple community outreach programs, not just K-12 outlets. For example, community-based programs, employer-based programs, and free online courses are essential starting points. When equipped with appropriate financial education, most Americans would embrace diversification in wealth building and retirement planning.
There were a few limitations to this study. To the extent the sample is not a broad representation of the African American population, the parameter estimates could be biased upward or downward. This study implies a need for future research on financial literacy versus primary financial education, such as analyzing financial risk tolerance levels or portfolio composition of a sample with the same set of similar financial behaviors, with ethnicity being the only difference. Further, by increasing the target number of African American households, it would be possible to conduct a robust analysis of financial education's effects on African Americans’ financial risk tolerance levels.
Footnotes
Declaration of Conflicting Interests
The authors declared no potential conflicts of interest with respect to the research, authorship, and/or publication of this article.
Funding
The authors received no financial support for the research, authorship, and/or publication of this article.
