
Abstract
OBJECTIVE
The prognostic significance of dynamic lactate trajectories in patients with acute kidney injury (AKI) remains unclear. This study aimed to identify distinct lactate trajectory patterns in critically ill AKI patients and assess their associations with mortality risk.
METHODS
This retrospective cohort study of critically ill patients with AKI was developed and validated using two independent ICU databases (MIMIC-IV v3.1 and eICU-CRD v2.0). Group-based trajectory modeling was applied to identify distinct lactate trajectory patterns based on measurements from the first 4 days of ICU admission. The associations between these trajectories and mortality were evaluated using Kaplan-Meier survival analysis, multivariable Cox regression, subgroup analyses, and model performance metrics (receiver operating characteristic curve, decision curve analysis and reclassification indices).
RESULTS
The MIMIC-IV cohort comprised 2,816 patients (40.6% female), in whom four distinct lactate trajectories were identified. In the fully adjusted model, compared with Class 1 (normal-level-stable), Class 2 (moderate-level-declining) had a marginally elevated adjusted mortality risk during hospitalization, which was not sustained over the longer term. Conversely, Class 4 (high-level-stable) showed the highest risk [HR 3.95 (95% CI, 3.07-5.10) for in-hospital mortality, 3.55 (95% CI, 2.76-4.58) at 30 days, 3.33 (95% CI, 2.63-4.22) at 90 days, and 3.12 (95% CI, 2.49-3.91) at 365 days; all P < 0.001]. The model incorporating lactate trajectories demonstrated incrementally improved predictive accuracy compared to the baseline SOFA score model, with AUCs ranging from 0.626 to 0.650 across all endpoints. For all mortality endpoints, lactate trajectories provided incremental predictive value (NRI 0.099–0.3179, IDI 0.027–0.0442; all P < 0.001). An external validation cohort of 429 patients (42.2% female) from the eICU 2.0 database confirmed associations.
CONCLUSIONS
Early dynamic lactate trajectories are independently associated with short- and long-term mortality risk in critically ill AKI patients and may provide more incremental prognostic value than static measures.
Introduction
Acute kidney injury (AKI) is a common and serious complication in critically ill patients, with an incidence exceeding 50% in the Intensive Care Unit (ICU).1–3 AKI not only increases the risk of in-hospital mortality but is also closely associated with long-term renal dysfunction, cardiovascular events, and diminished quality of life.4,5 Therefore, early risk stratification to identify high-risk patients and the implementation of precise interventions are crucial for improving the prognosis of AKI.
Serum lactate is a widely accepted biomarker of tissue hypoxia and metabolic dysregulation. 6 Its levels integrate comprehensive information regarding circulatory perfusion, organ function, and cellular metabolism.7–10 Hyperlactatemia is strongly associated with mortality in critically ill populations.11–13 Lactate metabolism is particularly relevant in AKI. This is because renal impairment reduces its clearance, while the associated inflammation and hemodynamic instability further disrupt this balance.7,14,15 Previous studies in AKI have relied on single lactate measurements, which cannot reflect dynamically changing conditions.16,17 Tracking lactate trajectories may better capture the evolving pathophysiology and more accurately identify high-risk patients. However, the association between dynamic lactate trajectories and prognosis in AKI has not been examined.
To address this research gap, we applied group-based trajectory modeling (GBTM) to identify dynamic lactate trajectory subtypes in critically ill AKI patients during hospitalization. 18 Furthermore, we assessed the associations between different trajectory patterns and both short- and long-term mortality. The prognostic performance of the lactate trajectory model was systematically compared with traditional single-point or static lactate measurements. To enhance the reliability and generalizability of the findings, the analysis was first performed in a primary cohort and then validated in an independent external cohort. We hypothesized that lactate trajectories were associated with mortality in critically ill patients with AKI.
Methods
Study design
This study was a retrospective cohort study that utilized fully de-identified data from two publicly available critical care databases: the Medical Information Mart for Intensive Care IV (MIMIC-IV, Version 3.1) and the eICU Collaborative Research Database (eICU-CRD, Version 2.0).19,20 The primary analysis cohort was derived from MIMIC-IV database. MIMIC-IV contains records of 94,458 ICU stays for 65,366 unique adult patients admitted to the Beth Israel Deaconess Medical Center (Boston, Massachusetts) between 2008 and 2022. For external validation of the observed associations, we utilized eICU-CRD, a multi-center ICU database comprising data from over 200 hospitals across the United States for the years 2014 and 2015. These databases contain a wide range of data, including demographics, laboratory results, vital signs, diagnoses, treatment records, and survival outcomes. These comprehensive data make the databases appropriate resources for longitudinal trajectory analysis, specifically for investigating the association between lactate dynamics and mortality risk in critically ill patients with AKI. The study was conducted in accordance with the Helsinki Declaration of 1975, as revised in 2024. The creation and release of the MIMIC-IV database were approved by the Institutional Review Boards of Beth Israel Deaconess Medical Center (2001-P-001699/14) and Massachusetts Institute of Technology (No. 0403000206), which waived the requirement for individual informed consent due to the de-identified nature of the data. The eICU-CRD comprises fully de-identified data and is released under the Health Insurance Portability and Accountability Act (HIPAA) safe harbor provision (Certification No. 1031219-2). Therefore, its use for this research is considered exempt from ethics approval, with a waiver of informed consent. Author Xiaofan Tan obtained authorized access to these databases by the Massachusetts Institute of Technology Affiliates (Record ID: 70211557). The reporting of this study strictly adhered to the Strengthening the Reporting of Observational Studies in Epidemiology (STROBE) guidelines for observational studies. 21
Study participants
This study included adult patients (≥18 years) admitted to the ICU for the first time. The inclusion criteria were a diagnosis of AKI and the availability of at least one lactate measurement every 24 hours within the first 4 days following ICU admission. We analyzed lactate trajectories over this initial 4-day period (96 hours), as this early window is commonly used in critical care to capture initial prognostic trends.22,23 The exclusion criteria were as follows: (1) age < 18 years, (2) multiple ICU admissions, and (3) missing critical data. In the primary cohort, AKI was defined according to the Kidney Disease Improving Global Outcomes (KDIGO) criteria, based on data within the first 48 hours of ICU admission. 24 In the validation cohort, pre-ICU baseline creatinine was unavailable and urine output records were frequently missing, precluding the reliable use of KDIGO criteria. Therefore, AKI was identified using relevant International Classification of Diseases (ICD-9/ICD-10) diagnosis codes.
The selection processes for the primary MIMIC-IV and validation eICU cohorts are illustrated in Figure 1. For the MIMIC-IV cohort, from an initial 94,458 ICU records, 65,366 first admissions were identified. Among these, 38,033 patients had AKI. After further excluding 35,217 patients due to incomplete lactate data, the final cohort comprised 2,816 patients with complete 4-day lactate profiles for trajectory modeling. A parallel selection process was applied to the eICU-CRD database, yielding a final validation cohort of 432 patients. The flowchart of patients’ selection.
Lactate trajectory grouping method
This study employed the GBTM method using quadratic polynomials to identify distinct dynamic patterns of lactate levels. 18 This approach utilizes maximum likelihood estimation to identify patient subgroups that share similar temporal trajectories of serum lactate concentration. The optimal number of trajectories was selected by comparing models with 2 to 5 classes, using the lowest Akaike Information Criterion (AIC), Bayesian Information Criterion (BIC), and Sample-Size Adjusted BIC (SABIC), alongside the highest entropy. The adequacy of class separation was evaluated by ensuring that the average posterior probability for all classifications exceeded 0.70. Clinical interpretability was also considered.
Data collection
We employed Structured Query Language (SQL) to extract relevant baseline patient information, which comprised demographic characteristics, vital signs, laboratory parameters, comorbidities, clinical severity scores, as well as medical procedures. All clinical assessments, including laboratory results and diagnostic procedures, were conducted within the first 24 hours following ICU admission.
Outcome measures
The outcome was all-cause mortality, including in-hospital, 30-day, 90-day, and 365-day mortality in the primary cohort. In the validation cohort, the outcome was in-hospital mortality.
Statistical analysis
Continuous variables were summarized as mean ± standard deviation (SD) for normally distributed data and median with interquartile range (IQR) for non-normally distributed data. Categorical variables were expressed as frequencies (percentages). Differences among the lactate trajectory groups were evaluated using the following tests: the chi-square or Fisher’s exact test for categorical variables, one-way ANOVA for normally distributed continuous variables, and the Kruskal-Wallis test for non-normally distributed continuous variables. Missing data, which accounted for less than 5% of the dataset, were handled using complete-case analysis.
Kaplan-Meier survival curves were constructed to visualize and compare the cumulative survival rates among different lactate trajectory groups, with the log-rank test employed to assess the statistical significance of differences in survival distributions. Cox proportional hazards regression models were used to assess the association between lactate trajectory classes and mortality, with Class 1 serving as the reference group for calculating hazard ratios (HR) and their 95% confidence intervals (95% CI). Confounders were selected based on previous scientific literature and their clinical relevance. In primary cohort, we constructed four sequential multivariate models: Model 1 was unadjusted. Model 2 was adjusted for sex and age. Model 3 was further adjusted for comorbidities. Model 4 was additionally adjusted for laboratory parameters, severity of illness scores, and early interventional measures.25,26 In validation cohort, we constructed three sequential multivariate models: Model 1 was unadjusted. Model 2 was adjusted for sex and age. Model 3 was further adjusted for laboratory parameters, comorbidities, and severity of illness scores.
In primary cohort, a pre-specified subgroup analysis was performed to assess whether the association between lactate trajectories and mortality was consistent across different patient subgroups. Subgroups were defined by sex (female/male), age (<65/≥ 65 years), congestive heart failure (yes/no), renal disease (yes/no), sepsis (yes/no), and diabetes (yes/no). The subgroup effect differences were tested by incorporating interaction terms into the Cox proportional hazards models, with a statistical significance level set at P < 0.05 for the presence of an interaction. Further, two sensitivity analyses were performed to evaluate the robustness of our findings. First, we repeated the primary analysis in the subgroup of AKI patients without malignant cancer. Second, to address the impact of differing AKI definitions, we identified an alternative AKI population within the MIMIC-IV database using ICD-9/ICD-10 codes instead of KDIGO criteria. In this redefined cohort, we then re-identified lactate trajectories and repeated the Cox regression analysis.
To assess the incremental value of lactate trajectory in predicting the mortality risk, we constructed and compared a series of predictive models. Prediction models were constructed using logistic regression for in-hospital mortality and Cox regression for 30-day, 90-day, and 365-day mortality. A baseline model was established using the Sequential Organ Failure Assessment (SOFA) score. 25 Subsequently, we developed three enhanced models by incorporating lactate trajectory, a single lactate measurement, or lactate level quartiles, respectively. The discriminative ability of these models was assessed via receiver operating characteristic (ROC) curve analysis, calculating the area under the ROC curve (AUC) for predicting in-hospital, 30-day, 90-day, and 365-day mortality. Additionally, decision curve analysis (DCA) was employed to evaluate the clinical net benefit of each prediction model across different risk thresholds. To further quantify the incremental predictive value of the lactate-related indicators, the continuous net reclassification improvement (NRI) and integrated discrimination improvement (IDI) were calculated, along with their 95% confidence intervals.
In the eICU validation cohort, model performance was also evaluated using the AUC, DCA, and reclassification indices (NRI/IDI) to assess the generalizability of the findings.
All statistical analyses were performed using R version 4.2.2 (https://www.R-project.org) and Free Statistics software version 2.4.0 (https://www.clinicalscientists.cn/freestatistics), respectively. 27 For all analyses, a two-tailed P value < 0.05 was considered statistically significant.
Results
Dynamic evolution of lactate trajectories
The final study population comprised 2,816 patients in the primary cohort and 429 in the validation cohort (Figure 1). We then applied the GBTM method to identify the optimal number of lactate trajectories by comparing models with 2 to 5 classes. In the primary cohort, the four-class model was selected as it yielded lower values for the AIC (150075.51), BIC (150224.08), and SABIC (150144.65), along with an acceptable entropy value (0.74). Furthermore, each of the four classes contained more than 5% of the participants, meeting the recommended threshold for clinical interpretability (Supplemental Table 1). The four-class model also demonstrated robust classification accuracy, as evidenced by high average posterior probabilities for class membership (Class 1: 0.8818; Class 2: 0.7958; Class 3: 0.8691; Class 4: 0.924) (Supplemental Table 2). Similar trends were observed in the validation cohort (Supplemental Tables 1 and 2). Based on these results, the four-class model was determined to be the optimal solution for characterizing lactate trajectories in both cohorts.
Figure 2 displays the four distinct lactate trajectory classes identified. In the primary cohort, Class 1 included 1,229 patients (43.64%), Class 2 contained 829 (29.44%), Class 3 comprised 561 (19.92%), and Class 4 consisted of 197 (7.00%). A similar distribution was observed in the validation cohort, with 157 (36.34%), 96 (22.69%), 117 (27.08%), and 59 (13.89%) patients assigned to Classes 1 to 4, respectively (Supplemental Table 1). The trajectory patterns were characterized as follows: Class 1 maintained persistently low lactate levels (normal-level-stable); Class 2 displayed a moderate-level, declining pattern (moderate-level-declining); Class 3 was characterized by a high-level, declining trajectory (high-level-declining); and Class 4 exhibited persistently high lactate levels (persistent high-level). These distinct patterns were consistently observed across both cohorts. Quantitative lactate levels for each class are summarized in Supplemental Table 3. Lactate trajectories over the first 4 days (96 hours) following ICU admission in the (A) primary (MIMIC-IV) and (B) validation (eICU-CRD) cohorts. Four distinct trajectory classes were identified: Class 1 (normal-level-stable): persistently low lactate levels; Class 2 (moderate-level-declining): moderately elevated levels that decline; Class 3 (high-level-declining): high initial levels that decline; Class 4 (persistent high-level): persistently elevated levels. Shaded areas denote 95% confidence intervals.
Baseline characteristics
Baseline characteristics of patients stratified by lactate trajectory groups in MIMIC-IV.

Data are presented as: mean ± standard deviation (SD) for normally distributed variables, median (interquartile range, IQR) for skewed variables, and numbers (proportions) for categorical variables. Abbreviations: SBP: systolic blood pressure; DBP: diastolic blood pressure; MBP: mean blood pressure; WBC: white blood cell; BUN: blood urea nitrogen; Spo2: peripheral oxygen saturation; SOFA: Sequential Organ Failure Assessment; CRRT: continuous renal replacement treatment, bpm: beats per minute.
Kaplan-Meier survival curve analysis
Kaplan-Meier survival analysis demonstrated significantly different survival distributions among the four lactate trajectory groups for in-hospital, 30-day, 90-day, and 365-day mortality in the primary cohort (log-rank test, P < 0.001). The survival rates were highest in Class 1 and sequentially decreased through Class 2 and Class 3 to the lowest in Class 4 (Figure 3). This association was consistently observed in the validation cohort when assessing in-hospital mortality (Supplemental Figure 1). Kaplan-Meier survival curves for in-hospital, 30-day, 90-day, and 365-day all-cause mortality stratified by lactate trajectories in MIMIC-IV. (A) In-hospital mortality. (B) 30-day all-cause mortality. (C) 90-day all-cause mortality. (D) 365-day all-cause mortality.
Multivariable cox regression analysis between lactate trajectories and all-cause mortality
Results of the primary cohort
Association between lactate trajectories and mortality in patients with AKI in MIMIC-IV.
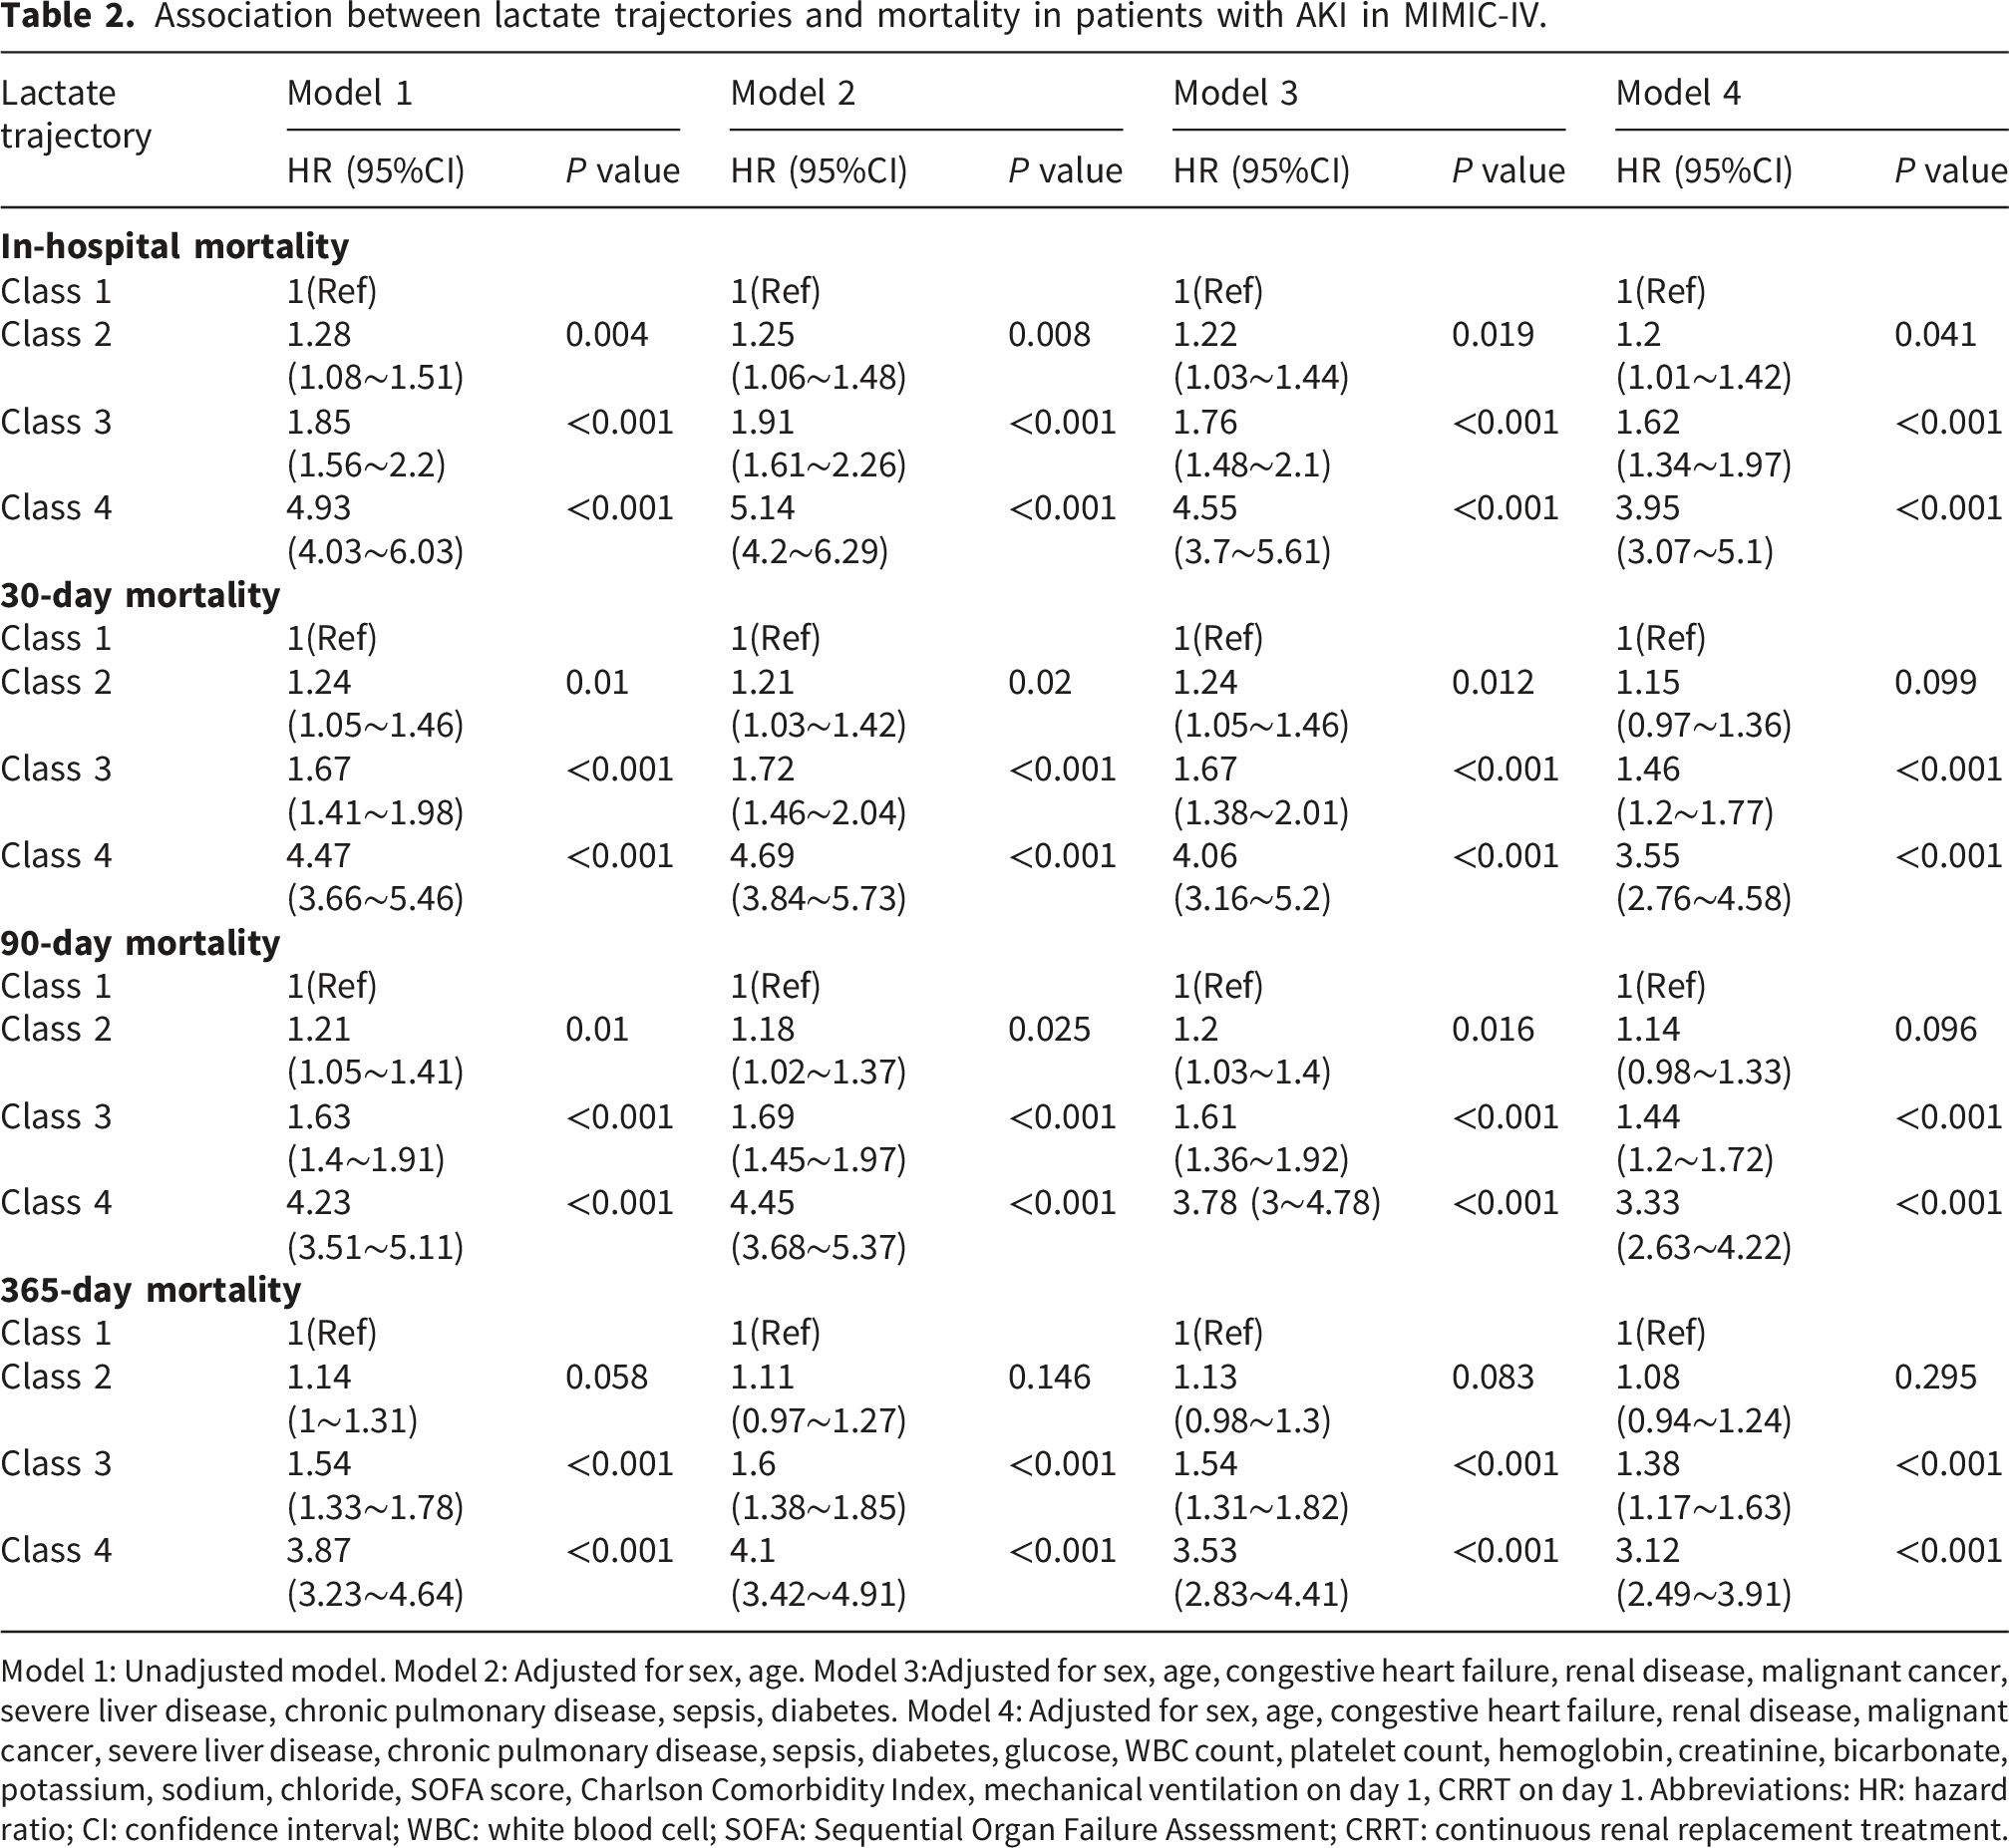
Model 1: Unadjusted model. Model 2: Adjusted for sex, age. Model 3:Adjusted for sex, age, congestive heart failure, renal disease, malignant cancer, severe liver disease, chronic pulmonary disease, sepsis, diabetes. Model 4: Adjusted for sex, age, congestive heart failure, renal disease, malignant cancer, severe liver disease, chronic pulmonary disease, sepsis, diabetes, glucose, WBC count, platelet count, hemoglobin, creatinine, bicarbonate, potassium, sodium, chloride, SOFA score, Charlson Comorbidity Index, mechanical ventilation on day 1, CRRT on day 1. Abbreviations: HR: hazard ratio; CI: confidence interval; WBC: white blood cell; SOFA: Sequential Organ Failure Assessment; CRRT: continuous renal replacement treatment.
In the fully adjusted model (Model 4), Classes 3 and 4 remained significantly associated with elevated mortality risk across all time points: in-hospital mortality [Class 3: HR = 1.62 (95% CI 1.34-1.97), P < 0.001; Class 4: HR = 3.95 (95% CI 3.07-5.1), P < 0.001], 30-day mortality [Class 3: HR = 1.46 (1.20-1.77), P < 0.001; Class 4: HR = 3.55 (2.76-4.58), P < 0.001], 90-day mortality [Class 3: HR = 1.44 (1.20-1.72), P < 0.001; Class 4: HR = 3.33 (2.63-4.22), P < 0.001], and 365-day mortality [Class 3: HR = 1.38 (1.17-1.63), P < 0.001; Class 4: HR = 3.12 (2.49-3.91), P < 0.001]. Although Class 2 had a modestly higher risk of in-hospital mortality than Class 1 [HR=1.20 (1.01-1.42), P = 0.041], no significant differences in risk were observed at 30, 90, or 365 days in Model 4 (all P > 0.05).
Results of the validation cohort
Association between lactate trajectories and in-hospital mortality in patients with AKI in eICU.

Model 1: Unadjusted model. Model 2: Adjusted for sex, age. Model 3:Adjusted for sex, age, WBC count, hemoglobin, glucose, creatinine, potassium, renal disease, severe liver disease, sepsis, diabetes, mechanical ventilation on day 1, dialysis on day 1, Charlson Comorbidity Index, SOFA. Abbreviations: HR: hazard ratio; CI: confidence interval; WBC: white blood cell; SOFA: Sequential Organ Failure Assessment.
Prognostic and incremental value of lactate-related indicators in predicting mortality
Results of the primary cohort
In the MIMIC-IV cohort, the model incorporating lactate trajectories demonstrated the highest predictive accuracy across all mortality endpoints (Figure 4). For in-hospital mortality, the model incorporating lactate trajectories achieved an AUC of 0.650 (95% CI: 0.628-0.672), higher than the AUCs of the SOFA score-based baseline model [0.603 (95% CI: 0.580-0.625)], the model incorporating the single lactate measurement [0.610 (95% CI: 0.588-0.632)], and the model incorporating lactate quartiles [0.608 (95% CI: 0.585-0.630)]. A similar trend was observed for mortality at 30-day [0.630 (95% CI: 0.608-0.653)], 90-day [0.626 (95% CI: 0.604-0.647)], and 365-day [0.634 (95% CI: 0.594-0.674)]. Decision curve analysis confirmed its higher net clinical benefit across a wide range of threshold probabilities (Figure 4). Furthermore, the addition of lactate trajectories to the baseline model yielded modest but statistically significant incremental predictive value for all endpoints, with NRI ranging from 0.099 to 0.3179 and IDI from 0.027 to 0.0442 (all P < 0.001). Models incorporating single lactate values or quartiles showed weaker and less consistent improvements (Table 4). Incremental prognostic value of dynamic lactate trajectories over static lactate measures for mortality prediction in AKI patients from the MIMIC-IV database. (A, C, E, G) receiver operating characteristic curves assessing the predictive performance of the four models for in-hospital, 30-day, 90-day, and 365-day mortality. AUC values with 95% CIs are detailed in the legend. (B, D, F, H) Decision curve analysis evaluating the clinical net benefit of the four models across different threshold probabilities for in-hospital, 30-day, 90-day, and 365-day mortality prediction. The four models compared are: baseline SOFA score (black); SOFA + lactate trajectory (red); SOFA + lactate quartile (green); SOFA + single lactate measurement (purple). Abbreviations: AKI: acute kidney injury; AUC: area under the curve; CI: confidence interval; SOFA: Sequential Organ Failure Assessment. Net reclassification improvement and integrated discrimination improvement for various models in AKI patients (MIMIC-IV cohort). The four models compared are: baseline SOFA score (reference); SOFA + lactate trajectory; SOFA + lactate quartile; SOFA + single lactate measurement. Abbreviations: SOFA: Sequential Organ Failure Assessment; CI: Confidence Interval; NRI: Net Reclassification Improvement; IDI: Integrated Discrimination Improvement; Ref.: References.

Results of the validation cohort
Consistent findings were observed in the independent eICU validation cohort (Figure 5). For in-hospital mortality, the model incorporating lactate trajectories achieved an AUC of 0.678 (95% CI: 0.625-0.732), higher than the AUCs of the SOFA-based baseline model [0.637 (95% CI: 0.582-0.691)], the model incorporating the single lactate measurement [0.653 (95% CI: 0.598-0.707)], and the model incorporating lactate quartiles [0.652 (95% CI: 0.598–0.706)]. Decision curve analysis confirmed its higher net clinical benefit across most threshold probabilities. The addition of lactate trajectories yielded statistically significant incremental value [NRI 0.361 (P < 0.001); IDI 0.046 (P < 0.001)], whereas models incorporating single lactate values or quartiles showed non-significant or only marginal improvements (Supplemental Table 5). Incremental prognostic value of dynamic lactate trajectories over static lactate measures for mortality prediction in AKI patients from the eICU database. (A) Receiver operating characteristic curves assessing the predictive performance of the four models for in-hospital mortality. AUC values with 95% CIs are detailed in the legend. (B) Decision curve analysis evaluating the clinical net benefit of the four models across different threshold probabilities for in-hospital mortality prediction. The four models compared are: baseline SOFA score (black); SOFA + lactate trajectory (red); SOFA + lactate quartile (green); SOFA + single lactate measurement (purple). Abbreviations: AKI: acute kidney injury; AUC: area under the curve; CI: confidence interval; SOFA: Sequential Organ Failure Assessment.
Subgroup analysis and sensitivity analysis in the primary cohort
In the six pre-specified clinical subgroups, the association between lactate trajectories and mortality remained generally consistent across all timepoints, including in-hospital, 30-day, 90-day, and 365-day mortality (Supplemental Figure 2). A statistically significant interaction with age (<65 vs. ≥65 years) was observed for all mortality endpoints (P for interaction ≤0.001). While the highest-risk lactate trajectory (Class 4) was consistently associated with increased mortality in both age groups, the magnitude of risk was substantially greater in the younger cohort. Specifically, for in-hospital mortality, the HR for Class 4 (vs. Class 1) was 6.37 (95% CI: 4.3-9.43) in patients <65 years, compared to 2.85 (95% CI: 2-4.07) in those ≥65 years. A statistically significant interaction with congestive heart failure was observed for in-hospital mortality (P for interaction = 0.049), but not for 30-day (P = 0.091), 90-day (P = 0.066), or 365-day (P = 0.206) mortality. In patients without congestive heart failure, Class 4 (vs. Class 1) was associated with increased in-hospital mortality [HR 4.15 (95% CI: 3.01-5.73)], whereas in patients with congestive heart failure, the association was also significant but with a modestly attenuated magnitude [HR 3.80 (95% CI: 2.46-5.87)]. In the diabetes subgroup, a significant interaction for 365-day mortality (P for interaction = 0.029) indicated an attenuated risk gradient: intermediate lactate trajectories showed weaker associations in diabetic patients [Class 3: HR 1.38 (1.16–1.64) vs. 1.89 (0.87–4.09) in non-diabetic patients], whereas the highest-risk trajectory (Class 4) remained strongly associated with mortality in both groups [HR 3.14 (2.49–3.96) and 4.49 (1.43–14.03), respectively]. No other subgroups-renal disease, sepsis, or sex-demonstrated clinically meaningful interaction effects, with consistent directions of effect and comparable hazard ratios across all mortality endpoints (all P for interaction > 0.05).
The sensitivity analysis conducted in the remaining 2,503 non-malignant AKI patients (after excluding 313 with malignant cancer) confirmed the primary results among the primary cohort. The graded relationship between lactate trajectory classes and mortality risk remained robust in the fully adjusted model, with detailed hazard ratios for all time points provided in Supplemental Table 6.
To address the impact of differing AKI definitions, we identified an alternative cohort of 2,255 AKI patients in MIMIC-IV using ICD-9/ICD-10 codes. In this redefined cohort, we reapplied GBTM, comparing models with 2 to 5 trajectories. Consistent with the primary cohort, a four-class model was again selected as optimal (Supplemental Figure 3). Subsequent Cox regression analysis confirmed a consistent graded association with mortality across all endpoints. In the fully adjusted model, compared to Class 1, the mortality risk increased progressively through Classes 2 to 4. For instance, for in-hospital mortality, the adjusted hazard ratios were: Class 2: 1.16 (95% CI 0.97-1.39; P = 0.112); Class 3: 1.56 (95% CI 1.26–1.92; P < 0.001); Class 4: 3.78 (95% CI 2.89–4.93; P < 0.001). Complete results for all time points are provided in Supplemental Table 7.
Discussion
This retrospective cohort study analyzed data from two independent cohorts of patients with AKI, including 2,816 individuals from the MIMIC-IV (v3.1) database and 429 from the eICU-CRD (v2.0). Four distinct lactate trajectory patterns were consistently identified across both cohorts, indicating considerable heterogeneity among patients. These patterns were categorized as follows: a normal-level-stable pattern, a moderate-level-declining pattern, a high-level-declining pattern, and a persistent high-level pattern. Patients exhibiting the persistent high-level pattern (Class 4) demonstrated substantially higher mortality rates. A graded increase in mortality risk was observed from the normal-level-stable pattern (Class 1) to the persistent high-level pattern (Class 4), although this association attenuated over time in the fully adjusted model. The robustness of the primary findings is supported by their general consistency across clinical subgroups and by sensitivity analyses. A significant interaction with age was observed, reflected in a greater magnitude of risk associated with the highest-risk trajectory in younger patients; however, the direction of association remained consistently adverse. The underlying mechanisms for this differential risk across age groups warrant further investigation. Furthermore, the graded risk relationship persisted not only after excluding patients with cancer but also when using an ICD code-based AKI definition in the MIMIC-IV cohort. Moreover, this study compared dynamic lactate trajectories with specific static measures (a single lactate measurement and lactate quartiles) for predicting mortality risk in AKI patients by utilizing the MIMIC-IV and eICU databases. Our analyses show that dynamic trajectories provide modest but statistically significant incremental predictive value beyond the SOFA-based model. These results suggest that lactate trajectory may provide incremental prognostic information compared to a conventional single lactate measurement. Collectively, our findings imply that dynamic lactate monitoring and trajectory pattern identification may provide supplementary information for recognizing high-risk individuals with AKI.
The trajectory modeling approach used in this study differs significantly from traditional methods that rely on single measurements or analyses of change between two time points. While single-timepoint measurements or two-point change analyses can provide risk stratification, they are inherently unable to capture the temporal evolution of complex pathophysiological processes. In contrast, advanced statistical methods, exemplified by GBTM and Latent growth mixture modeling (LGMM), allow for the classification of patients into subgroups with similar trajectories. 28 These methods provide a more comprehensive risk assessment by analyzing the extent, duration, and trend of changes, which leads to a more precise detection of high-risk phenotypes. The analysis of dynamic trajectories of serum biomarkers has emerged as a significant method in prognostic research, particularly in critically ill populations. For instance, a study by Jing et al. on septic patients in the ICU identified three distinct anion gap trajectories. 29 Their research found that the rising trajectory group was associated with an elevated risk of both ICU mortality (HR = 1.72, 95% CI 1.42-2.07) and in-hospital mortality (HR = 1.64, 95% CI 1.39-1.94) compared to the normal-stable trajectory group. Similarly, recent studies have demonstrated that dynamic serum sodium trajectories can reliably identify high-risk populations for adverse outcomes in ICU patients with conditions such as sepsis, AKI, ischemic stroke, and heart failure.30–32
Lactate, a biomarker of tissue hypoperfusion and metabolic dysregulation, has established prognostic value in various critical care settings. Our findings are highly consistent with a body of existing research. A large retrospective cohort study by Khosravani et al. found that both hyperlactatemia (>2 mmol/L) present on the first day of ICU admission and new-onset hyperlactatemia during the ICU stay were strongly associated with ICU mortality. 10 A strong dose-response relationship was observed between the highest lactate level on day 1 and ICU death, with the risk increasing approximately tenfold (aOR = 10.89, 95% CI 4.85-24.48) in the group with levels > 20 mmol/L compared to the normal lactate group. Similarly, a multicenter retrospective study by Haas et al. reported an association between hyperlactatemia and ICU mortality (OR = 1.35, 95% CI 1.23-1.49) and indicated that the 12-hour lactate clearance rate had high predictive value (ROC-AUC 0.91) in patients with severe hyperlactatemia (>10 mmol/L). 11 Furthermore, a systematic review and meta-analysis of 15 studies by Zhang et al. concluded that an early lactate clearance (within 24 hours) was significantly associated with a substantially reduced risk of all-cause mortality (pooled RR = 0.38, 95% CI 0.29-0.50) in critically ill patients. 13 The same analysis highlighted that persistently high lactate levels serve as a powerful warning signal of a very poor prognosis. The advantage of dynamic lactate monitoring over a single static measurement for prognostic assessment has also been demonstrated. Nichol et al. utilizing a prospectively collected multicenter database, compared the predictive ability for ICU and hospital mortality between dynamic lactate indices (such as time-weighted lactate, LACTW24, and change in lactate, LAC△24, over the first 24 hours of ICU stay) and static indices (admission lactate, LACADM; maximum lactate, LACMAX24; minimum lactate, LACMIN24). 33 Their results showed that when combined with clinical severity scores, the dynamic indices were significantly superior to static lactate measurements in predictive accuracy. Our study extends these findings to a critically ill AKI population, demonstrating that dynamic lactate trajectory analysis offers enhanced prognostic capability compared to static measurements.
AKI presents unique challenges for assessing the prognostic value of lactate because the condition itself can alter lactate metabolism. A single-center study by Chen et al. on critically ill AKI patients showed that compared to patients with an initial lactate level ≤ 1.6 mg/dL, those with a level > 2.71 mg/dL had a significantly higher 365-day mortality risk, with an adjusted HR of 1.20 (95% CI 1.05-1.37). 16 The innovative aspect of our study lies in its focus on the temporal dynamic changes of lactate rather than relying on a single measurement. Notably, we found that even patients in Class 2 (the moderate-level decreasing trajectory group), who had a median baseline lactate of 3.2 mmol/L but exhibited a rapid decline, did not show a significantly increased mortality risk after full adjustment (HR 1.15, P = 0.099). This finding differs from the conclusion drawn from the single-timepoint analysis in the Chen study, suggesting that the capacity for lactate clearance may hold greater prognostic significance than the initial lactate level alone.
The pathophysiological mechanisms underlying persistent hyperlactatemia in patients with AKI are multifactorial. Firstly, inadequate tissue perfusion represents a key pathophysiological mechanism.34,35 We observed that patients in Trajectory Class 4 had significantly lower baseline SBP (109.0 ± 13.6 mmHg) and a higher heart rate (99.0 ± 17.9 bpm), indicative of a circulatory shock state. Secondly, impaired liver and kidney function affects lactate clearance. In this study, Class 4 patients exhibited a notably high prevalence of severe liver disease (28.9%) and a median creatinine level of 2.1 mg/dL. This combination of hepatic and renal impairment indicates that dual organ insufficiency significantly compromises lactate clearance capacity, creating a vicious cycle. Thirdly, mitochondrial dysfunction likely plays a critical role in sustained hyperlactatemia.36,37Sepsis-associated cytokine storms and oxidative stress can damage the mitochondrial respiratory chain, leading to persistent lactate generation. 38 The high prevalence of sepsis (94.9%) and markedly low bicarbonate levels (13.8 ± 5.3 mmol/L) observed in Class 4 patients reflect severe metabolic acidosis, consistent with the mitochondrial dysfunction hypothesis. These potential mechanisms may together contribute to the high mortality rate observed in patients classified as Class 4.
The findings from our retrospective observational studysuggest potential clinical implications and generate hypotheses for future investigation. The early and persistent hyperlactatemia defining Class 4 trajectory is strongly and independently associated with mortality, highlighting a subgroup of AKI patients with a markedly poor prognosis. In clinical management, tracking lactate trajectories could thus be viewed as a dynamic early-warning system. This is because it identifies dynamic patterns that could indicate a persistent metabolic derangement, rather than a transient abnormality captured by a single measurement. Identifying such a persistently high-level lactate trajectory might support the decision to intensify monitoring or initiate a structured diagnostic re-evaluation for potential specific, reversible causes. Future studies should prospectively evaluate whether integrating lactate trajectory patterns into clinical decision-making can improve outcomes.
This study has several methodological strengths. First, the use of two large, independent databases for primary analysis and external validation enhanced the reliability and generalizability of the study results. Second, GBTM was applied to the longitudinal lactate measurements to identify underlying latent subgroups of patients with distinct clinical profiles. Third, the construction of a series of statistical models with sequential adjustments for a wide range of covariates provided a more robust evaluation of the association between lactate trajectories and mortality. Finally, this study confirmed the clear incremental predictive value of dynamic lactate trajectories by incorporating them into a baseline risk model and comprehensively evaluating their performance against traditional static lactate measures.
Despite these strengths, our study has several limitations. First, the use of different AKI definitions (KDIGO criteria in MIMIC-IV vs. ICD-9/10 codes in eICU-CRD) due to data availability may introduce potential case-mix heterogeneity. This concern is supported by an internal comparison showing higher baseline illness severity in ICD-identified versus KDIGO-identified patients within MIMIC-IV (Supplemental Table 8). However, sensitivity analyses using a uniform ICD-based definition yielded virtually identical hazard ratios (Supplemental Table 7), demonstrating that the core association between lactate trajectories and mortality is robust to this methodological heterogeneity. Second, the sample size of the external validation cohort limited its statistical power, particularly to detect the more modest effect sizes, which should be considered when interpreting the non-significant associations. Third, the external validation cohort (eICU-CRD) only provided in-hospital mortality data, thereby limiting the scope of external validation for longer-term mortality endpoints (30, 90, and 365 days). Fourth, temporal heterogeneity may arise from the differing time spans and evolving ICU practice between 2008 and 2022, a limitation of cross-database validation. Fifth, the retrospective observational design, while utilizing large clinical databases, inherently limits causal inference. Sixth, despite multivariate adjustment for a wide array of confounders, unmeasured or residual confounding could influence the observed associations. Finally, due to the inclusion criterion requiring at least one lactate measurement every 24 hours within the first 4 days, this retrospective study may have selected for a more severely ill population undergoing closer monitoring. Quantitatively, the included MIMIC-IV cohort had a significantly higher in-hospital mortality rate than those excluded due to incomplete lactate data (33.1% vs. 12.5%, p < 0.001; see Supplemental Table 9). Consequently, the generalizability of our findings to all AKI patients, particularly those with milder disease, may be limited.
Conclusions
In summary, this observational study suggests a significant association between dynamic lactate trajectories and mortality in AKI patients. The persistent high-level trajectory was independently associated with the poorest outcomes. Incorporating lactate trajectories into a baseline risk model provided statistically significant incremental predictive value. These findings were supported by consistent directional trends in an external cohort and highlight the potential of lactate trajectories for risk stratification and warrant further validation in prospective, multi-center studies.
Supplemental material
Supplemental material - Association between early lactate trajectories and mortality in critically ill patients with acute kidney injury: A multicenter cohort study
Supplemental material for Association between early lactate trajectories and mortality in critically ill patients with acute kidney injury: A multicenter cohort study by Xiaofan Tan, Zhibin Xie, Peihong Yin, Junxian Wang, Wenyi Liang, Xiaohong Chen, Yingqin He, Hongyun Jian, Qiongyi Huang, Jian Lin and Qing Ye in Science Progress.
Footnotes
Acknowledgements
The authors gratefully acknowledge Dr. Qilin Yang (Department of Critical Care Medicine, The Second Affiliated Hospital of Guangzhou Medical University) and Dr. Yingxiu Huang (Department of Infectious Diseases, Beijing Luhe Hospital) for their expert guidance on data extraction and analysis. During the preparation of this work, the authors used DeepSeek for language polishing.
Ethical considerations
The study was conducted in accordance with the Helsinki Declaration of 1975, as revised in 2024. The creation and release of the MIMIC-IV database were approved by the Institutional Review Boards of Beth Israel Deaconess Medical Center (2001-P-001699/14) and Massachusetts Institute of Technology (No. 0403000206), which waived the requirement for individual informed consent due to the de-identified nature of the data. The eICU-CRD comprises fully de-identified data and is released under the Health Insurance Portability and Accountability Act (HIPAA) safe harbor provision (Certification No. 1031219-2). Therefore, its use for this research is considered exempt from ethics approval, with a waiver of informed consent. Author Xiaofan Tan obtained authorized access to these databases by the Massachusetts Institute of Technology Affiliates (Record ID: 70211557).
Consent to participate
Informed consent for patient information to be published in this article was not obtained because the study utilized fully de-identified retrospective data from publicly available critical care databases, and the requirement for individual informed consent was waived by the respective institutional review boards due to the de-identified nature of the data.
Author contributions
Xiaofan Tan: Writing - review & editing, Writing - original draft, Visualization, Data curation, Formal analysis. Zhibin Xie: Writing - review & editing, Visualization. Peihong Yin: Writing - review & editing, Validation. Junxian Wang: Writing - review & editing. Wenyi Liang: Writing - review & editing. Xiaohong Chen: Writing - review & editing, Supervision. Yingqin He: Writing - review & editing, Supervision. Hongyun Jian: Writing - review & editing, Supervision. Qiongyi Huang: Writing - review & editing. Jian Lin: Writing - review & editing, Validation, Software, Methodology, Resources, Project administration, Conceptualization. Qing Ye: Writing - review & editing, Writing - original draft, Formal analysis, Resources, Project administration, Methodology, Investigation, Supervision, Conceptualization.
Funding
The authors received no financial support for the research, authorship, and/or publication of this article.
Declaration of conflicting interests
The authors declared no potential conflicts of interest with respect to the research, authorship, and/ or publication of this article.
Data Availability Statement
The data for this analysis were sourced from two open-access critical care databases: MIMIC-IV (v3.1), available at https://physionet.org/content/mimiciv/3.1/; and the eICU-CRD, available at ![]() .
.
Supplemental material
Supplemental material for this article is available online.
References
Supplementary Material
Please find the following supplemental material available below.
For Open Access articles published under a Creative Commons License, all supplemental material carries the same license as the article it is associated with.
For non-Open Access articles published, all supplemental material carries a non-exclusive license, and permission requests for re-use of supplemental material or any part of supplemental material shall be sent directly to the copyright owner as specified in the copyright notice associated with the article.