
Abstract
Objective
This study aimed to evaluate the predictive value of the combined triglyceride-glucose index (TyG) and glycemic variability (GV) for all-cause mortality in critically ill patients with sepsis.
Methods
This retrospective cohort study used MIMIC-IV v3.1 as the development cohort and the temporally independent MIMIC-III CareVue subset as the validation cohort. Patients were divided into six groups based on the median TyG index (9.34) and GV tertiles (≤20.54, 20.54–28.11, and >28.11). The primary outcome was 90-day all-cause mortality. Analyses were performed using Kaplan–Meier survival curves, Cox proportional hazards models, and restricted cubic splines, supplemented with subgroup analyses and external validation.
Results
This study included 1792 patients from MIMIC-IV and 947 patients from the MIMIC-III CareVue subset. In the fully adjusted Cox proportional hazards model, the G6 group (TyG > 9.34 and GV > 28.11) exhibited the highest 90-day all-cause mortality risk compared with the G1 group (TyG ≤ 9.34 and GV ≤ 20.54) (HR = 2.366, 95% CI: 1.595–3.509). The absolute 90-day mortality rate increased from 10.3% in G1 to 27.2% in G6. Kaplan–Meier analysis revealed significant differences in cumulative mortality across the TyG–GV risk groups during the 90-day follow-up (log-rank P < 0.001), with the lowest survival rate observed in G6. The combined TyG and GV model showed a modest but statistically significant improvement in discrimination compared with the baseline model for 90-day mortality, with the AUC increasing from 0.730 (95% CI, 0.700–0.760) to 0.743 (95% CI, 0.714–0.773) (ΔAUC = 0.013, P = 0.048). The continuous net reclassification improvement (cfNRI) and integrated discrimination improvement (IDI) further supported the incremental value of TyG and GV added to the baseline model. Subgroup analyses showed generally consistent directions of association without significant interactions, and external validation supported the robustness of these findings.
Conclusions
The combined phenotype of elevated TyG index (>9.34) and elevated GV (>28.11) was associated with increased short- and long-term all-cause mortality risks and provided supplementary prognostic information in critically ill patients with sepsis; prospective validation is needed.
Introduction
Sepsis is one of the most common and highly fatal critical illnesses in intensive care units (ICUs).1,2 Its clinical manifestations are diverse, often overlapping with those of other diseases, and its progression is rapid. Despite advances in recognition and management, sepsis remains a leading cause of death and critical illness worldwide. 3 Therefore, identifying accessible prognostic indicators and investigating their predictive value, both individually and in combination, for adverse outcomes in sepsis is crucial for enabling early intervention and personalized treatment.
Sepsis is currently defined as life-threatening organ dysfunction caused by a dysregulated host response to infection. 4 Previous studies have indicated that inflammatory responses are interrelated with insulin resistance (IR), with massive release of inflammatory mediators and oxidative stress imbalance potentially serving as key mechanisms driving the onset and persistence of insulin resistance. 5 Although the TyG index has been associated with adverse outcomes in sepsis, its interpretation in critically ill patients should extend beyond chronic insulin resistance to include acute stress-related glucose and lipid disturbances. 6 However, the traditional TyG index is typically calculated based on a single blood glucose and triglyceride measurement at admission (often fasting), 7 making it difficult to reflect dynamic blood glucose fluctuations during hospitalization and their potential prognostic significance in critically ill patients.
GV characterizes the magnitude of blood glucose fluctuations during intensive care unit (ICU) hospitalization. Multiple studies have indicated that GV demonstrates superior predictive power for mortality risk compared to single blood glucose measurements.8,9 SHR and glucose target-range metrics have also been studied in sepsis, supporting the prognostic relevance of dynamic glucose assessment beyond single glucose measurements.10–12 Conceptually, TyG and GV capture complementary aspects of metabolic dysregulation in critical illness.3,13 TyG may reflect early stress-related glucose and lipid disturbances, whereas GV reflects dynamic glycemic instability during ICU hospitalization. Their combination may therefore provide additional prognostic information beyond either marker alone.
Although TyG and GV-related markers have been investigated in heterogeneous ICU populations, sepsis-specific validation remains necessary because sepsis is characterized by infection-driven systemic inflammation, acute metabolic stress, hemodynamic instability, organ dysfunction, and frequent nutritional and insulin-related interventions in the ICU. These factors may modify the interpretation and prognostic significance of TyG and GV, making the findings from general ICU cohorts not directly generalizable to critically ill patients with sepsis. Therefore, this study aimed to evaluate the association between the combined TyG–GV phenotype and 90-day, 180-day, and 360-day all-cause mortality in critically ill patients with sepsis using the MIMIC-IV database, with external validation in the MIMIC-III CareVue subset.
Methods
Data sources
This was a retrospective cohort study based on the MIMIC-IV database, with external validation using the MIMIC-III CareVue subset. Study data were obtained from MIMIC-IV v3.1, a de-identified database covering patients treated at Beth Israel Deaconess Medical Center between 2008 and 2022. External validation was performed using the MIMIC-III CareVue subset (v1.4), which contains ICU patient data from 2001 to 2008, with individuals overlapping with MIMIC-IV excluded. 14 The sharing of the MIMIC research resource was approved by the Institutional Review Boards of the Massachusetts Institute of Technology and Beth Israel Deaconess Medical Center. This study was conducted in accordance with the Declaration of Helsinki of 1975, as revised in 2024. Individual signed informed consent was waived because all patient details were de-identified before data access, and no information that could identify individual patients was used in this study. Author Ao Wang obtained database access (certificate no. 69710560). The reporting of this retrospective cohort study conforms to the Strengthening the Reporting of Observational Studies in Epidemiology (STROBE) guidelines. 15
Study design and population
Patients with sepsis were identified using the Sepsis-3 algorithm from the MIMIC database. Suspected infection was operationalized using the temporal co-occurrence of antibiotic administration and microbiological culture: a culture was obtained within 24 h after antibiotic administration or antibiotic administration occurred within 72 h after culture. The suspected infection time was defined as the earlier timestamp of the paired antibiotic and culture event. Organ dysfunction was defined as a SOFA score ≥2 occurring within the window from 48 h before to 24 h after the suspected infection time. Because the pre-infection organ function status was unavailable in the MIMIC database, a baseline SOFA score of 0 was assumed; therefore, a SOFA score ≥2 within this window was considered equivalent to an acute increase of at least 2 points. Septic shock was not used as a separate inclusion criterion; patients with septic shock who met the Sepsis-3 definition were included because septic shock represents a more severe subgroup of patients with sepsis. The detailed cohort identification process and SQL-style logic are provided in Supplementary Method S1.16,17 This process initially identified 28931 ICU stays with sepsis. The exclusion criteria were as follows: (1) duplicate ICU admission records, retaining only the first admission and first ICU stay; (2) age <18 or >90 years; (3) ICU stay <24 h; (4) fewer than three blood glucose measurements; and (5) missing critical variables, including operationally defined fasting glucose or triglycerides. All eligible ICU patients meeting the predefined inclusion and exclusion criteria were consecutively included. In the MIMIC-III CareVue external validation cohort, repeated admissions were handled using the same strategy as in MIMIC-IV; for patients with multiple hospitalizations or ICU stays, only the first ICU stay during the first hospitalization was retained. The patient inclusion process is illustrated in Figure 1. The study flowchart. MIMIC-IV: Medical Information Mart for Intensive Care IV; MIMIC-III: Medical Information Mart for Intensive Care III; ICU: intensive care unit; FBG: fasting blood glucose; TyG: triglyceride–glucose; GV: glycemic variability.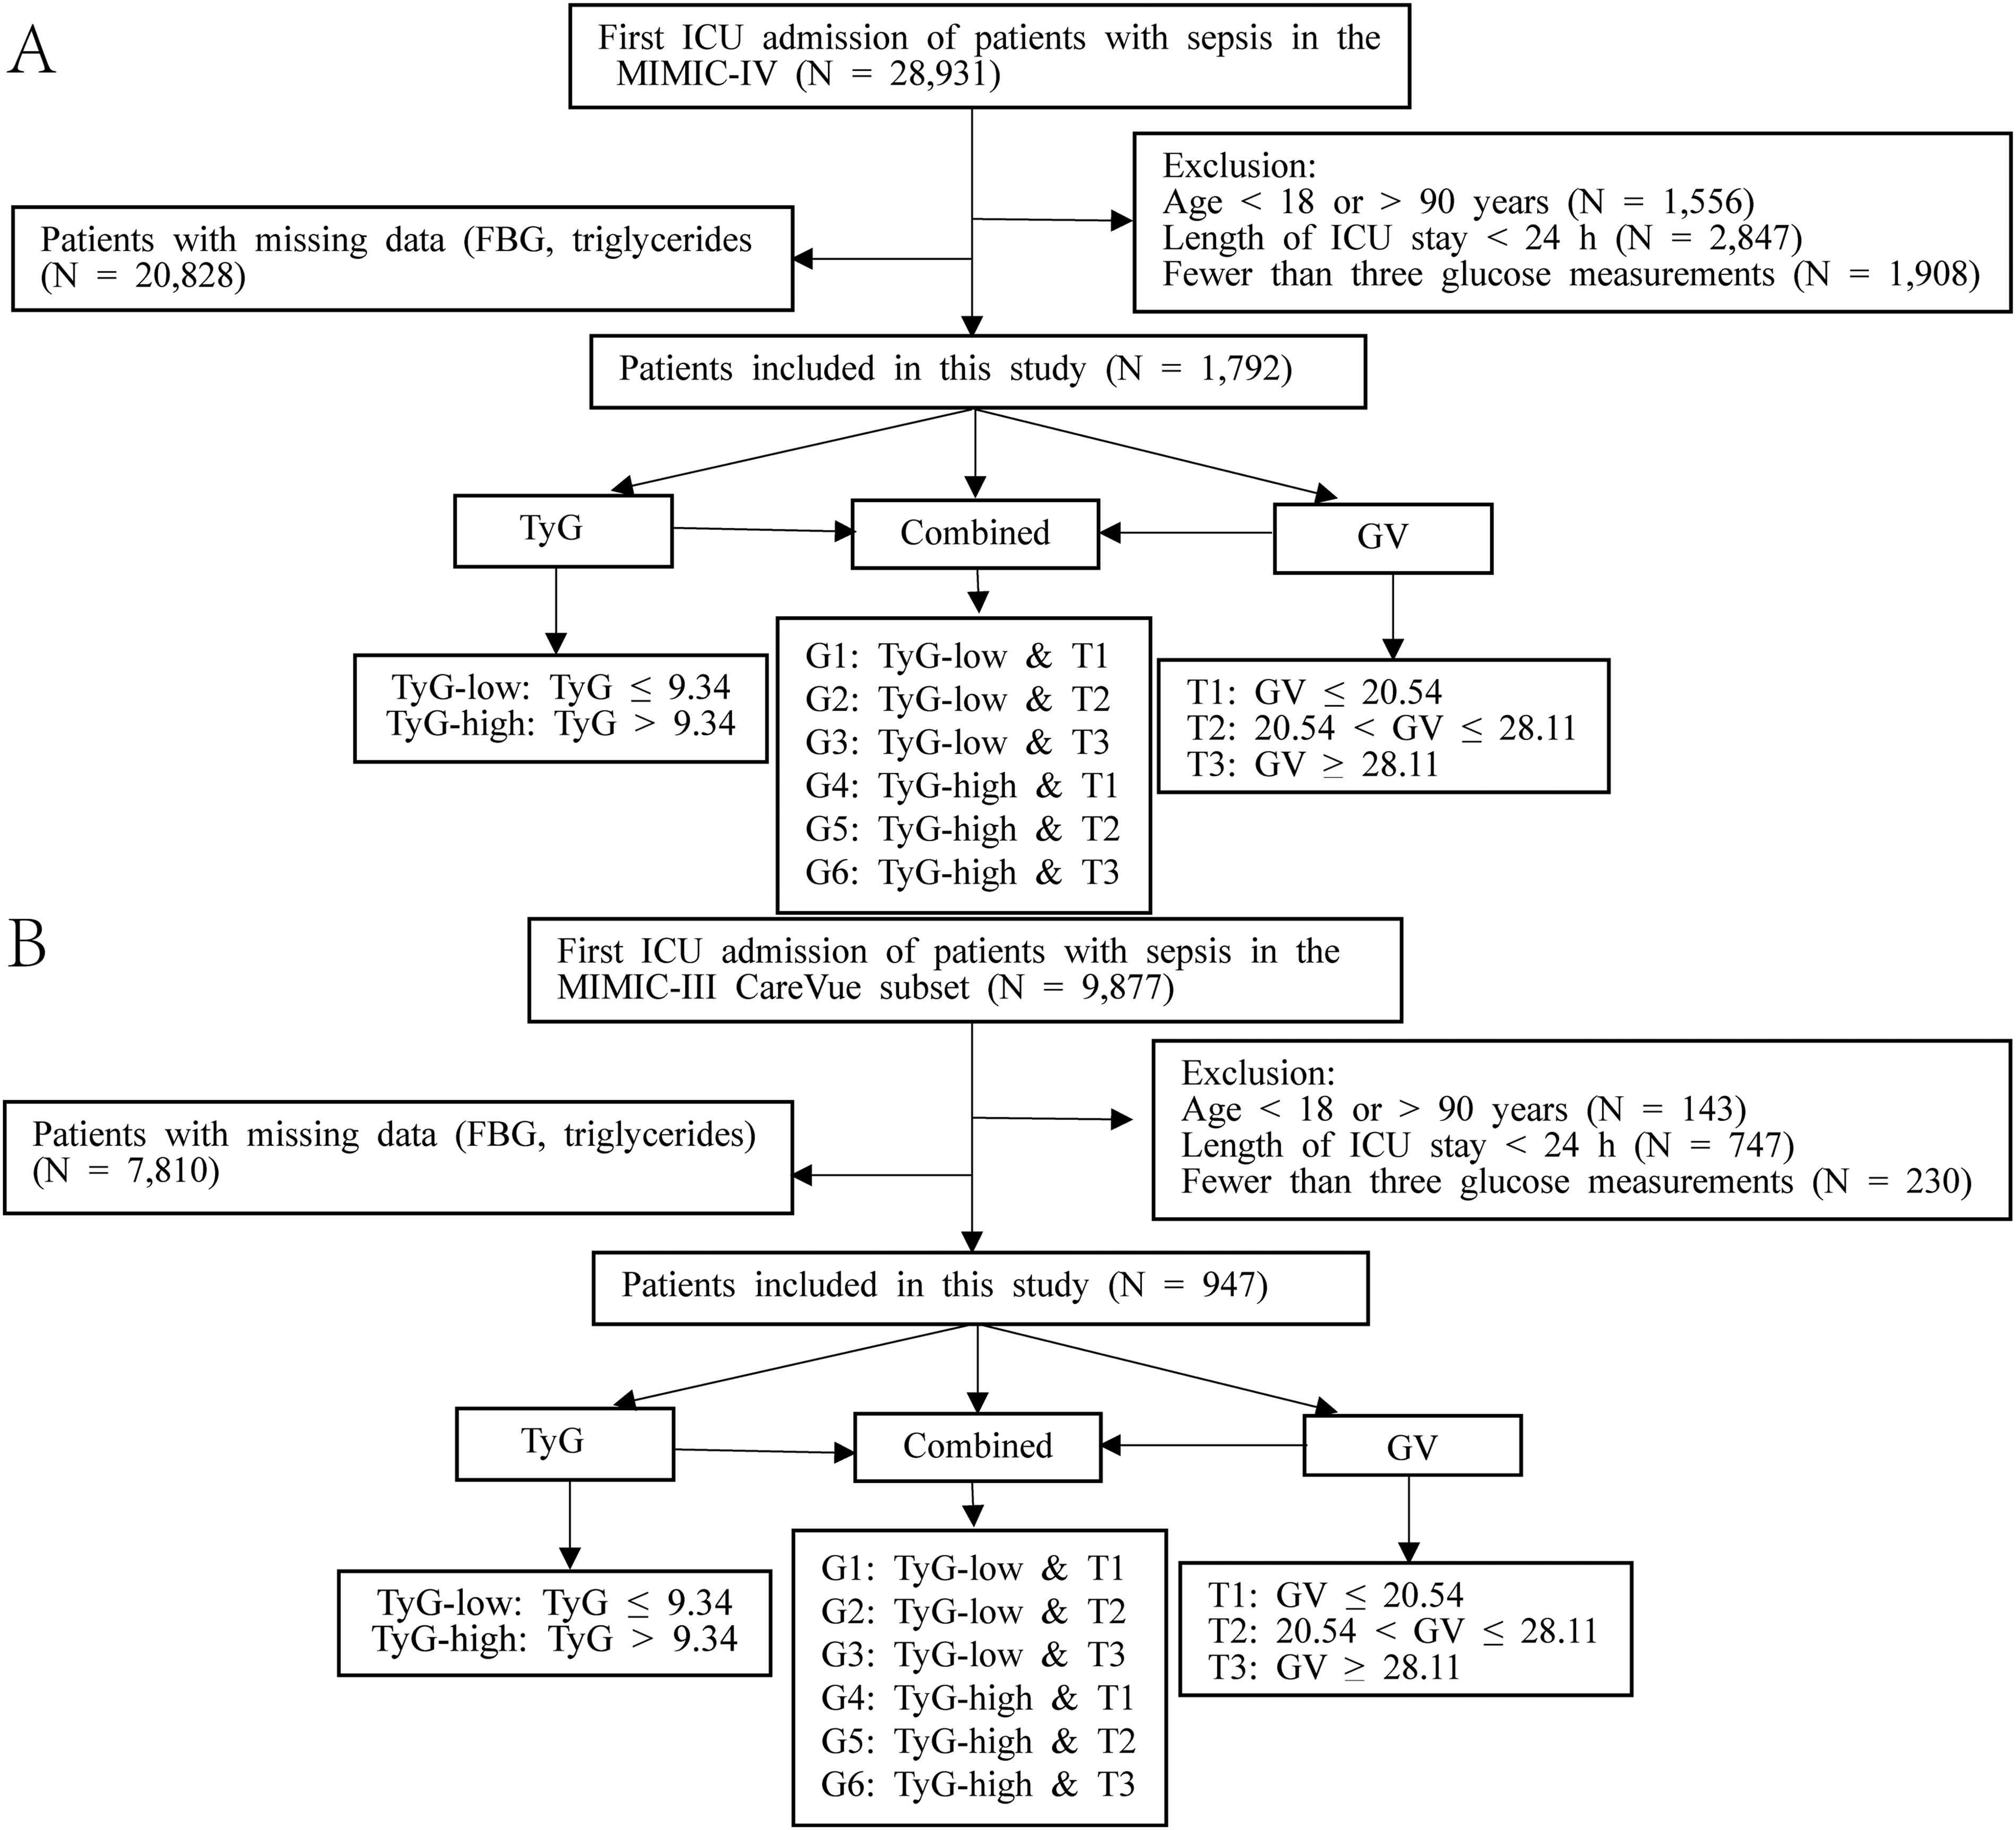
Data extraction and processing
This study included eligible ICU patients from the MIMIC-IV v3.1 and MIMIC-III CareVue subset (v1.4) datasets. All data were independently extracted and reviewed by two researchers (Wang Ao and Li Kehui). ICU type was defined according to the first ICU care unit recorded in the MIMIC-IV ICU stay table (first_careunit variable). The ICU type distribution is presented in Supplementary Table S1.
The variables included in the MIMIC-IV dataset were as follows: (1) baseline demographic characteristics: age, sex, and body mass index (BMI); (2) prognostic outcomes: 90-day, 180-day, and 360-day all-cause mortality and corresponding survival times; (3) vital signs and scores: respiratory rate, heart rate, mean arterial pressure, oxygen saturation, body temperature, and Sequential Organ Failure Assessment (SOFA) score; (4) comorbidities: atrial fibrillation (AF), hypertension, liver cirrhosis (LC), stroke, chronic kidney disease (CKD), malignancy, diabetes, heart failure (HF), ischemic heart disease (IHD), and chronic obstructive pulmonary disease (COPD); (5) treatment-related factors: mechanical ventilation, continuous renal replacement therapy (CRRT), vasopressors (VP), and glucocorticoids (GC); and (6) laboratory and metabolic indicators: blood glucose, triglycerides, operationally defined fasting glucose (FBG), platelet count, blood urea nitrogen, white blood cell count (WBC), anion gap, serum potassium, serum sodium, creatinine, bicarbonate, lactate, hemoglobin, international normalized ratio (INR), and activated partial thromboplastin time (APTT). Glucose measurements were extracted from laboratory glucose records in MIMIC; bedside capillary point-of-care glucose measurements were not analyzed separately.
In the MIMIC-III CareVue subset cohort, we processed the data using variable definitions, unit conversions, and value windows that were consistent with those of MIMIC-IV. Glucose measurements included all available measurements during the ICU stay, whereas other laboratory parameters used the first recorded value after ICU admission. Extracted variables included: age, sex, BMI, body temperature, heart rate, respiratory rate, oxygen saturation, blood glucose, anion gap, APTT, CKD, COPD, serum creatinine, CRRT, FBG, triglycerides, GC, hemoglobin, HF, hypertension, IHD, INR, liver cirrhosis, platelets, serum potassium, blood urea nitrogen, WBC, SOFA, mechanical ventilation, and VP.
The missing data handling strategy for MIMIC-IV aligned with that of the MIMIC-III CareVue subset. Variables with a missing rate >20% were excluded from the analysis, 18 whereas variables with a missing rate ≤20% were imputed using MICE with predictive mean matching under the assumption that data were missing at random conditional on the observed covariates, generating 20 imputed datasets. The all-cause mortality outcome variables at 90, 180, and 360 days had no missing values and were not imputed. The missing rates and handling strategies for each variable are presented in Supplementary Table S2. The stability and plausibility of imputation were assessed by comparing the distributions of observed and completed datasets after imputation, and no implausible imputed values were observed; the results are shown in Supplementary Table S3.
Calculation and outcomes
The TyG index was calculated as follows: TyG = ln[TG (mg/dL) × FBG (mg/dL)/2]. 19 FBG was operationally defined as the first morning blood glucose measurement taken between 06:00 and 08:00 within 24 h of ICU admission and served as an operational proxy rather than a confirmed physiological fasting value for the TyG calculation. This time window was selected to approximate routine early morning laboratory sampling and to improve the consistency of glucose measurement timing across patients. If no value was available within 24 h, the first morning blood glucose measurement taken between 06:00 and 08:00 within 48 h of ICU admission was used for the analysis. TG was defined as the first available triglyceride measurement within the same early ICU timeframe. GV was calculated as the coefficient of variation (CV) of repeated laboratory glucose measurements during the ICU stay (SD/mean) and expressed as a percentage (SD/mean × 100). 3 The glucose values used for the TyG and GV calculations were extracted from the laboratory chemistry records in the MIMIC database. Body mass index (BMI) was calculated as weight (kg) divided by height (m2). Patients were grouped into two categories based on the median TyG index: TyG-low (TyG ≤ 9.34) and TyG-high (TyG > 9.34) groups. Patients were further categorized into three groups based on GV tertiles: T1 (GV ≤ 20.54), T2 (20.54 < GV ≤ 28.11), and T3 (GV > 28.11). Patients were further subdivided into six groups (G1 to G6) representing different combinations of TyG and GV: G1: TyG ≤ 9.34 and GV ≤ 20.54; G2: TyG ≤ 9.34 and 20.54 < GV ≤ 28.11; G3: TyG ≤ 9.34 and GV > 28.11; G4: TyG > 9.34 and GV ≤ 20.54; G5: TyG > 9.34 and 20.54 < GV ≤ 28.11; G6: TyG > 9.34 and GV > 28.11. The grouping strategy in the MIMIC-III CareVue subset was consistent with that of MIMIC-IV. Threshold selection was based on biological and clinical significance: the TyG cutoff was defined by the median value, and GV was categorized by tertiles to capture potential nonlinear stress-response thresholds, consistent with previous studies.3,13,20 The primary outcome was 90-day all-cause mortality, with secondary outcomes being 180-day and 360-day all-cause mortality.
Data analysis
Baseline characteristics were described in stratified groups based on the median TyG index, GV tertiles, combined TyG–GV grouping (six categories), and all-cause mortality at 90, 180, and 360 days after the index date. Continuous variables are expressed as mean ± standard deviation (SD) if normally distributed, with intergroup comparisons performed using analysis of variance (ANOVA). For non-normally distributed continuous variables, the median (interquartile range, IQR) was used, and intergroup comparisons were performed using the Kruskal–Wallis test. Categorical variables are expressed as counts (percentages), with intergroup comparisons using the chi-square or Fisher’s exact test.
In the MIMIC-IV cohort, Cox proportional hazards regression models were used to assess the association between the TyG index, GV, and their combined grouping with all-cause mortality risk at 90, 180, and 360 days after admission. Hazard ratios (HR) and 95% confidence intervals (95% CI) were calculated to quantify effect sizes. Three progressively adjusted models were constructed: Model 1 was the unadjusted model; Model 2 was adjusted for age, sex, BMI, body temperature, heart rate, respiratory rate, and oxygen saturation; and Model 3 was further adjusted for anion gap, APTT, CKD, COPD, serum creatinine, CRRT, GC, hemoglobin, HF, hypertension, IHD, INR, liver cirrhosis, platelets, serum potassium, blood urea nitrogen, WBC, SOFA, mechanical ventilation, and VP use. Covariates were selected primarily based on clinical expertise and prior literature evidence.6,17 The proportional hazards assumption was assessed statistically using Schoenfeld residuals and graphically using scaled Schoenfeld residual plots. No substantial violations affecting the main exposure estimates were observed.
In the sensitivity analysis, we first recalculated the TyG index using the first available glucose value after ICU admission and repeated the Cox analysis for the combined TyG–GV subgroups. Second, to assess the effects of glucose measurement density and observation window, we reported the number of glucose measurements during the ICU stay, ICU observation window, and glucose measurement frequency, where the glucose measurement frequency was defined as the number of glucose measurements divided by the ICU observation window (days). Furthermore, to reduce potential bias arising from differences in ICU length of stay and time-dependent GV measurements, we recalculated early GV using only glucose values from the first 48 h after ICU admission and repeated the fully adjusted Cox analysis among patients with at least three glucose measurements within the first 48 h of admission. Finally, sensitivity models were constructed based on Model 3: Model 4 was adjusted for mean blood glucose levels, Model 5 was adjusted for hypoglycemia, and Model 6 was adjusted for blood glucose measurement frequency and duration of the GV calculation. To address the potential concern of over-adjustment in Model 3, a parsimonious model was constructed for the sensitivity analysis. This model was adjusted for age, sex, BMI, SOFA score, lactate, diabetes, CKD, and heart failure, and the Cox regression analysis for the combined TyG–GV phenotype was repeated. To assess multicollinearity among covariates, generalized variance inflation factors (GVIF) were calculated and reported as GVIF^(1/(2×df)) adjusted for the degrees of freedom. Building upon Model 3, we employed 3-knot RCS regression to assess the potential nonlinear relationships between the TyG index and GV with all-cause mortality. Knots were placed at the 10th, 50th, and 90th percentiles for each exposure, with the 50th percentile as the reference. The P-value for nonlinearity is also reported. Kaplan–Meier survival curves were plotted, and log-rank tests were conducted to compare survival differences across the six TyG–GV combined groups.
We first plotted time-dependent ROC curves for 90-day, 180-day, and 360-day mortality based on the TyG–GV combined grouping. Subsequently, to assess the incremental predictive value of TyG and GV, time-dependent ROC curves at 90, 180, and 360 days were constructed by adding the TyG index, GV, and their combination to the baseline Cox model containing all covariates of Model 3. The area under the curve (AUC) was calculated, and paired ΔAUC was assessed using the bootstrap method. cfNRI and IDI were estimated via bootstrap resampling (1000 iterations) based on predicted risks at each time point from the Cox model, accounting for censoring, with all comparisons referenced against the corresponding baseline models.
In the MIMIC-IV cohort, model calibration was assessed using calibration curves, Brier scores, and calibration slopes for 90-day, 180-day, and 360-day mortality. Calibration metrics were compared between the baseline and combined models incorporating the TyG index and GV. To further evaluate the added value of the TyG–GV composite phenotype beyond traditional ICU severity indices, SOFA alone and SOFA + lactate were used as reference models, and SOFA + TyG + GV and SOFA + lactate + TyG + GV models were constructed. The AUC, ΔAUC, and P values were compared for the 90-day, 180-day, and 360-day outcomes. Decision curve analysis was also performed in the MIMIC-IV cohort to compare the net benefits of the baseline and combined models incorporating TyG and GV at different threshold probabilities.
Prespecified exploratory subgroup analyses were conducted based on clinically relevant factors, including age, sex, BMI, SOFA score, hypertension, atrial fibrillation, diabetes, mechanical ventilation, heart failure, and CKD, to assess the consistency of the association across subgroups. Interaction P values were calculated.
Additionally, as a post-hoc explanatory analysis, we applied Boruta and random forest feature importance ranking in the MIMIC-IV development cohort based on the same set of covariates as Model 3, including TyG and GV. We aggregated the global SHAP importance scores to quantify the overall contribution of each feature to the model prediction. The relevant results are shown in Supplementary Figure 3.
Cox proportional hazards models were applied to the external validation cohort to assess the transferability and generalizability of the findings. The association between TyG and GV combined grouping and 90-day all-cause mortality risk was evaluated using covariates consistent with those of the development cohort. In the external validation analysis, the TyG–GV combined grouping cutoffs were retained from the MIMIC-IV development cohort. Kaplan–Meier survival curves for the combined groups were plotted and compared using log-rank tests. For predictive performance evaluation, linear predictors were calculated in the external validation cohort using the regression coefficients derived from Model 3 in the MIMIC-IV development cohort. Using the baseline model incorporating all Model 3 covariates as the reference, the TyG index, GV, and their combination were added to construct time-dependent ROC curves for 90-day mortality, and the area under the curve (AUC) was calculated. The bootstrap method was used to assess paired ΔAUC.
All statistical analyses were performed using R software (version 4.5.1, R Foundation for Statistical Computing, Vienna, Austria) and DecisionLinnc (version 1.1.5.0, Hangzhou, China). All tests were two-sided, with P < 0.05 considered statistically significant.
Results
Baseline characteristics
MIMIC-IV cohort
Baseline characteristics of the MIMIC-IV cohort according to the combination of the TyG index and GV.
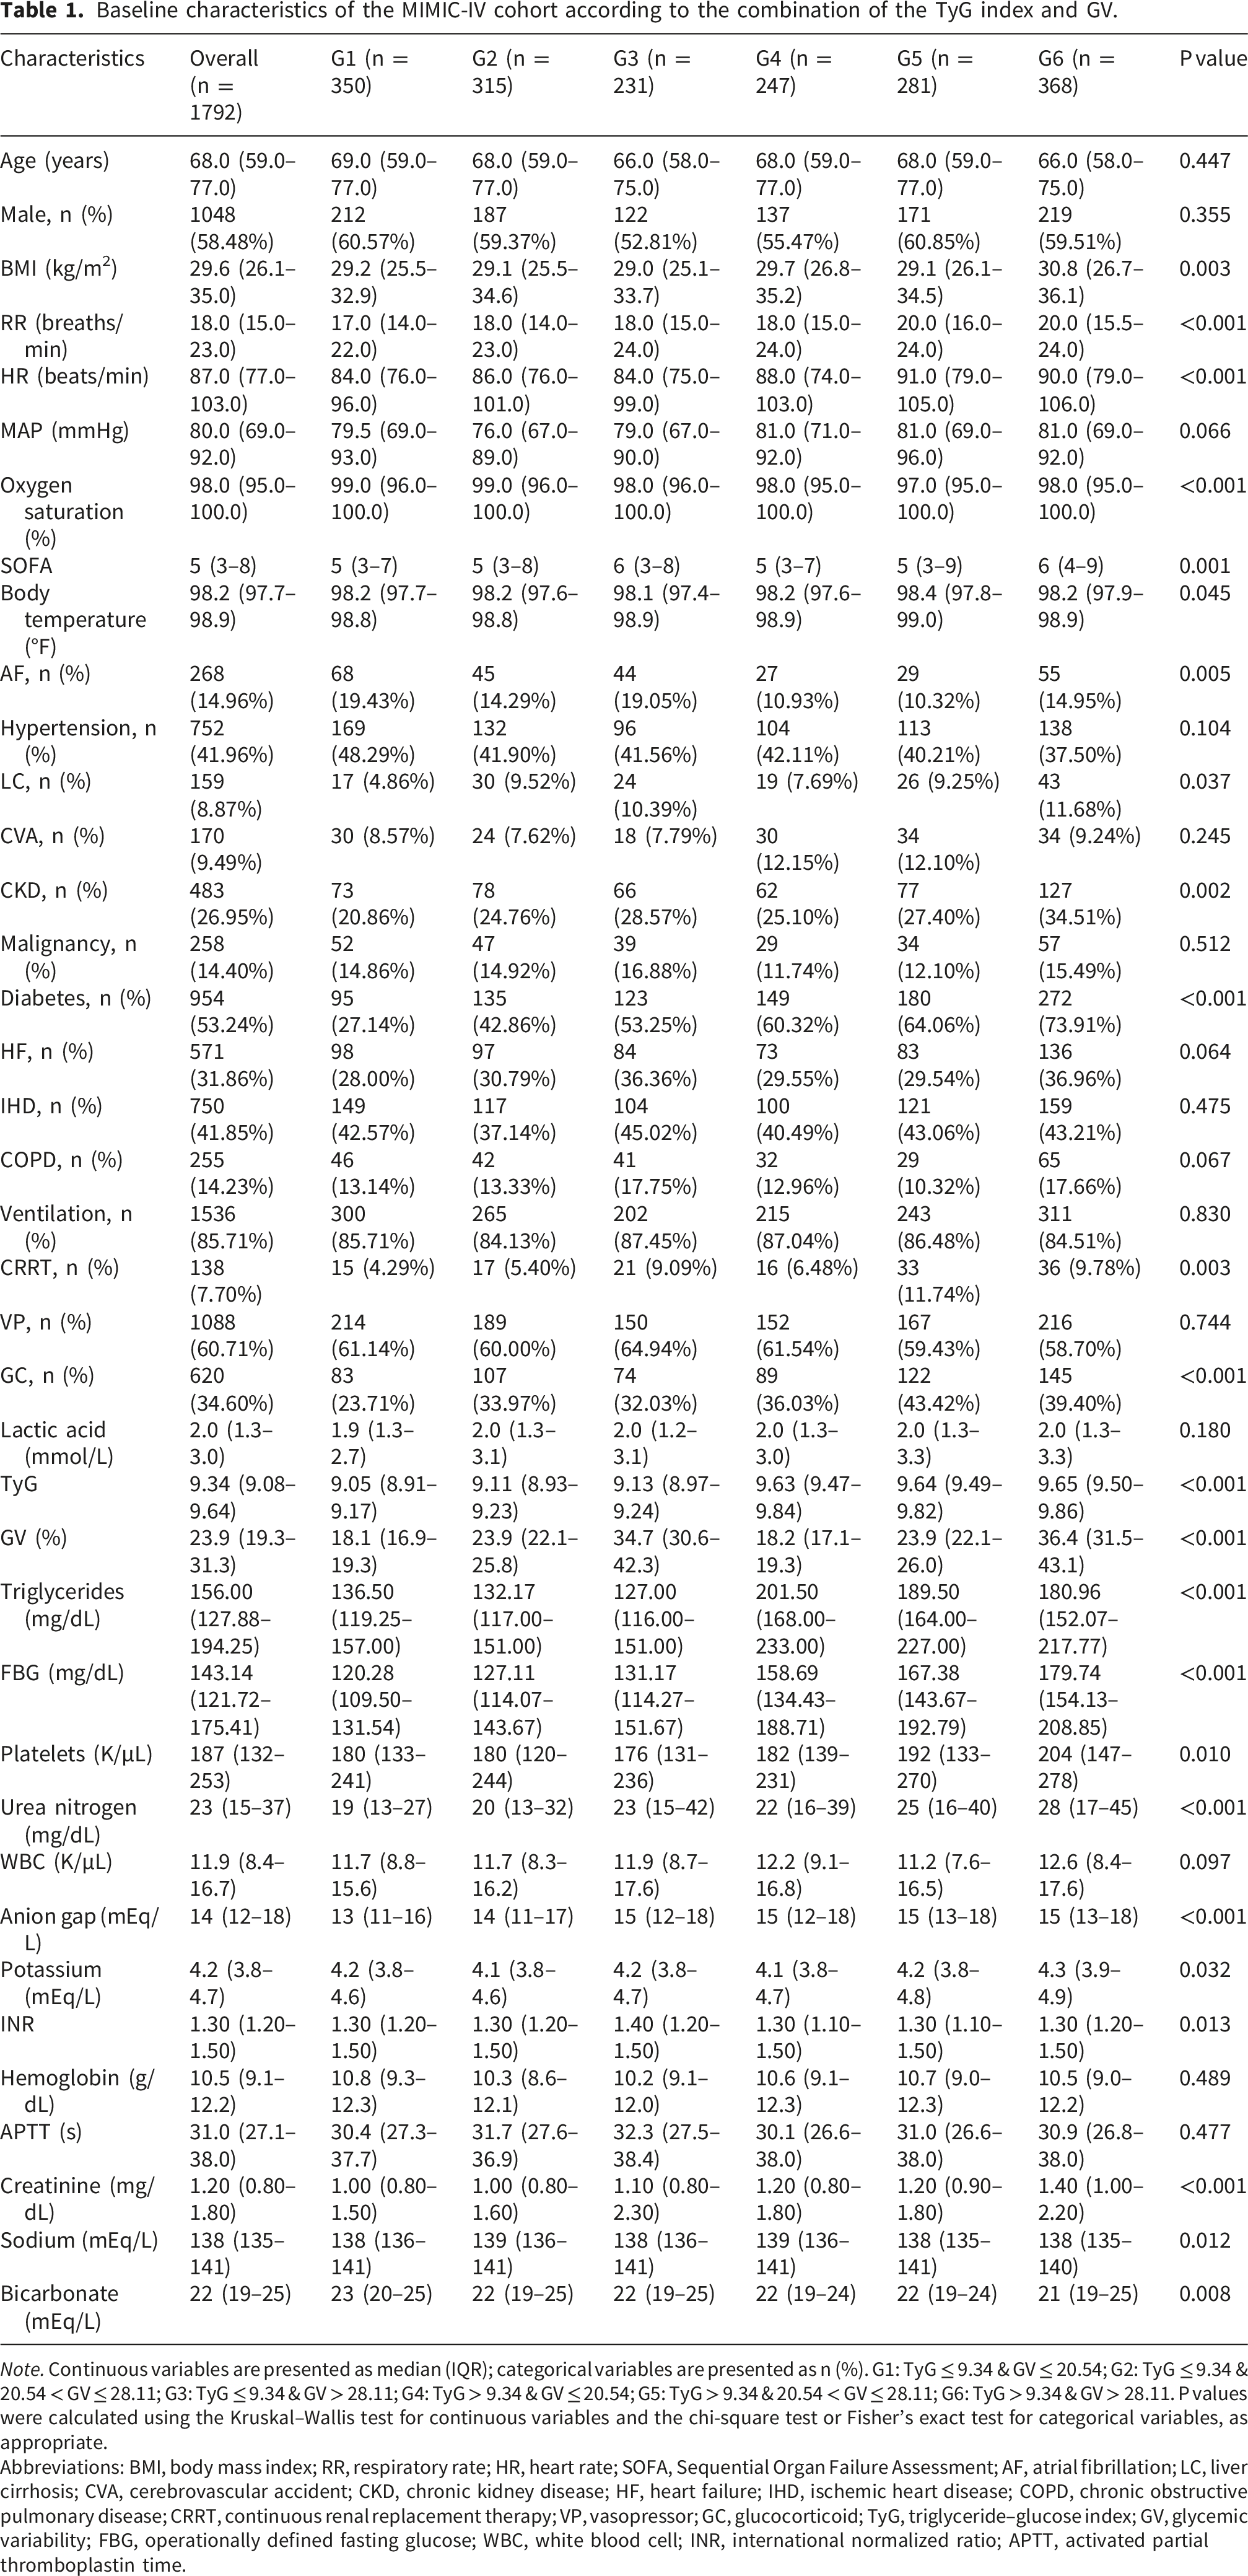
Note. Continuous variables are presented as median (IQR); categorical variables are presented as n (%). G1: TyG ≤ 9.34 & GV ≤ 20.54; G2: TyG ≤ 9.34 & 20.54 < GV ≤ 28.11; G3: TyG ≤ 9.34 & GV > 28.11; G4: TyG > 9.34 & GV ≤ 20.54; G5: TyG > 9.34 & 20.54 < GV ≤ 28.11; G6: TyG > 9.34 & GV > 28.11. P values were calculated using the Kruskal–Wallis test for continuous variables and the chi-square test or Fisher’s exact test for categorical variables, as appropriate.
Abbreviations: BMI, body mass index; RR, respiratory rate; HR, heart rate; SOFA, Sequential Organ Failure Assessment; AF, atrial fibrillation; LC, liver cirrhosis; CVA, cerebrovascular accident; CKD, chronic kidney disease; HF, heart failure; IHD, ischemic heart disease; COPD, chronic obstructive pulmonary disease; CRRT, continuous renal replacement therapy; VP, vasopressor; GC, glucocorticoid; TyG, triglyceride–glucose index; GV, glycemic variability; FBG, operationally defined fasting glucose; WBC, white blood cell; INR, international normalized ratio; APTT, activated partial thromboplastin time.
Comparisons stratified by the TyG index revealed statistically significant differences across the TyG groups in terms of BMI, respiratory rate, heart rate, mean arterial pressure, oxygen saturation, SOFA score, AF, stroke, CKD, diabetes, lactate, platelet count, urea nitrogen, anion gap, serum potassium, and serum creatinine (Supplementary Table S4). Similarly, after stratification by GV, significant differences were observed across groups in terms of respiratory rate, heart rate, SOFA score, LC, CKD, diabetes, HF, COPD, FBG, blood urea nitrogen, WBC, anion gap, serum potassium, INR, creatinine, and serum sodium levels (Supplementary Table S5). Stratified analysis of mortality outcomes revealed that at 90, 180, and 360 days, non-survivors had significantly higher TyG indices and GV than survivors (Supplementary Tables S6–S8).
MIMIC-III carevue subset
Baseline characteristics of the MIMIC-III CareVue subset cohort according to the combination of the TyG index and GV.
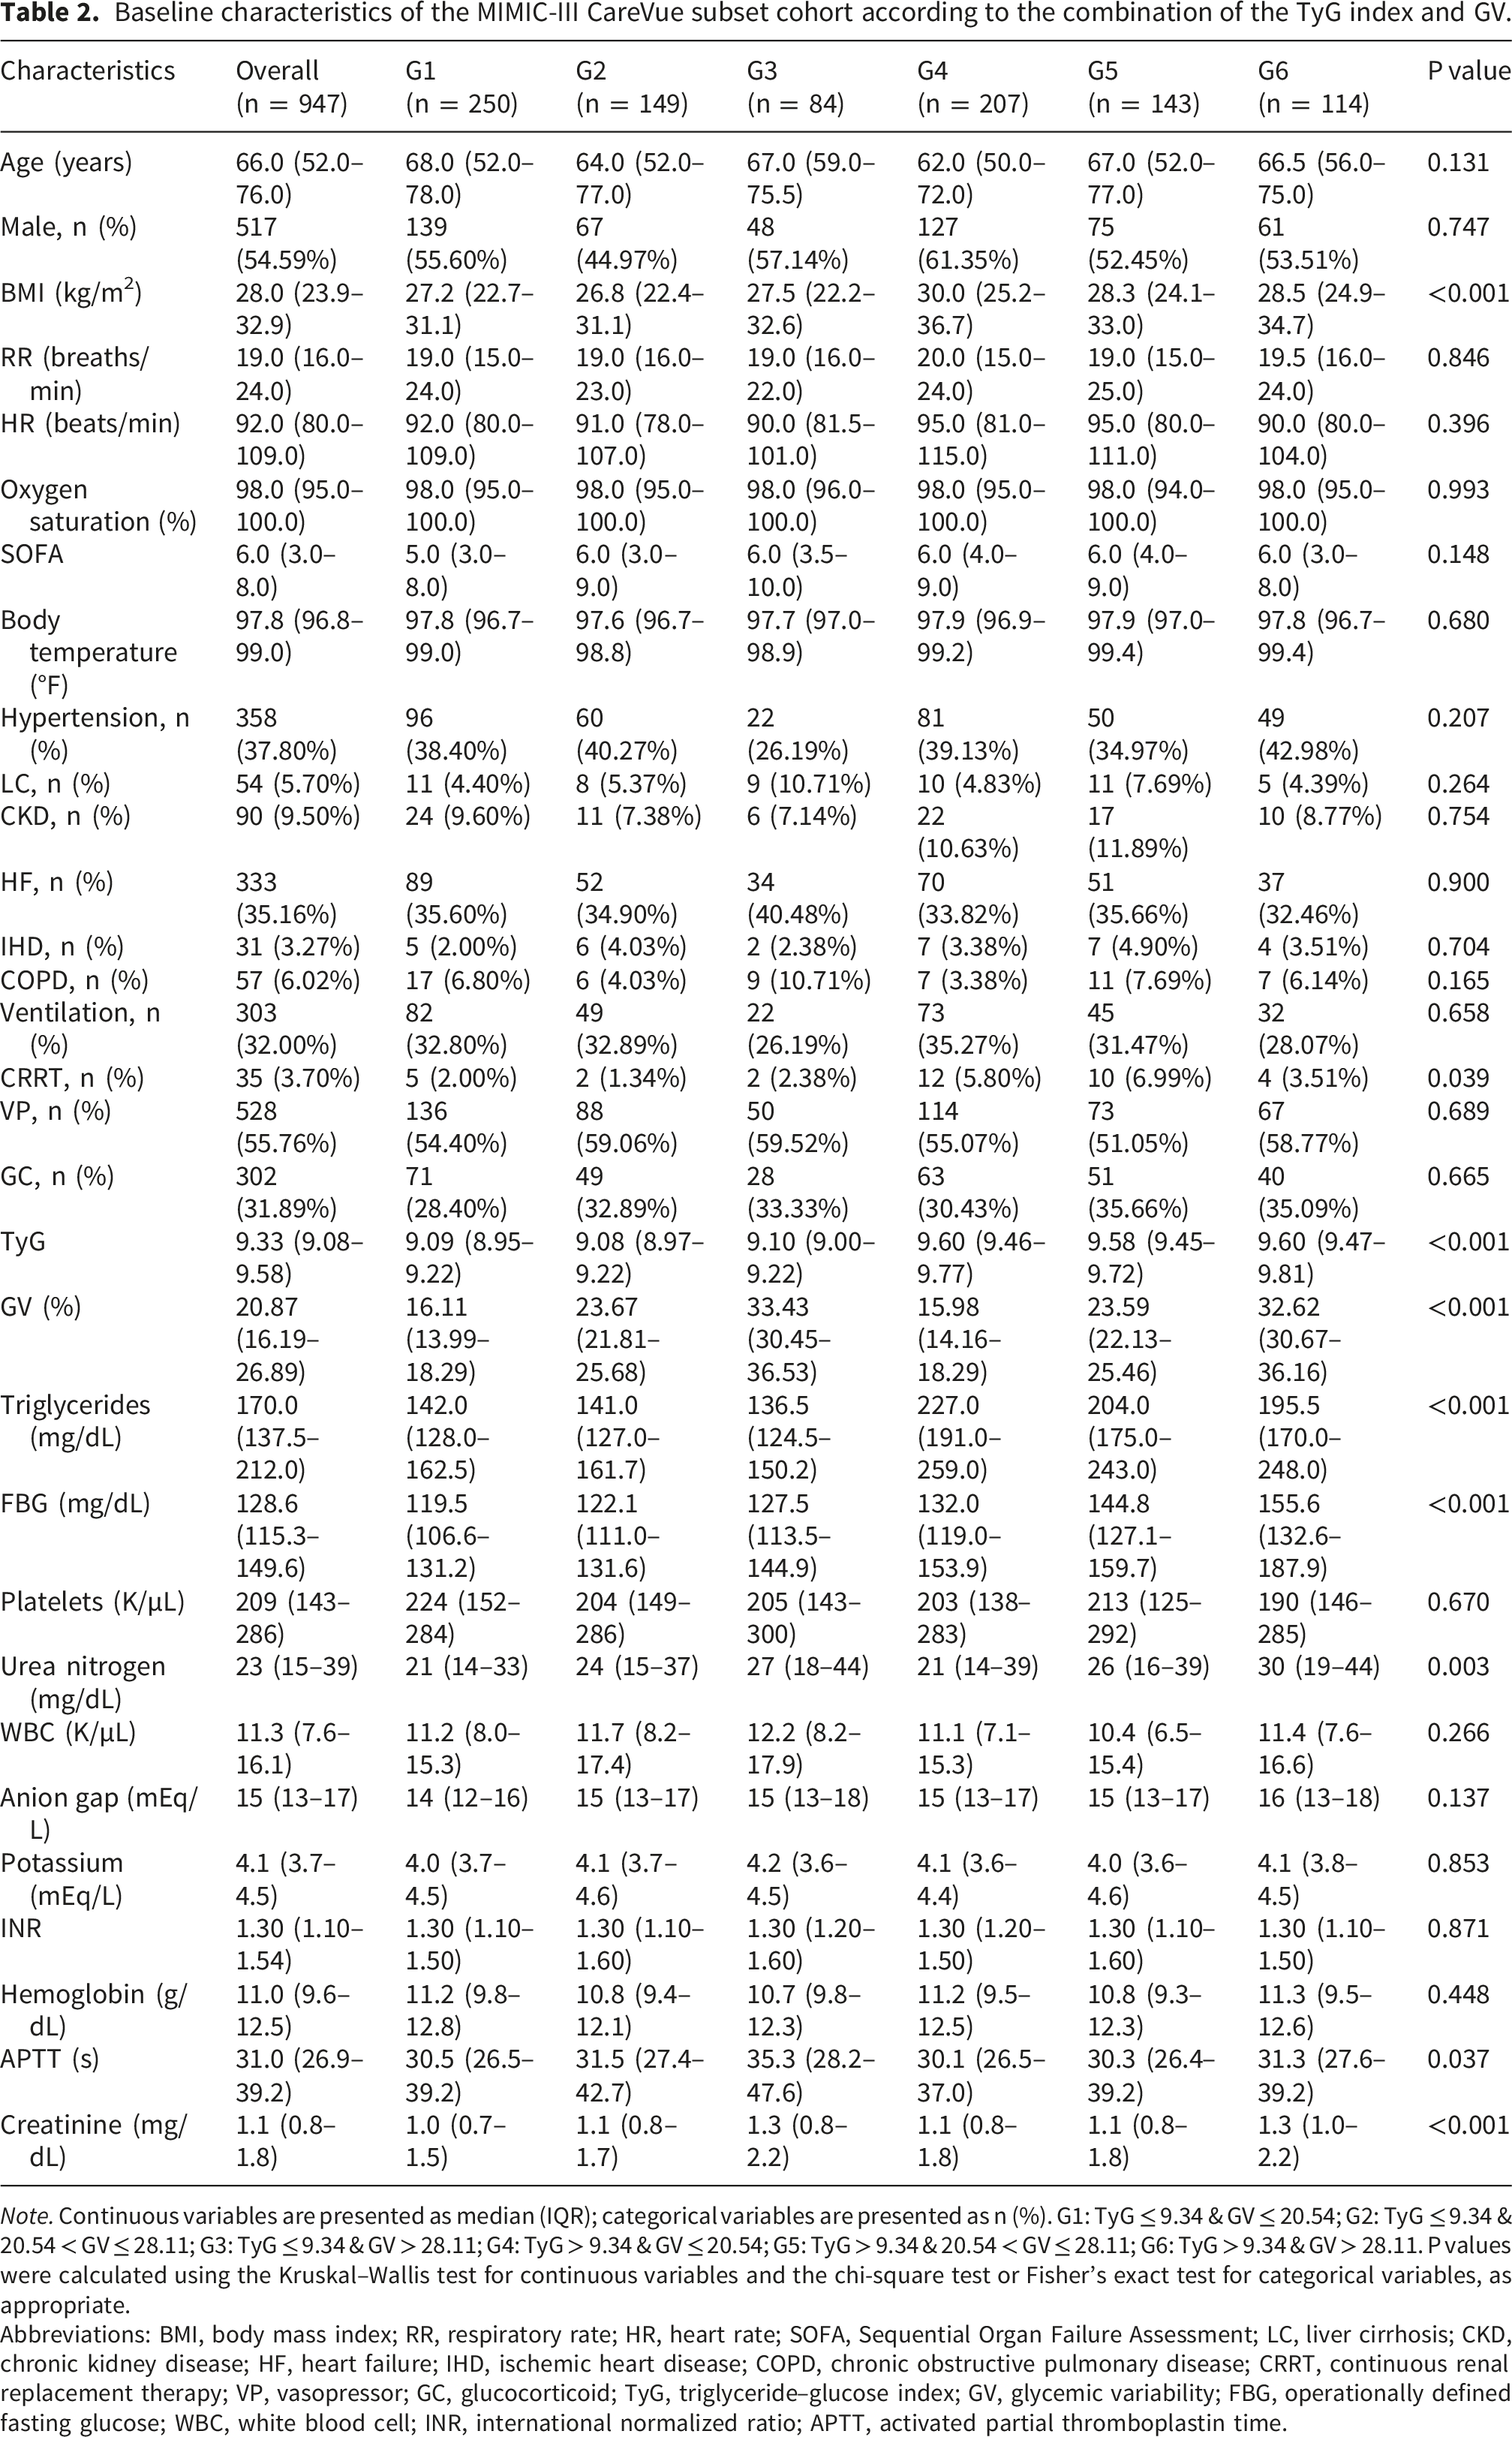
Note. Continuous variables are presented as median (IQR); categorical variables are presented as n (%). G1: TyG ≤ 9.34 & GV ≤ 20.54; G2: TyG ≤ 9.34 & 20.54 < GV ≤ 28.11; G3: TyG ≤ 9.34 & GV > 28.11; G4: TyG > 9.34 & GV ≤ 20.54; G5: TyG > 9.34 & 20.54 < GV ≤ 28.11; G6: TyG > 9.34 & GV > 28.11. P values were calculated using the Kruskal–Wallis test for continuous variables and the chi-square test or Fisher’s exact test for categorical variables, as appropriate.
Abbreviations: BMI, body mass index; RR, respiratory rate; HR, heart rate; SOFA, Sequential Organ Failure Assessment; LC, liver cirrhosis; CKD, chronic kidney disease; HF, heart failure; IHD, ischemic heart disease; COPD, chronic obstructive pulmonary disease; CRRT, continuous renal replacement therapy; VP, vasopressor; GC, glucocorticoid; TyG, triglyceride–glucose index; GV, glycemic variability; FBG, operationally defined fasting glucose; WBC, white blood cell; INR, international normalized ratio; APTT, activated partial thromboplastin time.
Relationship between TyG index and GV levels and mortality in critically ill sepsis patients
Cox proportional hazards models for all-cause mortality by different stratifications of the TyG index and GV.
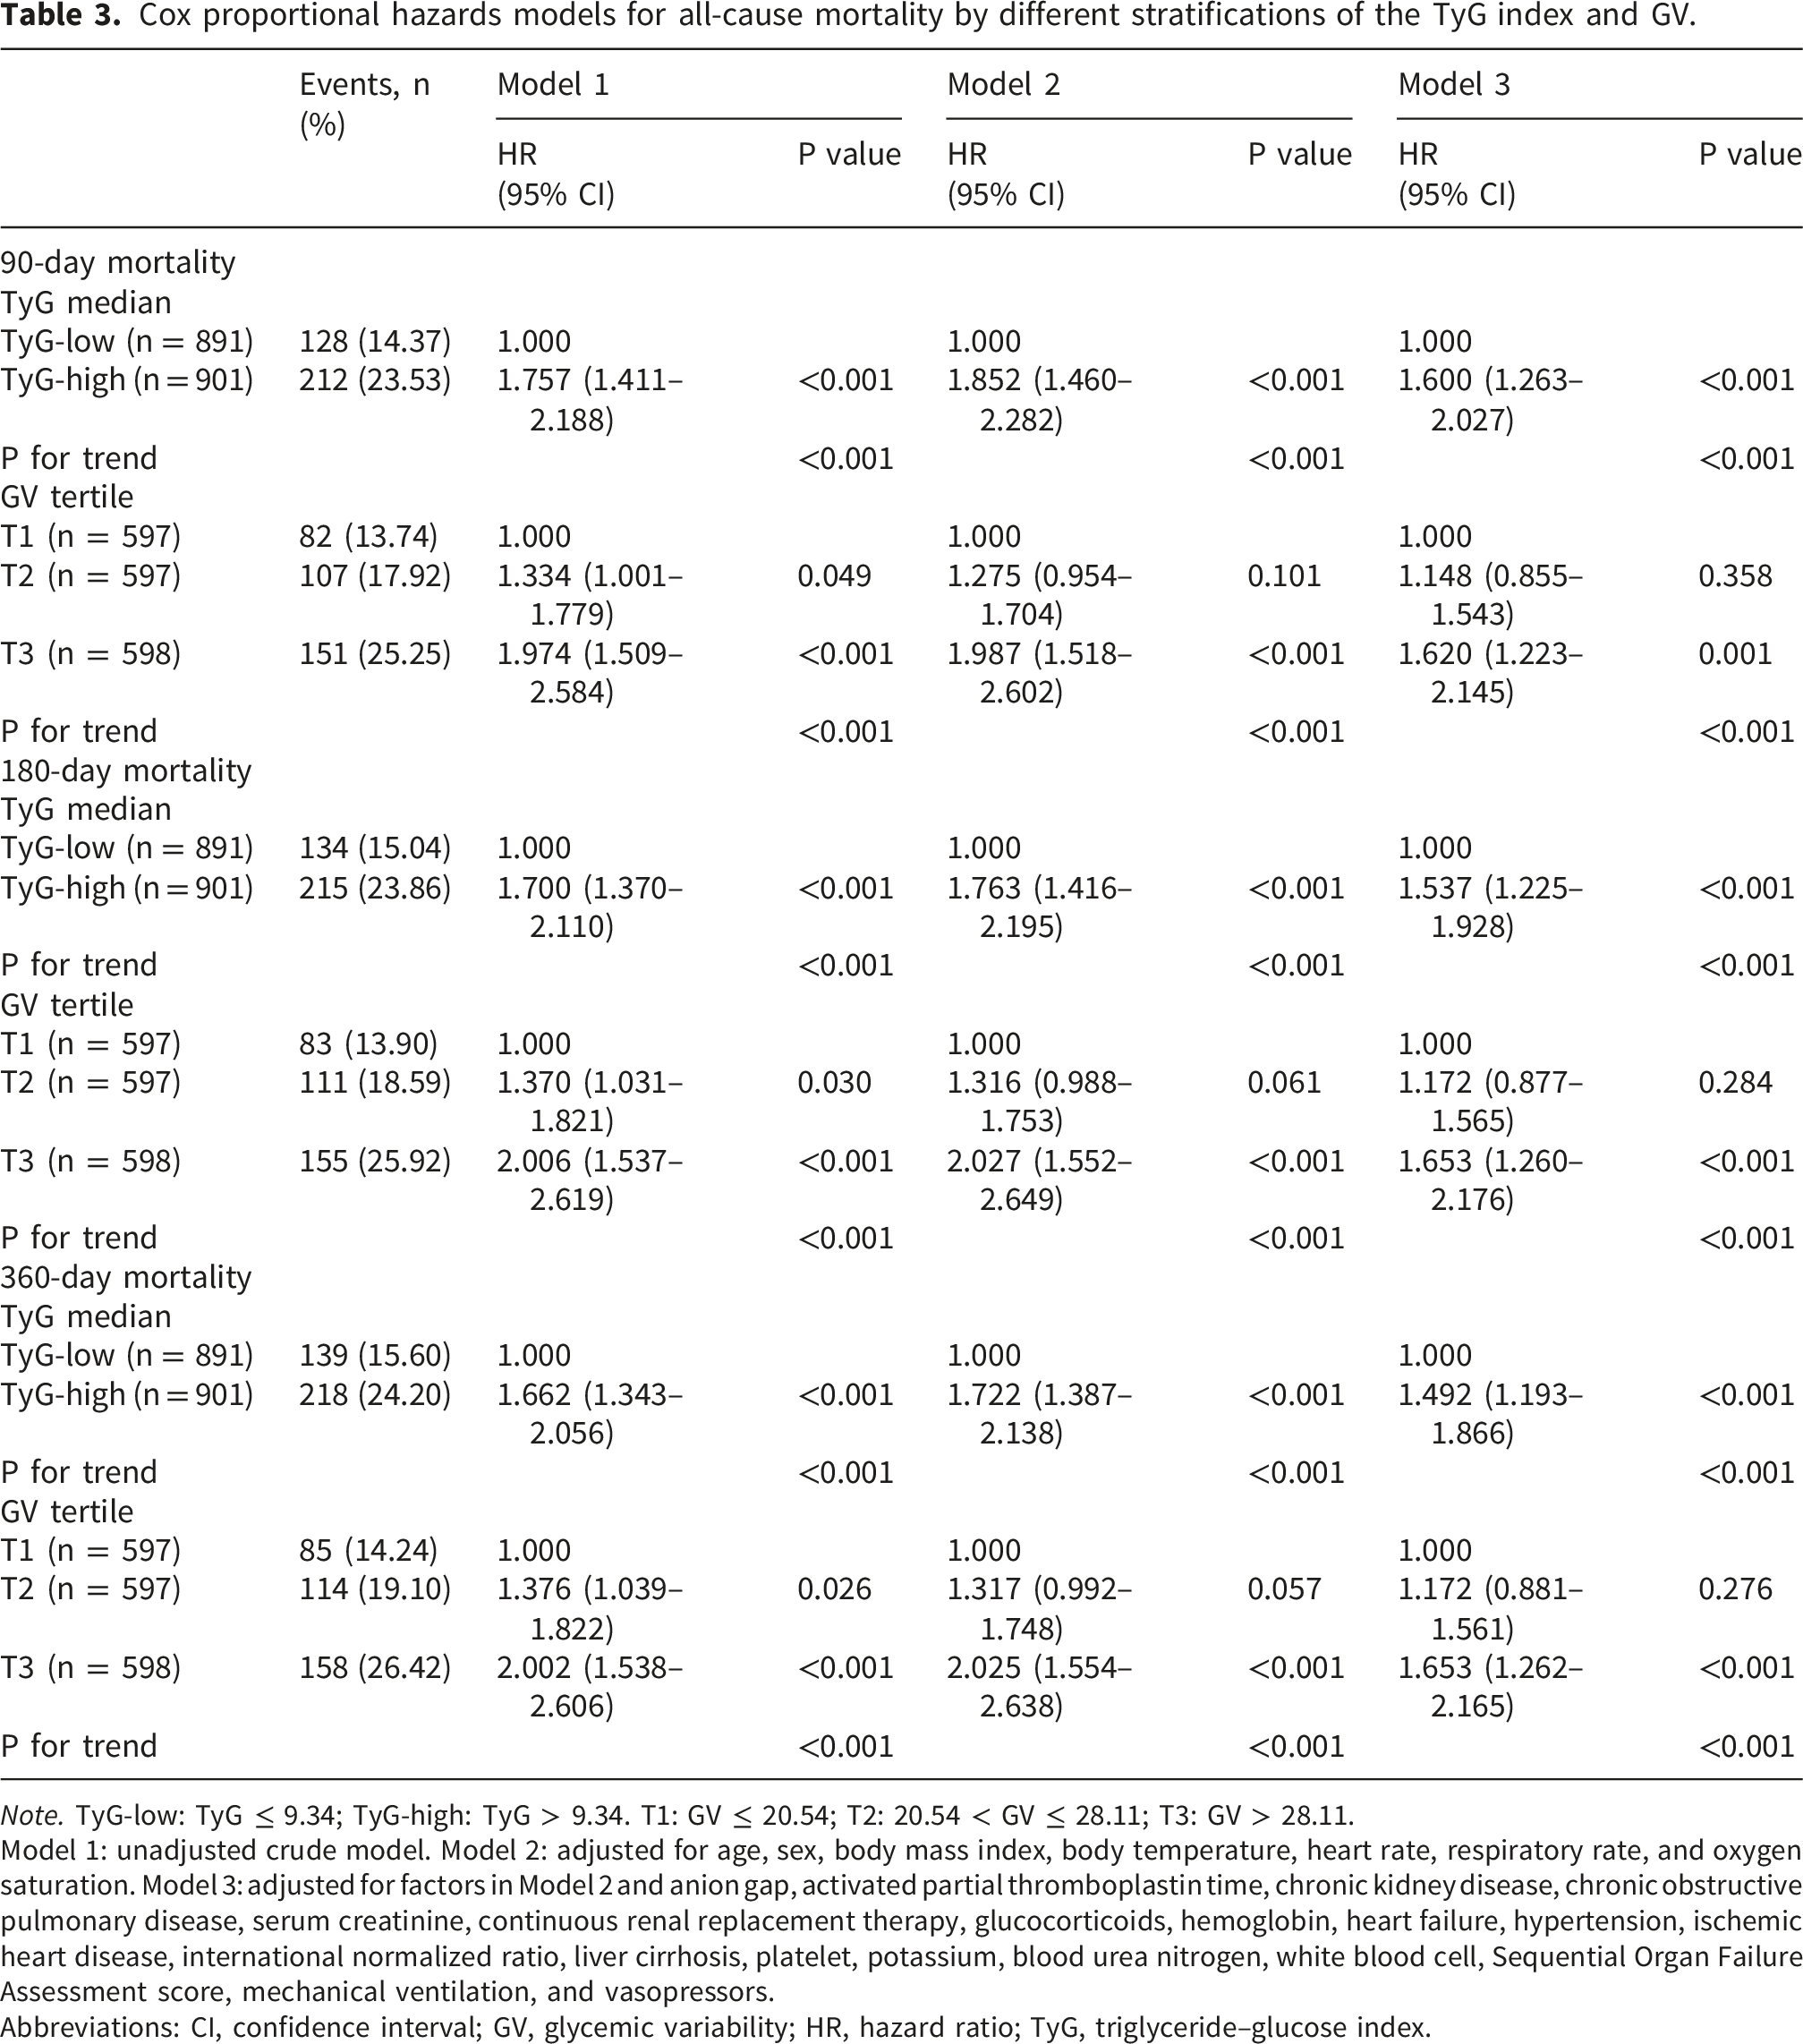
Note. TyG-low: TyG ≤ 9.34; TyG-high: TyG > 9.34. T1: GV ≤ 20.54; T2: 20.54 < GV ≤ 28.11; T3: GV > 28.11.
Model 1: unadjusted crude model. Model 2: adjusted for age, sex, body mass index, body temperature, heart rate, respiratory rate, and oxygen saturation. Model 3: adjusted for factors in Model 2 and anion gap, activated partial thromboplastin time, chronic kidney disease, chronic obstructive pulmonary disease, serum creatinine, continuous renal replacement therapy, glucocorticoids, hemoglobin, heart failure, hypertension, ischemic heart disease, international normalized ratio, liver cirrhosis, platelet, potassium, blood urea nitrogen, white blood cell, Sequential Organ Failure Assessment score, mechanical ventilation, and vasopressors.
Abbreviations: CI, confidence interval; GV, glycemic variability; HR, hazard ratio; TyG, triglyceride–glucose index.
RCS regression analysis (Model 3) revealed a significant nonlinear association between the TyG index and the risk of all-cause mortality at 90, 180, and 360 days (all P-nonlinear < 0.05). Beyond the reference point of TyG = 9.34, mortality risk progressively increased with increasing TyG levels (Figure 2(a) and Supplementary Figures 1A and 1C). In contrast, GV exhibited an approximately linear dose-response relationship with 90-day, 180-day, and 360-day all-cause mortality risk (all P-nonlinear > 0.05). The mortality risk increased continuously with increasing GV (Figure 2(b) Supplementary Figures 1B and 1D). Multivariate (Model 3) adjusted RCS of the associations of the TyG index and GV with 90-day all-cause mortality. Panel A: TyG index and 90-day all-cause mortality; Panel B: GV and 90-day all-cause mortality.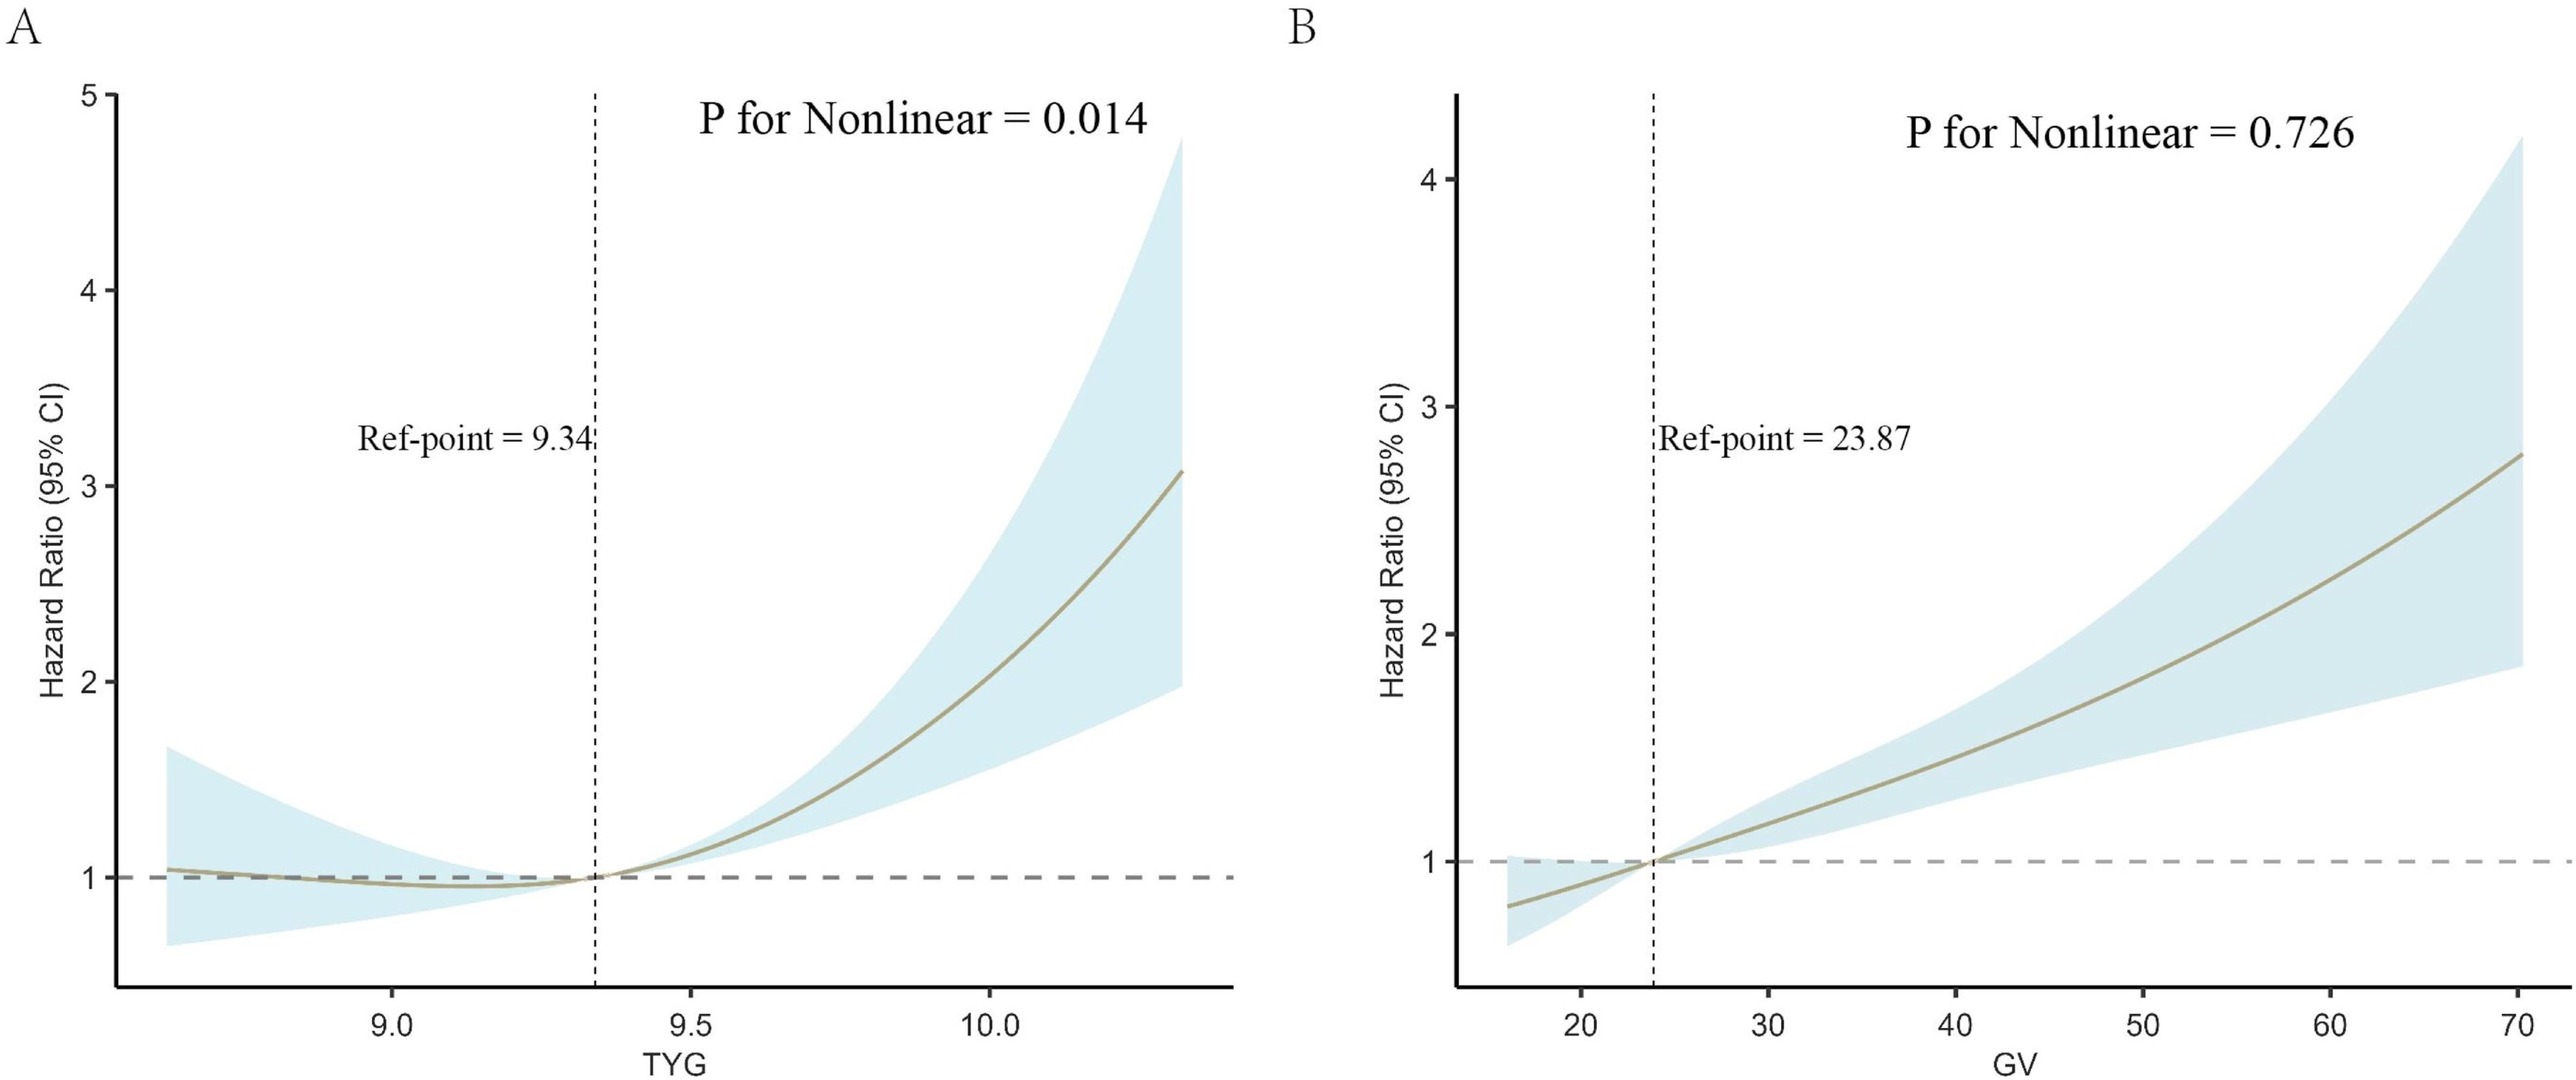
Combined predictive value of TyG index and GV for prognosis in critically ill sepsis patients
In the MIMIC-IV cohort, the adjusted GVIF values for all covariates in the multivariate Cox models (Model 3) for 90-day, 180-day, and 360-day mortality were less than 3, indicating no significant multicollinearity in the models (Supplementary Table S9). Patients were categorized into six TyG–GV combined risk groups (G1–G6) based on the median TyG index (9.34) and GV tertile cutoffs (T1, GV ≤ 20.54; T2, 20.54 < GV ≤ 28.11; and T3, GV > 28.11). Kaplan–Meier analysis revealed significant differences in cumulative mortality across TyG–GV risk groups during the 90-day follow-up (log-rank P < 0.001), with the lowest survival rate observed in G6 (high TyG/high GV) (Figure 3(a)). The same trend was observed at 180-day and 360-day time points (Supplementary Figure 2). Exact event numbers and absolute mortality rates across the six TyG–GV groups are presented in Supplementary Table S11. Using G1 (low TyG/low GV group) as the reference, multivariate Cox regression analysis (Model 3, fully adjusted) demonstrated an increasing trend in 90-day mortality risk with higher combined risk groups (P for trend < 0.001). Mortality risk generally increased with higher GV tertiles within the TyG strata, with the highest risk observed in the G6 group (HR = 2.366, 95% CI: 1.595–3.509, P < 0.001) (Table 4). The results of the 180-day and 360-day analyses were consistent with those of the 90-day analyses, showing a sustained increase in mortality risk in the G6 group (Supplementary Table S10). Exploratory feature importance analyses revealed broadly consistent patterns (Supplementary Figure 3). Kaplan–Meier curves of 90-day all-cause mortality stratified by combined TyG–GV risk groups. Panel A: MIMIC-IV cohort, Panel B: the MIMIC-III CareVue validation cohort. G1: TyG ≤ 9.34 & GV ≤ 20.54; G2: TyG ≤ 9.34 & 20.54 < GV ≤ 28.11; G3: TyG ≤ 9.34 & GV > 28.11; G4: TyG > 9.34 & GV ≤ 20.54; G5: TyG > 9.34 & 20.54 < GV ≤ 28.11; G6: TyG > 9.34 & GV > 28.11. Cox proportional hazards models for 90-day all-cause mortality by the joint effect of the TyG index and GV. Note. G1: TyG ≤ 9.34 & GV ≤ 20.54; G2: TyG ≤ 9.34 & 20.54 < GV ≤ 28.11; G3: TyG ≤ 9.34 & GV > 28.11; G4: TyG > 9.34 & GV ≤ 20.54; G5: TyG > 9.34 & 20.54 < GV ≤ 28.11; G6: TyG > 9.34 & GV > 28.11. TyG cutoff was 9.34, based on the median value in the MIMIC-IV cohort. Model 1: unadjusted crude model. Model 2: adjusted for age, sex, body mass index, body temperature, heart rate, respiratory rate, and oxygen saturation. Model 3: adjusted for factors in Model 2 and anion gap, activated partial thromboplastin time, chronic kidney disease, chronic obstructive pulmonary disease, serum creatinine, continuous renal replacement therapy, glucocorticoids, hemoglobin, heart failure, hypertension, ischemic heart disease, international normalized ratio, liver cirrhosis, platelet, potassium, blood urea nitrogen, white blood cell, Sequential Organ Failure Assessment score, mechanical ventilation, and vasopressors. Abbreviations: CI, confidence interval; GV, glycemic variability; HR, hazard ratio; TyG, triglyceride-glucose index.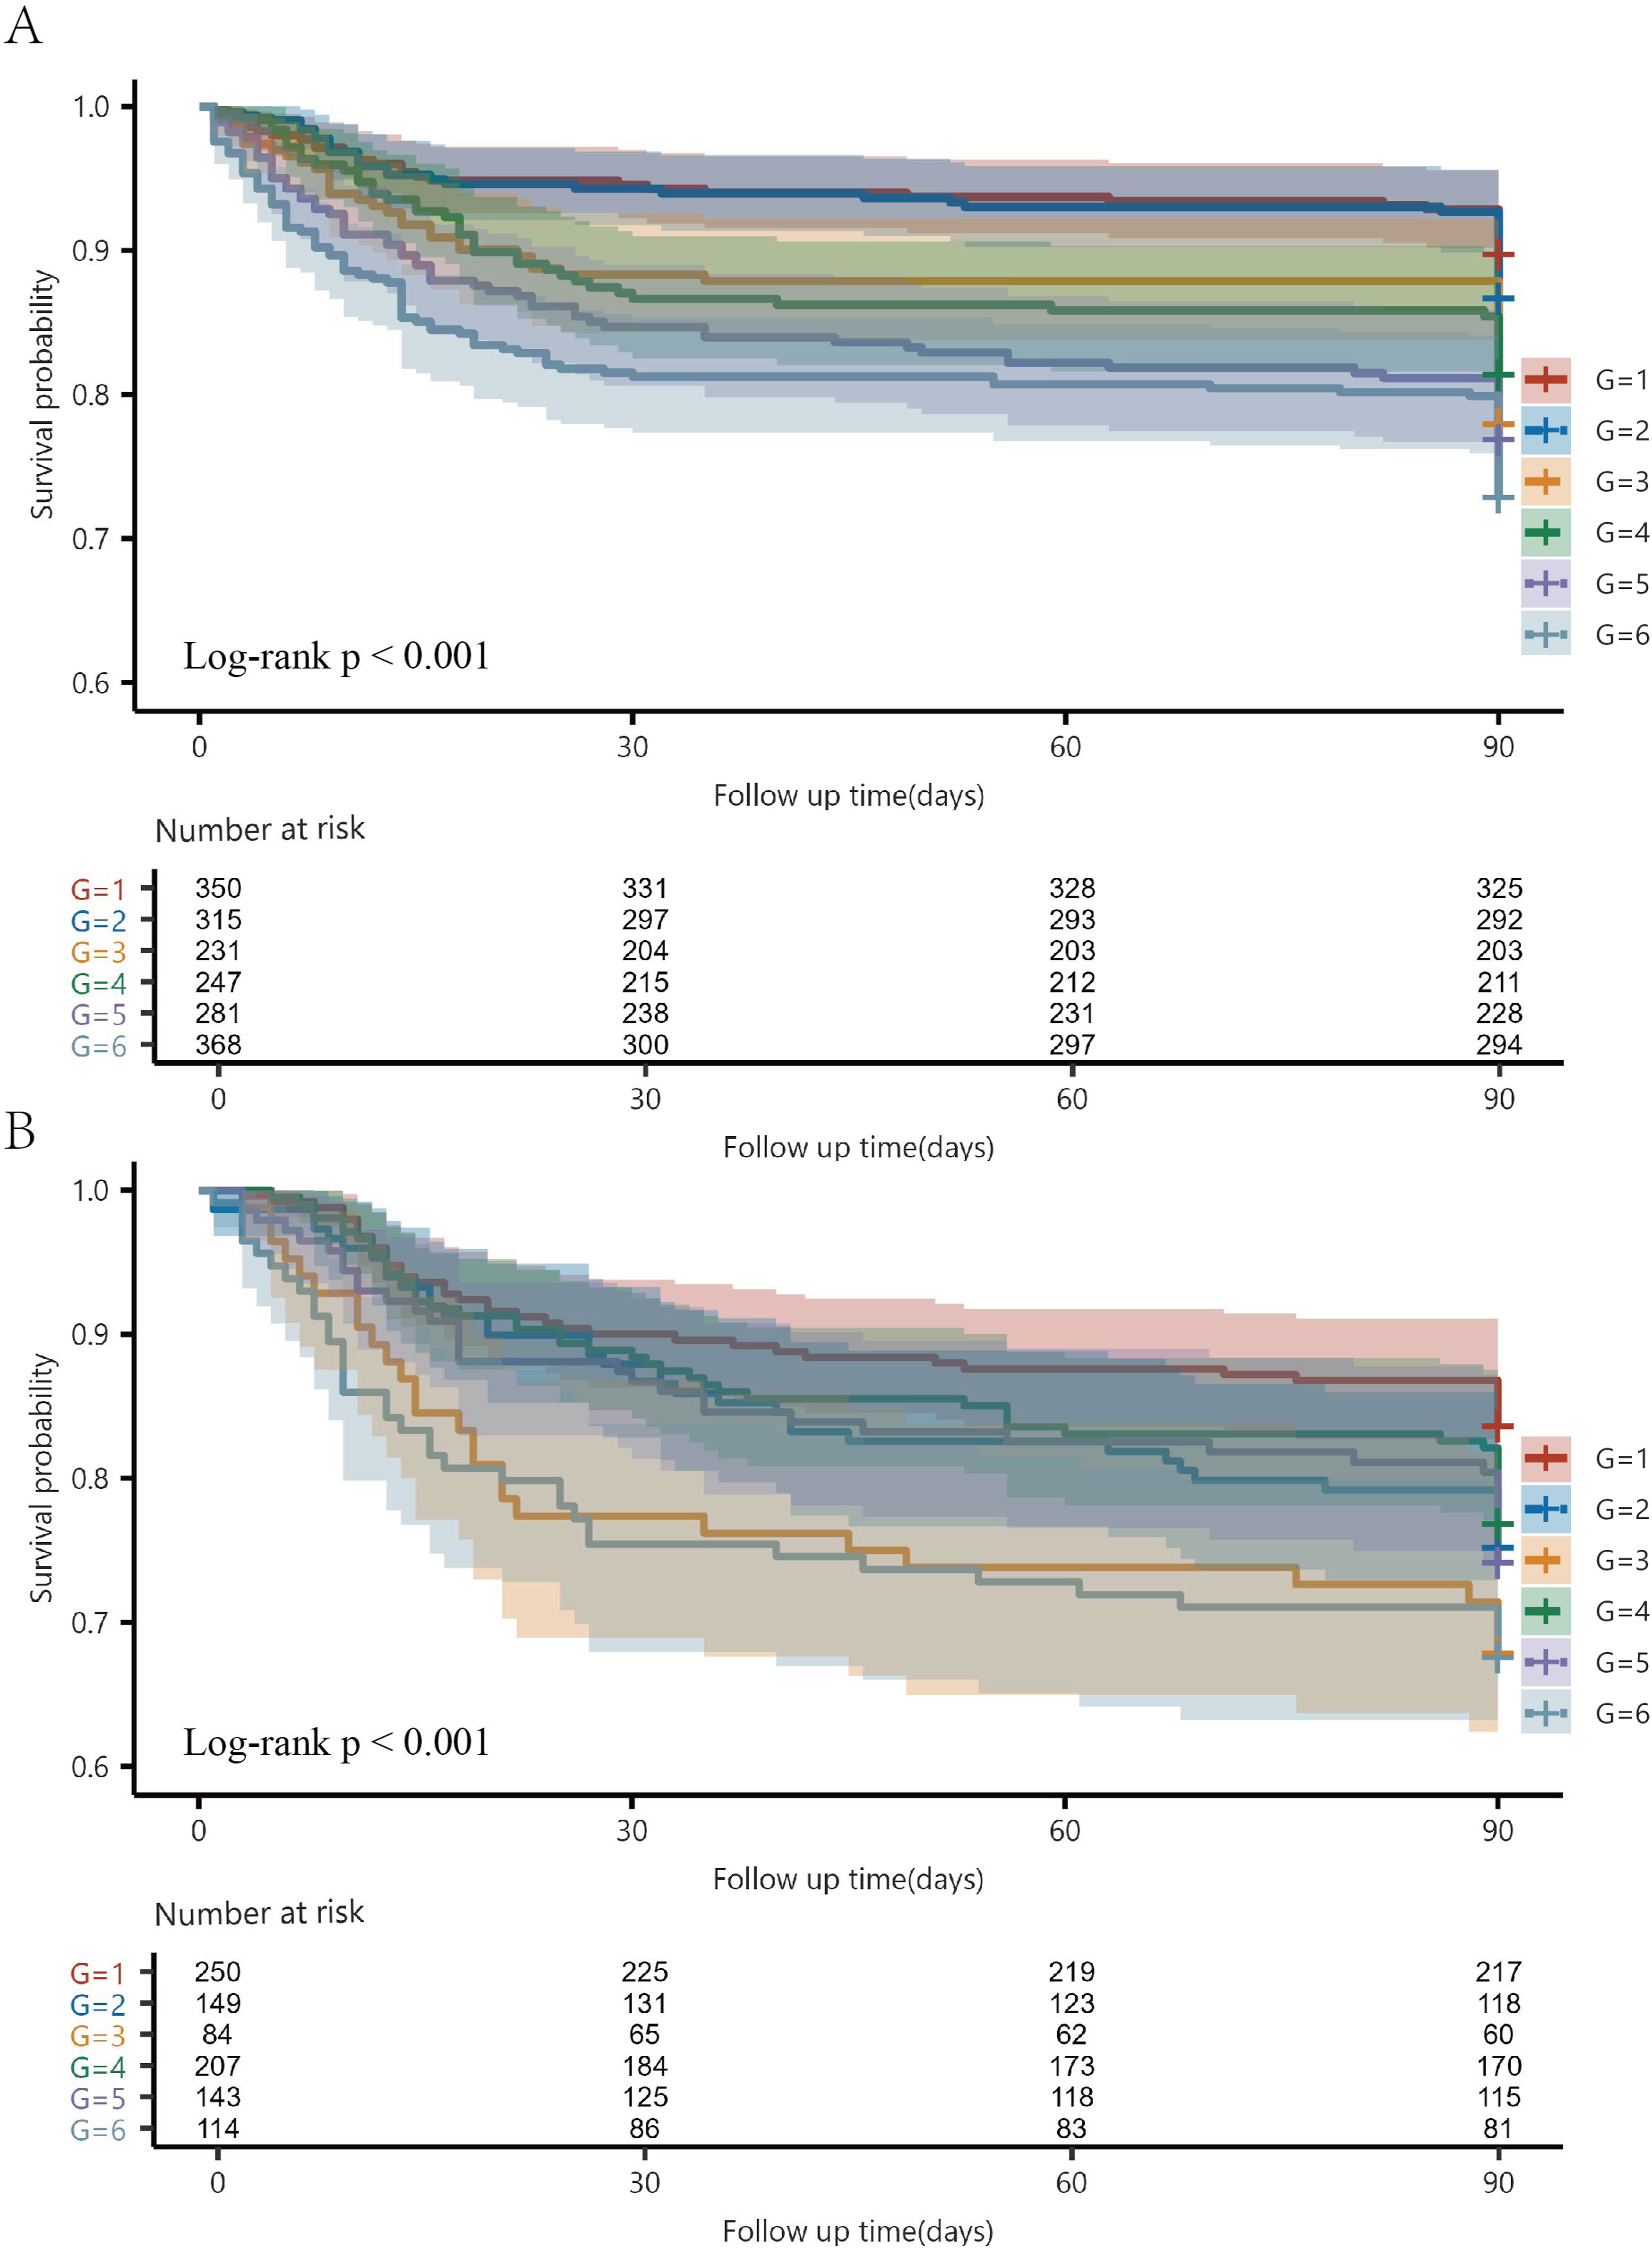
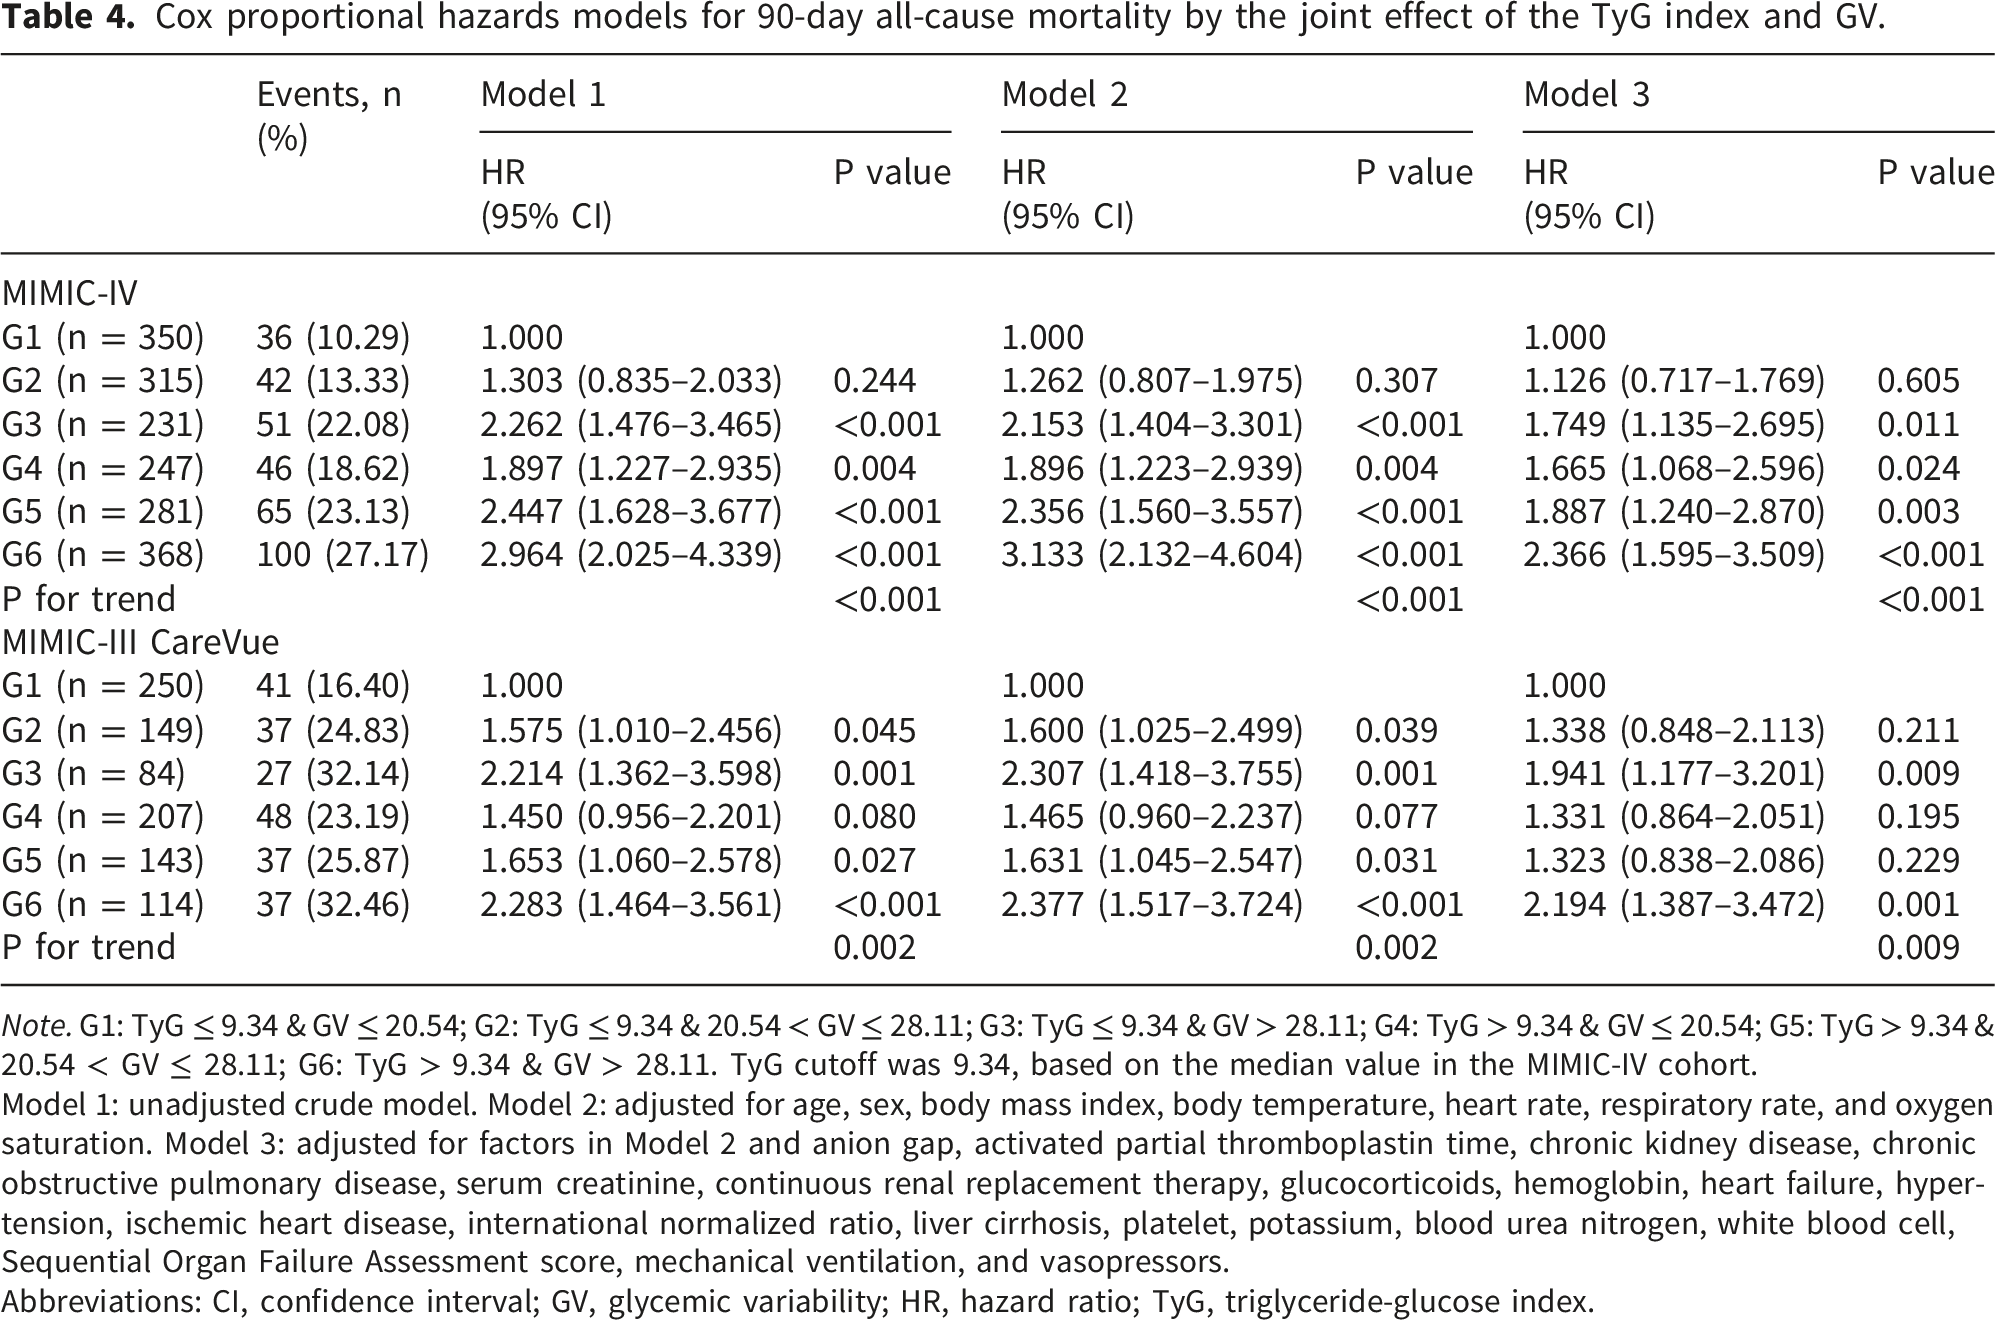
In the MIMIC-III CareVue subset cohort, Kaplan–Meier analysis demonstrated significant differences in cumulative mortality rates across the TyG–GV risk groups during the 90-day follow-up period (log-rank P < 0.001), with the G6 group (high TyG/high GV) exhibiting the lowest survival rate (Figure 3(b)). Using G1 (low TyG index/low GV group) as the reference, multivariate Cox regression analysis (Model 3, fully adjusted) demonstrated an increasing trend in the 90-day mortality risk across higher combined risk groups (P for trend = 0.009). A similar pattern was observed in the external validation cohort, with the highest mortality risk observed in the G6 group (HR = 2.194, 95% CI, 1.387–3.472; P = 0.001) (Table 4).
Sensitivity analyses
Sensitivity analyses showed that the results were generally robust across various alternative specifications. To assess whether the GV estimation was influenced by the ICU observation time and sampling density, we summarized the number of glucose measurements, ICU observation window, and frequency of the glucose measurements. The overall median number of glucose measurements during the ICU stay was 8 (IQR, 4–16), and the median ICU observation window for the GV calculation was 3.03 days (IQR, 1.54–7.00). Across the GV tertiles, the median numbers of glucose measurements were 8, 9, and 7 for T1, T2, and T3, respectively (P < 0.001), whereas the median ICU observation windows were 2.98, 3.32, and 2.79 days, respectively, with no statistically significant difference (P = 0.056). The frequency of glucose measurements was also similar across the GV tertiles (P = 0.367) (Supplementary Tables S12 and S13).
To reduce potential survivorship bias related to ICU stay duration and glucose sampling opportunity, early GV was recalculated using glucose measurements within the first 48 h after ICU admission; all patients had at least three measurements during this period. The G4, G5, and G6 groups remained significantly associated with increased 90-day all-cause mortality in the fully adjusted model (Supplementary Table S14). After recalculating the TyG index using the first available glucose value after ICU admission, the association between the combined TyG–GV phenotype and all-cause mortality risk was consistent with that of the primary analysis (Supplementary Table S15).
Further sensitivity analyses supported the robustness of these findings. After additional adjustment for mean blood glucose, hypoglycemia, glucose measurement frequency, and GV calculation duration, the G6 group remained significantly associated with an increased risk of all-cause mortality at 90, 180, and 360 days (Supplementary Tables S16–S18). In the parsimonious adjustment model, the association between the combined TyG–GV phenotype and mortality remained consistent with that of the primary analyses. The G6 group remained associated with the highest risk of 90-day, 180-day, and 360-day all-cause mortality, with HRs of 2.731, 2.714, and 2.608, respectively (all P < 0.001) (Supplementary Table S19).
Model performance evaluation
In the MIMIC-IV cohort, the discriminatory ability progressively increased across models based on TyG–GV combined grouping: the AUC for the unadjusted model (Model 1) was 0.613 (95% CI, 0.581–0.645), the partially adjusted model (Model 2) improved to 0.665 (95% CI, 0.632–0.697), and the fully adjusted model (Model 3) demonstrated the highest discriminatory ability for 360-day mortality (AUC = 0.747, 95% CI, 0.718–0.775). Stepwise models with 180-day and 360-day mortality as outcomes showed similar trends (Supplementary Figure 4). ROC analysis showed that the combined model incorporating the TyG index and GV demonstrated a modest improvement in discriminatory ability compared with the baseline model for predicting 90-day all-cause mortality (AUC 0.743 [95% CI, 0.714–0.773] vs. 0.730 [95% CI, 0.700–0.760], ΔAUC = 0.013, P = 0.048) (Supplementary Table S21 and Figure 4(a)). Beyond AUC, cfNRI and IDI further supported the incremental value of adding TyG and GV to the baseline model: the 90-day cfNRI was 0.131 (95% CI, 0.038–0.226; P = 0.006), and the IDI was 0.032 (95% CI, 0.006–0.060; P = 0.008), with 180-day and 360-day results generally consistent with the 90-day results (Supplementary Table S20 and Figure 4(b)–(c)). To further evaluate the added value of TyG and GV beyond traditional ICU severity indices, we used SOFA alone and SOFA plus lactate as reference models. The addition of TyG and GV modestly but significantly improved the AUCs for 90-, 180-, and 360-day mortality prediction beyond SOFA alone, with ΔAUCs of 0.038, 0.038, and 0.035, respectively. Similar improvements were observed beyond SOFA plus lactate, with ΔAUCs of 0.037, 0.036, and 0.034, respectively, all of which reached statistical significance (Supplementary Table S22). In the MIMIC-IV cohort, calibration was assessed using calibration curves, Brier scores, and calibration slopes. The combined model showed slightly lower Brier scores and calibration slopes closer to 1 than the baseline model, suggesting modestly improved calibration and overall prediction accuracy (Supplementary Table S23 and Supplementary Figure 5). Decision curve analysis was performed using the MIMIC-IV cohort. The combined model showed a slightly higher net benefit than the baseline model within certain threshold probability ranges for 90-day, 180-day, and 360-day outcomes; however, this finding should be interpreted as limited incremental net benefit rather than evidence of direct bedside clinical utility (Supplementary Figure 6). Time-dependent ROC curves in the MIMIC-IV cohort for predicting all-cause mortality at 90, 180, and 360 days based on the fully adjusted Cox proportional hazards model (Model 3). Panel A: 90-day all-cause mortality; Panel B: 180-day all-cause mortality; Panel C: 360-day all-cause mortality. The baseline model is compared with the baseline model plus TyG index, plus GV, and plus both TyG index and GV.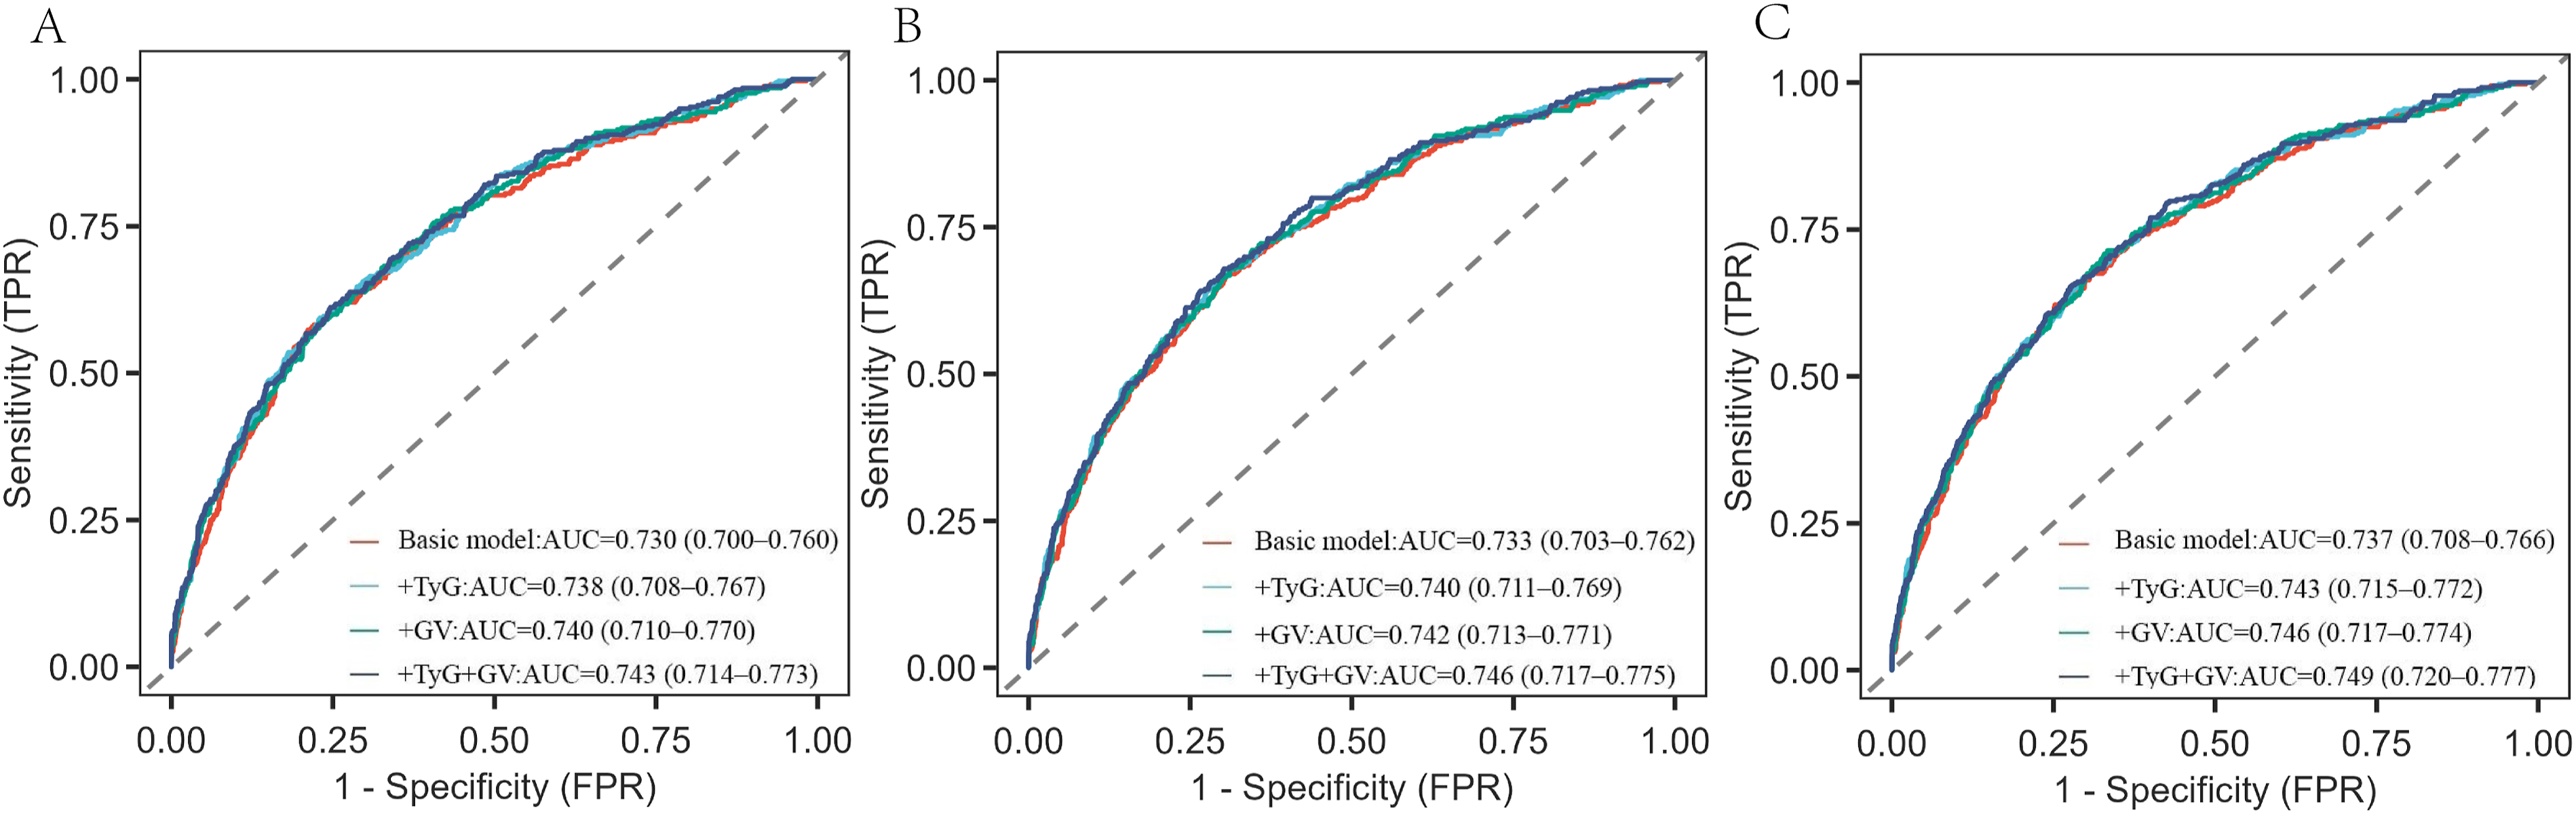
In the MIMIC-III CareVue subset cohort, ROC analysis showed that the combined model incorporating the TyG index and GV demonstrated a modestly higher discriminatory ability for predicting 90-day all-cause mortality compared with the baseline model (AUC 0.682 [95% CI, 0.639–0.726] vs. 0.669 [95% CI, 0.624–0.724], ΔAUC = 0.013, P = 0.047) (Supplementary Table S21 and Supplementary Figure 7). These external validation results were directionally consistent with those from the MIMIC-IV cohort.
Subgroup analysis
Subgroup analysis of the association between the combined TyG–GV phenotype and 90-day all-cause mortality risk.
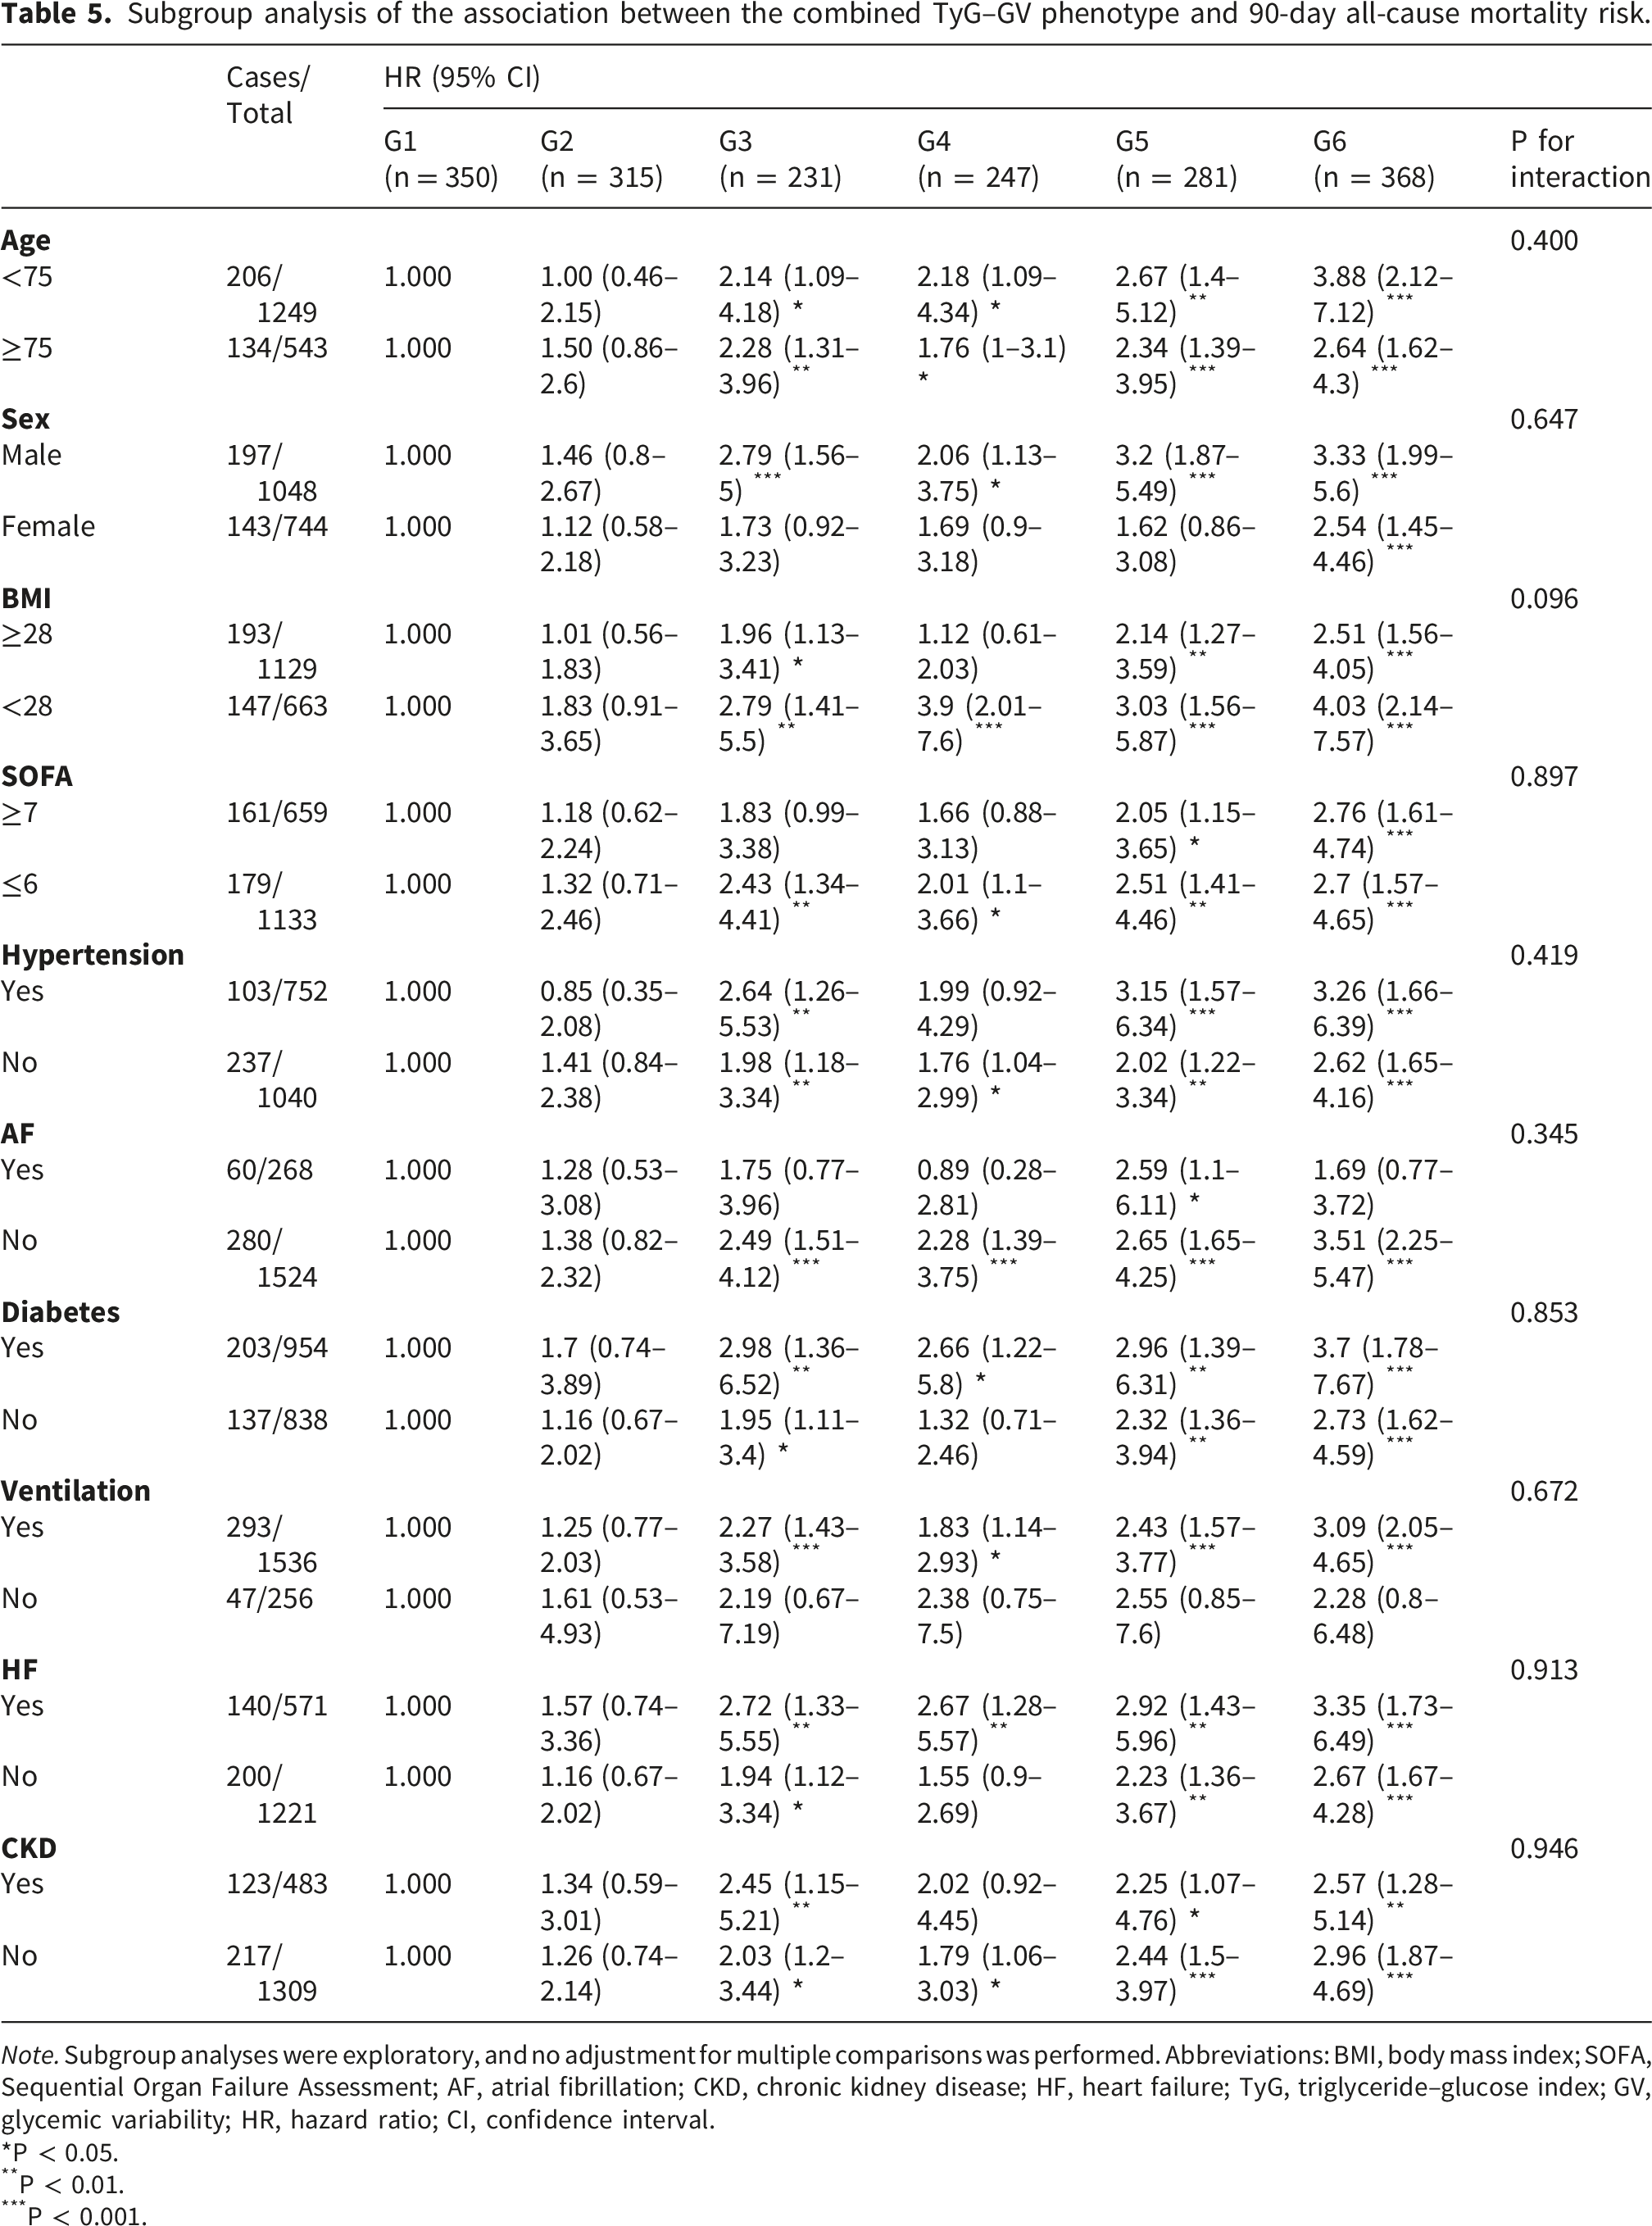
Note. Subgroup analyses were exploratory, and no adjustment for multiple comparisons was performed. Abbreviations: BMI, body mass index; SOFA, Sequential Organ Failure Assessment; AF, atrial fibrillation; CKD, chronic kidney disease; HF, heart failure; TyG, triglyceride–glucose index; GV, glycemic variability; HR, hazard ratio; CI, confidence interval.
*P < 0.05.
**P < 0.01.
***P < 0.001.
Discussion
This study, based on a cohort of critically ill patients with sepsis from the MIMIC-IV database, demonstrated that the combined assessment of the TyG index and glycemic variability (GV) provides supplementary prognostic information for 90-day, 180-day, and 360-day all-cause mortality. Patients with simultaneously elevated TyG and GV (TyG > 9.34 and GV > 28.11) exhibited the highest mortality risk, suggesting that the coexistence of elevated TyG and GV may identify a combined high-risk metabolic phenotype. Notably, in the diabetes subgroup, the risk association in some intermediate TyG–GV groups appeared to attenuate over a longer follow-up period, whereas no significant interaction was observed in the subgroup analyses, suggesting broadly consistent directions of association across the subgroups. Regarding model performance, the combined model showed statistically detectable but modest improvements in discrimination at 90, 180, and 360 days compared with the baseline model. The AUCs of the combined model at 90, 180, and 360 days were 0.743 (0.714–0.773), 0.746 (0.717–0.775), and 0.749 (0.720–0.777), respectively. In addition, cfNRI and IDI demonstrated improvements after TyG and GV were added to the baseline models. In contrast, the AUC increases achieved by adding TyG or GV alone did not reach statistical significance. These findings suggest that incorporating both TyG and GV into the model may facilitate a more comprehensive characterization of sepsis-associated metabolic vulnerability, yielding limited but detectable incremental discriminatory value. Further comparison with SOFA alone and SOFA plus lactate showed that adding TyG and GV statistically significantly but modestly improved AUC. Nevertheless, the absolute magnitude of improvement remained limited, supporting the interpretation that the TyG–GV phenotype provides supplementary metabolic information rather than replacing established risk markers such as the SOFA score or lactate level. Although model discrimination improved statistically significantly after incorporating TyG and GV into the baseline model, the absolute gain was small. In the MIMIC-IV cohort, the AUC for predicting 90-day mortality increased from 0.730 to 0.743 (ΔAUC = 0.013); a similar ΔAUC of 0.013 was also observed in the MIMIC-III CareVue validation cohort. Therefore, this result should be interpreted as a statistically detectable but clinically limited improvement. Such a small increase is unlikely to directly alter bedside clinical decision-making or sepsis management strategies. Consequently, the TyG–GV phenotype should be regarded as a supplementary source of metabolic prognostic information rather than an independent clinical decision-making tool, and should not be considered a replacement for established disease severity scores. Although the AUC improved to some extent when TyG and GV were added to SOFA alone and SOFA plus lactate models, this study did not directly evaluate APACHE II, SAPS II, or dynamic SOFA trajectories; therefore, we cannot conclude that TyG–GV outperforms these established prognostic tools. Future prospective studies are needed to determine whether TyG–GV provides clinically meaningful incremental value for dynamic risk assessment. Previous large-scale studies across diverse populations have consistently demonstrated that elevated TyG indices correlate with increased morbidity and mortality in critically ill patients and those with infectious diseases.21–23 TyG has gained widespread application as an accessible surrogate marker for metabolic dysfunction and insulin resistance (IR) in fields such as atherosclerosis and cardiovascular disease.24–26 This study further confirmed that the TyG index is significantly associated with all-cause mortality risk at different time points in critically ill patients with sepsis. Compared with the lower TyG group, the higher TyG group exhibited increased mortality risk at 90-day, 180-day, and 360-day follow-ups. Importantly, in critically ill patients with sepsis, the TyG index should not be interpreted as a marker of chronic insulin resistance. As both triglyceride and glucose levels can be influenced by acute critical illness, TyG may reflect acute metabolic stress. Triglyceride levels may be affected by inflammation-related lipid metabolic disturbances, nutritional status, liver function, and therapeutic interventions, whereas glucose levels may be influenced by stress hyperglycemia, counter-regulatory hormone activation, glucocorticoid exposure, nutritional delivery, and insulin therapy. Therefore, in patients with sepsis, the TyG index should be interpreted primarily as an integrated marker of acute metabolic stress and metabolic vulnerability, with possible contributions from stress-related insulin-resistance pathways, rather than as a direct measure of chronic insulin resistance. Mechanistically, elevated TyG may represent a stress-related metabolic phenotype linked to glucose and lipid dysregulation, inflammation, endothelial dysfunction, and cardiovascular burden.6,27,28 These pathways may help explain the association between higher TyG and adverse outcomes, but the present study cannot determine whether TyG reflects causal insulin-resistance mechanisms in sepsis. In addition, metabolic abnormalities may amplify inflammatory responses, promote cytokine release and organ dysfunction, and thereby contribute to increased mortality risk. 29 Regarding dose-response relationships, previous studies on outcomes such as ICU mortality, in-hospital mortality, and 28-day mortality have often suggested a near-linear increase in risk with the TyG index values. However, our restricted cubic spline (RCS) analysis revealed a nonlinear association. 30 This discrepancy can be explained in the context of critical care outcomes. First, dominant mechanisms may differ across follow-up endpoints (90/180/360 days), with early mortality driven more by acute inflammation and shock-related factors, whereas long-term outcomes are more susceptible to subsequent treatments, nutritional support, glucose/lipid management strategies, and changes in renal function. 31 Second, extended follow-up may introduce survivor-selection effects and time-dependent changes in the risk structure, leading to the early “screening out” of high-risk individuals from the study. This alters the risk structure of the remaining cohort, flattening the curve and potentially introducing a threshold.32–34 Third, TyG is often based on a single measurement early in ICU admission, making its explanatory power for short-term outcomes more direct. However, long-term risks are more susceptible to dilution by subsequent dynamic factors and do not exhibit a simple linear relationship. 35
Beyond TyG, this study also observed a significant association between GV and mortality risk; compared with the lower GV group, the higher GV group exhibited increased mortality risk at 90-day, 180-day, and 360-day follow-up. GV reflects the glycemic variability burden during ICU admission and has been shown to correlate with adverse outcomes across multiple critical care settings.36–38 Some studies suggest that its predictive value may surpass that of a single blood glucose measurement. 3 Pathologically, elevated GV may reflect impaired glucose homeostasis and unstable therapeutic response in critical illness. Glycemic fluctuations can promote inflammatory activation, oxidative stress, endothelial dysfunction, and immune dysregulation, which may contribute to organ injury and adverse outcomes.39–43
At the combined assessment level, TyG reflects stress-related metabolic dysregulation and metabolic vulnerability; however, in critically ill patients with sepsis, elevated TyG may also be influenced by acute inflammation-related lipid disturbances and stress hyperglycemia, and its calculation from a single early admission measurement cannot fully capture the glucose dynamics during ICU hospitalization. GV characterizes short-term fluctuation burden but cannot replace the identification of underlying metabolic abnormalities. Therefore, the combination of TyG and GV offers complementary insights, jointly characterizing patient metabolic vulnerability from two dimensions: baseline metabolic abnormalities and dynamic glucose instability. Our findings support this perspective by suggesting that the TyG–GV phenotype provides complementary metabolic information, although its incremental predictive gain remained limited. From a clinical management perspective, the association between the TyG–GV phenotype and mortality should be interpreted within the context of ICU nutritional delivery and glycemic control. In critically ill patients with sepsis, GV may be influenced by inflammatory stress, insulin resistance, enteral or parenteral nutrition, feeding interruptions, insulin titration, glucose control targets, and the intensity of glucose monitoring and interventions. Importantly, GV may partly reflect treatment intensity and clinician-driven glucose management practices rather than intrinsic metabolic instability alone. Recent integrated feeding–insulin strategies emphasize the importance of coordinating nutrient delivery with insulin administration to stabilize GV, 44 and established ICU nutrition guidelines provide a clinical framework for individualized nutritional assessment, route selection, and dynamic adjustment in critically ill patients. 45 Therefore, the TyG–GV phenotype may reflect the combined effects of acute metabolic stress, nutritional delivery, glycemic regulation, and ICU glucose-management practice, which provides clinical context for interpreting the higher mortality risk observed in patients with high TyG and GV. In the diabetes subgroup, the associations of some intermediate TyG–GV groups appeared to attenuate over a longer follow-up period. However, no significant interaction by diabetes status was observed. Given the exploratory nature of subgroup analyses, lack of formal adjustment for multiple comparisons, and limited number of events in some strata, these subgroup-specific patterns should be interpreted cautiously and require confirmation in future studies. The strengths of this study include the large sample size and relatively consistent data quality control of the MIMIC-IV database, covering outcomes at 90, 180, and 360 days, and validating the stability of key associations through subgroup analyses and external validation. However, this study has some limitations. First, GV was calculated from repeated glucose measurements during the ICU stay and may have been affected by the length of ICU stay, sampling density, and survival time. Early deaths may shorten the observation window and reduce the opportunities for glucose measurements, potentially introducing a time-dependent exposure or survivorship bias. We addressed this issue by reporting the ICU observation time and glucose measurement frequency, recalculating early GV within the first 48 h, and adjusting for glucose measurement frequency and GV calculation duration. However, residual sampling bias and reverse causality cannot be fully excluded because glucose measurements were obtained intermittently during routine care. Competing risk models were not applied because the outcomes were all-cause mortality at fixed follow-up horizons, for which death was the event of interest rather than a competing event. Second, some disease severity-related variables included in Model 3, such as serum creatinine, SOFA score, use of vasoactive agents, CRRT, and mechanical ventilation, may lie along the causal pathway between metabolic disturbances and mortality; therefore, adjusting for these variables may have weakened the overall association. To address this, we conducted a sensitivity analysis using a parsimonious model, and the results were generally consistent with those of the main analysis. Third, although hypoglycemia was evaluated using documented glucose measurements, the frequency, severity, and time below the range of hypoglycemia could not be reliably assessed because continuous glucose monitoring data were unavailable. Fourth, although early morning glucose measurements between 06:00 and 08:00 were used as an operational proxy for fasting glucose, the true fasting status could not be confirmed in this study. Nutritional interruption status was unavailable, and some patients may have received continuous enteral or parenteral nutrition or glucose-containing fluids, which may have introduced exposure misclassification in the TyG index calculation. Therefore, TyG should be interpreted as an early ICU metabolic stress marker based on operationally defined fasting glucose levels rather than as a strictly fasting insulin resistance surrogate. Fifth, residual confounding related to the ICU glucose management practices cannot be excluded. Although we adjusted for glucocorticoid use and hypoglycemia and performed sensitivity analyses, detailed data on insulin protocols, nutritional timing and caloric delivery, enteral or parenteral nutrition, glucose targets, glucose-containing fluids, and steroid dosing intensity were unavailable. These factors may influence GV and, to some extent, TyG; therefore, GV may partly reflect treatment intensity and clinician-driven glucose management rather than intrinsic metabolic instability alone. Prospective studies with detailed glucose management and nutritional data are needed to clarify this issue. Sixth, the TyG index was calculated using triglyceride and operationally defined fasting glucose values obtained early after ICU admission; therefore, it failed to reflect dynamic changes during hospitalization. In critically ill patients, both triglyceride and glucose levels may be affected by acute inflammation, stress hyperglycemia, nutritional status, and therapeutic intervention. Therefore, the TyG index should not be interpreted as a marker of chronic insulin resistance. Seventh, although subgroup analyses were prespecified based on clinical relevance, they were exploratory. No formal adjustment for multiple testing was performed, and some subgroups had relatively limited numbers of events; therefore, subgroup findings, particularly isolated within-subgroup significance, should be interpreted with caution. Eighth, the generalizability of our findings may be limited by the study’s design. Both MIMIC-IV and the MIMIC-III CareVue subset were derived from a single tertiary medical center and mainly reflected US-based ICU practice. Although the validation cohort was temporally independent, it was not geographically independent of the development cohort. In addition, differences in ICU practices, glucose management, nutritional strategies, and sepsis care between the MIMIC-III and MIMIC-IV eras may have influenced these associations. Finally, the retrospective cohort design inherently limited the causal inference. Future multicenter prospective studies should broaden the inclusion criteria, routinely collect fasting glucose, triglycerides, and continuous or high-frequency glucose data, incorporate time-series analyses or longitudinal mixed-effects models, and integrate additional clinical variables and biomarkers to confirm these findings. This approach will further validate the robustness of the combined indicators, refine the risk stratification systems, and assess their incremental value beyond the traditional scoring systems.
Conclusion
In critically ill patients with sepsis, the combined phenotype of an elevated TyG index and GV was associated with increased all-cause mortality and provided supplementary prognostic information. However, the incremental predictive gain was modest in this study. Prospective studies are needed to determine whether TyG–GV can add clinically meaningful value to dynamic risk assessment and bedside decision making.
Supplemental material
Supplemental material - Prognostic value of the triglyceride-glucose index combined with glycemic variability for all-cause mortality in patients with sepsis: A retrospective cohort study
Supplemental material for Prognostic value of the triglyceride-glucose index combined with glycemic variability for all-cause mortality in patients with sepsis: A retrospective cohort study by Ao Wang, Yuechen Fu, Ran Li, Yiwen Wang, Mengmeng Zhuang, Qing Xu, Luqi Qiao, Jiayi Cao, Kehui Li, Simiao Chen, Chao Meng, Qian Hong, Wendi Chen, Wensheng Wang, and Yong Sun in Science Progress.
Footnotes
Acknowledgements
We thank the DecisionLinnc researchers for their technical support and statistical consultation (from Hangzhou Sarutong Information Technology Co., Ltd., Hangzhou, China). We thank the participants of the Medical Information Mart for Intensive Care IV (MIMIC-IV) database and all the participating researchers. AI-assisted language editing tools were used only for language polishing. The authors reviewed and approved all edits and take full responsibility for the final content of the manuscript.
Ethical considerations
The MIMIC databases are de-identified, and this study was conducted in accordance with the Declaration of Helsinki of 1975, as revised in 2024. The sharing of the MIMIC research resource was approved by the Institutional Review Boards of the Massachusetts Institute of Technology and Beth Israel Deaconess Medical Center.
Consent to participate
Individual signed informed consent was waived because all patient details were de-identified before data access, and no information that could identify individual patients was used in this study.
Author contributions
SY and WA conceptualized and designed the study. WA and LK conducted the data extraction and preliminary analysis. LK, CJ, LY, and WY assisted with data cleaning, data verification, and statistical analysis. ZM, MC, and FYC participated in the creation of figures. QLQ, XQ, and WW prepared the initial draft of the manuscript. SY and WA were involved in significant revisions of the manuscript. SY supervised the study. All authors contributed to the editing, review, and approval of the final manuscript.
Funding
The authors disclosed receipt of the following financial support for the research, authorship, and/or publication of this article: This work was supported by the Medical Research Project of Jiangsu Provincial Health Commission (M2024032), the National Natural Science Foundation of China (82302798), and the Xuzhou Municipal Health Commission Medical Science and Technology Innovation Project (XWKYHT20250086).
Declaration of conflicting interests
The authors declared no potential conflicts of interest with respect to the research, authorship, and/or publication of this article.
Data Availability Statement
Data are available on PhysioNet (MIMIC-IV v3.1 and MIMIC-III v1.4) to credentialed users who complete the required training and sign the data use agreement.
Supplemental material
Supplemental material for this article is available online.
References
Supplementary Material
Please find the following supplemental material available below.
For Open Access articles published under a Creative Commons License, all supplemental material carries the same license as the article it is associated with.
For non-Open Access articles published, all supplemental material carries a non-exclusive license, and permission requests for re-use of supplemental material or any part of supplemental material shall be sent directly to the copyright owner as specified in the copyright notice associated with the article.