
Abstract
Purpose
There is a widely held perception that lower urinary tract symptoms may be exacerbated by cold weather. In this study, we examine the effect of seasonal variation in ambient temperatures on frequency–volume chart derivatives, symptom severity scores and uroflowmetry parameters in men with lower urinary tract symptom.
Methods
Between January 2000 and April 2004, men presenting with lower urinary tract symptom were prospectively recruited and assessed in Edinburgh, UK (55°52′N) with maritime temperate climates (Köppen classification Cfb). Local monthly temperatures were extracted from national meteorological records. Patients completed the International Prostate Symptom Score and 3-day frequency volume chart before undergoing free uroflowmetry with post-micturition volume measurement. Exclusion criteria were previous bladder outflow surgery and anti-cholinergic medication.
Results
Data on 296 patients were suitable for analysis. Mean age was 62.3 years (range, 26–90). Over the period of study, the coldest month was January (mean = 4.7℃) and the warmest month was August (mean = 15.8℃). There was no significant variation in either International Prostate Symptom Score symptom scores by season (p > 0.05) or any frequency–volume chart parameters, with the exception on an increase in median actual nightly voids over the summer months (p = 0.021). There was no significant correlation between maximal flow rate and post-micturition residual volumes and mean monthly temperatures (p > 0.05).
Conclusions
Seasonal variation in nocturia, but not other frequency–volume parameters, symptom severity or uroflowmetry parameters, is significant in men with lower urinary tract symptom. Future work should consider the impact of seasonal variation in lower urinary tract symptoms in both sexes across a wider range of climates.
Keywords
Introduction
There is a widely held perception that lower urinary tract symptoms (LUTS) vary in severity with seasonal changes in local ambient temperatures. 1 The postulated physiological basis for this variation is multi-factorial: There is an adaptive response to cold, causing peripheral vasoconstriction, stimulation of the “Henry-Gauer reflex” which inhibits anti-diuresis and stimulates naturesis. 2 In hot weather, there is a greater proportion of insensible fluid loss for evaporative cooling, which may reduce diuresis. Bladder cooling itself can elicit detrusor contractions via stimulation of cold receptors in animal models,3,4 which may contribute to frequency and urgency. Hence, seasonal and temperature variation may have an impact on the subjective reporting and assessment of LUTS, with subsequent effect on the outcomes of therapeutic intervention.
The aim of this study was to measure associations between seasonal variation in ambient temperature with common parameters used in the clinical assessment of men presenting with LUTS.
Materials and methods
From January 2000, clinical data were collected in Edinburgh at 55°52′N, equivalent to Moscow, with maritime temperate climates (Köppen classification Cfb). Local maximum, minimum and mean monthly environmental temperatures were extracted from national meteorological records obtained from the Met Office observing site at Gogarbank, Edinburgh, UK. Seasons were defined as follows: Spring (March to May); Summer (June to August); Autumn (September to November); and Winter (December to February).
Consecutive Caucasian men of Scottish, English and Irish ethnicity presenting with LUTS completed the International Prostate Symptom Score (IPSS) and a 3-day frequency–volume (FV) chart. The FV chart allowed calculation of 24-h urine volume (24HUV), daytime voids (frequency), maximal voided volume (FBC), actual nightly voids (ANV) and nocturnal urine volume (NUV) according to current definitions.5,6 There were no restrictions on the type and timing of food and fluid intake. Patients underwent free uroflowmetry with measurement of maximal flow rate (Qmax) and post-micturition volume. Men were included into the study if they had correctly completed a full 3-day FV chart, IPSS questionnaire and undertaken satisfactory uroflowmetry as per current guidelines. 7 Exclusion criteria were prior surgery for bladder outlet obstruction and/or the use of anti-cholinergic medication.
The one-sample Kolmogorov–Smirnov test was used to examine for normally distributed groups. Differences between groups were identified using the Kruskal–Wallis test. Correlations were identified using Spearman’s rank correlation coefficient (Spearman’s rho). All tests were undertaken using SPSS version 19.0 computer software (SPSS, Inc) and a p-value of <0.05 was taken to indicate nominal statistical significance without consideration of multiple comparisons.
Results
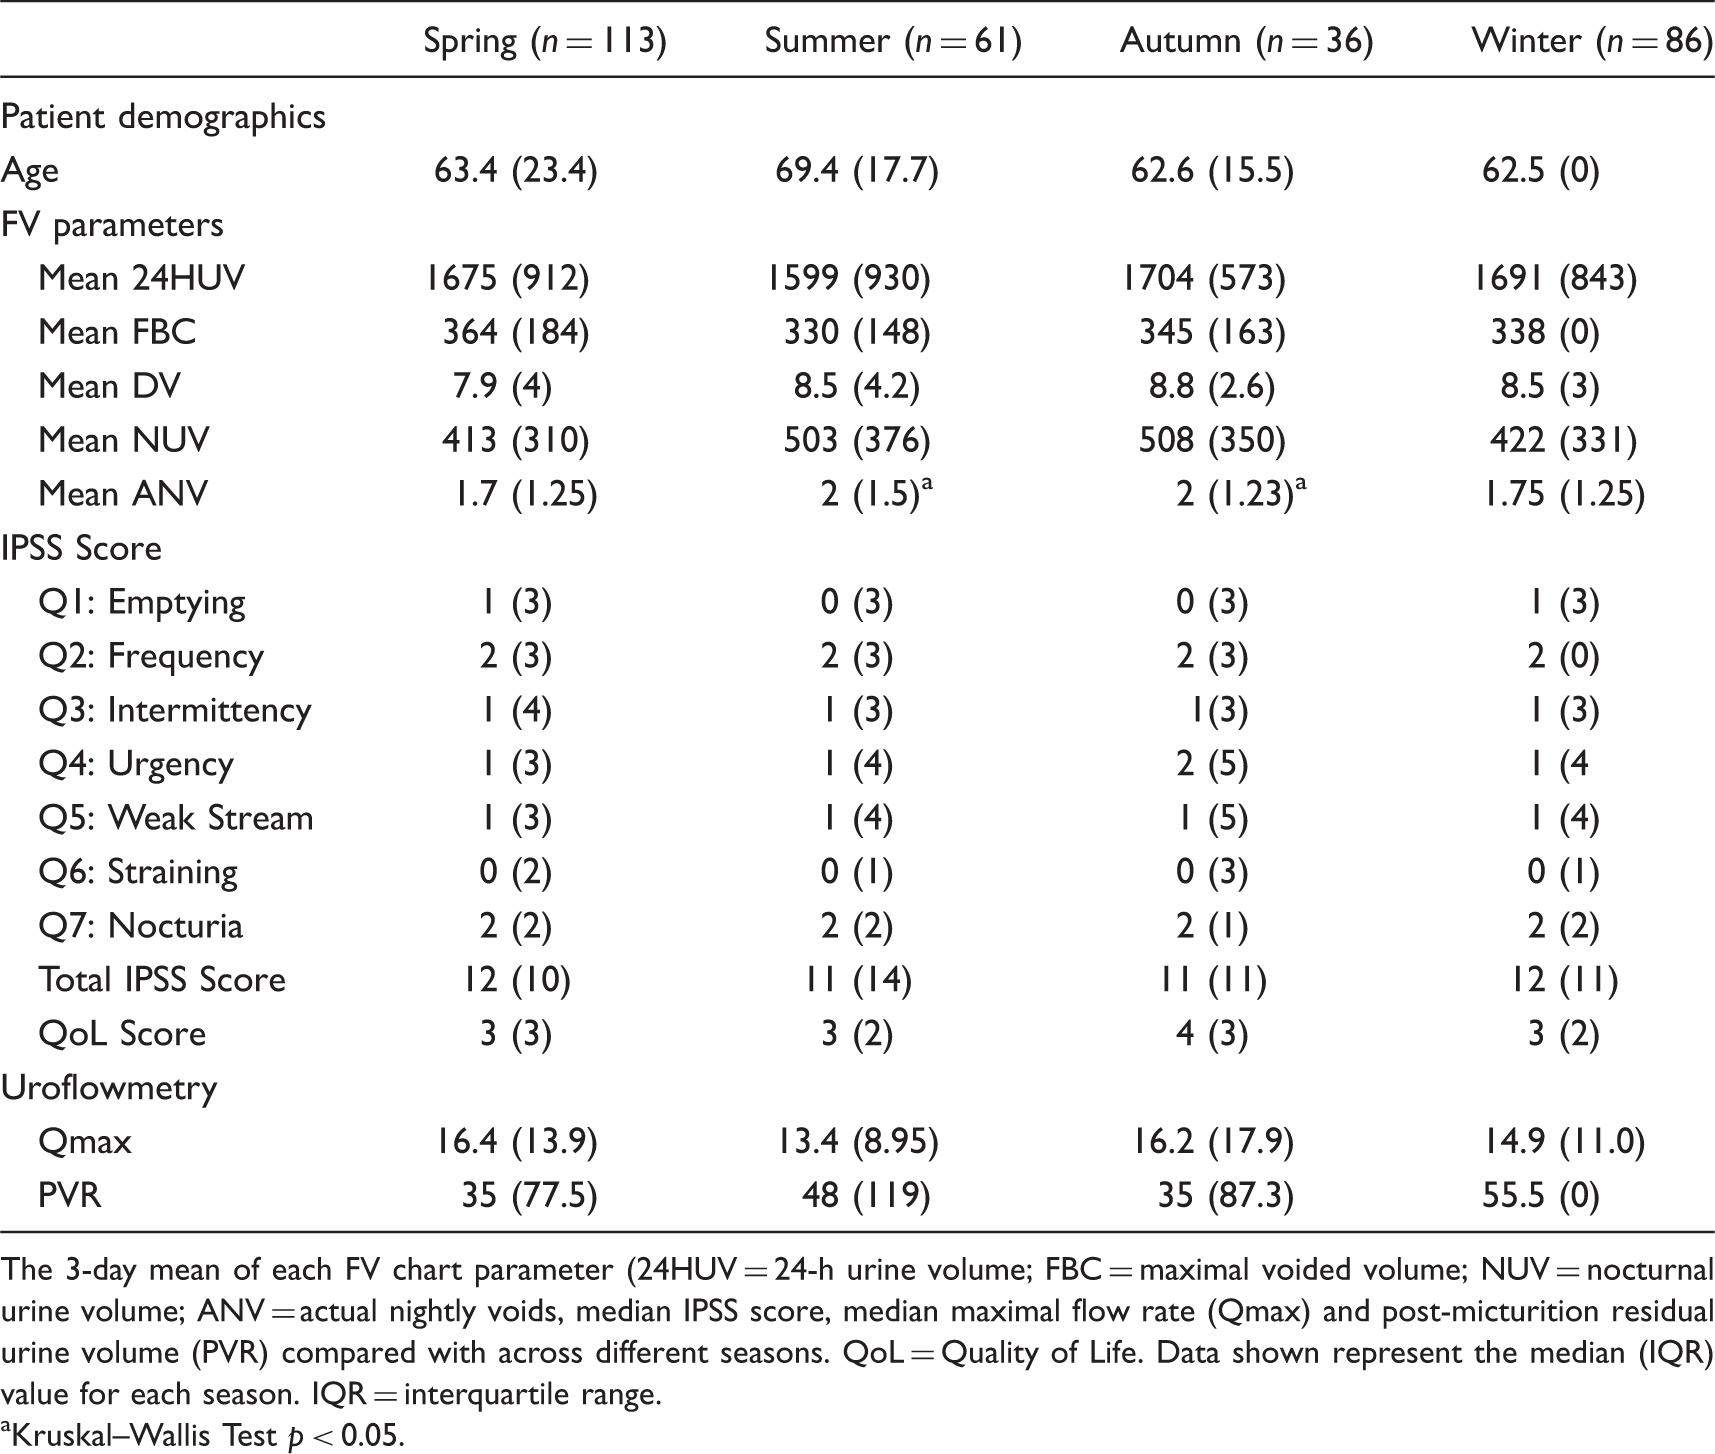
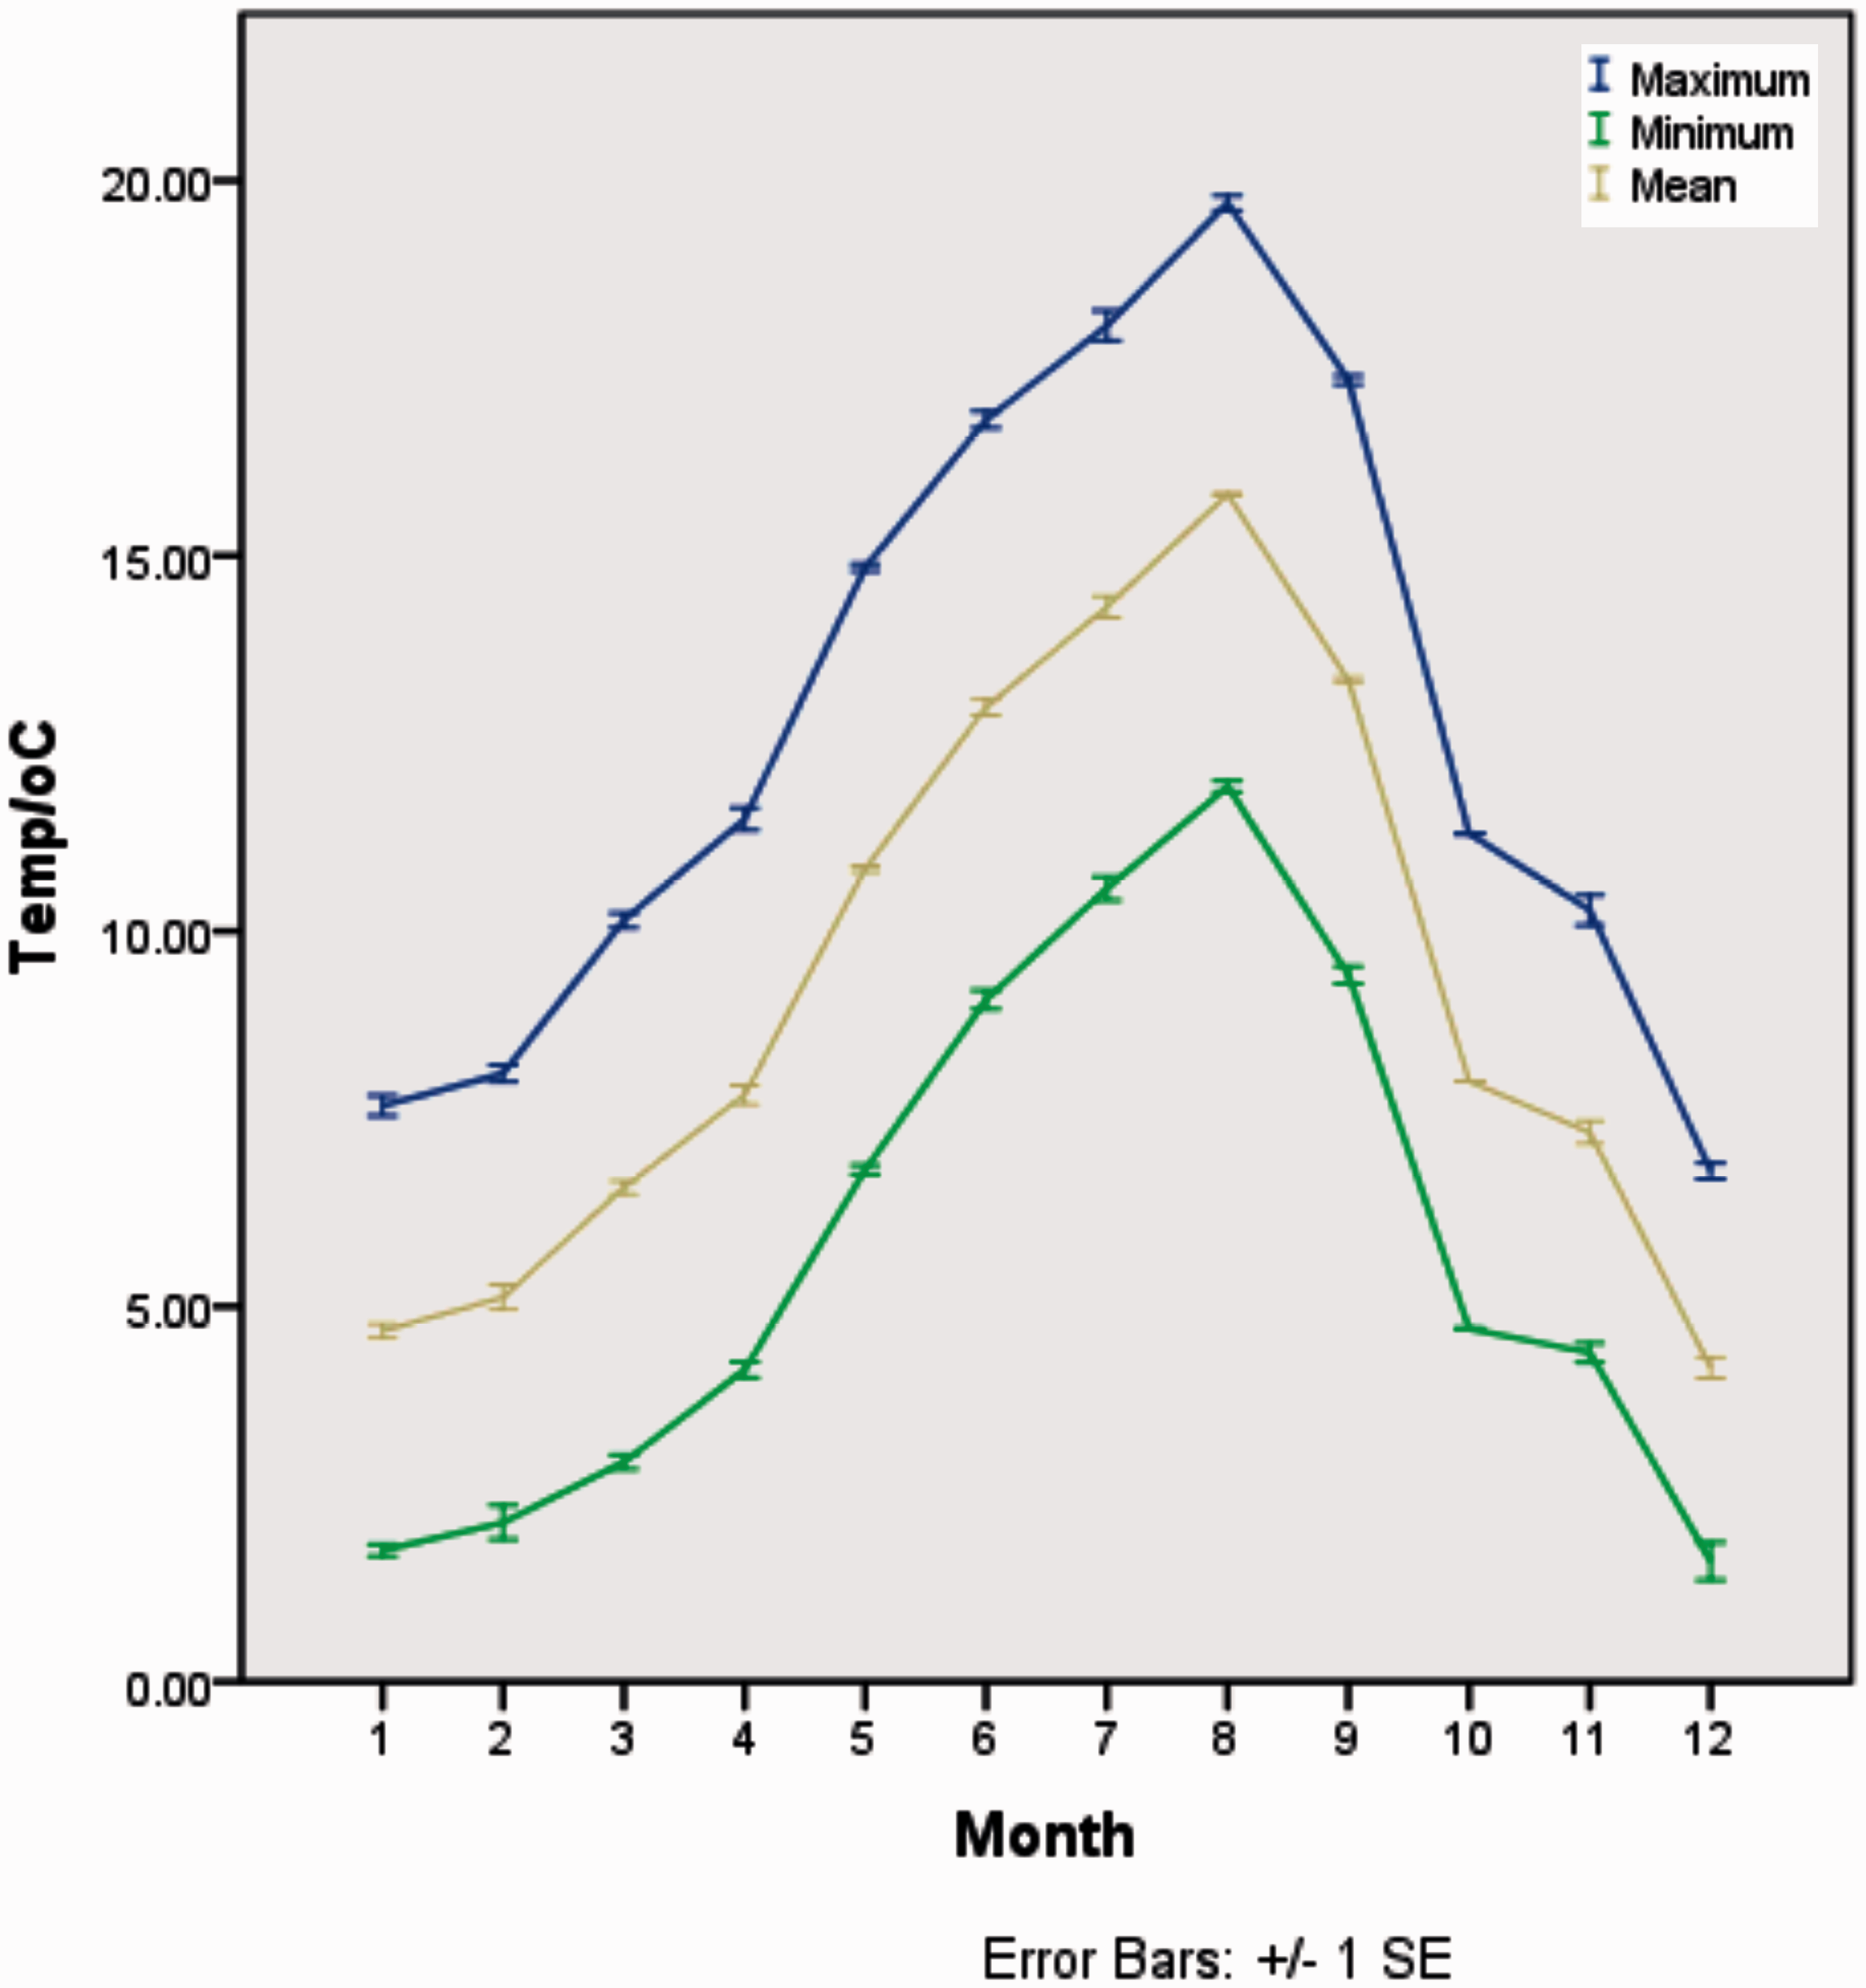
Three hundred and three men were recruited between January 2000 and April 2004, of which, full 3-day FV-chart, IPSS, and uroflowmetry data were available on 296 patients. Mean age was 62.3 years (range, 26–90). Over the period of study, the coldest month was January (mean = 4.7℃) and the warmest month was August (mean = 15.8℃) (Figure 1). Normality testing of IPSS, FV-chart and uroflowmetry variables with and without seasonal subclassification did not reveal normally-distributed groups (p > 0.05), and therefore non-parametric testing was employed for further analysis. There was no significant variation in IPSS symptom scores by season or mean monthly temperature (p > 0.05) or 3-day FV chart derivatives apart from a statistically significant increase in median ANV over the spring and summer months (p = 0.021) (Table 1 and Figure 2). There was no significant correlation between mean monthly temperatures or season and IPSS parameters, including the Quality of Life (QoL), Qmax, and post-micturition residual volumes (p > 0.05).
Month-by-month temperature variation. Recordings were made at the Met Office observing site at Gogarbank, Edinburgh, UK (55°52′N). Comparison of FV chart, IPSS, and uroflowmetry parameters by season. The 3-day mean of each FV chart parameter (24HUV = 24-h urine volume; FBC = maximal voided volume; NUV = nocturnal urine volume; ANV = actual nightly voids, median IPSS score, median maximal flow rate (Qmax) and post-micturition residual urine volume (PVR) compared with across different seasons. QoL = Quality of Life. Data shown represent the median (IQR) value for each season. IQR = interquartile range. Kruskal–Wallis Test p < 0.05. Month-by-month variation of mean of 3-day ANV. Distribution of ANV for each month of the year is graphically represented using a box and whisker plot, as these data are not normally distributed. The outliers indicated as circles relate to the identity of the patients and not the value of the individual mean ANV.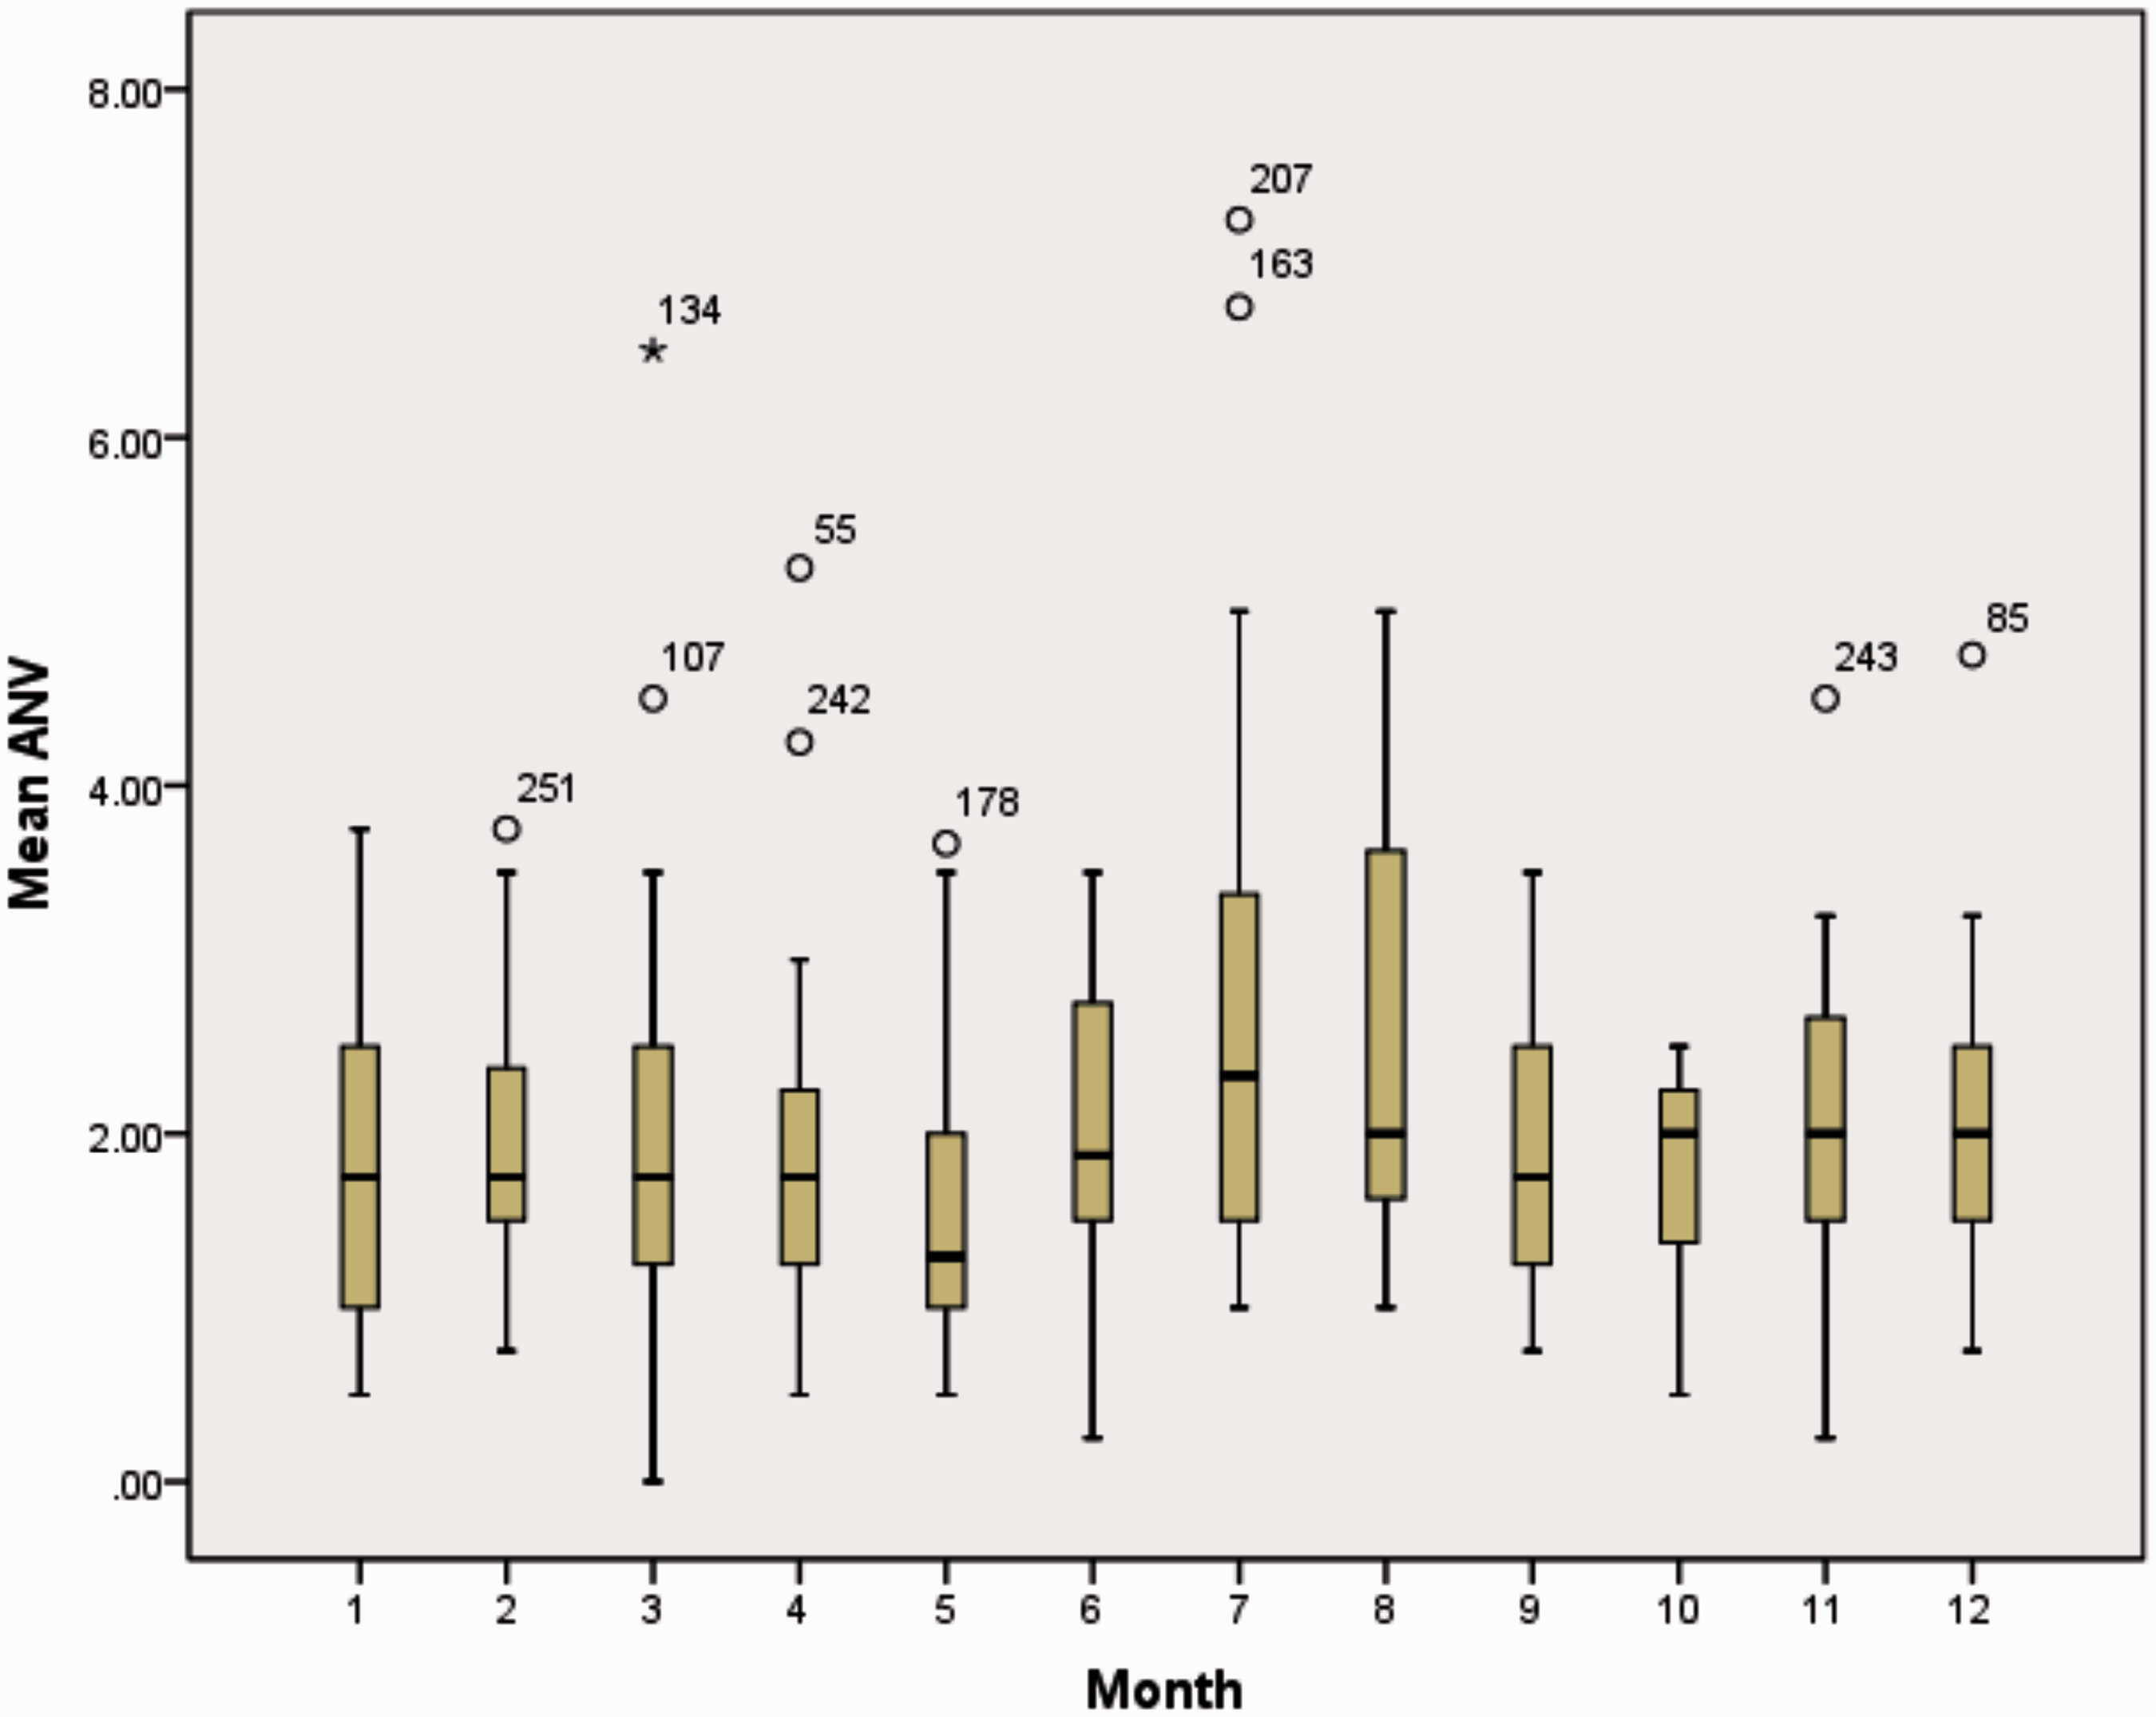
Discussion
At a population level, seasonal effects on the prevalence of storage LUTS in men and women have been observed in a large cohort of Japanese patients living in climates with different ambient temperatures. 8 This questionnaire-based study (incorporating IPSS) reported an independently associated increase in severity of frequency, urgency and nocturia in the winter as compared with summer. However, the authors found that patients living in an area with lower average ambient temperatures did not exhibit significant changes in symptom severity with season, which may be due to an adaptive mechanism.
A smaller longitudinal study explored changes in IPSS and uroflowmetry parameters associated with seasonal changes in ambient temperatures. 9 The authors found that only Qmax exhibited a significant seasonal change, being higher in both the cold season as compared with warmer seasons. However, in the present study, we did not observe any significant association of uroflowmetry parameters and IPSS scores with season or mean monthly temperature. We only identified a statistically significant increase in median ANV over the summer months, and no association between seasons and other FV derivatives.
This present study had several limitations. Our conclusions are drawn from a heterogeneous cohort of different patients assessed only once at different times of the year. Mean ambient outside temperatures were assessed rather than ambient temperatures within the home, and the proportion of time spent outside during completion of FV charts was not recorded. Additionally, we did not control for medical co-morbidities that contribute to urinary symptoms such as cardiovascular disease, 8 which may have been over-represented in patients assessed at certain times of the year. Repeated assessments on the same patient at different times of the year may have reduced heterogeneity, but could be confounded by disease progression.
Seasonal variation in symptoms may impact upon the assessment of therapeutic interventions for LUTS. A Japanese study of oxybutynin transdermal patches for overactive bladder symptoms reported different patterns of symptom improvement according to the seasons during which treatment was initiated. 10 A more rapid response was observed if a treatment was initiated in winter or spring months than those in the subgroup enrolled in summer months, but the overall treatment response was very similar after one year.
Conclusion
Despite an overall lack of association between LUTS, IPSS, and uroflowmetry parameters and seasonal/temperature variation identified in our study, further population-based epidemiological and observational studies, as well as interventional trials in patients with LUTS, recruited over long periods of time, should consider controlling for atmospheric temperature in order to further define the extent and impact of seasonal variation.
Footnotes
Acknowledgements
We are grateful to Alan Hawes (Ferring UK) for developing the computer database used for data collection. Ferring, UK was not involved in the study design, analysis and interpretation of data, in the writing of the manuscript and in the decision to submit the manuscript for publication. We thank Steve Jebson (UK Met Office) for kindly providing meteorological data.
Funding
This research was supported by Ferring, UK.
Declaration of conflicting interests
None declared.