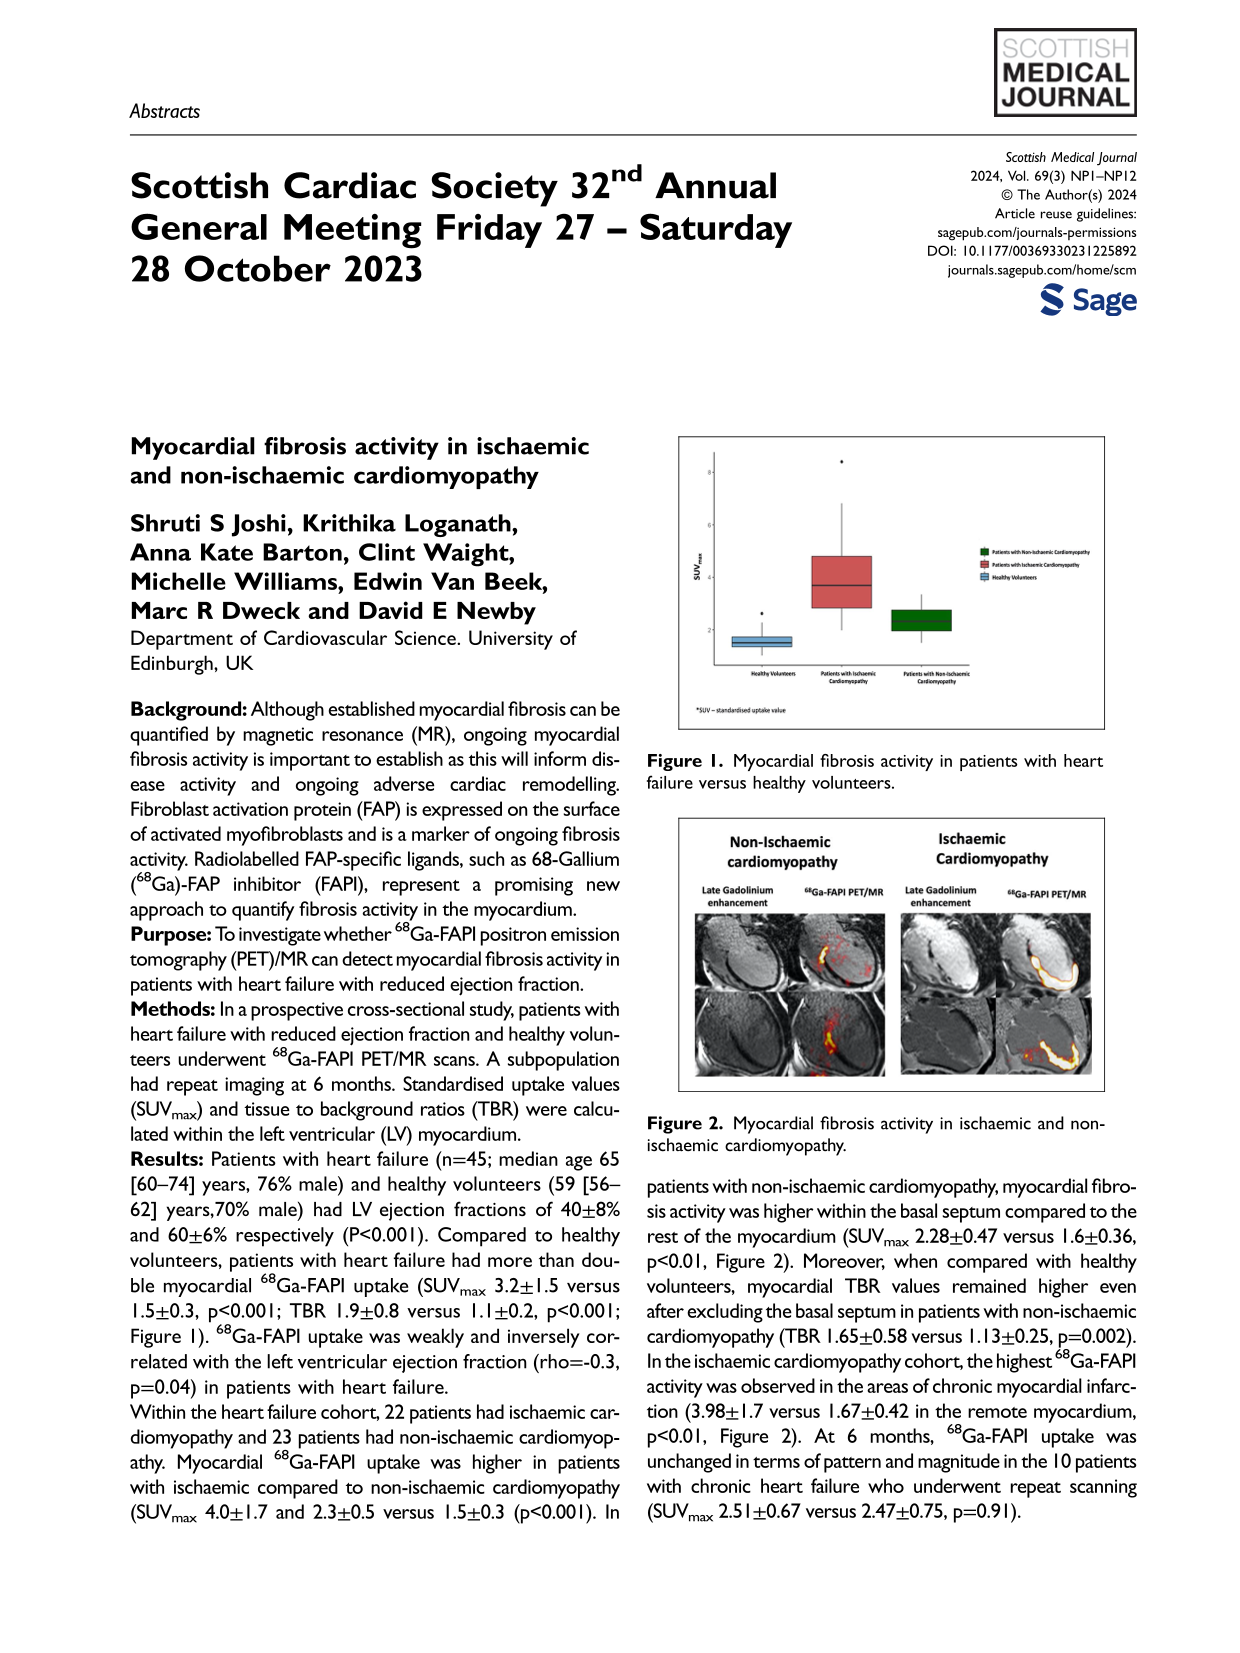
Myocardial fibrosis activity in ischaemic and non-ischaemic cardiomyopathy
Shruti S Joshi, Krithika Loganath,
Anna Kate Barton, Clint Waight,
Michelle Williams, Edwin Van Beek,
Marc R Dweck and David E Newby
Department of Cardiovascular Science. University of Edinburgh, UK
Background: Although established myocardial fibrosis can be quantified by magnetic resonance (MR), ongoing myocardial fibrosis activity is important to establish as this will inform disease activity and ongoing adverse cardiac remodelling. Fibroblast activation protein (FAP) is expressed on the surface of activated myofibroblasts and is a marker of ongoing fibrosis activity. Radiolabelled FAP-specific ligands, such as 68-Gallium (68Ga)-FAP inhibitor (FAPI), represent a promising new approach to quantify fibrosis activity in the myocardium.
Purpose: To investigate whether 68Ga-FAPI positron emission tomography (PET)/MR can detect myocardial fibrosis activity in patients with heart failure with reduced ejection fraction.
Methods: In a prospective cross-sectional study, patients with heart failure with reduced ejection fraction and healthy volunteers underwent 68Ga-FAPI PET/MR scans. A subpopulation had repeat imaging at 6 months. Standardised uptake values (SUVmax) and tissue to background ratios (TBR) were calculated within the left ventricular (LV) myocardium.
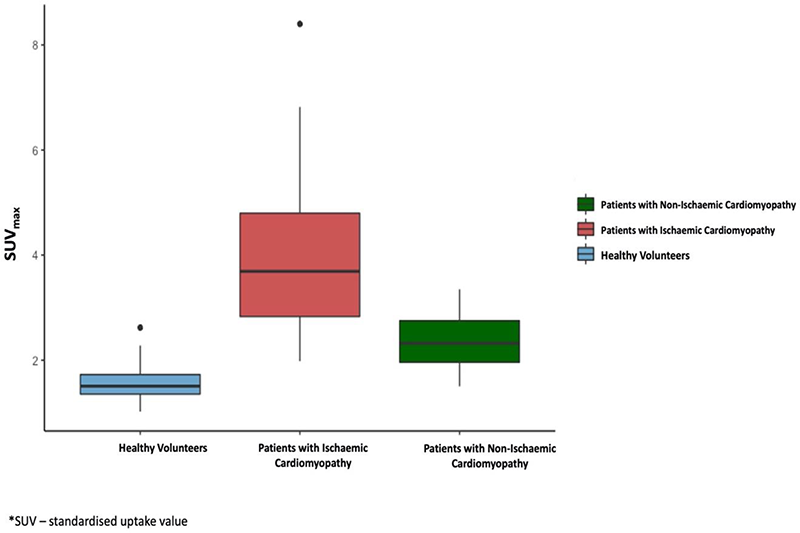
Results: Patients with heart failure (n=45; median age 65 [60–74] years, 76% male) and healthy volunteers (59 [56–62] years,70% male) had LV ejection fractions of 40±8% and 60±6% respectively (P<0.001). Compared to healthy volunteers, patients with heart failure had more than double myocardial 68Ga-FAPI uptake (SUVmax 3.2±1.5 versus 1.5±0.3, p<0.001; TBR 1.9±0.8 versus 1.1±0.2, p<0.001; Figure 1). 68Ga-FAPI uptake was weakly and inversely correlated with the left ventricular ejection fraction (rho=-0.3, p=0.04) in patients with heart failure.
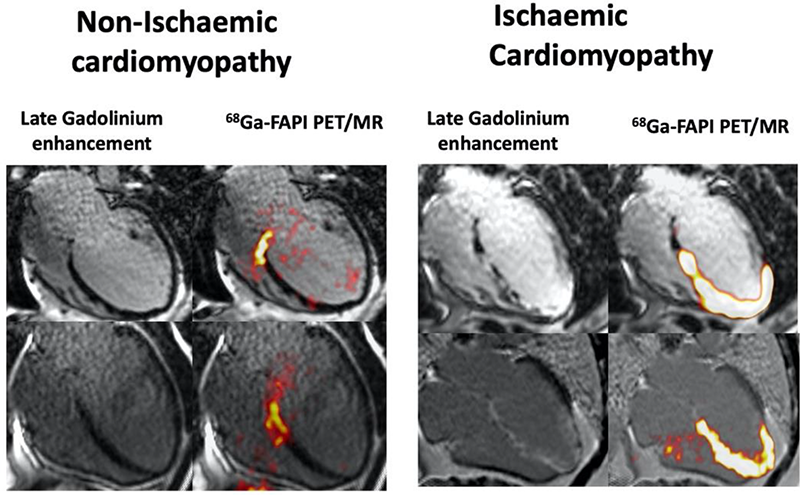
Within the heart failure cohort, 22 patients had ischaemic cardiomyopathy and 23 patients had non-ischaemic cardiomyopathy. Myocardial 68Ga-FAPI uptake was higher in patients with ischaemic compared to non-ischaemic cardiomyopathy (SUVmax 4.0±1.7 and 2.3±0.5 versus 1.5±0.3 (p<0.001). In patients with non-ischaemic cardiomyopathy, myocardial fibrosis activity was higher within the basal septum compared to the rest of the myocardium (SUVmax 2.28±0.47 versus 1.6±0.36, p<0.01, Figure 2). Moreover, when compared with healthy volunteers, myocardial TBR values remained higher even after excluding the basal septum in patients with non-ischaemic cardiomyopathy (TBR 1.65±0.58 versus 1.13±0.25, p=0.002). In the ischaemic cardiomyopathy cohort, the highest 68Ga-FAPI activity was observed in the areas of chronic myocardial infarction (3.98±1.7 versus 1.67±0.42 in the remote myocardium, p<0.01, Figure 2). At 6 months, 68Ga-FAPI uptake was unchanged in terms of pattern and magnitude in the 10 patients with chronic heart failure who underwent repeat scanning (SUVmax 2.51±0.67 versus 2.47±0.75, p=0.91).
Conclusion: Patients with heart failure have persistent increases in myocardial fibrosis activity with distinct and differential patterns demonstrable in patients with non-ischaemic and ischaemic cardiomyopathy. This may help characterise and prognosticate patients with heart failure and inform the future development of novel heart failure therapies.
Myocardial fibrosis activity in patients with heart failure versus healthy volunteers.
Myocardial fibrosis activity in ischaemic and non-ischaemic cardiomyopathy.
Time course of myocardial fibrosis activity following ST elevation myocardial infarction using 68Ga-FAPI PET/MR
A Barton1, E Tzolos1, C Waight2, K Loganath3, S Joshi1, T Singh4, MC Williams5, EJR van Beek5, D Brian6, Alison Fletcher7, T Clark7, P Slomka8, D Dey9, DE Newby10 and MR Dweck5
1Cardiology Registrar, NHS Lothian
2Principal Radiopharmacist, NHS Lothian
3Clinical Research Fellow, The University of Edinburgh
4Cardiology Registrar, Wessex Deanery
5Professor of Cardiovascular Imaging, The University of Edinburgh
6Superintendent Radiographer, Edinburgh Imaging Facility
7Medical Physicist, The University of Edinburgh
8Director of Innovation in Imaging and Professor of Medicine and Cardiology, Division of Artificial Intelligence in Medicine at Cedars-Sinai Medical Center
9Professor of Medicine and Biomedical Sciences, Cedars-Sinai Medical Center
10BHF Duke of Edinburgh Chair of Cardiology, The University of Edinburgh
Background: Myocardial fibrosis is a key healing response following myocardial infarction (MI). Although scar formation is considered complete by 12 weeks after MI, its exact time course is unknown. Fibroblast activation protein is a key factor in fibrogenesis that is expressed by activated fibroblasts in the myocardium following MI. Hybrid positron emission tomography and cardiovascular magnetic resonance (PET/MR) with radiolabelled fibroblast activation protein inhibitor (68Ga-FAPI) is an emerging method to measure in vivo fibrosis activity.
Purpose: To investigate the timing of myocardial fibrosis activity following ST-elevation MI using 68Ga-FAPI PET/MR.
Methods: Twenty patients underwent multi-timepoint hybrid 68Ga-FAPI PET/MR 1, 2, 4, and 12 weeks following acute ST-elevation MI. They were compared to patients with prior established ST-elevation MI (>12 months) and healthy control volunteers who underwent single-timepoint 68Ga-FAPI PET/MR to determine fibrosis activity in chronic infarcts and healthy myocardium respectively. All participants were imaged 30 min following administration of 100–200 MBq 68Ga-FAPI-46. Infarct zone 68Ga-FAPI uptake was quantified using tissue-to-background ratio (TBRmax) after correction for blood-pool activity in the left ventricle. Comparisons between timepoints for the acute MI group were assessed by ANOVA with repeated measures and post hoc Bonferroni correction, and between groups by two-tailed t-test.
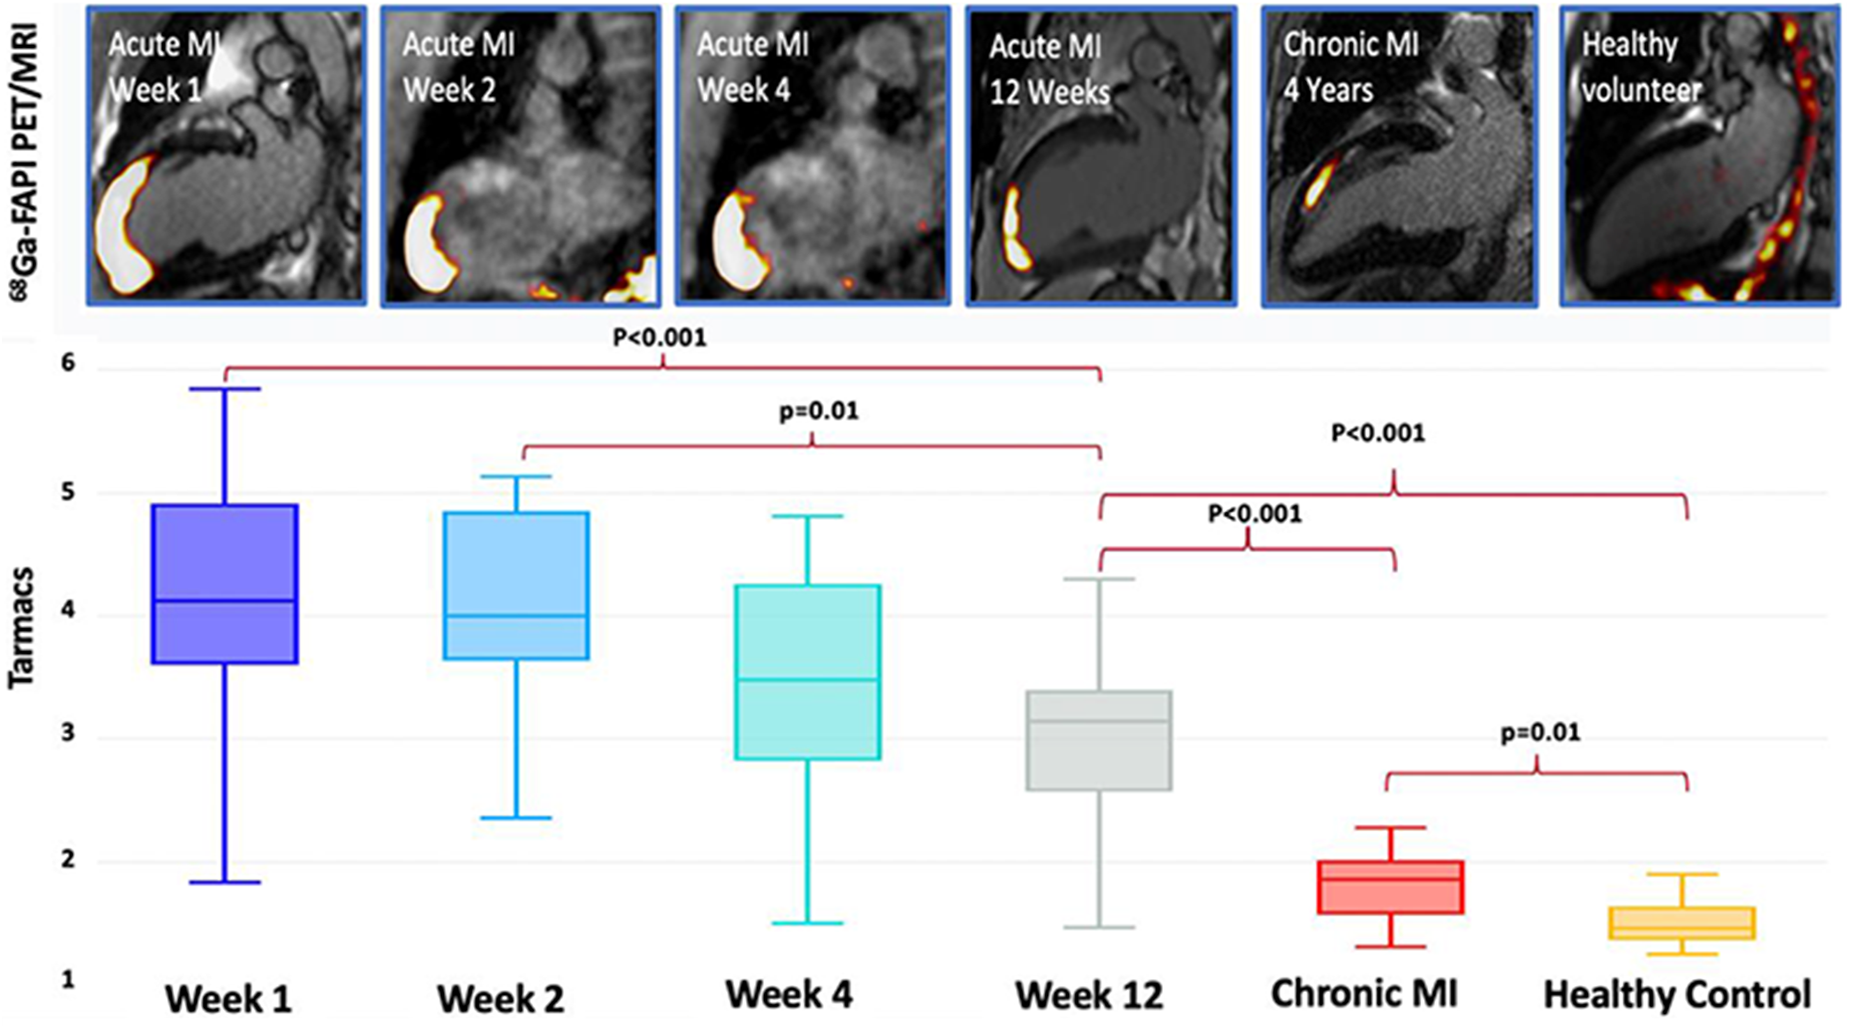
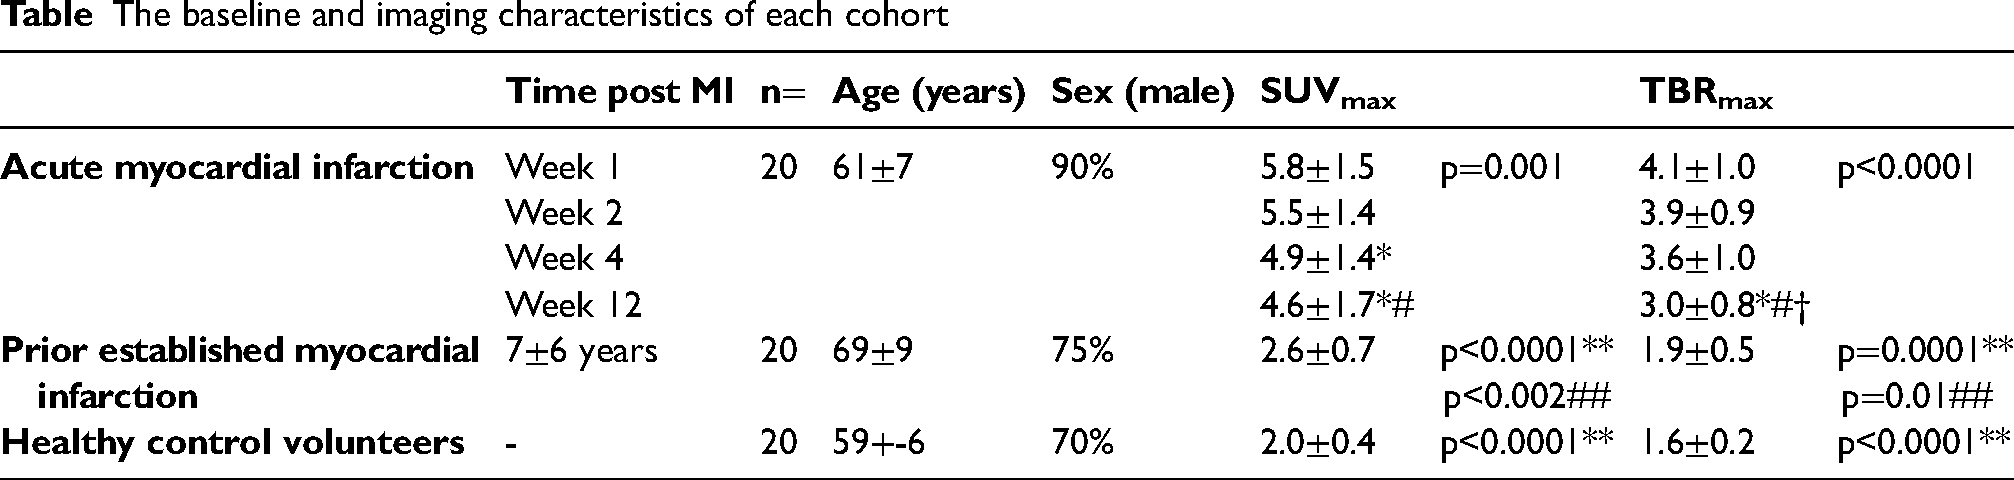
Results: Participants were predominantly middle-aged men (Table). Focal 68Ga-FAPI uptake localised to areas of infarction within the infarct and peri-infarct zones on magnetic resonance late gadolinium enhancement imaging (Figure). In acute MI, there was substantial uptake with consistently high TBRmax values at weeks 1, 2 and 4 (Table and Figure). Although TBRmax values started to decline by week 12, they remained persistently elevated compared to prior established MI and healthy myocardium (Table). Participants with prior established MI had modestly increased 68Ga-FAPI uptake compared with the healthy myocardium of control participants (Table and Figure).
Conclusions: Intense myocardial fibrosis activity is observed in the infarct and peri-infarct zones throughout the first month following ST-elevation MI. Although this starts to decline by 12 weeks, it remains markedly elevated even several years after myocardial infarction, indicating that intense fibrosis activity persists beyond 12 weeks, and that low-level chronic fibroblast activity is a feature of established MI which may contribute to scar maintenance.
The intensity of myocardial [68Ga]FAPI-46 uptake (TBRmax) was elevated in patients with acute myocardial infarction when compared to healthy volunteers and patients with chronic infarcts. [68Ga]FAPI-46 uptake peaked at weeks 1 and 2 following acute myocardial infarction, before starting to decline in at weeks 4 and 12. Myocardial [68Ga]FAPI-46 uptake in those with chronic myocardial infarction remained elevated compared to the healthy volunteers.
The baseline and imaging characteristics of each cohort
Time post MI
n=
Age(years)
Sex(male)
SUVmax
TBRmax
Acute myocardial infarction
Week 1
20
61±7
90%
5.8±1.5
p=0.001
4.1±1.0
p<0.0001
Week 2
5.5±1.4
3.9±0.9
Week 4
4.9±1.4*
3.6±1.0
Week 12
4.6±1.7*#
3.0±0.8*#†
Prior established myocardial
infarction
7±6 years
20
69±9
75%
2.6±0.7
p<0.0001**p<0.002##
1.9±0.5
p=0.0001**p=0.01##
Healthy control volunteers
-
20
59+-6
70%
2.0±0.4
p<0.0001**
1.6±0.2
p<0.0001**
DSE for low gradient AS: a useful test or outdated method?
Muhammad Shahzad1, Vera Lennie2,
Abdul Hai3 and Zulfiqar Sandhu4
1Cardiology Clinical Fellow Aberdeen Royal infirmary, Scotland
2Consultant Cardiologist Aberdeen Royal infirmary, Scotland
3Internal Medicine Trainee (IMT) Aberdeen Royal infirmary, Scotland
4Consultant Physician Wexford General Hospital, Ireland
Introduction: Low-dose dobutamine stress echocardiography (DSE) is a valuable tool to distinguish true-severe from pseudo-severe low gradient aortic valve stenosis in patients with reduced left ventricular ejection fraction.1,2 Aortic stenosis (AS) is a common and potentially life-threatening condition that requires accurate diagnosis and timely treatment. Low-gradient AS (LGAS) is a subtype of AS that can be particularly challenging to diagnose due to the presence of a low transvalvular pressure gradient. Low dose dobutamine stress echocardiography (DSE) has been recommended as a tool to define the severity of AS in patients with LGAS.3 However, the utility of DSE in this context has been the subject of debate. In this study, we aim to assess the value of DSE in distinguishing true-severe from pseudo-severe LGAS in patients with reduced left ventricular ejection fraction.
Purpose: The purpose of this study is to assess the value of low-dose dobutamine stress echocardiography (DSE) in distinguishing true-severe from pseudo-severe low gradient aortic valve stenosis in patients with reduced left ventricular ejection fraction. By evaluating the ability of DSE to accurately diagnose the severity of LGAS, we aim to provide evidence-based guidance for clinicians in their decision making for patients with this condition.
Methods: This study was a retrospective analysis of data collected from January 2020 to March 2023 for all patients undergoing DSE exam at our institution. We included only patients who had low dose DSE for assessment of severity of AS. Our echo department helped us filter the data using TOMCAT and Cardiology System Viewer. The primary outcome of interest was the ability of DSE to distinguish true-severe from pseudo-severe LGAS in patients with reduced left ventricular ejection fraction.
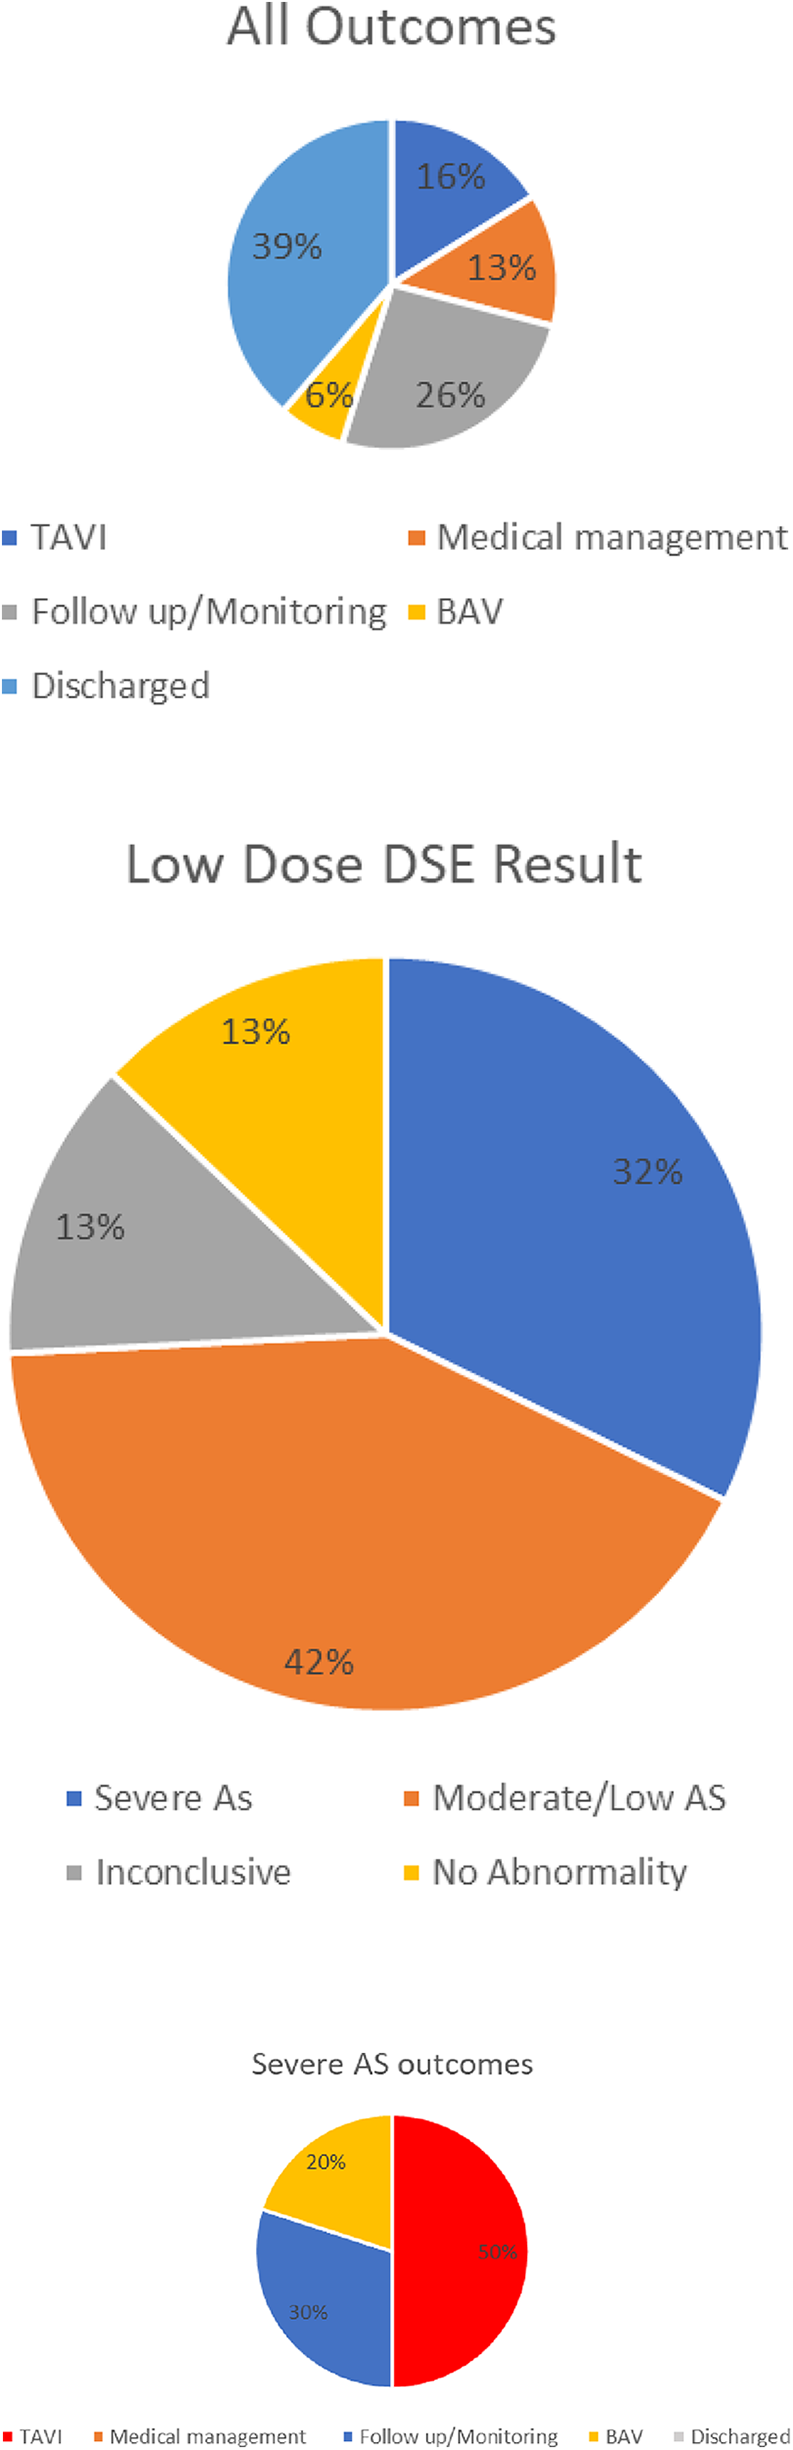
Results: A total of 924 DSE exams were performed during the study period, of which 31 were low-dose DSE for severe AS. The patient population consisted of 25 males and 6 females with an average age of 78 ± 5. The most common past medical history (PMH) included hypertension (HTN), diabetes mellitus (DM), atrial fibrillation (AF), chronic kidney disease (CKD), cerebrovascular accident (CVA), and heart failure (HF). Out of the total 31 patients, 10 out of 31 individuals were found to have severe AS on low-dose DSE. Of these, 50% underwent transcatheter aortic valve implantation (TAVI), 20% underwent balloon aortic valvuloplasty (BAV), and 30% were scheduled for follow-up or monitoring.
Discussion: Our study demonstrates that DSE remains a valuable tool for the staging of LGAS in patients with reduced EF. Our results are consistent with previous studies that have shown the utility of DSE in distinguishing true-severe from pseudo-severe AS. A significant percentage (32%) of our patients were staged as severe AS and 42% were classified as Moderate AS. These findings suggest that DSE can play an important role in guiding therapeutic decision making for patients with LGAS.
One limitation of our study is its retrospective design, which may introduce selection bias. Additionally, our sample size was relatively small, which may limit the generalisability of our findings.
In conclusion, our study provides further evidence supporting the use of DSE as a valuable tool for the staging of LGAS in patients with reduced EF.
References
1.Bountioukos M, Kertai MD, Schinkel AF, Vourvouri EC, Rizzello V, Krenning BJ, Bax JJ, Roelandt JR, Poldermans D. Safety of dobutamine stress echocardiography in patients with aortic stenosis. J Heart Valve Dis. 2003 Jul;12(4):441-6. PMID: 12918844. Value of low-dose dobutamine stress echocardiography on defining true … (n.d.). Retrieved from https://www.ncbi.nlm.nih.gov/pmc/articles/PMC6245091/
2.Liu D, Hu K, Liebner E, Weidemann F, Herrmann S, Ertl G, Frantz S, Nordbeck P. Value of low-dose dobutamine stress echocardiography on defining true severe low gradient aortic stenosis in patients with preserved left ventricular ejection fraction. Int J Cardiovasc Imaging. 2018 Dec;34(12):1877–1887. doi: 10.1007/s10554-018-1416-z. Epub 2018 Jul 23. PMID: 30039338; PMCID: PMC6245091.
3.Liu D, Hu K, Liebner E, Weidemann F, Herrmann S, Ertl G, Frantz S, Nordbeck P. Value of low-dose dobutamine stress echocardiography on defining true severe low gradient aortic stenosis in patients with preserved left ventricular ejection fraction. Int J Cardiovasc Imaging. 2018 Dec;34(12):1877-1887. doi: 10.1007/s10554-018-1416-z. Epub 2018 Jul 23. PMID: 30039338; PMCID: PMC6245091.
T2 values should be used with caution to distinguish between acute and chronic myocardial infarction
1Centre for Cardiovascular Science, Chancellors Building, 49 Little France Crescent, University of Edinburgh, Edinburgh EH16 4SA, UK
2FY1 in NHSGGC
3Department of Cardiology, Southampton General Hospital, University Hospital Southampton NHS Foundation Trust, Tremona Road, Southampton, Hampshire, SO16 6YD
4Cardiology Interventional Fellow in Wessex and Clinical Research Fellow in Edinburgh
5Cardiology Registrar and Clinical Research Fellow in Edinburgh
6The Royal Infirmary of Edinburgh, 51 Little France Crescent, Edinburgh, EH16 4SB, UK
7Consultant Cardiologist and Electrophysiologist in Southampton
8Professor of Clinical Cardiology and Consultant Cardiologist in NHS Lothian
9Clinical Research Fellow and Honorary Cardiology Registrar in Edinburgh
Introduction: T2 mapping has been proposed as a reliable cardiovascular magnetic resonance technique to differentiate between acute and chronic myocardial infarction (MI) due to its sensitivity for myocardial oedema. However, the time point at which myocardial oedema resolves following MI remains uncertain. Furthermore, a clear threshold of T2 value has not been proposed to distinguish between acute and chronic MI.
Aims: to assess if T2 values remain elevated in chronic MI and explored a cut-off T2 value to distinguish between acute and chronic MI.
Methods: we performed T2 mapping analysis within the infarct and remote myocardial regions in 60 patients with acute (<1 month) and 30 patients with chronic (>6 months, range 1–20 years). We also measured T2 values in the healthy myocardium of 40 healthy volunteers. T2 values were then compared between acute and chronic MI, and healthy volunteers, as well as between infarct areas and remote myocardium in both categories of MI. Statistical analyses were performed using SPSS.
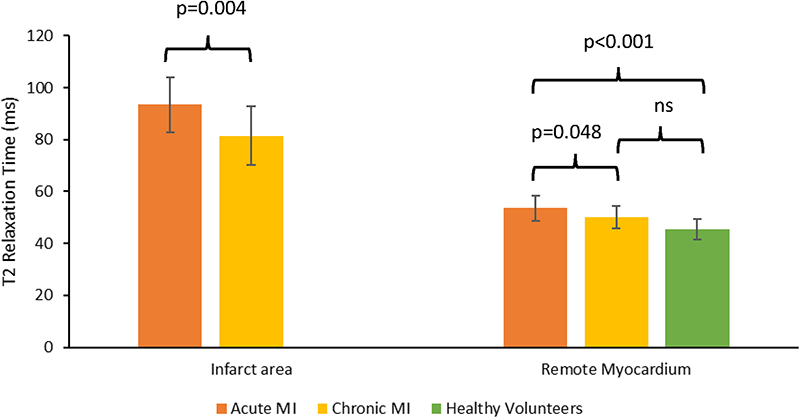
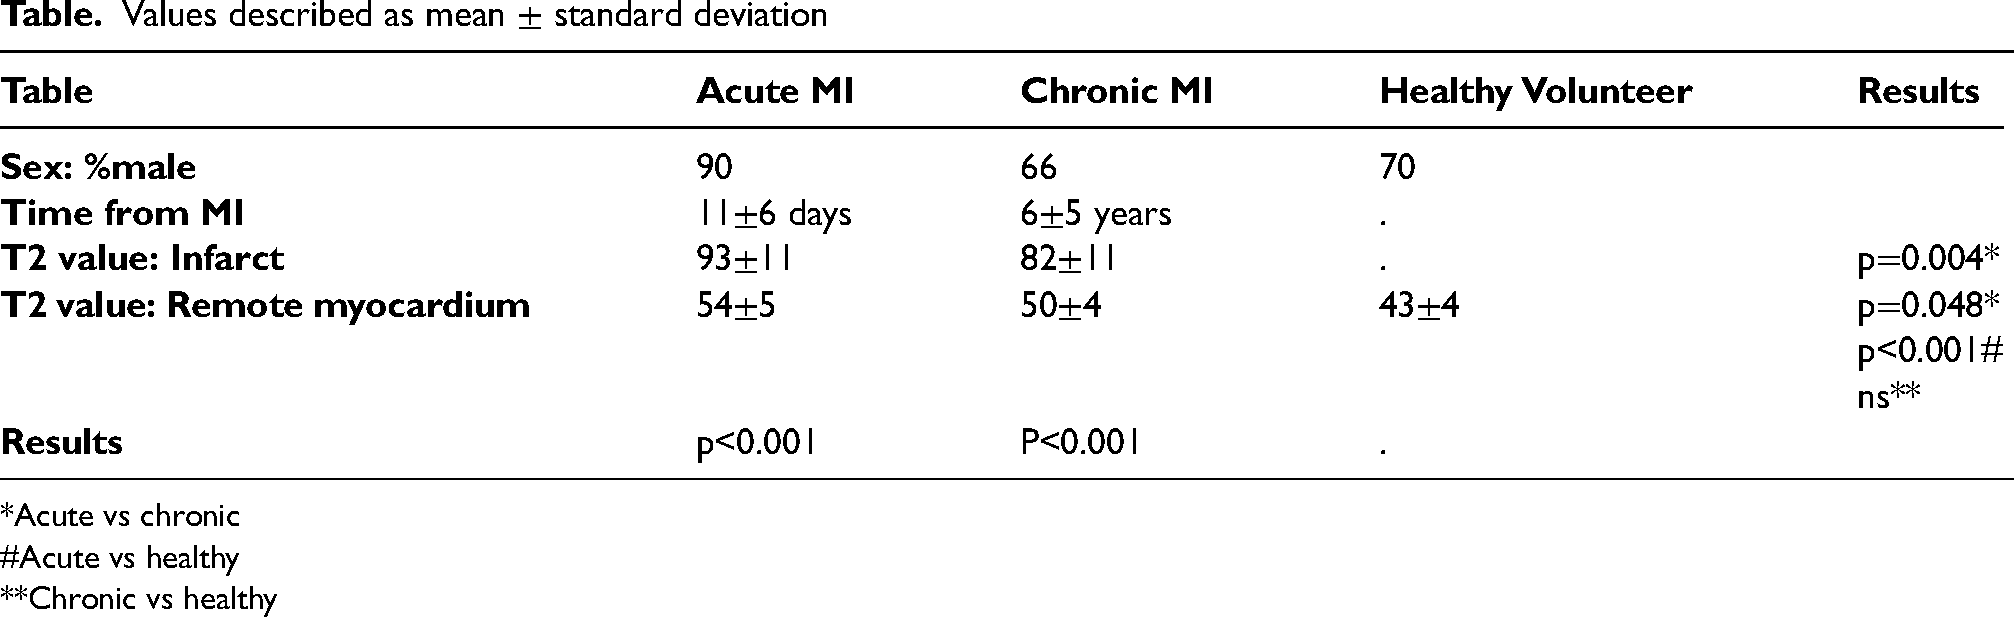
Results: T2 values in the infarct area of acute MI were higher than for chronic MI, in line with existing literature (Table, Figure). However, we found that T2 values in infarct areas of chronic MI remain significantly higher compared to that of the remote myocardium as well as the myocardium of healthy volunteers, with some overlap with values seen in cases of acute MI (Table). Remote myocardial T2 values in acute MI were higher than those in chronic MI and healthy volunteers but again significant overlap in values existed (Table, Figure).
Conclusion: Elevated T2 values are not exclusively observed in an acute setting but persist beyond 6 months. Indeed, T2 values within myocardial infarcts do not normalise even decades after the event. Elevated T2 values should be interpreted with caution and should not be assumed to indicate an acute MI.
Values described as mean ± standard deviation
Table
Acute MI
Chronic MI
Healthy Volunteer
Results
Sex: %male
90
66
70
Time from MI
11±6 days
6±5 years
.
T2 value: Infarct
93±11
82±11
.
p=0.004*
T2 value: Remote myocardium
54±5
50±4
43±4
p=0.048*p<0.001#
ns**
Results
p<0.001
P<0.001
.
*Acute vs chronic
#Acute vs healthy
**Chronic vs healthy
Dapagliflozin, inflammation and cardiac remodelling in patients with Stage B heart failure
Adel Dihoum1, Alexander Brown1,
Chim Lang2 and Ify Mordi3
1Clinical Research Fellow, Division of Molecular and Clinical Medicine, School of Medicine, Ninewells Hospital, University of Dundee
2Head, Division of Molecular andClinical Medicine, School of Medicine, University of Dundee
3Clinical Senior Lecturer/Honorary Consultant, Division of Molecular and Clinical Medicine, School of Medicine, Ninewells Hospital, University of Dundee
Background: Heart failure (HF) remains a significant cause of mortality and morbidity in patients with type 2 diabetes. Often diabetes is associated with cardiac abnormalities such as left ventricular hypertrophy (LVH) that are a precursor to development of symptomatic heart failure – this is known as Stage B HF (once symptoms develop this is classified as Stage C HF). SGLT2 inhibitors have been shown to prevent development of symptomatic HF in individuals with type 2 diabetes, however their mechanism of action remains unclear. We and others have shown that SGLT2 inhibitors cause beneficial remodelling of the left ventricle. In the DAPA-LVH trial we showed that dapagliflozin caused a significant reduction in LV mass compared to placebo in individuals with type 2 diabetes and stage B HF.(1) One postulated mechanism of benefit for SGLT2 inhibitors from animal studies is an anti-inflammatory effect.(2) Systemic inflammation is highly prevalent and is implicated in the pathophysiology of HF.(3)
The aim of this study was to investigate whether the improvements in cardiac remodelling caused by dapagliflozin in individuals with type 2 diabetes and stage B HF are mediated by anti-inflammatory action.
Methods: We measured inflammatory markers (CRP, TNF-α, IL-1β, IL-6, and IL-10) in plasma samples of 60 patients with type 2 diabetes and LVH but without symptomatic HF from the DAPA-LVH trial. Individuals in this trial had been randomised to 12 months of treatment with dapagliflozin 10 mg daily or placebo and underwent cardiac MRI at baseline and end of treatment.
The primary analysis was the change in inflammatory markers after 12 months of treatment with dapagliflozin vs. placebo. To determine the relationship between changes in inflammation and LV remodelling caused by dapagliflozin we assessed the correlation between change in LV mass at 12 months and changes in inflammatory markers, and we also assessed whether the effect of dapagliflozin on LV mass was modulated by baseline levels of inflammation.
Results: The mean age of the cohort was 65 ± 7 years. There were 36 male participants (60%). 29 patients had been randomised to dapagliflozin and 31 to placebo. The median CRP in mg/L in dapagliflozin and placebo groups was 0.87 (0.36, 3.14) and 1.19 (0.52, 2.88) respectively with p value = 0.49. There were no significant differences in any of the other inflammatory markers between the two groups.
Following 12 months of treatment dapagliflozin significantly reduced CRP compared to placebo (change in CRP: dapagliflozin group 1.07 ± 0.61 mg/L vs. placebo group 3.04 ± 0.59 mg/L; p=0.026), leading to an absolute mean difference of −1.96 (95% confidence interval (CI): −3.68 to −0.24). There were no statistically significant statistical changes in other inflammatory cytokines.
There was no significant relationship between changes in CRP at 12 months and changes in LV mass at 12 months (r= 0.124). The effect of dapagliflozin on LV mass was not different regardless of baseline levels of inflammation, with dapagliflozin reducing LV mass to a similar degree in patients with CRP above or below the median (interaction p value 0.58).
Conclusion: In individuals with Type 2 diabetes and Stage B HF, dapagliflozin significantly reduced CRP compared to placebo, however there were no significant changes in other related inflammatory cytokines. The reduction in LV mass caused by dapagliflozin was similar regardless of baseline levels of inflammation and there was no significant correlation between changes in inflammatory markers and changes in LV mass. In summary, the beneficial effects of dapagliflozin on left ventricular remodelling do not appear to be related to any potential anti-inflammatory activity.
References
1.Brown AJM, Gandy S, McCrimmon R, Houston JG, Struthers AD, Lang CC. A randomized controlled trial of dapagliflozin on left ventricular hypertrophy in people with type two diabetes: the DAPA-LVH trial. European heart journal. 2020;41(36):3421-32.
2.Lopaschuk GD, Verma S. Mechanisms of Cardiovascular Benefits of Sodium Glucose Co-Transporter 2 (SGLT2) Inhibitors: A State-of-the-Art Review. JACC Basic Transl Sci. 2020;5(6):632–44.
3.Van Linthout S, Tschope C. Inflammation - Cause or Consequence of Heart Failure or Both? Curr Heart Fail Rep. 2017;14(4):251–65.
Fibrocalcific volume in aortic valve stenosis using contrast-enhanced computed tomography
Shruti S Joshi, Maria Lembo, Jolien Geers, Rong Bing, Lorenzo Carnevale,
Tania A Pawade, Mhairi K Doris,
Evangelos Tzolos, Kajetan Grodecki, Sebastien Cadet, Anna K Barton,
Neil Craig, Trisha Singh, Piotr J Slomka, Audrey White, Andrea Guala,
Jose F Rodriguez-Palomares,
Aroa Ruiz-Muñoz, Lydia Dux-Santoy, Gisela Teixido-Tura, Laura Galian-Gay, David E Newby, Marie-Annick Clavel, Damini Dey and Marc R Dweck
Department of Cardiovascular Science. University of Edinburgh, United Kingdom
Introduction: Aortic stenosis is the commonest form of valvular heart disease in the western world and is characterised by progressive leaflet fibrosis and calcification. Conventional imaging techniques are unable to measure these two disease processes. In this study, we evaluated the fibrocalcific burden by computed tomography (CT) angiography in patients with aortic stenosis. We assessed its reproducibility, association with disease severity, and ability to predict and track stenosis progression.
Methods: In a post-hoc analysis of 136 patients with AS participating in SALTIRE2 trial, fibrocalcific volume was calculated using a Gaussian-mixture-model on CT-angiograms at baseline and after 1 year (Figure 1). The distributions of CT-attenuation were used to generate thresholds for aortic valve tissue types enabling the quantification of calcific, non-calcific and fibrocalcific volumes indexed to annulus area. Scan-rescan reproducibility was assessed.
Results: Fibrocalcific volume measurements were rapid (5.8±1.0 min/scan) and demonstrated excellent scan-rescan reproducibility (mean difference −1%, limits of agreement −4.5% to 2.8%). Baseline fibrocalcific volumes correlated well with baseline mean gradient on echocardiography in both men and women (rho=0.64 and 0.69, respectively; p<0.001 for both). The correlation was principally determined by calcific volume in men and fibrotic volume in women. After one year, fibrocalcific volume increased by 17% and correlated with haemodynamic disease progression (change in mean gradient rho=0.32, p=0.003). Baseline fibrocalcific volume was the strongest predictor of disease progression on multivariable analysis, with a particularly-strong association in women (rho=0.75, p<0.001).
Conclusion: Aortic valve fibrocalcific volume is a novel, highly-reproducible CT-derived measure of aortic valve stenosis. It is associated with disease severity and allows the prediction and tracking of aortic stenosis progression in both men and women.
Assessment of fibrocalcific volume from computed tomography (CT) angiogram (right panel) and Gaussian mixture model output (left panel). HU = Hounsfield units.
Self-taught ultrasound-guided axillary vein access for pacemaker implantations - complication rates and outcomes
QG Kong1, DTY Ang2, O Peck3, T Tun4, S Hood5, E Peat5 and YC Lau5
1FY1 Royal Alexandra Hospital
2Cardiology SpR Glasgow Royal Infirmary
3Cardiology SpR Royal Alexandra Hospital
4Cardiology SpR Royal Alexandra Hospital
5Consultant Cardiologist Royal Alexandra Hospital
Background: Cardiac implantable electronic devices (CIEDs) are the mainstream therapy for advanced atrioventricular block or sustained ventricular arrhythmia. EHRA survey (1) showed that cephalic vein dissection and blind subclavian vein puncture are the preferred techniques for the implantation of CIED leads in European centres. Ultrasound (US) guided axillary puncture has emerged as feasible alternative for safe and rapid venous access for lead implantation. However, insufficient evidence to support its widespread adoption.
Aim: To compare the complication rates and clinical outcomes of CIED implantations utilising self-taught US guided axillary puncture versus non-US guided venous access (Subclavian puncture and fluoroscopy guided axillary puncture). Assess the mean time to gain venous access and overall success rate in US guided technique.
Methods: Retrospective, observational study across two sites involving all CIED implantations of four experienced implanters over the year from January 2021 - June 2022. Patient's demographics, venous access time, complications and clinical outcomes were extracted from electronic database. US axillary access technique was self-taught.
Results and Outcomes: Venous access was obtained by US Guided axillary puncture in 146 patients, non-US guided in 208 patients. Successful axillary venous access by ultrasound guidance is 97%(146/151) with mean time to venous access of 2.1 min. Baseline demographics (age, gender) and comorbidities (hypertension, diabetes, cardiomyopathy, coronary artery disease, dyslipidemia, renal failure, oral steroid use, nicotine use) were similar between both US-guide and non-US guided groups, usage of oral anticoagulations (32.9% vs 39.4%, p=0.208) and antiplatelet agents(28.1% vs 35.1%,p=0.164) were not statistically different. Greater proportion of dual chamber pacemakers were implanted in US guided access group versus non-US guided (39.7% vs 27.9%,p=0.015). US Guided axillary access resulted in lower overall complication rate (2.1% vs 8.9%, p=0.0196): lower risk of pneumothorax (0% vs 3.8%,p=0.0236), lower risk of haematoma (0% vs 3.4%, p=0.0448). No difference in short term pocket/lead infection or lead displacement. Severe vascular complications remains low in both groups. Stepwise binary regression analysis demonstrated US guidance as independent predictor of lower overall complication rate, odd-ratio 0.195 (95% CI 0.054–0.706).
Summary: This multi-centered, retrospective observational study demonstrated that US guided axillary access has high overall success rate, not time consuming and resulted in lower complication rates (especially pneumothorax and pocket haematoma), despite the US access technique being self-taught and have greater proportion of dual chamber device implantations. US guided axillary access is demonstrated to be independently associated with 5-fold lower risk of complications in this series.
Clinical and therapeutic determinants of mortality after takotsubo syndrome: the primary report of the Scottish Takotsubo Registry
Amelia E Rudd1, Graham Horgan2, Hilal Khan1, David T Gamble1, Jim McGowan3, Arvind Sood4, Ross McGeoch4, John Irving5, Jonathan Watt6, Stephen J Leslie6, Mark Petrie7, Chim Lang5, Nicholas L Mills8,9, David E Newby9 and Dana K Dawson1
1Aberdeen Cardiovascular and Diabetes Centre, University of Aberdeen and NHS Grampian, Aberdeen, United Kingdom
2Biomathematics & Statistics Scotland, Aberdeen, United Kingdom
3University Hospital Ayr, NHS Ayrshire and Arran, Ayr, United Kingdom
4Hairmyres Hospital, NHS Lanarkshire, East Kilbride, United Kingdom
5University of Dundee and Ninewells Hospital, NHS Tayside, Dundee, United Kingdom
6Raigmore Hospital, NHS Highland, Inverness, United Kingdom
7Institute of Cardiovascular and Medical Sciences, University of Glasgow, Glasgow, United Kingdom
8Usher Institute, University of Edinburgh, Edinburgh, United Kingdom
9Centre for Cardiovascular Science and Usher Institute, University of Edinburgh and NHS Lothian, Edinburgh, United Kingdom
Background: Takotsubo cardiomyopathy is a cardiac emergency that mimics acute myocardial infarction. We investigated the comparative determinants of long-term mortality.
Methods: In a nationwide longitudinal cohort study, all patients with takotsubo cardiomyopathy were identified in Scotland between 2010–2017. Age and sex-matched contemporaneous control populations were patients with acute myocardial infarction (1:1) and individuals from the general population (1:4). Electronic health record data linkage identified causes of death and prescribed medication. Outcomes were analysed with Cox proportional hazard regression models.
Results: Mean age of each study population was 66 years and 91% were women. During a median follow-up of 5.5 years, 25% (153/620) of patients with takotsubo cardiomyopathy died which exceeded mortality rates in the general population (15%, 374/2480; hazard ratio [HR] 1.78 [95% confidence interval 1.48–2.15], p<0.0001) especially for cardiovascular (HR 2.47, [1.81–3.39], p<0.001) but also for non-cardiovascular (HR 1.48 [1.16–1.87], p=0.002) deaths. Mortality rates were lower than in patients with myocardial infarction (31%, 195/620; HR 0.76 [0.62–0.94], p=0.012), which was attributable to lower rates of cardiovascular (HR 0.61 [0.44–0.84], p=0.002) but not non-cardiovascular (HR 0.92 [0.69–1.23], p=0.59) death. Mortality rates were similar to patients with myocardial infarction for takotsubo cardiomyopathy patients presenting with ST-segment elevation on the electrocardiogram (HR 1.11 [0.79–1.57], p=0.54) but lower for takotsubo cardiomyopathy patients presenting without ST-segment elevation (HR 0.58 [0.44–0.77], p<0.001). Prescriptions of cardiovascular or non-cardiovascular medications were comparable across patient populations. In patients with takotsubo cardiomyopathy, cardiovascular therapies were not consistently associated with survival whereas diuretic (p=0.01), anti-inflammatory (p=0.002) and psychotropic (p<0.001) therapies were all associated with worse outcomes.
Conclusions: Cardiovascular and non-cardiovascular mortality after takotsubo cardiomyopathy is substantial. Mortality is particularly increased in those presenting with ST-segment elevation and is not associated with the use of cardiovascular therapies. Effective therapeutic interventions are urgently needed to improve outcomes, representing a major unmet clinical need.
Adherence to optimal medical therapy in patients with advanced heart failure awaiting routine heart transplantation in Scotland
Simon Hobson1, Iain Squire2, Shirley Sze2, Pankaj Gupta2 and Roy Gardner3
1Scottish National Advanced Heart Failure Service, Golden Jubilee National Hospital, Clydebank, Glasgow
2NIHR Cardiovascular Research Centre, Glenfield Hospital, Leicester
3Scottish National Advanced Heart Failure Service, Golden Jubilee National Hospital, Clydebank, Glasgow
Aims: Clinical trials clearly demonstrate the clinical benefit of optimal medical therapy (OMT) in patients with chronic heart failure. This typically comprises the core four: an ACE inhibitor (ACEi) or Angiotensin Receptor Neprilysin Inhibitor (ARNI), beta blocker (BB), Mineralocorticoid receptor antagonist (MRA), and now SGLT2 inhibitors1. ‘Advanced heart failure’ refers to patients who suffer ongoing symptoms and signs of heart failure despite OMT. Such patients may subsequently be considered for advanced therapies including cardiac resynchronisation therapy, cardiac transplantation, and mechanical circulatory support.
Given the clear benefits of OMT in chronic heart failure, greater adherence has been shown to be associated with lower mortality and less frequent HF hospitalisations2. Rates of non-adherence to heart failure therapy varies greatly (5–60%) amongst studies depending on the method of measuring adherence3. As part of a pilot audit, we aimed to assess adherence to OMT amongst patients with advanced heart failure on the routine heart transplant waiting list in Scotland.
Methods and Results: At a single centre, the Golden Jubilee National Hospital in Clydebank, we obtained urine samples from all patients on the routine heart transplant waiting list in Scotland. Between September 2020 and March 2021, patients were approached and consented in the outpatient setting. Samples were collected on the same day. As such, patients had no prior warning therefore eliminating any potential Hawthorne effect.
Using liquid chromatography-tandem mass spectrometry, we assessed each patient’s urine for the presence of prescribed heart failure medications and their metabolites. Direct measurement of metabolites in urine samples represents an objective measure of adherence. Quantitative assessment was not performed.
Of the 15 patient samples taken, 93% (14/15) were adherent with their ACE/ARNI, BB and MRA therapy. Patient 15 was found to be non-adherent to both their ACEi and MRA. Adherence to diuretic therapy was lower at 67% (8/12), although this may be, in part, due to patient anxiety with regards urinary urgency or frequency whilst travelling to clinic and potentially limited access to toilet facilities. 80% (12/15) patients had an implantable cardiac defibrillator with 13% (2/15) having a long term left ventricular assist device (LVAD).
Conclusions: Analysis of the samples in our cohort revealed much higher rates of adherence compared to other studies. This is reassuring amongst a population awaiting cardiac transplantation, where poor adherence to immunosuppressive therapy post transplantation could have disastrous consequences.
We aim to extend this study to include all six UK heart transplant centres to describe patient outcome in those who are poorly adherent to their therapy, both before and after cardiac transplantation.
References
1.Theresa A McDonagh, Marco Metra, Marianna Adamo, Roy S Gardner, et al. ESC Scientific Document Group, 2021 ESC Guidelines for the diagnosis and treatment of acute and chronic heart failure: Developed by the Task Force for the diagnosis and treatment of acute and chronic heart failure of the European Society of Cardiology (ESC) With the special contribution of the Heart Failure Association (HFA) of the ESC, Eur Heart J 2021;42:3599–3726.
2.Granger BB, Swedberg K, Ekman I, Granger CB, Olofsson B, McMurray JJ, Yusuf S, Michelson EL, Pfeffer MA; CHARM investigators. Adherence to candesartan and placebo and outcomes in chronic heart failure in the CHARM programme: double-blind, randomised, controlled clinical trial. Lancet 2005;366:2005–2011.
3.Oosterom-Calo R, van Ballegooijen AJ, Terwee CB, Te Velde SJ, Brouwer IA, Jaarsma T, Brug J. Determinants of adherence to heart failure medication: a systematic literature review. Heart Fail Rev 2013;18:409–427.
Cardiac CARE study: how the 2022 ESC cardio-oncology guidelines affects this population
Krithika Loganath1,2, Peter Hall3,4,
Shruti S Joshi1,5, Trisha Singh1,6, Aryelly Rodriguez1,7, Nick L Mills1,8, Olga Oikonomidou1,9, Ninian N Lang1,10, Marc Dweck1,11 and Peter A Henriksen1,12
1University of Edinburgh, United Kingdom
2Clinical Research Fellow, University of Edinburgh
3Western General Hospital, Edinburgh
4Oncology Consultant, Western General Hospital, Edinburgh
5Cardiology Registrar, Royal Infirmary of Edinburgh
6Cardiology Registrar, University Hospital Southampton NHS Trust
7Statistician, Edinburgh Clinical Trials Unit, University of Edinburgh
8British Heart Foundation Chair of Cardiology, University of Edinburgh
9Oncology Consultant, Western General Hospital, Edinburgh
10Cardiology Consultant and Reader in Cardiology, University of Glasgow
11Professor of Cardiovascular Science, University of Edinburgh
12Cardiology Consultant, Royal Infirmary of Edinburgh
Introduction: The 2022 ESC Cardio-Oncology Guidelines added cardiac biomarkers to the definition of cancer therapy-related cardiac dysfunction (CTRCD) . We investigated; i) How implementation of the new definitions affected CTRCD classification of patients in the Cardiac CARE Trial, ii) The predictive value of high sensitivity troponin I (hs-cTnI) monitoring for development of cardiac dysfunction six months after anthracycline chemotherapy.
Methods: The Cardiac CARE Trial recruited 175 patients who underwent anthracycline therapy for breast cancer or non-Hodgkin's lymphoma. Patients with high risk on treatment hs-cTnI concentrations were randomised to cardioprotection with candesartan and carvedilol or standard care. All patients had regular hs-cTnI quantification during anthracycline therapy. Cardiac magnetic resonance scan quantification of left ventricular ejection fraction (LVEF) and global longitudinal strain (GLS) was conducted at baseline and 6 months following completion of chemotherapy. GLS data was available for 143 of these patients.
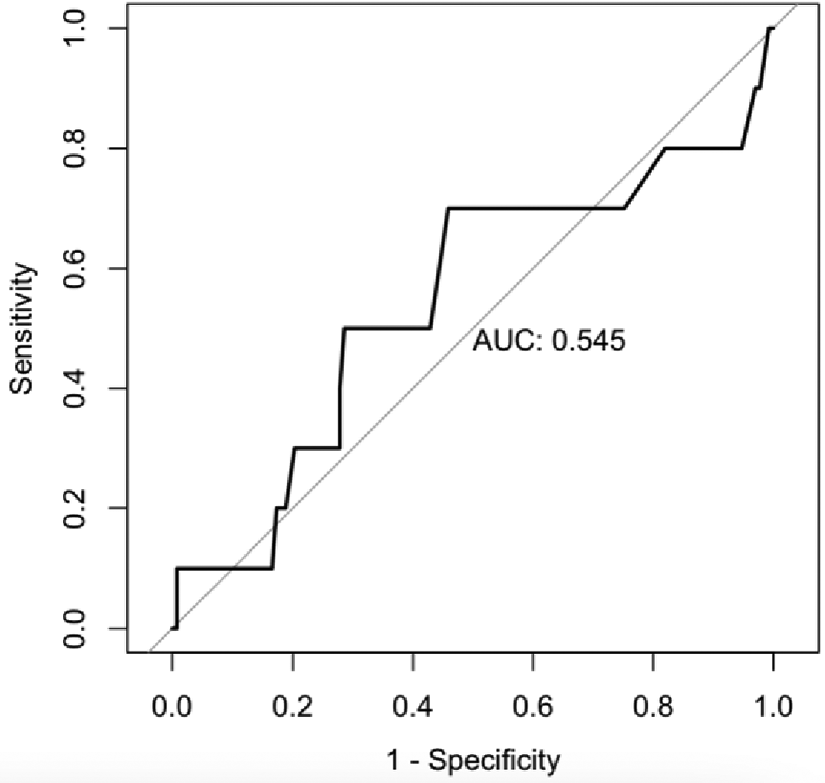
We assessed the impact of the new 2022 ESC CTRCD definition on this population. The association between hs-cTnI and the development of cardiac dysfunction on imaging (defined as a reduction in LVEF to <50% or a reduction in GLS by >15%) was investigated using logistic regression with data corrected for age, gender and anthracycline dose. Correlation analysis and two-sample t tests were performed to assess the relationship between composite changes in Hs-cTnI and the development of cardiac dysfunction on imaging. Receiver operator curves (ROC) were drawn and area under the curve (AUC) analysis was performed to assess the predictive value of Hs-cTnI for development of left ventricular dysfunction on imaging.
Results: 11(6.3%) patients were diagnosed with mild asymptomatic CTRCD on the basis of cardiac imaging. Applying the 2022 ESC biomarker CTRCD definition, a further 57 (32.6%) patients were re-classified to mild asymptomatic CTRCD. Patients crossing the threshold for mild asymptomatic CTRCD on cardiac imaging had similar hs-cTnI concentrations to those who were reclassified with mild asymptomatic CTRCD on the basis of the 2022 ESC biomarker CTRCD definition, (20 [IQR 8,33] vs 14 [IQR 6,28], p = 0.6). Overall, there was a weak correlation between the change in Hs-cTnI and LVEF change (Figure 1).
Using logistic regression models, a rise in on-treatment hs-cTnI to above the 99th centile, compared to baseline, was not associated with the development of cardiac dysfunction in the univariable model or after correction for age, sex and cumulative anthracycline dose (Univariable: 1.33 (95% CI 0.37- 4.83) Adjusted: 1.61 (95% CI 0.40–6.43)).
Furthermore, ROC analysis showed that a composite change in Hs-cTnI performed poorly at predicting subsequent cardiac dysfunction with an area under the curve of 0.545 (Figure 2).
Conclusion: The addition of hs-cTnI quantification reclassified 57 of the 175 (32.6%) patients who were previously normal, to having mild asymptomatic CTRCD, mostly due to the inclusion of Hs-cTnI. In a contemporary population of anthracycline-treated breast cancer and non-Hodgkin's lymphoma patients, composite change in hs-cTnI was not a robust predictor of the development of anthracycline-induced cardiac dysfunction.
Correlation analysis looking at change in Hs-cTnI and change in LVEF.
ROC curve and AUC assessing the performance of composite change in Hs-cTnI in predicting cardiac dysfunction.
Is cardiac involvement under-investigated in patients with pulmonary sarcoidosis? A single-centre audit
Simran Piya1, Alistair James2, Colin Stewart3, Ross Campbell4 and David Anderson5
1Foundation Year Doctor, NHS Greater Glasgow and Clyde
2Internal Medicine Trainee, NHS Greater Glasgow and Clyde
3Registrar in Respiratory Medicine, NHS Greater Glasgow and Clyde
4Consultant in Cardiology, University of Glasgow
5Consultant in Respiratory Medicine, NHS Greater Glasgow and Clyde
Background: Sarcoidosis is a rare, systemic and granulomatous disease which may present heterogeneously. Whilst pulmonary sarcoidosis remains the most diagnosed phenotype, post-mortem studies estimate that cardiac sarcoidosis co-exists in up to 28% of these patients1. Cardiac involvement was originally reported in approximately 5% of the total sarcoidosis population2,3 but recent studies using cardiac MRI (CMR) scanning have suggested a higher prevalence of approximately 26%4. As such, we hypothesised that patients presenting with pulmonary sarcoidosis and cardiac specific symptoms were being under-investigated for cardiac involvement.
Methods: This was a single-centre retrospective study based in the South Sector of Glasgow (population 220,216) involving patients who were reviewed in a respiratory sarcoidosis clinic during October 2022-January 2023. An internal database was used to identify 74 patients with a confirmed diagnosis of pulmonary sarcoidosis. Data including patient demographics, cardiac specific symptoms (palpitations/syncope/chest pain/peripheral oedema), and investigations performed (ECG, Echo, 24-h Holter tape, CMR, CT-PET) were collected.
Results: Patients had a mean age of 57 years, were evenly distributed in sex (49% female), and were predominantly Caucasian. Of these, four patients (5%) had confirmed cardiac sarcoidosis. 25 patients (34%) reported cardiac specific symptoms, of which only three (12%) received a full cohort of investigations (ECG, 24-h Holter monitoring, echocardiogram and CMR) as suggested by European Society of Cardiology5. Three patients (12%) with known cardiac specific symptoms did not undergo any cardiac tests at all.
Of the entire cohort, 11 patients (14.8%) presented with evidence of conduction disease. Of which, only five underwent a cardiac MRI, yielding a positive diagnosis of cardiac sarcoidosis in four patients. Of the entire cohort, eight patients (11%) received a CMR. Three patients (4%) underwent PET scanning, which demonstrated cardiac involvement in one patient (who also had a positive CMR).
Discussion: A high proportion of patients with pulmonary sarcoidosis presented with cardiac specific symptoms and/or evidence of conduction disease. Given that a full profile of investigations was only performed in three of these patients, this suggests that patients within NHS Glasgow and Greater Clyde could be under-investigated for co-existing cardiac sarcoidosis.
References
1.Dubrey, S. et al. (2016) ‘Sarcoidosis of the cardio–pulmonary systems’, Clinical Medicine, 16(1), pp. 34–41. doi:10.7861/clinmedicine.16–1-34.
2.Baughman RP, Teirstein AS, Judson MA, Rossman MD, Yeager H Jr, Bresnitz EA, et al.; A Case Control Etiologic Study of Sarcoidosis (ACCESS) research group. Clinical characteristics of patients in a case control study of sarcoidosis. Am J Respir Crit Care Med 2001;164:1885–1889.
3.Costabel, U., Hunninghake, G.W. and on behalf of the Sarcoidosis Statement Committee (1999) ‘ATS/ERS/Wasog statement on sarcoidosis’, European Respiratory Journal, 14(4), p. 735. doi:10.1034/j.1399-3003.1999.14d02.x.
4.Patel, M.R. et al. (2009) ‘Detection of myocardial damage in patients with sarcoidosis’, Circulation, 120(20), pp. 1969–1977. doi:10.1161/circulationaha.109.851352.
5.Lehtonen J, Uusitalo V, Pöyhönen P, Mäyränpää MI, Kupari M. Cardiac sarcoidosis: phenotypes, diagnosis, treatment, and prognosis. European Heart Journal. 2023 May 1;44(17):1495–510.
Intracoronary adenosine bolus for coronary microvascular function testing: all the plus without the fuss?
Daniel Ang1,2,3, David Carrick2,4, Robert Sykes3,5, Anna Kamdar3,6, Conor Bradley3,5, Jaclyn Carberry3,5, Andy Jong2,4, Robin Weir2,4, Aengus Murphy2,4, David MacDougall2,4, Mehrdad Malekian2,4, Arvind Sood2,4, Brian O'Rourke2,4, Ross McGeoch2,4, Alex McConnachie3,7 and Colin Berry3,8
1Cardiology Registrar
2University Hospital Hairmyres, NHS Lanarkshire
3University of Glasgow
4Consultant Cardiologist
5Clinical Research Fellow
6Medical Student
7Professor of Biostatistics
8Professor of Cardiology and Consultant Cardiologist
Background: Up to 50% of patients with angina are found to have no obstructive coronary artery disease (INOCA). Coronary function testing with measurement of index of microcirculatory resistance (IMR) and coronaryflow reserve (CFR) may be performed at the time of invasive coronary angiography to aid diagnosis. Barriers to more widespread testing include the increased procedural time and patient discomfort fromintravenous adenosine infusion, which is required to induce stable hyperaemia. Intracoronary (IC) adenosine induces local hyperaemia in the microcirculatory bed, without systemic side-effects. We investigated the feasibility, safety, dosing and clinical utility of intracoronary adenosine-derived indices of microvascular function.
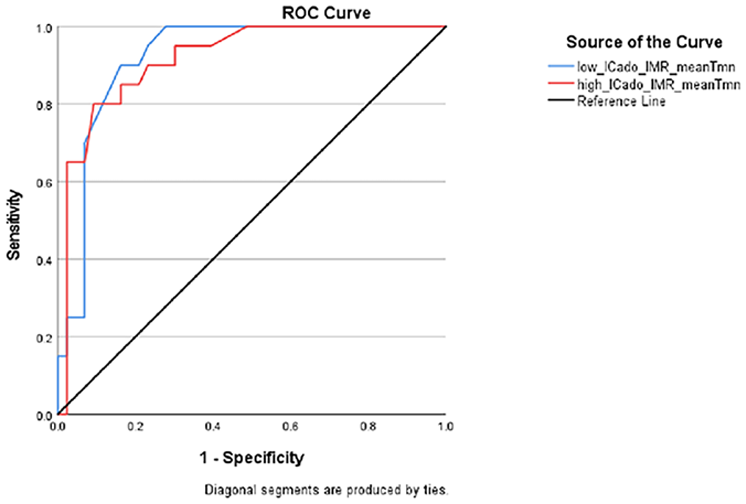
Receiver operating characteristic (ROC) curves comparing the accuracy of low-dose (90 micrograms) versus high-dose (210 micrograms) intracoronary adenosine derived index of microvascular resistance (IMR) in predicting intravenous adenosine infusion derived IMR of ≥25.
Receiver operating characteristic (ROC) curves comparing the accuracy of low-dose (90 micrograms) versus high-dose (210 micrograms) intracoronary adenosine derived coronary flow reserve (CFR) in predicting intravenous adenosine infusion derived CFR of <2.0.
Methods: Consecutive patients with suspected angina who underwent clinically-indicated invasive coronary angiography as part of the iCorMicA study (Clinicaltrials.gov: NCT04674449) at two tertiary-care cardiac hospitals in the west of Scotland between November 2022 and June 2023 were included. Coronary function testing was performed using a combined temperature/pressure diagnostic guidewire (PressureWire X; Abbott). Baseline demographics were obtained. Repeated 3ml thermodilution injections were performed at rest, immediately after a low-dose (90 micrograms), then high-dose (210 micrograms) intracoronary adenosine bolus, and finally during intravenous adenosine (140 micrograms/kg/min) infusion. Intracoronary adenosine-derived IMR (icIMR) and CFR (icCFR) were compared to their intravenous adenosine counterparts. Receiver operating characteristic (ROC) analyses were performed for both intracoronary adenosine doses.
Results: In total, 63 vessels from n=53 patients were included. The median age was 62 years, 64.2% male with median BMI 29.1. Co-morbidities include 50.9% smoking history, 11.3% diabetes mellitus, 52.8% hypertension, 13.2% atrial fibrillation, 24.5% previous MI, 3.2% previous CVA and 5.7% COPD. The vessels tested were 76.2% left anterior descending, 20.6% circumflex and 3.2% right coronary artery. 84.1% of vessels were non-obstructive, with median FFR=0.87 (IQR 0.82-0.92). There was strong correlation between intravenous adenosine IMR and both low-dose icIMR [Rs(61)=0.774, p<0.001] and high-dose icIMR [Rs(61)=0.781, p<0.001], with ROC AUC=0.92 for each. Using a reference of intravenous adenosine IMR≥25 and CFR<2.0 being abnormal, the optimal cut-offs for predicting microvascular dysfunction were: low-dose icIMR>23 (90.0% sensitivity, 16.3% false positive) and high-dose icIMR>23 (85.0% sensitivity, 16.3% false positive) (Figure 1). For icCFR, low-dose adenosine (AUC=0.94; [Rs(61)=0.683, p<0.001]) outperformed high-dose (AUC=0.83; [Rs(61)=0.594, p<0.001]) (Figure 2), with an optimal cut-off of low-dose icCFR<2.1 for predicting microvascular dysfunction (80.0% sensitivity, 8.3% false positive). Transient AV block occurred in 13.2% of patients during high-dose intracoronary bolus. No adverse effects were seen with the lower dose.
Conclusion: Intracoronary adenosine bolus is a feasible and safe alternative to intravenous adenosine infusion for microvascular function testing. Low-dose (90 micrograms) outperformed high-dose bolus in diagnostic accuracy and safety. Larger studies are needed to validate these findings in the wider population.