




Abstract
In this article we analyse class cultures by mapping out differences in ‘original taste’; that is, respondents’ classed preferences for food and drink. By employing Multiple Correspondence Analysis, we produce a relational model of tastes. Using three indicators of social class – occupational class, income and education – we find clear class divisions. The upper and middle classes exhibit diverse and what are typically regarded as ‘healthy’ tastes; this contrasts with the more restricted and what are typically regarded as ‘less healthy’ tastes found among the working classes. Our findings challenge ongoing debates within cultural stratification research where it has become almost usual to demonstrate that the contemporary upper and middle classes exhibit playful tastes for the ‘cosmopolitan’ and the ‘exotic’. We find that upper- and middle-class households also enjoy very traditional foodstuffs. We argue that this illustrates a need for a relational understanding of taste: even the consumption of the traditional peasant food of pre-capitalist Norway can be refashioned as a badge of distinction in the 21st century.
Keywords
You are what you eat, or so the saying goes. But although cultural class analysis has restored culture and lifestyle at heart of the analysis and theorisation of social class (Reay et al., 2005; Savage, 2000; Savage et al., 2015; Skeggs, 2004), remarkably little attention has been paid to food and eating practices in contemporary class analysis (though see Holm, 2013). This is striking not only because food seems to be an arena where new forms of cultural distinction are asserted (Johnston and Baumann, 2014), but also because food practices are intertwined with classed feelings of worth and disgust (Paddock, 2015; Pike and Kelly, 2014; Rhys-Taylor, 2013). The consumption of food played a pivotal role in Bourdieu’s seminal account, Distinction (1984), but has mostly been neglected in studies of cultural stratification in its wake. Researchers have been more oriented towards culture in a narrow sense; for example, people’s preferences for music, literature, the performing arts and museum-going. In this article, we offer a fresh look at class cultures by mapping out culinary preferences – ‘the ultimate metaphorical source of the concept of taste’ (Warde, 1997: 22).
With cultural class analysis largely focused on the UK, little is known about cultural class divisions elsewhere, especially in the more egalitarian Scandinavian societies. Although these countries are undoubtedly stratified by class, the particular manifestations and salience of the cultural components of class and the ramifications of such remain understudied. Contemporary Norway is a particularly interesting case in that it is a likely candidate for demonstrating weak connections between class and culture. It is a comparatively egalitarian society, ranking as one of the least unequal OECD countries (OECD, 2015). Norwegians themselves view their country as highly egalitarian, even compared to the neighbouring social democracies (Hjellbrekke et al., 2015). Norway has historically had a rather small, weak nobility, and a comparatively weak industrial bourgeoisie, owing partly to the country being subjected to both Danish and Swedish rule up through the ages (Sejersted, 1993). Moreover, Norway is a highly advanced capitalist economy sharing many of the institutional traits that have been highlighted as weakening class divisions, such as a universalist welfare state (Johansson and Hvinden, 2007).
The consumption of food and drink implies a range of activities and rituals that can be distinguished analytically; for example, acquisition/purchase, storage, preparation, serving, eating/drinking, clearing, washing and disposal (Kjærnes, 2009: 29). As our focus here is on households’ expenditure on food and drink, we would not claim that our analysis represents an exhaustive account of food and drink consumption and culinary tastes. We would, however, claim that our study represents one aspect that is: (a) highly relevant to the question of lifestyle differentiation and its relatedness to social class, since what people eat and drink in their daily lives is directly related to their health, and thus to their life chances; (b) somewhat neglected in recent studies of class, culture and culinary tastes which have been geared towards preferences for basic dinner dishes (Prieur et al., 2008; Rosenlund, 2009), the practice of eating out (Bennett et al., 2009; Warde and Martens, 2000), the discourse of food appreciation (Johnston and Baumann, 2014) and the ways in which class boundaries are expressed in discussions of food practices (Paddock, 2015).
To investigate the potentially classed nature of taste, two explorative research questions are addressed: what are the main lines of division in tastes for food and drink in contemporary Norway; and, how are these differences related to social class divisions? To map out tastes, a wide range of items need to be investigated and this places heavy demands on the data and the method required. Accordingly, we draw on the unusually rich and robust Survey of Consumer Expenditure 2012, gathered by Statistics Norway. To incorporate a large number of items, we exploit the unique ability of Multiple Correspondence Analysis (MCA) (Le Roux and Rouanet, 2010) to deal with a large number of categorical variables. MCA allows one to map out inductively the relations between a wide range of foodstuffs and beverages and represent them in maps that depict the main differences in taste patterns. Having constructed and interpreted the structure of the space of tastes for food and drink, we then ask how social class divisions relate to it.
Sociological Debates about Class, Culture and Culinary Tastes
According to the influential, yet highly controversial, theory of individualisation proposed by Beck (1992) and Giddens (1991), whatever coherence may be seen in the life-choices of individuals is now reflexively created and maintained, as opposed to emanating from tradition or class position. Mennell (1985), for instance, maintains that the historical development that has led to increasing varieties of foodstuffs being available has been accompanied by diminishing social divisions. When faced with meticulous empirical inquiries into the connection between class and contemporary food consumption, however, such sweeping claims about individualisation, detraditionalisation and the demise of class have been seriously challenged (Warde, 1997; Warde and Martens, 2000).
Recent debates in cultural class analysis have increasingly revolved around the model advanced by Bourdieu (1984) in his seminal account of class differences in French society in the 1960s and 1970s. Bourdieu has demonstrated how the system of class differences corresponds to a system of lifestyle differences. Within the space of food consumption, Bourdieu has found distinct culinary tastes among the various classes and class fractions. Whereas members of the upper classes in his study exhibited distinctive tastes for ‘refined’ and light foodstuffs, members of the lower classes typically preferred the heavy and substantial. According to Bourdieu, this revealed a fundamental, class-structured division between a taste for the rare or exclusive (a ‘taste of freedom’), and, a taste for the functional or practical (a ‘choice of the necessary’).
However, Bourdieu’s contribution has sparked controversy in terms of the role of lifestyle differences in contemporary society. Some proponents of the ‘cultural omnivore’ thesis have argued that the broad and eclectic taste orientations found among recent generations of the upper and middle classes indicate a blurring of class-structured cultural distinctions (for overviews, see Hazir and Warde, 2016; Peterson, 2005). The figure of the ‘highbrow snob’ who exclusively appreciates goods inaccessible to the general public, they argue, is therefore increasingly losing prevalence in contemporary society. Although not heralding the end of cultural distinction, the development towards omnivorousness is regarded as indicating a marked historical shift in lifestyle differentiation.
In the case of culinary tastes, the notion of the omnivore is used to highlight a declining orientation towards ‘snobbish’ foodstuffs and cookery – particularly French haute cuisine and its pivotal role in asserting social rank and status. Instead, it is argued, new forms of distinction are increasingly asserted through knowledgeable and playful ways of straddling hierarchical divides; for example, by appreciating both gourmet food and food with significant mass appeal, as well as by exploring the ‘exoticness’ and ‘authenticity’ of ‘alternative’ and various ethnic cuisines (Johnston and Baumann, 2014; Paddock, 2015; Rhys-Taylor, 2013).
Although the usual tendency within cultural stratification research is to frame findings of omnivorousness as a rebuttal of Bourdieu’s model (see, for example, Chan, 2010; Warde, 2011), there are several authors who have pointed out that this development was foreshadowed, and even a central part of, Bourdieu’s initial advances (Holt, 1997; Jarness, 2013; Lizardo and Skiles, 2015). Straddling hierarchical divides is in fact a key feature of what Bourdieu has referred to as a ‘taste of freedom’ and a ‘sense of distinction’ typical of those rich in cultural capital (see, for example, Bourdieu, 1984: 261–317). Indeed, Bourdieu regarded the capability to playfully appropriate ‘vulgar’ products as a socially profitable one whereby the social meaning of such goods could be transformed. In other words, Bourdieu’s thesis does not contend that the upper and middle classes only appropriate a fixed set of ‘highbrow’ foodstuffs (e.g. French haute cuisine), while shunning all things ‘lowbrow’ (e.g. ‘fast food’ and ‘junk food’). But it does contend that the distribution of foodstuffs – no matter their content – is structured along class lines.
In our analysis below, we avoid the substantialist fallacy of assuming that cultural class divisions necessarily involve a particular set of preferences for foodstuffs predefined as ‘high’ or ‘low’. By applying an inductive, relational approach inspired by Bourdieu, we construct a multidimensional space of food and drink consumption that depicts a complex system of differences in respondents’ preferences for foodstuffs; we then inspect the ways in which this space is structured along class divisions.
Culinary Distinctions in an Egalitarian Society
The most frequently cited studies of class and culinary distinctions have been conducted in French, British and US contexts (e.g. Bennett et al., 2009; Bourdieu, 1984; Johnston and Baumann, 2014; Mennell, 1985; Warde, 1997; Warde and Martens, 2000). These countries are politically, institutionally and socio-culturally quite different from Norway, a country not especially known for striking resource inequalities or refined, gourmet traditions. A number of critics have thus contended that the ‘French’ model advanced in Bourdieu’s Distinction does not apply to Norwegian society (see Skarpenes and Sakslind, 2010).
Although Norway is still considered to be a social-democratic welfare regime (Esping-Andersen, 1990), it has, like other advanced societies, undergone far-reaching, politically driven deregulation and privatisation in recent decades. This has significantly affected the supply side of Norwegian food consumption. In addition, relaxing tax barriers on imported food has made a greater variety of foodstuffs available to Norwegian consumers. As pointed out by Kjærnes (2009), the role of people as consumers of food has also changed: they appear to have been given more freedom and responsibility as individuals by the government. However, such processes of deregulation are far from universal. Norway has, in contrast to many other European countries, largely retained a post-war standardised and national culture of food, protected by a paternalist welfare state. Norwegians are still very much traditional in their eating habits, with meal patterns typically consisting of two or three cold meals and, in contrast to many other European countries, only one hot meal per day. Meat is the most common ingredient in hot meals (Bugge and Døving, 2000) and cold meals typically involve bread. Lunch at school or work typically consists of a matpakke (a packed lunch of sandwiches brought from home), a tradition dating back to the 1930s (Kjærnes, 2009). Norway also tends to lag behind other countries when it comes to global food trends: mass-produced foodstuffs and their associated global chains tend to enter the Norwegian market much later than other European markets. Cross-national comparative studies have also revealed that Norwegians demonstrate a relatively low interest in ‘sustainable’ or ‘organic’ food (Niva et al., 2014).
Because of little tradition for appreciating gourmet food, widespread egalitarian sentiments and the role of the social-democratic welfare state, Norway is a particularly interesting case for assessing sociological claims about dwindling class cultures. Some evidence suggests that the social structuring of food consumption and culinary tastes in Norway is similar to that found elsewhere. Although few studies of food consumption are framed in terms of class analysis, what and how people eat is indeed linked to their income and education level (Bugge, 2015; Bugge and Almås, 2006; Bugge and Lavik, 2010; Skuland, 2015).
Measuring Social Class
Although social class is traditionally conceptualised as a product of the basic institutional make-up of capitalism, recent contributions have explored the fruitfulness of studying social class in terms of the interplay of different forms of capital (Flemmen, 2013; Savage et al., 2005, 2015). This draws on the way in which Bourdieu (1984) employed the concepts of economic, cultural and social capital to unpack the idea that class divisions are not just economic, although they most certainly are, but that education, cultural competence and social connections also constitute important forms of privilege.
We see class as manifested in the distribution of these forms of capital. We measure social class by using the Oslo Register Data Class scheme – ORDC (Hansen et al., 2009). Originally devised for the Norwegian administrative records, this class scheme uses occupation and income to capture hierarchical class differences – upper, upper-middle, lower-middle and working class – and horizontal divisions as differences in the composition of capital, the relative weight of one’s cultural versus one’s economic capital. Thus, the structure of the class scheme mimics the model of the social space proposed by Bourdieu (1984: 128–129).
The ORDC scheme is constructed using mostly occupational data, but also information about income. First, the main structure is constructed by sorting occupations into different classes and fractions. Second, we use information about income as a measure of economic capital to differentiate between the upper and middle classes in the economic fraction. Operationally, this means that the fractions best endowed with economic capital are hierarchically differentiated according to their total amount of income (wages, capital gains and income from self-employment). 1 Unfortunately, a similar logic cannot be used for the other fractions: cultural capital is more central to their social position, but we do not have the direct measure necessary for an analogous operation. We assign a class position to the household by using the occupation of the main income earner. The class scheme is shown in Figure 1, with examples of occupations and weighted percentages.
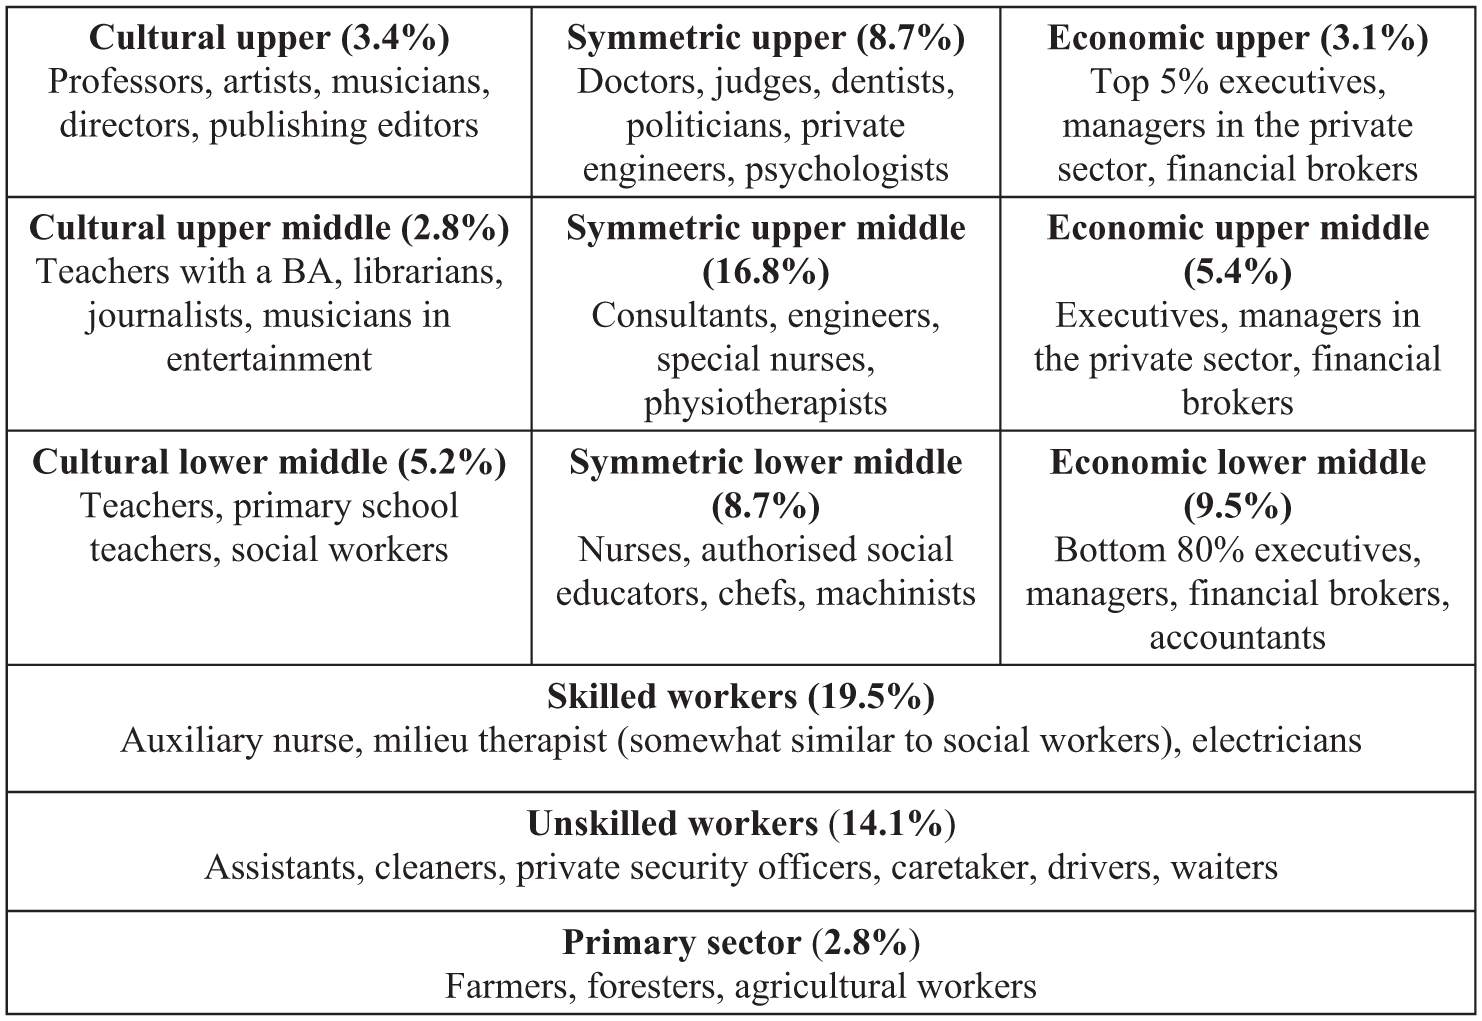
The ORDC scheme with examples of occupations. Weighted valid percentages.
Data, Method and Analytical Strategy
Statistics Norway’s Survey of Consumer Expenditure 2012 was distributed to a representative sample of all Norwegian households (N = 6875) (SSB, 2013). The response rate was 48.9 per cent, resulting in a net sample of 3363 households. The survey comprised data on household expenditure, including housing, transport, durable consumer goods and food. The expenditure was recorded according to respondents’ receipts, for example from grocery store purchases. Defection weights corrected for skew arising from non-responses in terms of household type, the age of the respondent and region, as well as the time of year the expenditure was recorded (Holmøy and Lillegård, 2014).
Our analysis is limited to expenditure on food and drink, and the sample is restricted to households where the main breadwinner is aged 24–76. Cases with missing values for several expenditure variables have also been excluded. After filtering, the sample consists of 2708 households. 2 Education level is measured by the official Norwegian Standard Classification of Education (SSB, 2001) for the person in the household who completed the survey. 3 Data on occupation and social class are measured for the household’s main breadwinner. Income is measured as total household income, combining wages/salaries, self-employed and capital income. When using the weights calculated by Statistics Norway that produced the data, our analysis is representative of the national population and can therefore serve as a basis for drawing inferences about all Norwegian households (for further details, see Holmøy and Lillegård, 2014).
Our analytical strategy is inspired by Bourdieu’s relational approach to the social structuring of lifestyles. According to this approach, there is no inherent, substantive meaning ascribed to a particular consumer product: it is understandable in relation to all others. The interpretation of the classed nature of a taste for whisky, champagne, Chinese food, mineral water and salad (distinctive of the upper class) owes everything to its opposition to a taste for Pernod, sparkling white wine, bacon, pasta and potatoes (distinctive of the lower class) (Bourdieu, 1984: 128–129). A remarkable feature of this approach is the intrinsic affinity between the theorisation of the classed nature of lifestyles and the method to study it with; that is, between the idea of a relational structuring of the social world and the relational properties of MCA, ‘a relational technique of data analysis whose philosophy corresponds exactly to what, in my view, the reality of the social world is’ (Bourdieu and Wacquant, 1992: 96).
To construct a space of food and beverage consumption, we use Specific MCA, a statistical technique that provides a geometric model of categorical data by revealing and visually representing latent structures or oppositions in a dataset (Le Roux and Rouanet, 2010). The chi-square distances between the row/column categories in the data matrix or table are calculated, the oppositions between the row or column categories maximised and the latent structures or axes that best describe the oppositions between the row or column categories are revealed. Unlike Principal Component Analysis (PCA), MCA does not assume that the variables follow a multivariate normal distribution, or that the associations between the variables are linear.
The detailed interpretation is based on information about two clouds of points: a cloud of categories that represents difference and similarity between categories of the active variables, and a cloud of cases that reflects difference and similarity between the cases (see Figure A1 and A2 in the online Appendix). Categories that tend to ‘share’ many of the same cases will be located in proximity to each other, and categories with no or only a few cases in common will be located far away from each other. Similarly, two cases or households with similar response profiles will be located close to each other, and cases with very different profiles distant from each other. In this way, each point’s position in the cloud must be interpreted in relation to all the other points belonging to the same cloud.
Our resultant food space will thus represent the main divisions in the relative expenditure patterns. The oppositions within this space are summed up by the principal axes. Axis 1 describes the most dominant opposition, Axis 2 the second most dominant, etc. The meaning of the axes is determined by interpreting the difference between the categories at each pole, with special emphasis given to categories with contributions above average – so-called explicative points (for applications of MCA, see Hjellbrekke et al., 2015; Le Roux et al., 2008).
So as not to inscribe an economic hierarchy directly into the space, the variables are relativised according to the household’s total expenditure on food and beverages. Accordingly, the variables are more readily interpretable as indicating consumption preferences, and not just the volume of consumption or purchasing power. Moreover, the variables are categorised because this allows one to use MCA to reveal the dimensions in the space; it also prevents some strongly skewed variables from destabilising the outcome of the analysis. The number of categories varies from two to five, depending on the distributions of the original variables. Some items are purchased only by a minority of households and have therefore been coded as binary variables. For variables with higher variance, we differentiate between no, very low or low, medium, high or very high consumption. We analyse 65 variables with 231 active categories between them. Table 1 shows the number of variables (‘Q’) and categories (‘K’) organised by thematic block, along with their weighted marginal distribution. 4
Variables used for the construction of the space of food and beverages, organised by block. Number of categories per variable. Q denotes the number of variables per block, K the number of categories. Weighted percentages.
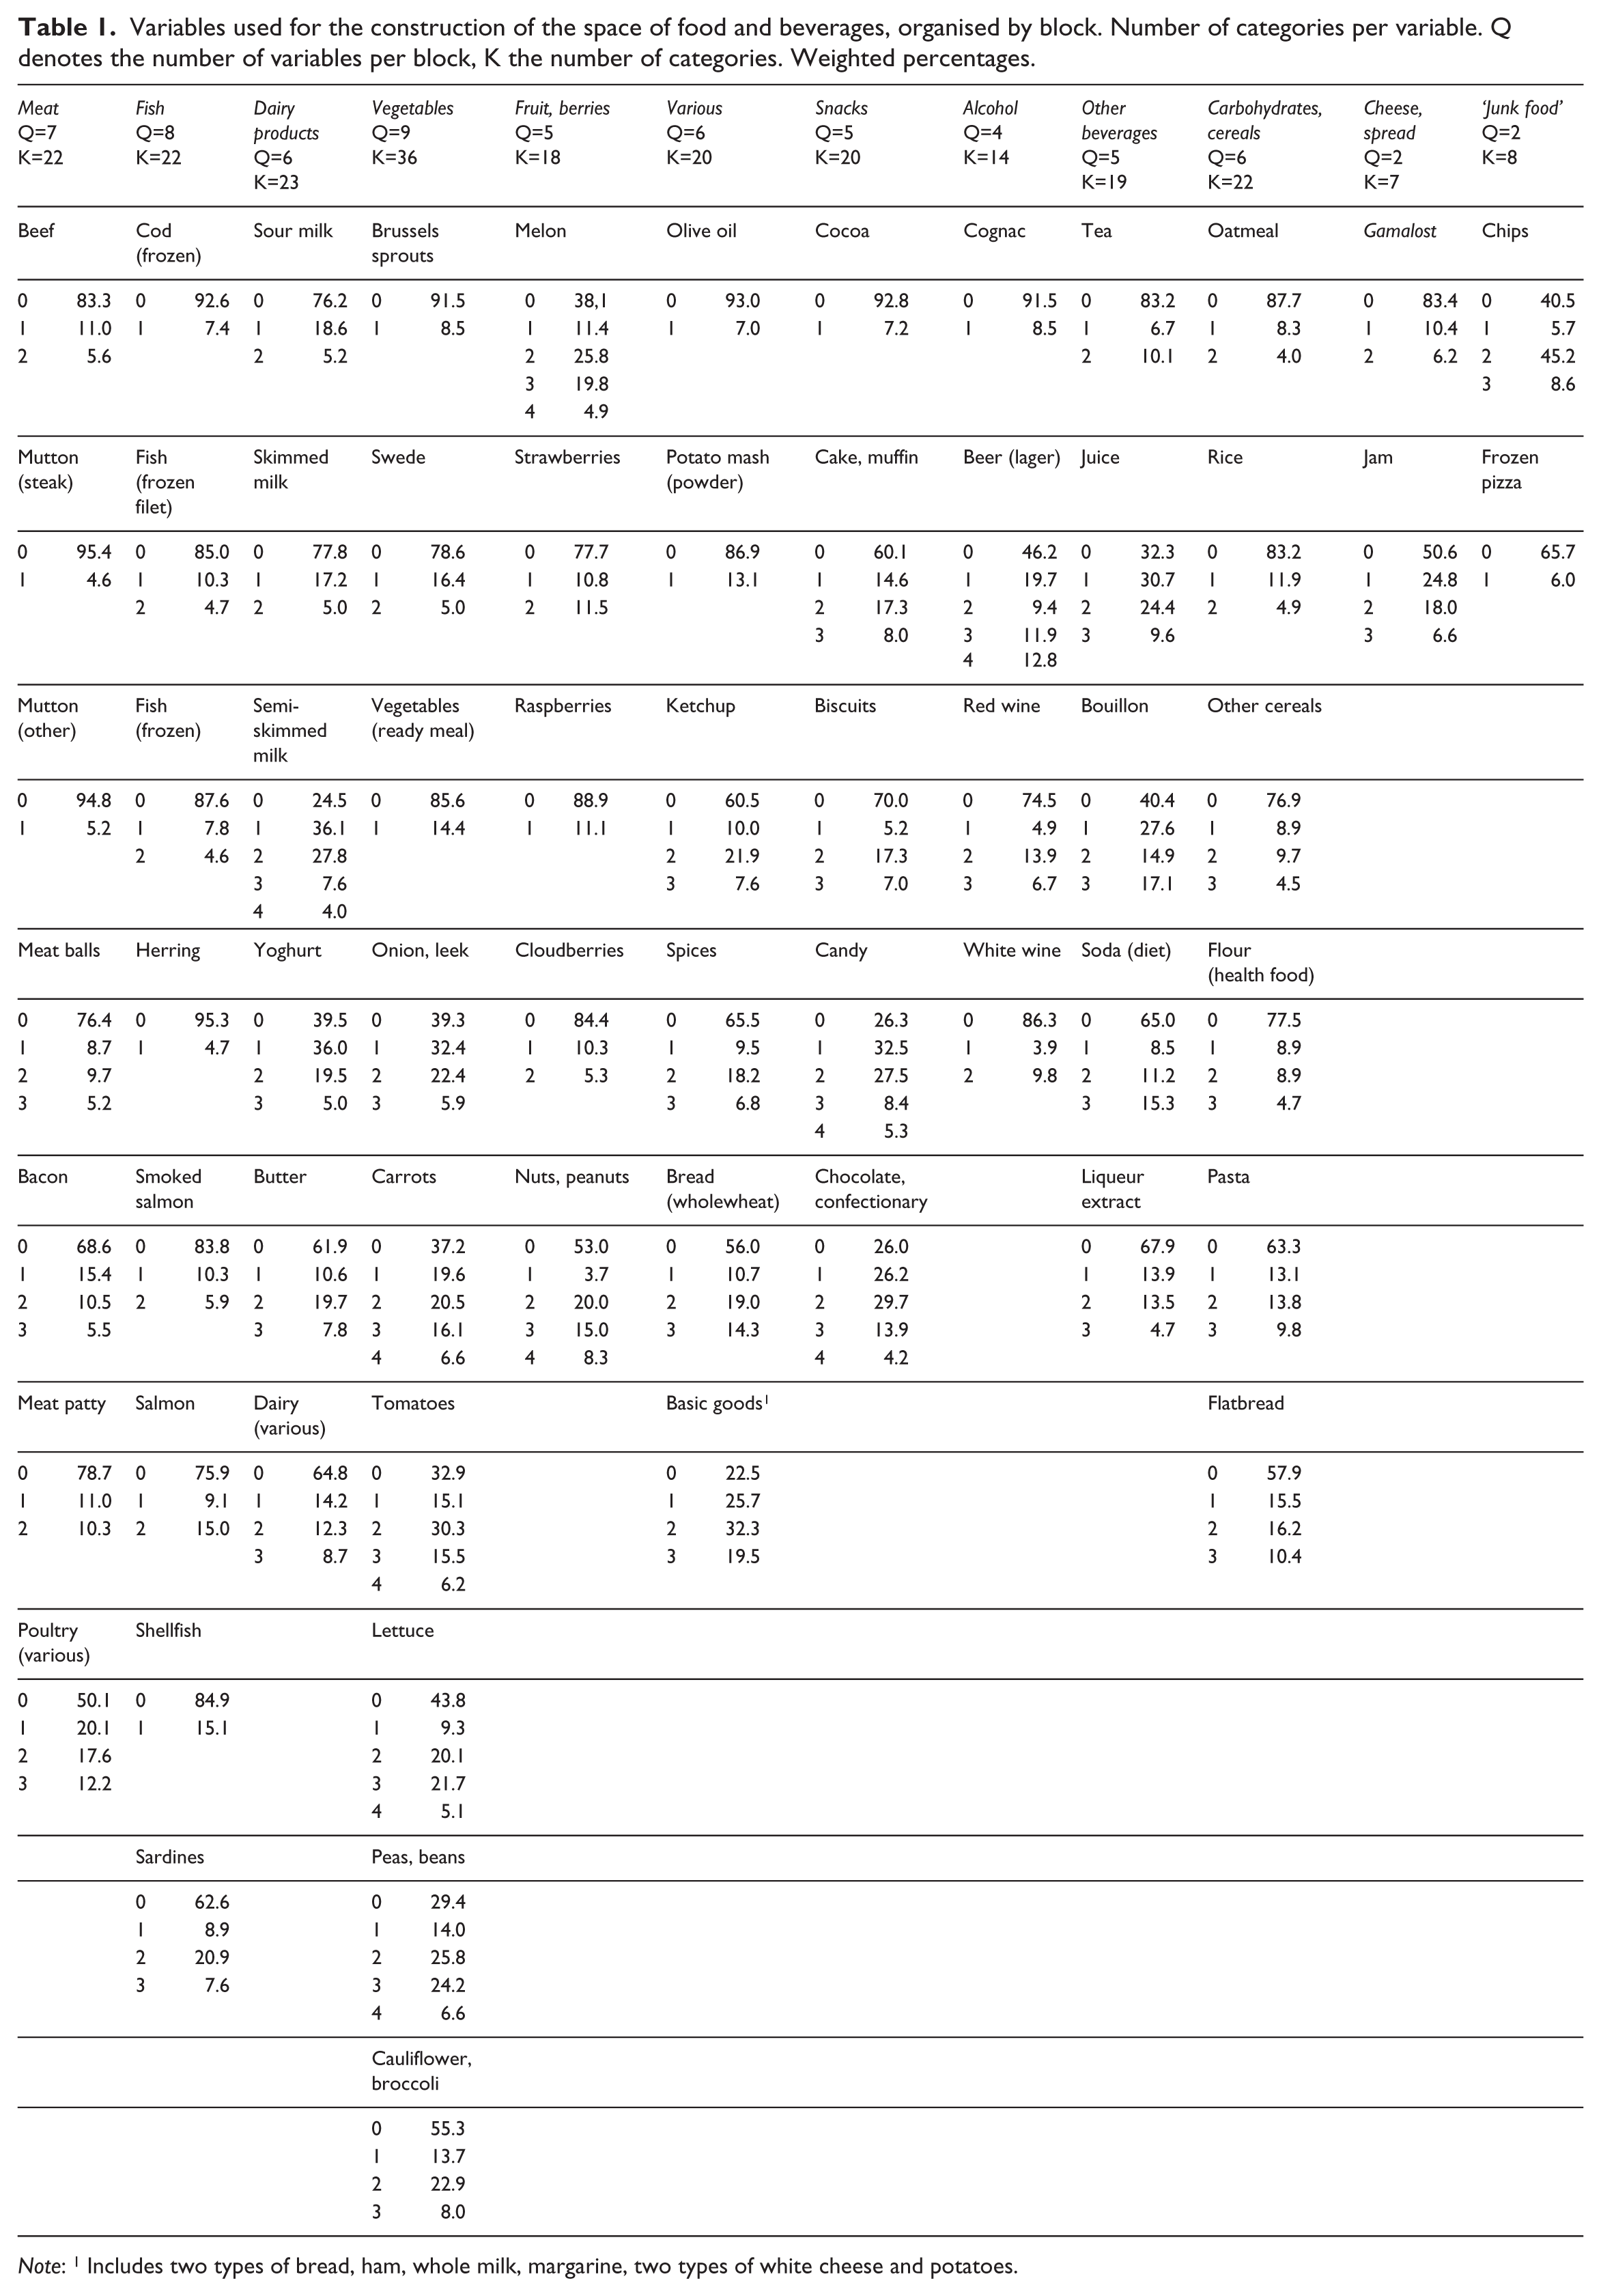
Note: 1 Includes two types of bread, ham, whole milk, margarine, two types of white cheese and potatoes.
Once the structure of the food space is established, we then investigate how the structure of the food space relates to social divisions. We apply indicators of social class and indicators of capital possessions as supplementary variables. These variables do not affect the structure of the space but are projected onto it. The mean position of any supplementary category is a function of its distribution across the active categories in the space. This procedure has been described as ‘visual regression analysis’ (Lebart et al., 1984: 104), where, in our case, the food space is the ‘independent’ and social class the ‘dependent’ variable. If two supplementary categories are located in distance from each other, their profiles across the active set are also clearly different. The deviation between two categories along an axis can be described as notable if it is above 0.5, and as large if it is above 1.0 (Le Roux and Rouanet, 2010: 59). 5
The Space of Food and Beverage Consumption
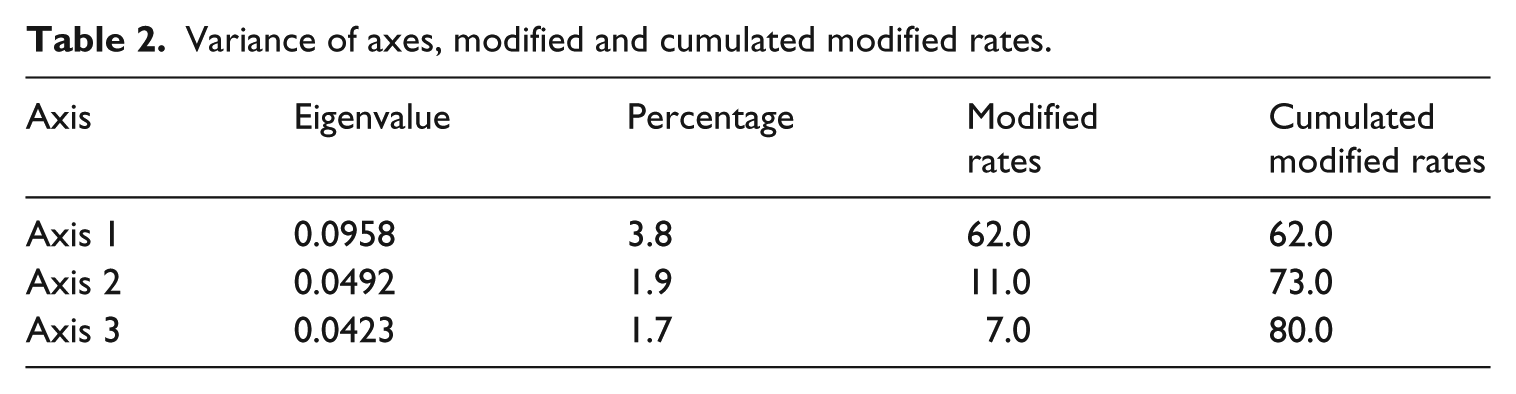
With three axes we can account for 80.0 per cent of the variance in the original variables. 6 Axis 1 is clearly the strongest dimension, summarising 62.0 per cent, with Axes 2 and 3 summarising 11.0 and 7.0 per cent respectively (see Table 2). Contributions of the groups of variables are listed in Table 3.
Variance of axes, modified and cumulated modified rates.
Contribution from 12 blocks to total inertia, to Axes 1–3.
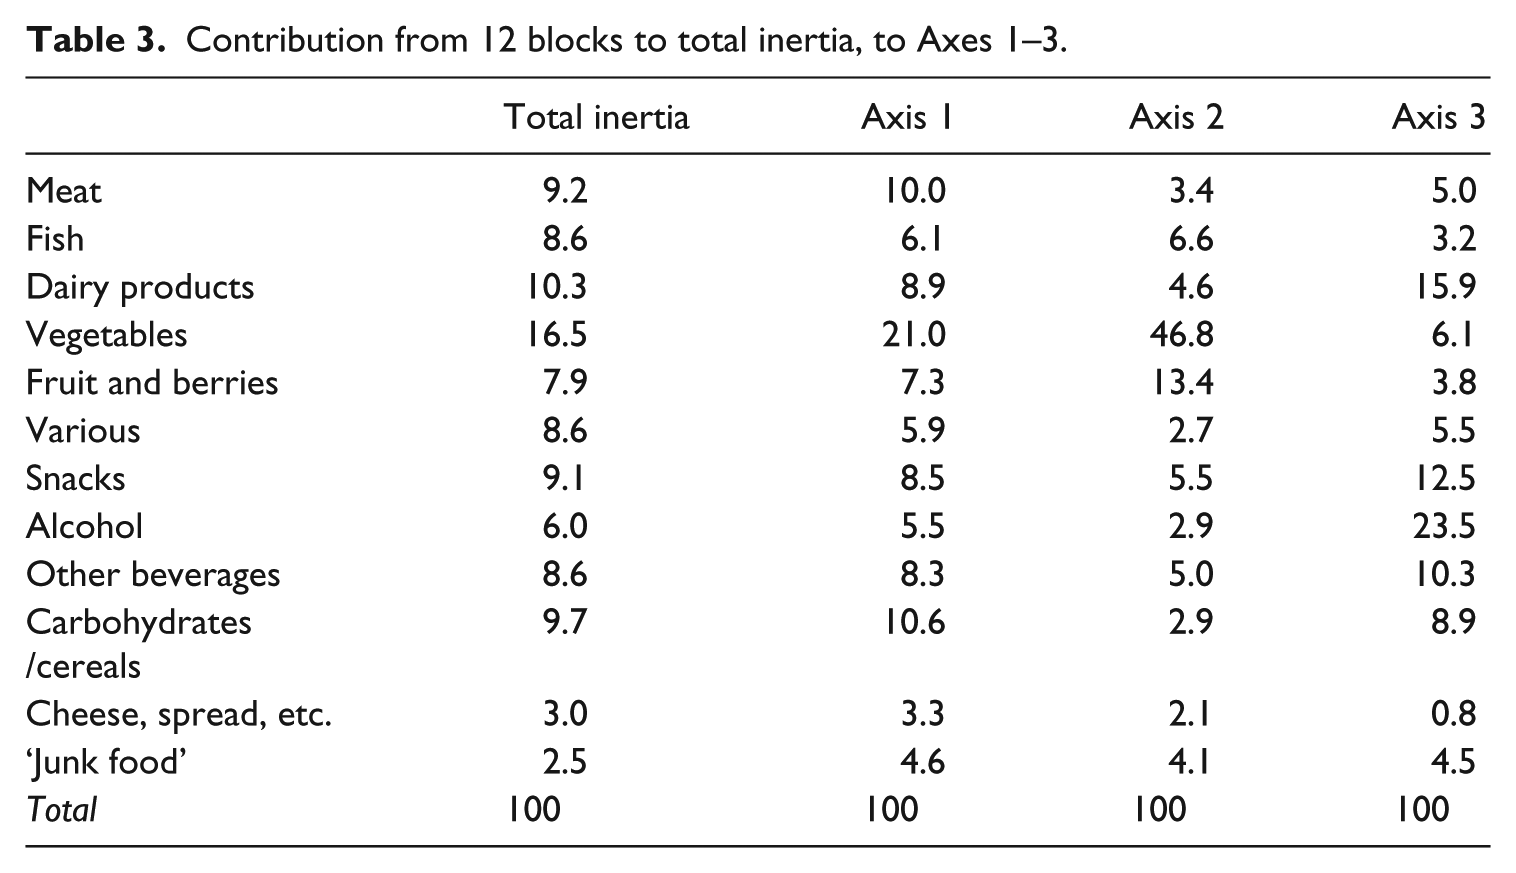
The first axis distinguishes between eclectic and restricted tastes. It may be interpreted as a general axis, insofar as it is more or less equally shaped by all groups of variables. Figure 2 depicts the 79 explicative points – points with a contribution higher than the average contribution, for Axis 1 (see Table A1 in the online Appendix for details). The axis primarily distinguishes between the high consumption of a varied set of food and beverages, found to the left of the map, and strongly restricted consumption patterns, found to the right. On the left of the map, we find preferences for a wide range of basic items (tea, butter, ketchup, bacon), global, mass food items (pasta, pizza, diet soda), traditional items, once staples of the Norwegian peasant diet (smoked salmon, meat balls, oatmeal, swede), as well as some fairly rare items (speciality flour bought at health food stores, cloudberries).
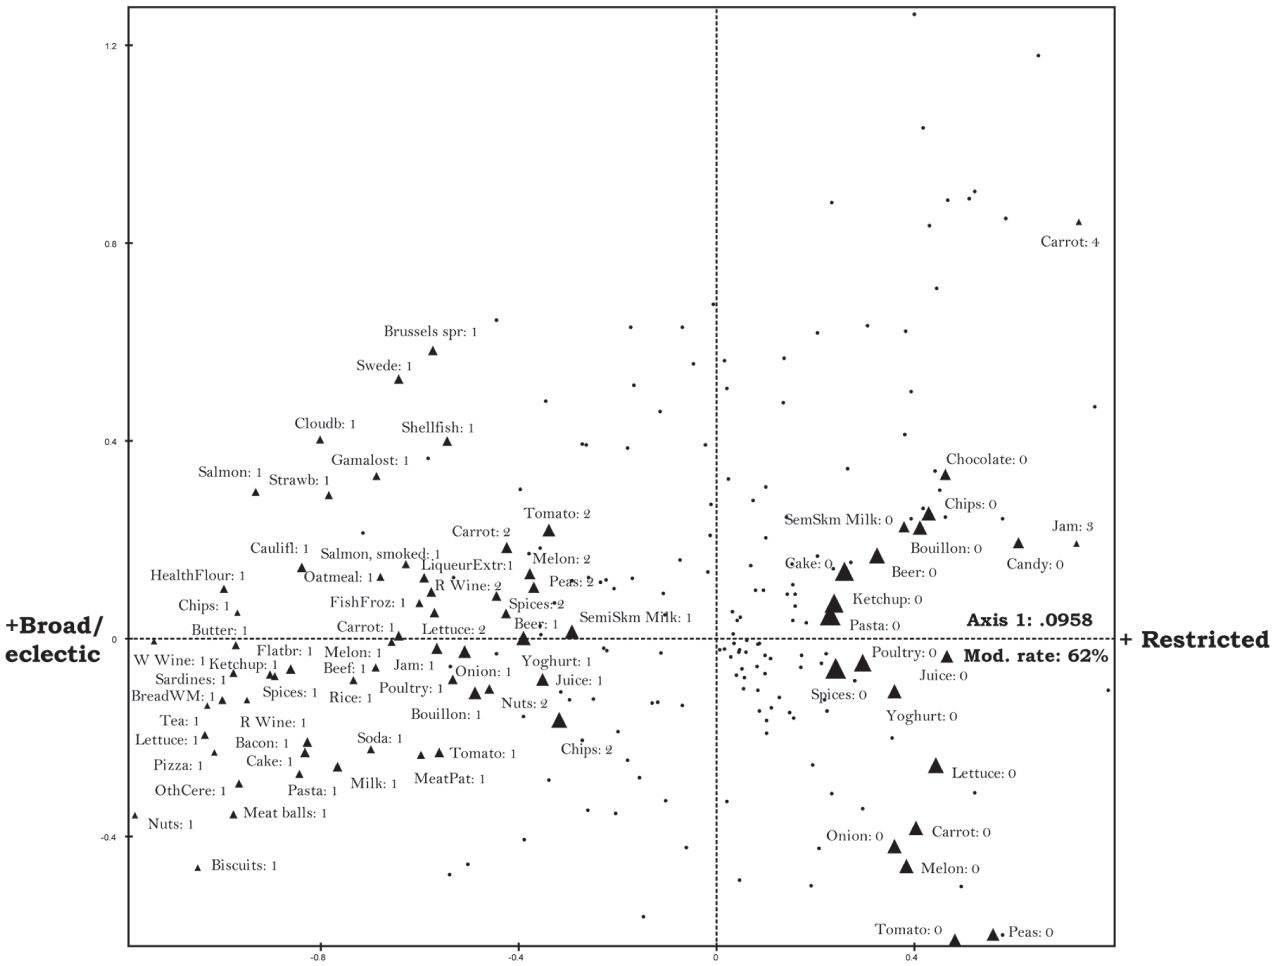
Explicative points (categories with contribution above average) for Axis 1.
The very opposite of this highly eclectic consumption of foodstuffs can be found on the right side of Axis 1, where we find categories indicating no consumption of a range of items (juice, peas, tomato, candy), as well as categories indicating the high consumption of basic items (jam, carrots, sour milk). Thus, on the right side of the axis we find strikingly more restricted consumption patterns than the eclectic pattern to the left of the axis. This restricted orientation in food consumption is indicative of what Bourdieu (1984: 372–396) has referred to as ‘the choice of the necessary’: a taste for foodstuffs that are functional and satiating, and a corresponding rejection of luxuries.
Our second axis represents a divide between healthy and unhealthy foodstuffs. The axis is clearly linked to the consumption of vegetables, fruit, berries and nuts: almost 60 per cent of the contributions to the axis stem from these variables. Figure 3 depicts the 61 categories with the highest contributions to Axis 2. Categories indicating high/very high or no consumption of tomatoes, peas and cauliflower stand out with far higher contributions than the others (see Table A2 in the online Appendix). Strikingly, the axis polarises tastes finely attuned to the nutritional guidelines provided by the World Health Organisation (WHO, 2002) and the Norwegian National Council for Nutrition (NCFN, 2011), and tastes that are not (see Skuland, 2015). At the top of the map, we find categories indicating the high consumption of what these agencies typically regard as healthy food items (various types of fish and seafood, vegetables, fruit, berries, nuts), as well as no consumption of items typically regarded as unhealthy (soda, beer, chocolate, chips). Interestingly, we also find preferences for items indicative of the traditional Norwegian food culture (flatbread, cloudberries, smoked salmon, gamalost), 7 indicating that the consumption of healthy foodstuffs goes hand in hand with items once staples of Norwegian husmannskost – traditional, locally produced peasant food. 8
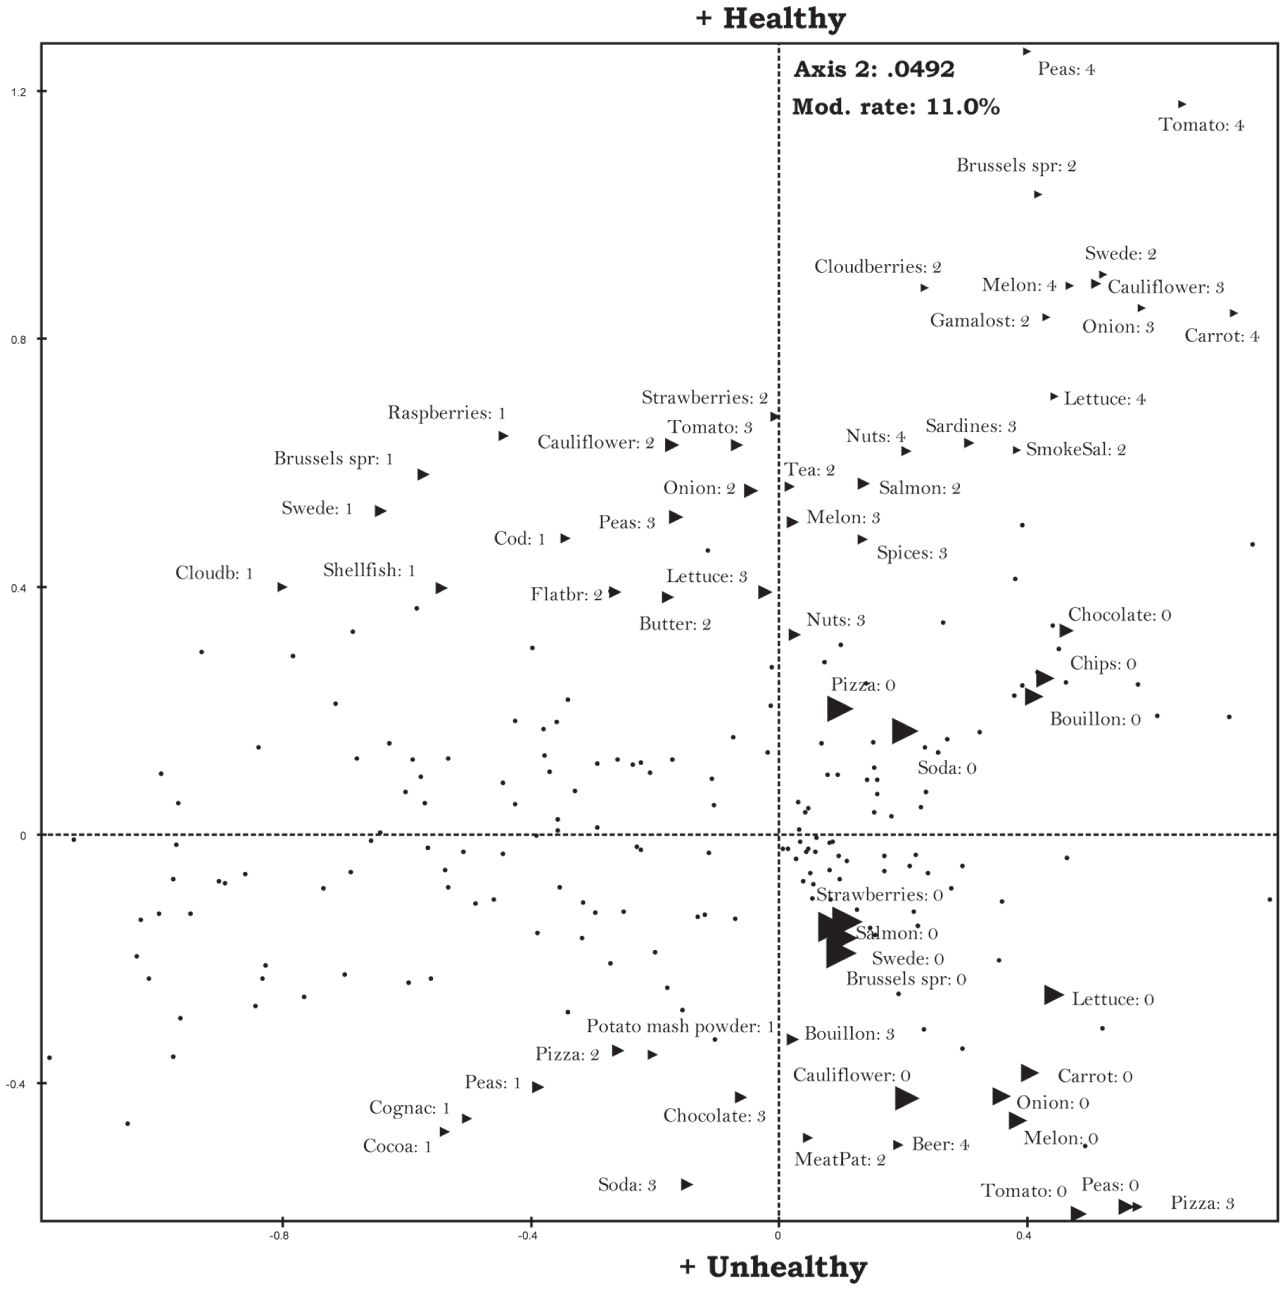
Explicative points for Axis 2.
At the bottom of the map we find categories indicating the high consumption of what the agencies referred to above consider to be less healthy food and beverages (processed meat products, frozen pizza, beer, artificially sweetened soda and cognac). Moreover, the category points for little or no consumption of fruit and vegetables are also found in the lower quadrants, meaning that those who typically prefer unhealthy foodstuffs also have a strong tendency to avoid healthy foodstuffs.
Our third axis distinguishes between types of unhealthy tastes. The axis is linked to the consumption of alcohol, other beverages, various snacks and dairy products. Figure 4 shows the 83 categories with the highest contributions to Axis 3. Categories indicating relatively high expenditure on red wine, white wine, beer and cognac all make high contributions to the axis. These categories are located at the bottom of the map, clearly separate from the others. At the top of the map, we find the relatively high consumption of dairy products, biscuits, pasta and bread, as well as items typically considered ‘junk food’ (artificially sweetened soda, chocolate and frozen pizza). The axis describes a division between two lifestyles that are typically considered unhealthy, although in different ways: at the lower pole of the axis, alcohol dominates, whereas products with a high content of fat, sugar and other forms of carbohydrates dominate at the upper pole of the axis.
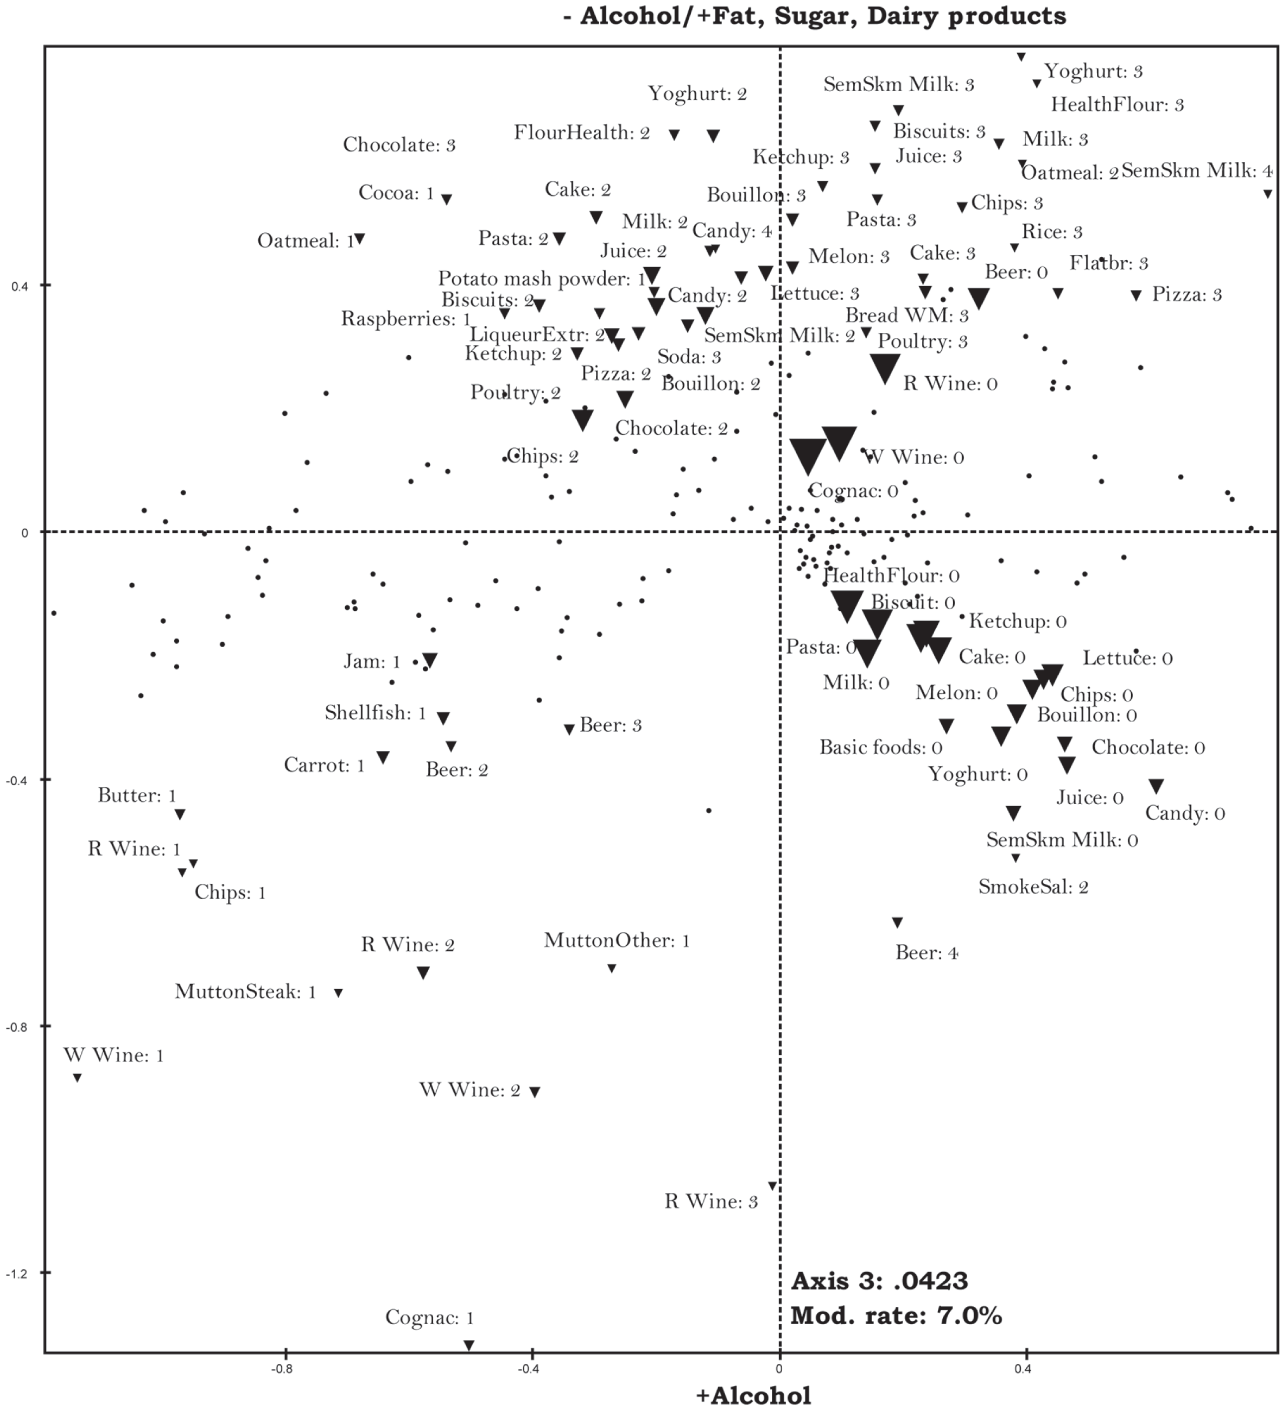
Explicative points for Axis 3.
Classed Tastes
We assess whether and how these divisions in taste relate to social divisions by projecting measures of class – income, education and occupational class – onto the space and then inspecting the distances between the categories of these class variables. The greater the distances, the more marked the association between taste and social divisions. Axis 1 (the axis that separates an eclectic taste for foodstuffs from a considerably more restricted taste) is unsurprisingly associated with the size of the household. Moving from the left to the right in Figure 5, the size of the household systematically increases, one-person households being the most restricted and five-person households the most eclectic. The distance between the category points is very large: above 1.5 SDs, which indicates that Axis 1 is strongly related to household size. Figure 5 shows that Axis 1 is also structured according to the volume of economic capital, as measured by the household’s total income. Categories indicating high volumes of economic capital systematically contrast with low volumes of economic capital. The rank order is consistent and very clear. The distance between the highest and the lowest category points is also very large: 1.3 SDs. Although it is obvious that household income increases according to household size, there are important economic differences within the household categories. When inspecting the concentration ellipses around each mean category point of the various household sizes, they indicate that each category is internally differentiated according to the households’ income. 9 Thus, Axis 1 cannot be viewed as structured solely by household size.
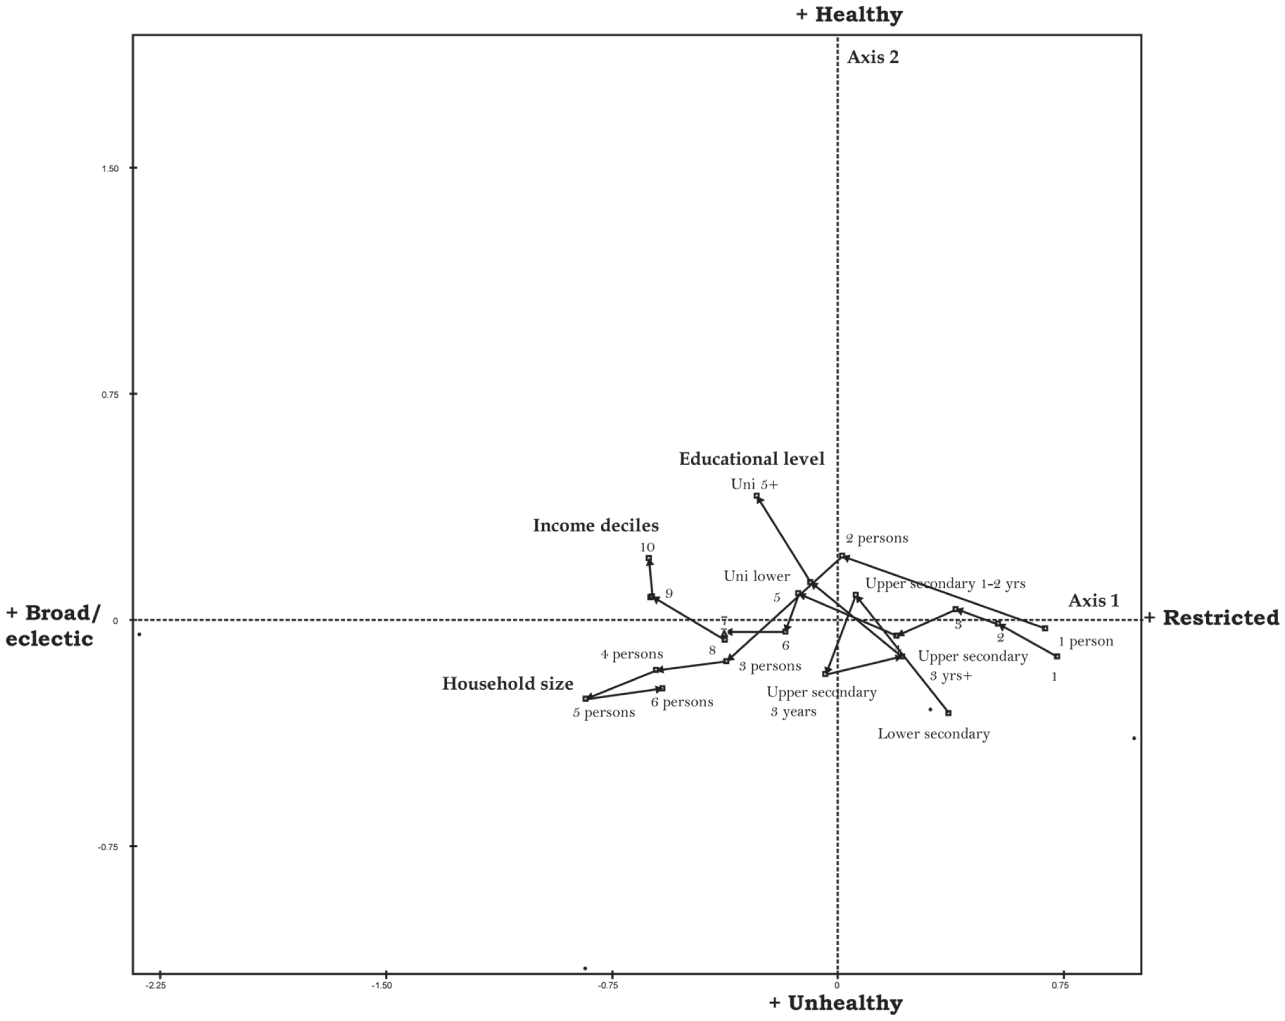
Income deciles, education levels and household size, factorial plane 1–2.
Axis 2 (that separates healthy and unhealthy foodstuffs) is more clearly connected to social class divisions. As is evident in Figure 5, the axis describes a systematic division between high and low education levels. Even though the rank order is less consistent than for the income variable, the distance between the highest and the lowest education level (five years or more at university versus Grunnskole (lower secondary school)) is still above 0.70 SDs. This is well above the threshold for a notable distance and indicates that Axis 2 is notably related to education.
Moreover, as is clearly evident in Figure 6, the occupational class differences are primarily related to Axis 2. The upper- and upper-middle-class categories are located in the upper region of the space, whereas the lower-middle and the working-class categories are located in the lower region. The distance between the category points most drawn to each pole (cultural upper-middle class versus primary sector) is clear: 0.9 SDs. This means that the principal class divisions in our food space run between the healthy and the not-so-healthy. 10 Moreover, as we may remember, the orientation towards healthy foodstuffs is combined with an orientation towards rare items once staples of traditional Norwegian husmannskost. This upper-class combination of foodstuffs is indicative of a playful mode of food appropriation that is typically oriented towards ‘authentic’ gastronomic experiences (Johnston and Baumann, 2014), or what Bourdieu (1984: 177–183) has referred to as a ‘taste of freedom’. Similar to the way in which upper-class consumers typically combine legitimate cultural products (e.g. canonised literary works) with ‘vulgar’ and as yet uncanonised cultural products (e.g. comics or whodunits), our analysis reveals a playful combining of foodstuffs legitimised as ‘healthy’ by governmental institutions on the one hand, and, on the other, traditional Norwegian peasant foodstuffs that until recently were not associated with upper- and middle-class consumers (Øygard, 2000). Against the backdrop of globalised food trends celebrating ‘the exoticness’ of ethnically diverse cuisines, a reappropriation of traditional Norwegian husmannskost can be seen as a logical next step for contemporary cutting-edge ‘foodies’ and ‘gourmets’ hailing from upper- and middle-class positions.
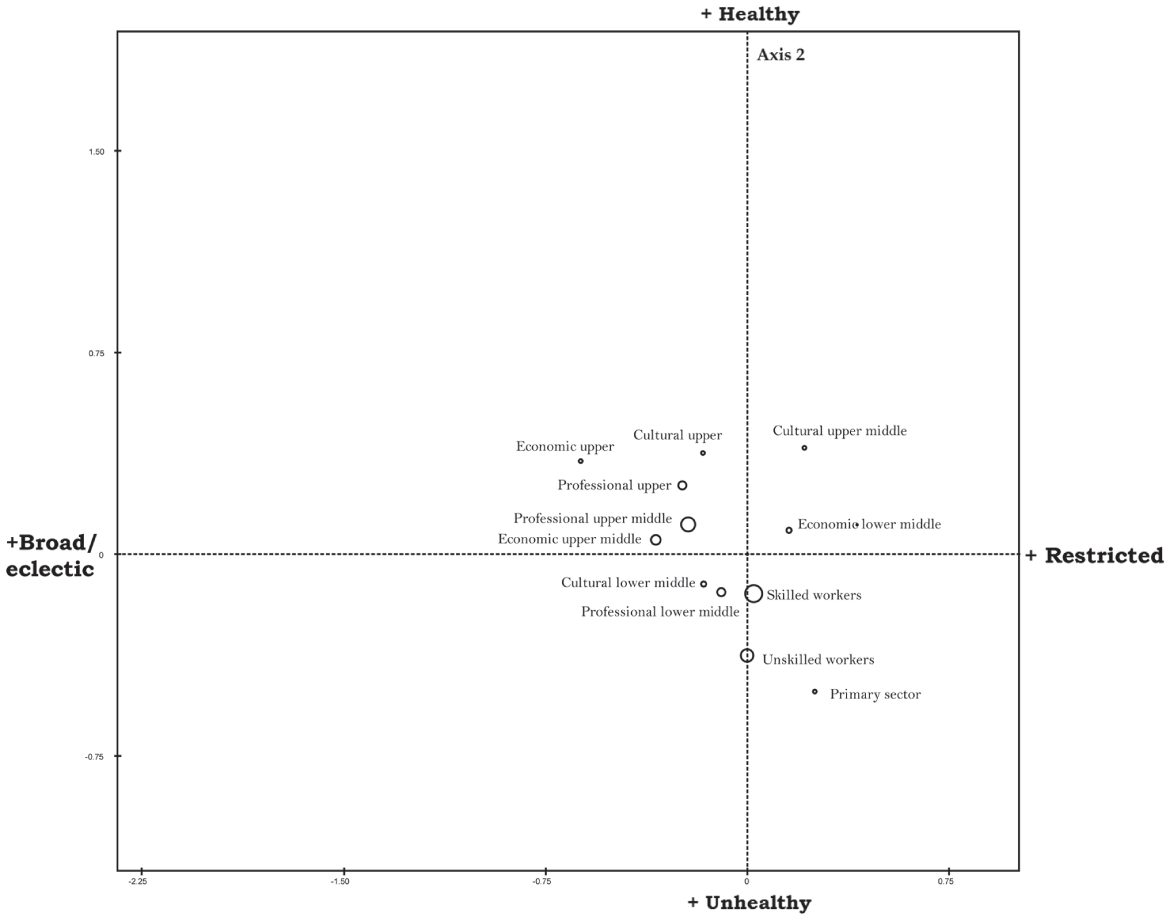
Occupational class categories, factorial plane 1–2.
Finally, Axis 3 (which separates two different types of unhealthy taste) is associated with household size. Figure 7 clearly depicts a division between one- and two-person households oriented towards the relatively high consumption of intoxicants on the one hand, and, on the other, multi-person households more oriented towards foodstuffs with high fat and sugar content. The distance between one-person households and five-person households is above 1.0 SDs and thus shows a strong division.
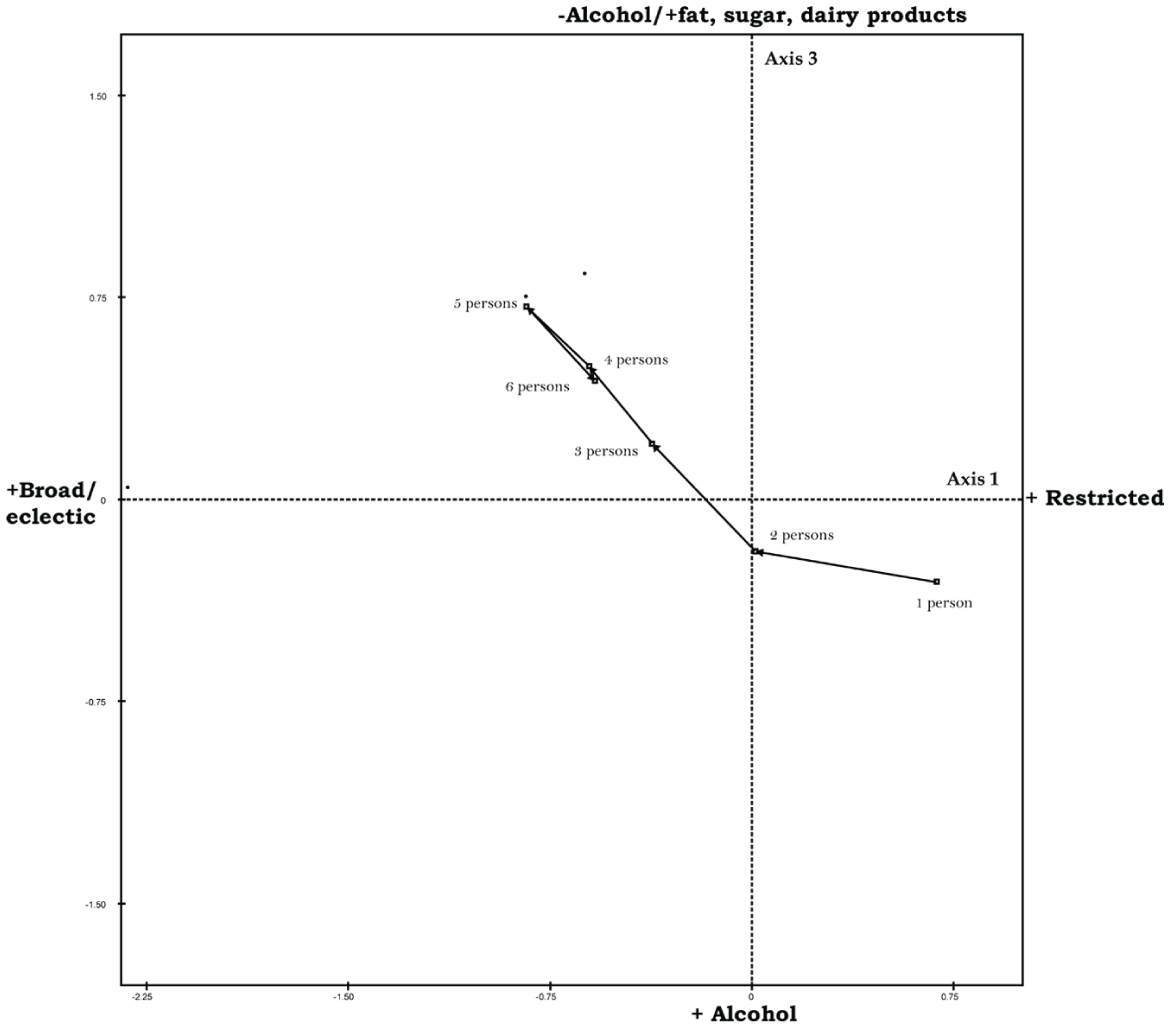
Household size, factorial plane 1–3.
Concluding Discussion
Our contribution adds to the growing body of literature documenting systematic taste differences between social classes (e.g. Bennett et al., 2009; Le Roux et al., 2008; Savage et al., 2015). The divisions in one’s tastes for food and beverages are clearly connected to social class divisions: upper- and upper-middle-class households endowed with large amounts of economic and cultural capital consume healthily and eclectically, whereas the opposite is true of the lowest regions of the class structure. In other words, we find classed tastes for food and beverages – an important aspect of broader class cultures. Finding class differences where they are arguably less likely to be found – in relative expenditure, in an egalitarian, affluent, social-democratic welfare state – indicates that the cultural force of social class divisions is much more entrenched than has often been assumed.
However, class-taste hierarchies are not static. Insofar as the upper classes are oriented towards the rare and unusual, it seems logical that the foodstuffs consumed by them will change over time. Indeed, if French haute cuisine and other forms of legitimate cuisines are increasingly consumed by a larger segment of the population, the badge of rarity for the upper classes will be lost. As shown in recent studies, however, culinary distinction is increasingly asserted by the consumption of new and ‘alternative’ foodstuffs (Paddock, 2015), as well as by knowledgeable and playful ways of appreciating foodstuffs previously shunned by the upper classes – particularly ethnically diverse cuisines now considered ‘authentic’ and ‘exotic’ (Johnston and Baumann, 2014). As suggested by Prieur and Savage (2013), ‘cosmopolitan’ ways of life increasingly function as an embodied form of cultural capital in the upper classes.
Our analysis adds an interesting insight into this playful and eclectic mode of asserting culinary distinction. Although the upper and middle classes undoubtedly still indulge in the cosmopolitan ‘eating of the Other’ – appreciating ‘exotic’ and ‘authentic’ foodstuffs and dishes originating from the ethnic and cultural Other (Hage, 1997; hooks, 1992; Johnston and Baumann, 2014) – we have revealed a distinct orientation towards foodstuffs once part of Norwegian husmannskost: traditional, locally produced peasant food. While local food traditions may be more relevant in Norway than in other European countries, this orientation nevertheless seems to be a fairly recent phenomenon among the upper classes. Using data from the 1990s, Øygard (2000) found that traditional Norwegian food was not a distinctive part of the upper-class diet. Our findings, however, suggest that new forms of culinary distinction are not only asserted by embracing the cosmopolitan (i.e. ethnically diverse and ‘exotic’ foodstuffs), but that even the traditional peasant food of pre-capitalist Norway can be refashioned as a badge of distinction in the 21st century. When the traditional is reappropriated by the upper classes, and assembled with foreign foodstuffs and dishes, the very meaning of ‘the traditional’ is removed from its original social context – and thus conveys new meanings. The upper-class consumption of items like swede, flatbread and gamalost in contemporary Norwegian society is sociologically different from the peasant consumption of the same items a century, or even decades, ago.
A class-structured divide between the cosmopolitan/unconventional/global and the national/traditional/local should in other words not be overstated. Our findings highlight the need to distinguish analytically between the relational social structuring of taste, and the particular foodstuffs implied in these relations. In order to remain a gourmet of distinction, one must be the first to embrace new and rare foodstuffs and dishes when they are introduced to the market, and one must swiftly abandon products that are about to trickle down to the undistinguished. To grasp this sociologically crucial dynamic in taste differentiation, one must avoid the analytical reification involved in regarding particular foodstuffs as intrinsically distinguished or undistinguished. The social meaning of food and beverages is continuously renegotiated, so that the social distinctiveness of particular objects needs to be explored inductively, and should not be decided by the researcher in a priori classifications of objects. Our analysis thus casts further doubt on the methodology implied by much research into ‘cultural omnivorousness’, which is very often based on pre-constructed notions of ‘highbrow’ and ‘lowbrow’ culture, combined with very crude measures of preferences and tastes. It also highlights the value of using MCA to map the connections between taste divisions and social divisions, as the structure of taste divisions is mapped inductively from the data.
Our results also point to stability in the classed divide between healthy and not-so-healthy tastes, a pattern that is frequently demonstrated across contexts. Upper- and middle-class households appear to be finely attuned to official nutritional guidelines provided by the WHO (2002) and other agencies, whereas working-class respondents seem to systematically disobey them. Although this apparent refusal to obey official nutritional guidelines may certainly be interpreted as a kind of autonomy and perhaps even as a countercultural attitude by the working class (Maguire, 2016), evidence suggests that there are several unintended consequences linked to this. As shown elsewhere in a study based on qualitative interviews, upper- and middle-class interviewees clearly distance themselves from the ‘unhealthy’ and ‘vulgar’ food and drink preferences of the working classes (Jarness, 2013). A combination of aesthetic and moral judgements is assembled against working-class people, expressing clear symbolic boundaries between the classes. Thus, practising lifestyles considered to be unhealthy and vulgar can lead to exclusion from the symbolic community of upper- and middle-class culture. Certain types of diets and eating habits involve some heavy symbolic baggage, in addition to the obvious physiological effects.
Footnotes
Funding
This research received no specific grant from any funding agency in the public, commercial or not-for-profit sectors.
Notes
References
Supplementary Material
Please find the following supplemental material available below.
For Open Access articles published under a Creative Commons License, all supplemental material carries the same license as the article it is associated with.
For non-Open Access articles published, all supplemental material carries a non-exclusive license, and permission requests for re-use of supplemental material or any part of supplemental material shall be sent directly to the copyright owner as specified in the copyright notice associated with the article.
