



Abstract
Occupations traditionally played a central role in stratification accounts. In the wake of the Great Recession, debates regarding the extent and nature of occupational stratification have been reinvigorated. An exploration of occupational wage stratification patterns defined by both detailed occupational unit groups and the broader occupational class categories of the National Statistics Socio-Economic Classification (NS-SEC) reveals the proportion of wage inequality between occupations and occupational classes has remained broadly stable 1997 to 2015. No compelling evidence is found for growing wage inequalities between detailed occupations within NS-SEC categories. This article underlines the continued utility of occupations and particularly the NS-SEC grouping of them in describing the structure of stratification in contemporary Britain.
Introduction
Occupations have long been central to sociological accounts of stratification. Occupations have provided the main unit for operationalising stratification systems through socio-economic status indices, prestige scales, micro-classes, and in more aggregated form, occupational class schemas (Grusky and Ku, 2008: 7). With respect to earnings, empirical research has demonstrated that the surge in wage inequality in the 1980s to 1990s in Britain and the United States can largely be accounted for by growing wage inequalities between occupations as opposed to growing inequalities within them (Mouw and Kalleberg, 2010; Williams, 2013) supporting the general notion that occupations provide the main bedrock to the stratification system. While these trends largely validated the theoretical primacy afforded to occupations as a stratifying force over the last few decades (Liu and Grusky, 2013), research has yet to investigate whether this still applies to the current – and quite possibly new – era following the Great Recession of 2007/2008 (Weeden and Grusky, 2014).
In the wake of the Great Recession, there has been a renewed interest among sociologists in identifying the possibly new or emerging structure to inequality. In Britain in particular, this has centred on debates regarding the shape of the ‘class’ structure. For instance, a recent influential contribution in the pages of this journal has critiqued what is argued are narrowly focused occupational approaches to stratification by taking into account considerations beyond the labour market such as wealth, social capital and cultural tastes in classifying individuals to meaningful groups (‘social classes’) (Savage et al., 2013). One motivation for shifting attention away from occupations is the view that ‘income variation within occupations is growing and that if economic measures of inequality are to be kept within the purview of class analysis we need to go beyond measures of occupational class alone’ (Savage et al., 2013: 222). Such critiques on the significance of supposedly growing inequality within occupations effectively reinvigorate older debates about the stratification structure being better understood in terms of categories of personal endowments (or ‘capitals’) than occupations (Sørensen, 1996, 2000).
A related line of critique concerns how occupations are aggregated to broader categories, or ‘classes’. In the British context, the practice of aggregating detailed occupations to classes was standardised by the Office for National Statistics (ONS) with their National Socio-Economic Classification (NS-SEC) (Rose and Pevalin, 2003, 2005) with its theoretical foundations rooted in the Goldthorpe model of class (Goldthorpe, 2007). This second line of critique purports such schemas do not adequately address the possible fragmentation in the stratification structure. This line of critique attempts to identify certain exceptional occupations which might be obscured in traditional class schemas (Savage, 2015), such as elite occupations (Friedman et al., 2015) or a precarious group of particularly disadvantaged occupations (Savage et al., 2013). Such critiques on the coarseness of ‘big classes’ effectively reinvigorate another line of older debates about ‘disaggregated structuration’ or ‘micro-classes’ over ‘big classes’ (Grusky, 2005; Grusky and Sørensen, 1998; Grusky and Weeden, 2001).
While the structure of occupational stratification prior to the 2000s is well established, it is not yet clear whether the occupational basis to the stratification structure in Britain has indeed been weakening, or, if an occupational focus is to be maintained, whether traditional ways of grouping detailed occupations to ‘big classes’ obscure the (possibly changing) structure of stratification more than they reveal. Given the centrality of occupations in traditional stratification accounts – and the historically strong occupational basis to wage inequalities in Britain – an in-depth and up-to-date examination of the period leading up to and after the Great Recession is clearly warranted. Using the Annual Survey of Hours and Earnings (ASHE) 1997 to 2015 – considered the most authoritative source of British wage data – this article explores two main aspects of recent wage stratification patterns from an occupational perspective. First, this article establishes whether trends in within-class and within-occupation inequality since 1997 have been growing, falling or have remained stable. Second, this article then empirically assesses arguments relating to the possible fragmentation in occupational inequalities within ‘big classes’ as defined by the NS-SEC schema to establish whether the NS-SEC schema still represents meaningful broad grouping of occupations for understanding the structure of contemporary stratification. This article concludes that, on the whole, occupations continued to structure wage stratification in 2015 as well as they did in 1997. No compelling evidence is found for growing wage inequalities between detailed occupations within NS-SEC categories – the NS-SEC schema continues to do a reasonable job in describing the structure of occupational wage stratification. This article underlines the continued utility of occupations and particularly the NS-SEC grouping of them in understanding the structure of stratification in contemporary Britain.
Occupational Stratification, 1970s to 2000s
Occupations are often considered central to traditional stratification accounts for two main reasons (Grusky and Ku, 2008: 7). First, occupations are supposed to describe the structure of stratification. Traditional approaches to stratification rely on occupations to provide the basis for socio-economic status indices, prestige scales, micro-classes and occupational class schemas. Indeed, occupations have been consistently found to be a strong predictor of an assortment of labour market outcomes including earnings, underemployment probability and job quality, net of human capital, demographic and other compositional characteristics (Gallie, 2013; McGovern et al., 2007; Warren, 2015) – justifying this view. Second, occupations are supposed to proxy for sources of labour market stratification that often cannot be readily measured in social surveys (Lambert and Bihagen, 2014; Williams, 2017). The exact mechanisms as to how and why occupations are a major source of such economic inequalities are quite varied – and not without controversy – ranging from broad occupational groupings representing bundles of employment relations in case of the influential Goldthorpe model of occupational class, to occupations representing skill requirements and productivity differences, to micro-classes representing relatively coherent rent-seeking institutions (Goldthorpe, 2007; Liu and Grusky, 2013; Tåhlin, 2007; Weeden and Grusky, 2005). Nonetheless, for each of these lines of explanation, the underlying unit of analysis is the same, occupations. Previous research has indeed found broad support for the mechanisms explaining occupational inequalities in terms of broad types of employment relations in the case of ‘big classes’, or differential ‘prices’ to specific skills and micro-level ‘closure’ mechanisms that limit labour supply in the case of more detailed occupational distinctions (Liu and Grusky, 2013; Weeden, 2002; Williams, 2017).
In terms of trends in wage inequality over time, strong evidence has been found for the occupational narrative to what has been termed the ‘Great Takeoff’ in inequality during the 1980s and 1990s – a period when labour market inequality grew quite starkly in many countries (Weeden and Grusky, 2014). In Britain at least, the substantial real wage growth in the early 1980s and 1990s was extremely stratified by occupations (Williams, 2013), whereas evidence for the United States is slightly less conclusive (Kim and Sakamoto, 2008; cf. Mouw and Kalleberg, 2010). In Britain, the relative wage growth of higher professional and managerial occupations outstripped those of intermediate and working class occupations to such an extent that this trend alone explained more than half of the doubling of overall wage inequality from the late 1970s to the 1990s (Williams, 2013). Growing inequality within occupations – although increasing over this period – was found to be least important (Goos and Manning, 2007; Williams, 2013). Furthermore, growing between-occupation inequality during the ‘Great Takeoff’ could more or less be described as growing between-class inequality such that taking into consideration detailed occupational distinctions within NS-SEC categories added substantively little extra in explaining changes in the overall variance in wages (Williams, 2013). Overall, previous research prior to the 2000s strongly supported the occupational basis to not only cross-sectional wage inequality in Britain, but also trends in growing wage inequality, whether defined in terms of detailed occupational units or broader occupational classes in the form of NS-SEC categories.
Occupational Stratification in More Recent Times
While the ‘Great Takeoff’ in inequality during the 1980s and 1990s has been well studied in Britain and elsewhere, it is not yet clear how occupations relate to the structure of inequality in this quite possibly new era of stratification in the run-up to and wake of the Great Recession. While the 1980s and 1990s were characterised by substantial shifts in the occupational structure and growing wage inequality (Goos and Manning, 2007), in the period following the Great Recession, economic growth stalled while wage growth is now at its lowest point since the 1920s (Van Reenen, 2016). These trends have been particularly severe in Britain in particular. Out of the OECD countries, Britain stands in a group of countries with the likes of Greece and the Czech Republic with respect to wage growth since 2007/2008 (OECD, 2016). Research by economists reveals that overall wage inequality actually fell slightly after 2007/2008 in Britain, partly as a result of differential stagnation in real wage growth (Gregg et al., 2014). It is not yet clear what the implications of this new socio-economic landscape are for the structure of occupational stratification in Britain.
Coinciding with the Great Recession and subsequent stagnation, there has been a renewed interest in understanding the structure of stratification within sociology. In particular, there has been an effective reinvigoration of longer-standing critiques about the continued role of occupations and occupational class in describing the structure to inequalities. These recent critiques have taken two broad forms. First, one line of critique has questioned the emphasis placed on occupations as the basis to contemporary stratification. This critique focuses on underappreciated personal endowments such as social or cultural capital in creating and maintaining social and economic divisions. The group of researchers in Britain conducting the Great British Class Survey (GBCS) defined seven new classes building upon Bourdieu’s social, cultural and economic capitals (Savage et al., 2013). The basic argument is that the traditional ‘occupationally based class schema does not effectively capture the role of social and cultural processes in generating class divisions’ (Savage et al., 2013: abstract). The implication for specifically economic inequalities is that ‘income variation within occupations is growing and that if economic measures of inequality are to be kept within the purview of class analysis we need to go beyond measures of occupational class alone’ (Savage et al., 2013: 222). Or to put it another way, given that inequality is supposedly growing within occupations and occupational classes, other underappreciated social and cultural factors now provide the basis to stratification in contemporary Britain. Given many commentators argue we now find ourselves in a new and long era of stagnation, this provides further impetus to clarify whether the traditional theoretical basis and tools of occupational approaches to stratification still apply.
A similar longer-standing debate within sociology has existed dating back to at least the ‘death of class’ thesis, which the above work effectively reinvigorates. Aage Sørensen (1996, 2000), for instance, two decades ago suggested that there has been widespread destruction in occupation-based ‘rents’, what he termed ‘structural locations’ such that stratification would increasingly be structured by individual characteristics and circumstances. Similar to critique by the GBCS researchers, according to Sørensen (2000: 1552), ‘consistent with the idea of a stronger link between wages and personal endowments, we also observe a marked increase in within-occupation inequality’. Overall, critiques on supposedly growing within-occupation inequality imply the structure of stratification would be better understood in terms of categories of personal endowments and not occupations, as the Great British Class Survey researchers effectively did by classifying respondents based upon their personal qualities and tastes (‘capitals’) (Savage et al., 2013).
Second, another and related line of critique broadly accepts some occupational basis to stratification but effectively reinvigorates another longer-standing debate about the significance of inequality between detailed occupations within ‘big classes’ (i.e. sub-class occupational distinctions known as ‘micro-classes’) for understanding stratification. The influential Goldthorpe model of class upon which the NS-SEC is based makes a threefold distinction between a ‘service class’ composed of managerial and professional occupations, a ‘labour contract’ category composed of semi-routine and routine occupations, and ‘intermediate’ categories in between – based upon broad differences in underlying employment relations (see Table 1). The NS-SEC schema is an operationalisation of the Goldthorpe model and aggregates detailed occupations to six groups based on their presumed employment relations (Rose and Pevalin, 2003, 2005). Savage et al. (2013: 222–223) contend that in differentiating the middle class, the NS-SEC schema fails ‘for giving a too homogenous description of the salaried middle class and for overdoing the manual/non-manual divide when separating between male production workers and routine sales and service occupations’. Their reformulation of the British class structure with the GBCS ‘reveals the polarisation of social inequality (in the form of an elite and a precariat), and the fragmentation of traditional sociological middle and working-class divisions into more segmented forms’ (Savage et al., 2013: 245–246). The intellectual origins of the Goldthorpe model and NS-SEC were first developed in the post-war period, although updated over time, and are essentially based on similar sorts of somewhat purportedly outdated distinctions – which may be too broad brush in any case to adequately capture stratification as well as they once did, particularly at the extremes (Savage, 2015).
The NS-SEC schema.
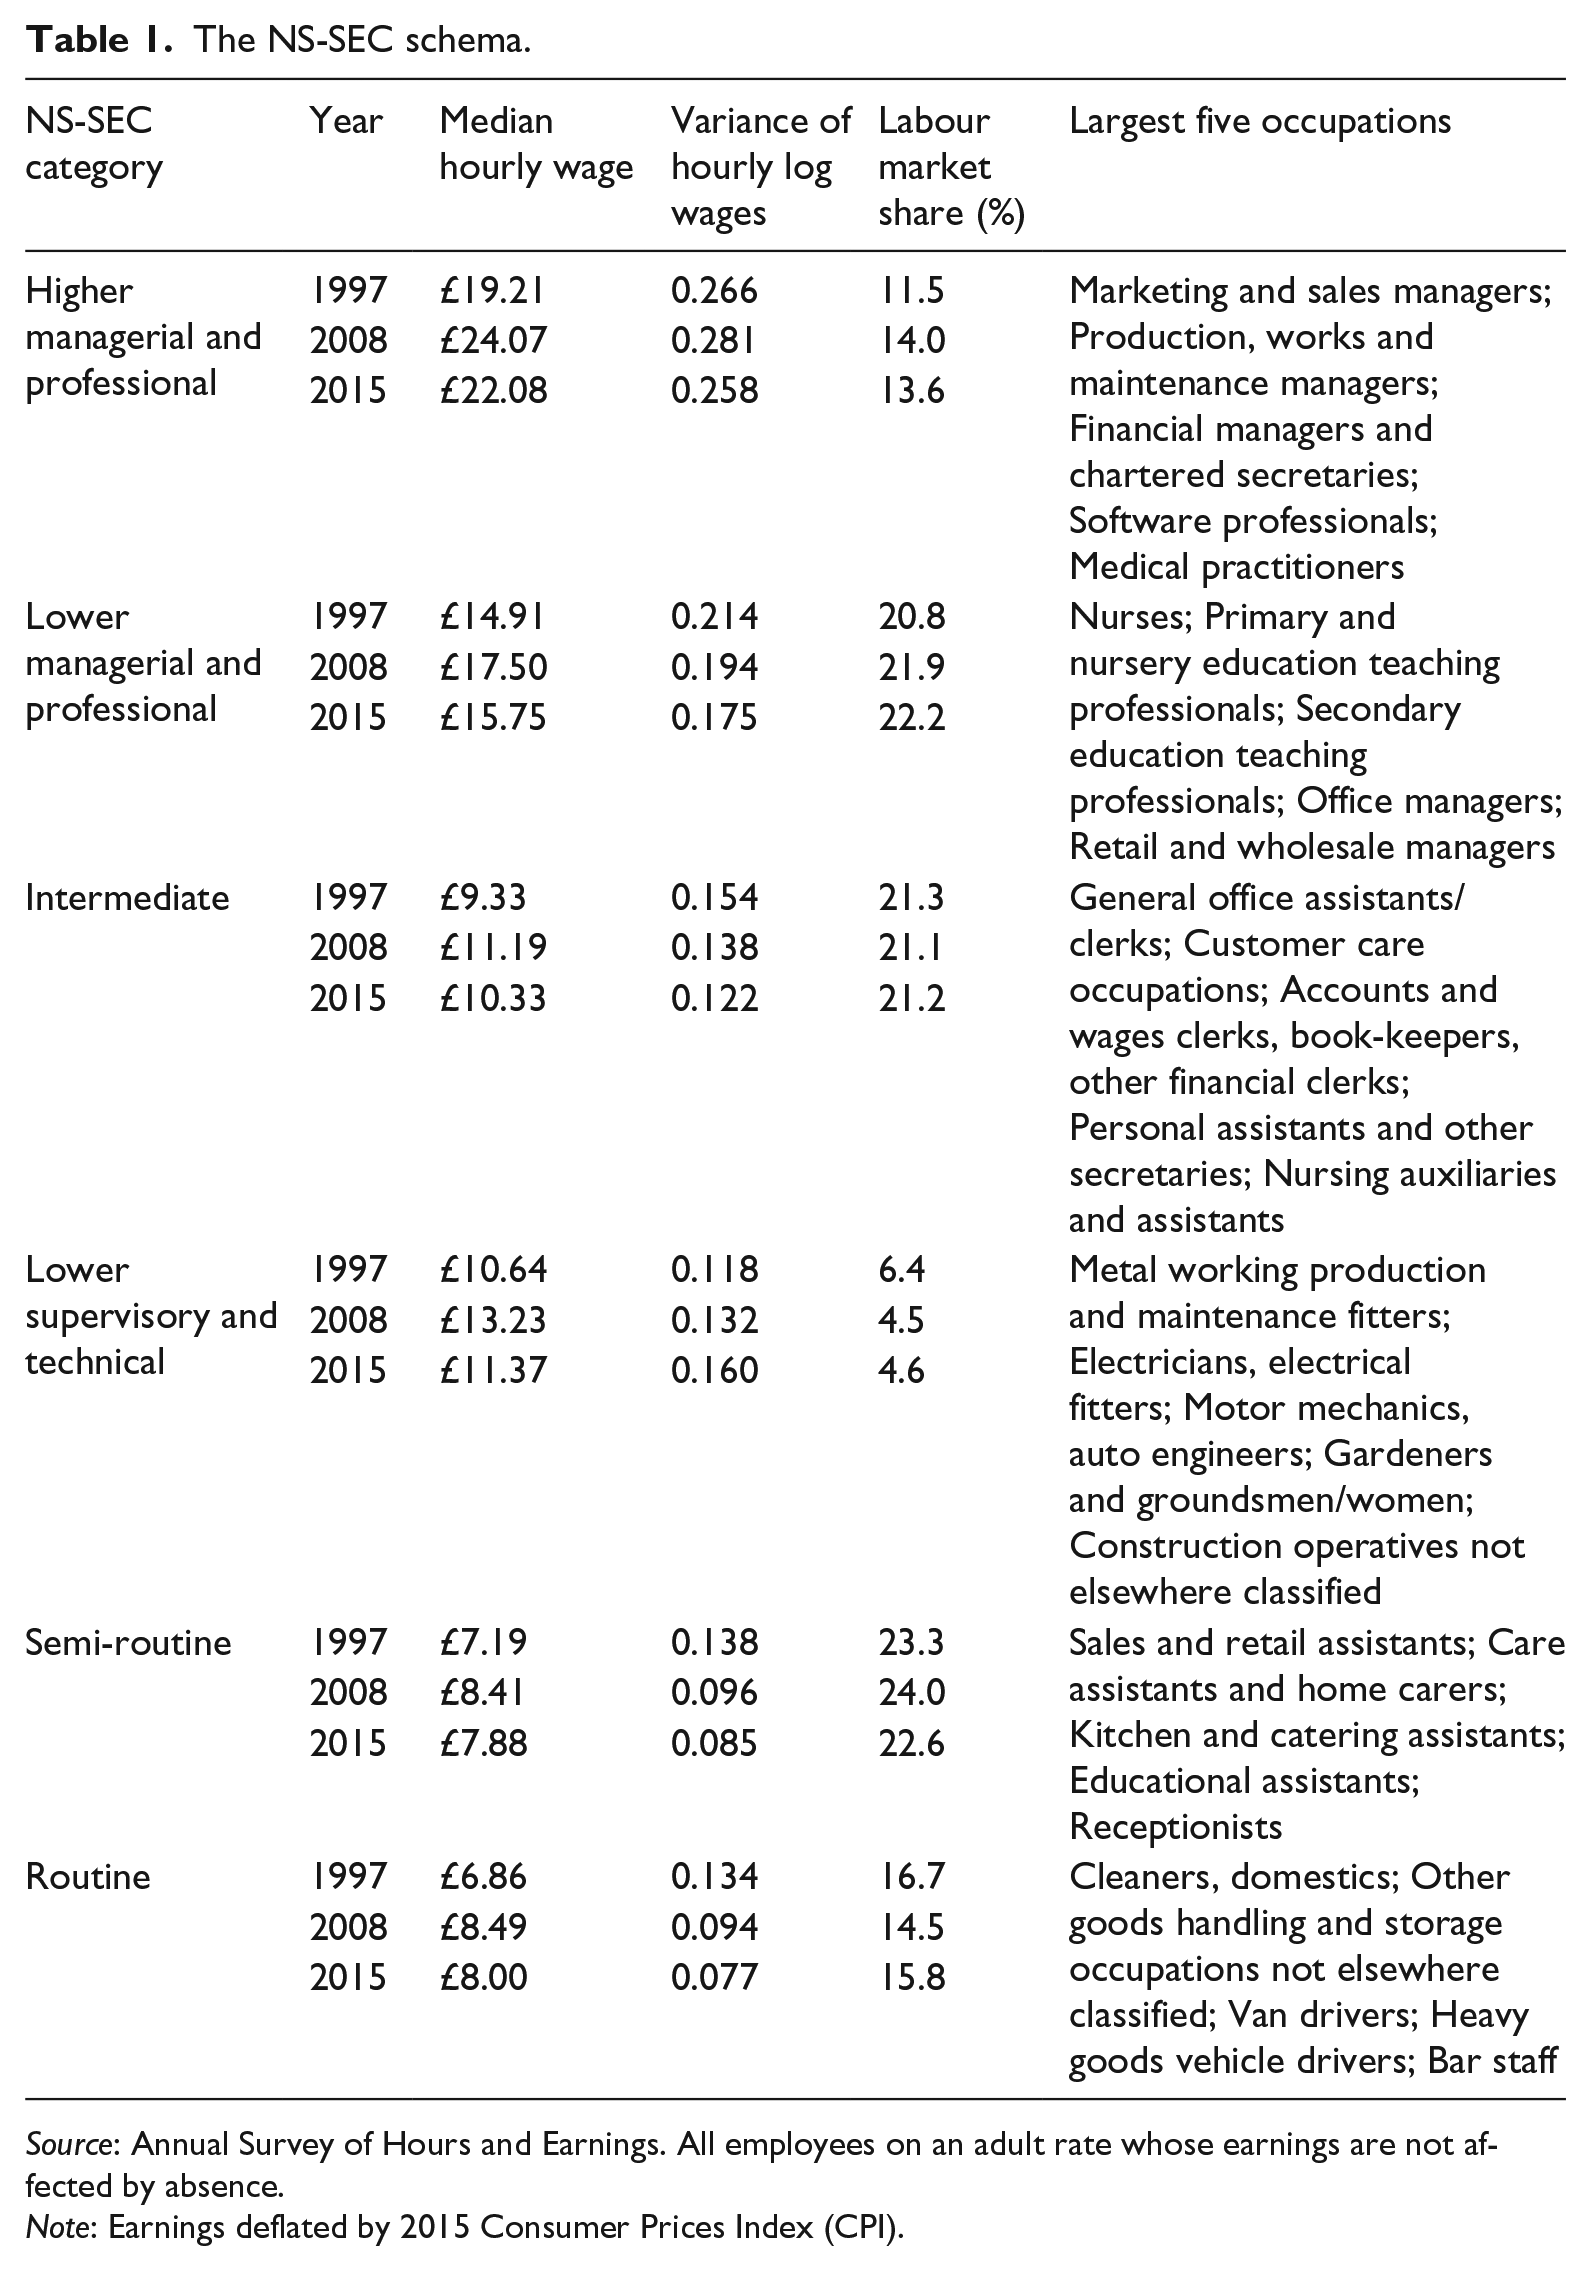
Source: Annual Survey of Hours and Earnings. All employees on an adult rate whose earnings are not affected by absence.
Note: Earnings deflated by 2015 Consumer Prices Index (CPI).
This second line of critique effectively reinvigorates what is sometimes known as the ‘disaggregate structuration’ perspective to occupational stratification which posits that occupations are deeply institutionalised rent-seeking units based upon fairly homogenous groups of people, with similar socio-economic characteristics, performing similar kinds of work, with coherent collective identities, and provide the basis for closure, exploitation and collective action (Grusky, 2005; Grusky and Sørensen, 1998). Crucially, it conjectures that occupational stratification processes occur at the micro-class or detailed occupational-level. The implication is big class categories are inadequate for capturing economic inequalities, but the occupations composing them are still important (Grusky and Weeden, 2001). By aggregating detailed occupations to a few big groups, schemas such as NS-SEC miss out on important influential or outlying micro-classes which may emerge over time: in particular, polarisation at the extremes between elite occupations (Friedman et al., 2015) and precarious ones in the possibly fragmenting middle strata (Savage et al., 2013). Furthermore, given the unprecedented stagnation in recent years, such fragmentation may have plausibly intensified.
The empirical analysis which follows explores recent patterns in the structure of occupational wage stratification in Britain with these two theoretical critiques in mind. With respect to the first critique, we would expect the proportion of the variance in wages within occupations to be increasing – whether defined in terms of detailed occupations or aggregated NS-SEC categories. With respect to the second claim that stratification within big classes might be fragmenting, we would expect that not only will the variance in wages within big classes be increasing, but also increasing inequality between occupations within big classes as evidence of elite occupations pulling away, or evidence of sinking precarious occupations – within their parent classes. More formally, the implications of this second critique are that variance in wages between occupations within big classes should be increasing. The two key questions informing the analysis which follows are:
Are wage inequalities within classes increasing?
Are wage inequalities between occupations within classes increasing?
Data and Analytical Strategy
The Annual Survey of Hours and Earnings
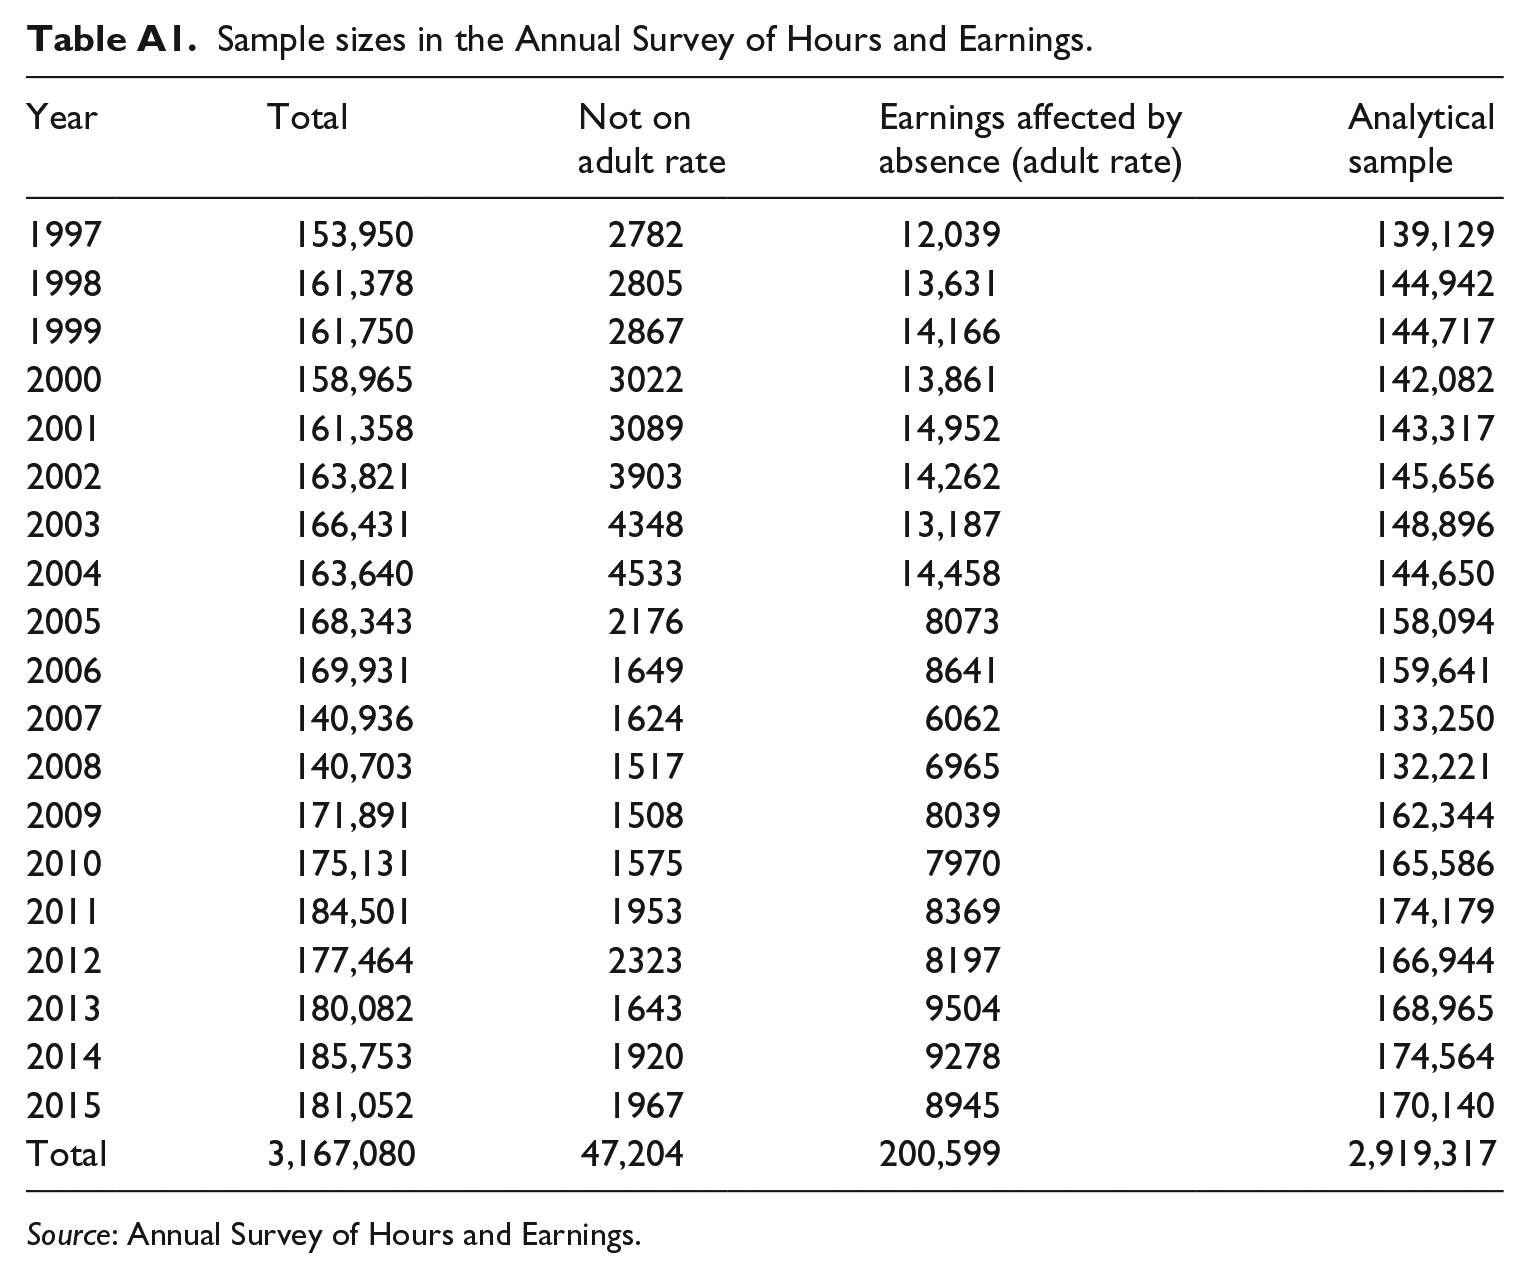
This article uses data from the Annual Survey of Hours and Earnings (ASHE) (ONS, 2016a). ASHE is one of the largest and most authoritative earnings datasets in Britain. It is based on a roughly 1 per cent sample of the British labour force drawn from HM Revenue and Customs (HMRC) Pay As You Earn (PAYE) records. Sampled employees are then matched with ONS’ Inter-Departmental Business Register to obtain contact information of their employers, who fill out the survey. Selected employers must fill out the survey by law, as it is covered by the Statistics Trade Act. Consequently, response rates are high and item non-response is low. Given it is an employer survey based on information from employer records, earnings and occupation are likely measured with less error than conventional employee or household surveys. Another advantage of ASHE is that sample sizes are very large (see Table A1 in the Appendix) and enables an unusually fine-grained focus on occupations at the most detailed level (unit groups). As a result, ASHE is the official data source used by several UK government agencies such as the Low Pay Commission in estimating the proportion of workers paid below the minimum wage and the Migration Advisory Committee in determining their list of ‘shortage occupations’.
In what follows, for the most part earnings are defined as the logarithm of real hourly wage rates, calculated by dividing basic earnings in the survey reference period by usual hours (excluding overtime hours, overtime payments/premia, bonuses and ‘other’ earnings) deflated by the 2015 CPI. The logarithm is taken in order to adjust for the positive skew in the wage distribution. Throughout this article, occupations are defined in terms of four-digit SOC 2000 unit groups (356 occupations). ‘Big classes’ are defined by aggregating detailed occupation codes to the NS-SEC classification which defines six categories based on the nature of work and resulting underlying employment relations (Rose and Pevalin, 2003, 2005). Employees not on the adult rate and those whose earnings were affected by absence during the survey reference period are excluded (about 7.8% of the sample, see Table A1). The NS-SEC categories and descriptive statistics of them for the final analytic sample are reported in Table 1.
Analytical Strategy
The analysis is divided into three parts. First, descriptive patterns in the overall wage structure and occupational wages since 1997 are established to set the scene. Once trends in stratification have been established, the second step calculates the proportion of variance in log wages (a measure of overall wage inequality) 1997 to 2015 that is between occupations to establish whether within-class and within-occupation inequality has been growing as is often claimed. To be sure, it defines occupations in three different ways: SOC 2000 unit groups (356 categories); ‘micro-classes’ (26 detailed NS-SEC categories); and NS-SEC groups (six categories). In the third and final step, a simple variance decomposition is employed to apportion proportions in overall wage inequality between detailed occupations within big classes to further interrogate trends in within-class inequality. Specifically, the purpose of this latter exercise is to ascertain whether there has been a ‘fragmenting’ in the structure of wage inequalities between occupations within classes and the extent to which trends in within-class inequality vary across NS-SEC categories.
Results
Wage Growth and Wage Inequality Patterns
The analysis begins with an examination of descriptive patterns of average wages and wage inequality from 1997 to 2015 to understand how the overall structure of wage stratification has evolved in recent years. Figure 1 reports trends in real median hourly wages of all workers and median weekly earnings of full-time workers by gender. In the period 1997 to 2008, median real wages grew slowly (by historical standards) but steadily. Following the Great Recession in 2007/2008, real median wages began to steadily decline in real terms. By 2015, real median wages were at roughly similar levels as they were a decade prior, eliminating most of the wage growth accumulated from 1997 to 2008. Since these trends do not appear to differ across measures of weekly or hourly pay, or by gender, the rest of this article focuses on hourly pay for both genders combined to allow the inclusion of part-timers and for ease of presentation. 1
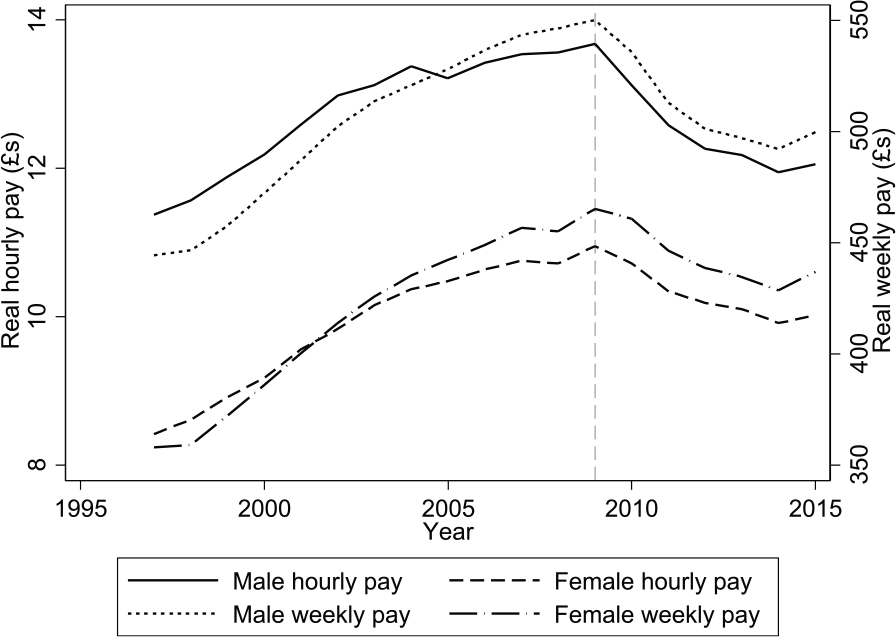
Median wages and earnings trends by gender.
Figure 2 reports wage inequality trends over the whole period, focusing on four separate indicators. There was a slight fall in ‘lower tail inequality’ (the differential between median earners and the bottom 10 per cent of earners, i.e. the P50–P10), while there was a more or less flat trend in ‘upper tail inequality’ (the differential between the top 10% and the median, i.e. the P90–P50). The net effect of both these trends was a very slight fall in ‘overall inequality’ across the whole period (the differential between the top 10% and bottom 10%, i.e. P90–P10) as the compression in wages at the lower tail outweighed the flat trend in wage dispersion at the upper tail. The variance of log wages (a composite inequality measure) displays identical trends to those of the P90–P10 differential. Given that the focus is on exploring how occupations relate to overall wage inequality, the rest of this article focuses on the variance in log wages as a measure of overall inequality (the relationship between occupations and shifts in the entire wage structure are examined in more detail in the Supplementary Appendix).
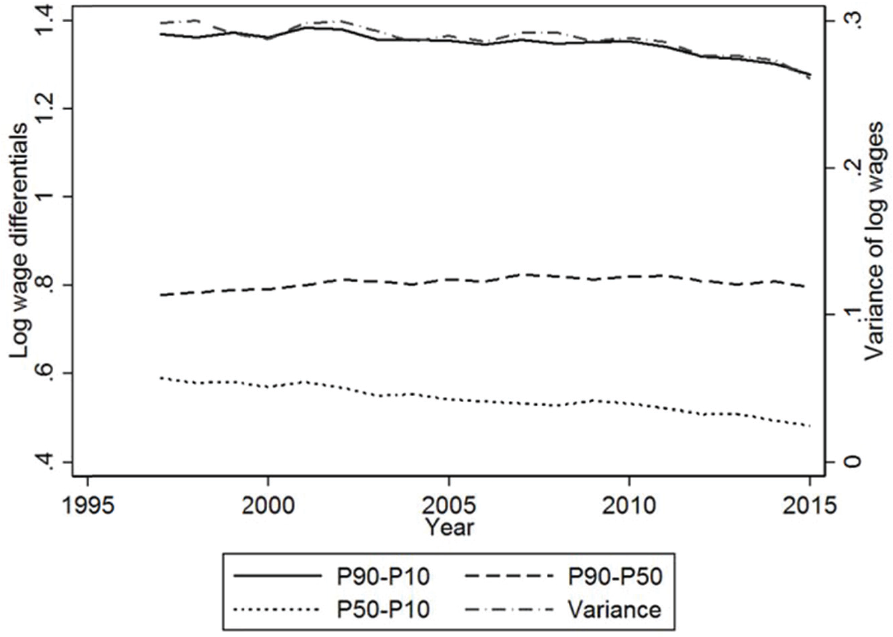
Wage inequality trends.
Although real median wages began to decline after the Great Recession (Figure 1), overall inequality patterns on the other hand show no obvious break or reversal. Indeed, there was very little change in inequality over the whole period, and if anything, overall inequality has fallen slightly – perhaps contrary to popular opinion. One caveat to be born in mind here, however, is that a key limitation of ASHE is that it is a survey of employees only. Coinciding with the Great Recession there has been a small growth in self-employment. This point is further elaborated upon in the concluding section. Having set out basic aggregate wage patterns between 1997 and 2015, the next section explores descriptive trends in the occupational wage structure over the same period. While aggregate trends in wage inequality may show little change, given arguments of growing inequality within occupations and classes, it is important to descriptively examine detailed trends in occupational wage stratification which may be masked in an aggregate analysis of wage inequality.
Patterns in the Occupational Wage Structure
Figure 3 charts trends in occupational wages over the period 1997 to 2015. Panels A and B show trends in occupational median wages by occupational median wage in the base year for the period 1997 to 2008 (Panel A) and 2008 to 2015 (Panel B). Examining Panel A first, many lower-paying semi-routine and routine occupations received larger wage gains relative to higher-paying managerial and professional occupations. This most likely reflects the introduction of the National Minimum Wage in 1998/1999 and subsequent above-inflation upratings which has also been demonstrated elsewhere (Butcher et al., 2012). In general, there was an equitable and positive real wage growth across all occupations from 1997 to 2008, as indicated by the relatively flat and above zero trend line in Panel A. By contrast, in the period 2008 to 2015 most occupations saw a fall in real wages, as shown by the trend line mostly falling below zero – reflecting trends in the overall median in Figure 1. Furthermore, and perhaps what is less well known is that the magnitude of falling wages was much greater for higher-paying managerial and professional occupations than lower-paying semi-routine and routine ones, as indicated by the downward sloping trend line. The main difference, then, between the pre- and post-Great Recession periods is that while wage growth for most occupations was positive in the run-up to the Great Recession, especially lower-paying ones, in the period following the Great Recession, occupational wage growth was close to zero for some occupations, and in fact negative for many, especially for many higher-paying managerial and professional occupations. Examining shifts in inequality within occupations in Panels C and D (the within-occupation P90–P10 differential), we find that in general more equal occupations became more equal prior to the Great Recession, and there was no significant trends in inequality within occupations after the Great Recession. These patterns in occupational wages are more or less reflected in patterns of the aggregate wage structure (see Supplementary Appendix). The implications of these descriptive patterns for the structure of occupational stratification are examined in more detail in the next section.
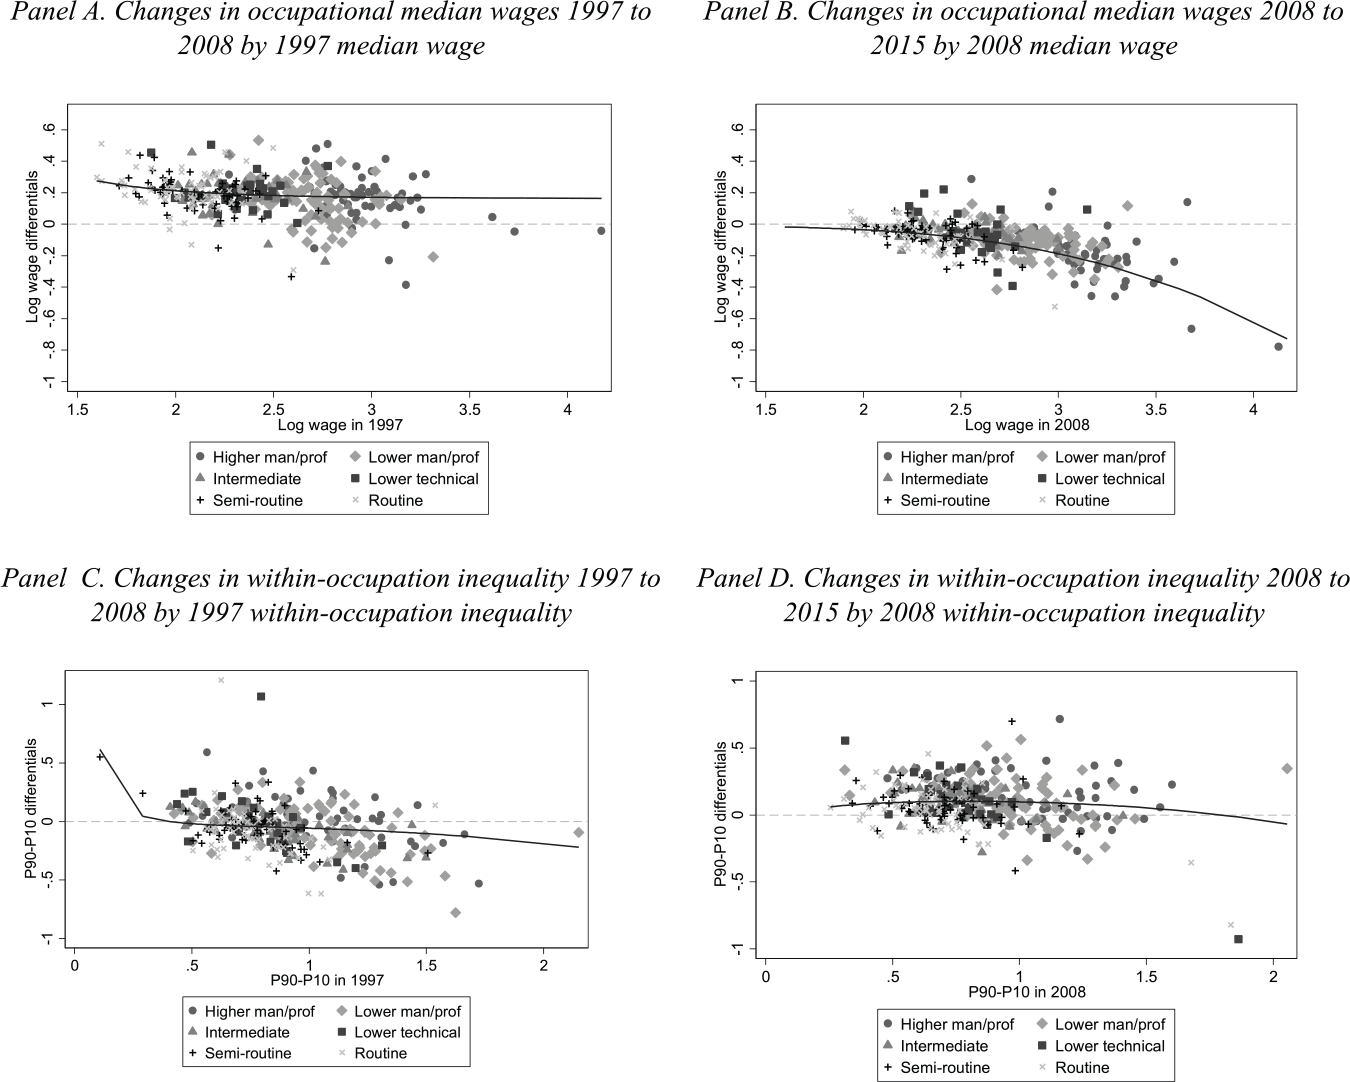
Changes in the occupational wage structure.
Is Inequality within Occupations and Occupational Classes Increasing?
To more formally examine how shifts in occupational wages relate to wage inequality, we next examine the proportion of variance in log wages between and within occupations over time, holding the overall variance (inequality) in wages constant. This is obtained by obtaining the proportion of variance explained (the R-squared) from regressions on each year of data for each of the three different ways of defining occupation: 356 detailed unit groups; 26 micro-classes; and six NS-SEC occupational categories. Figure 4 shows that the majority of the variance in wages was actually between occupations, even as overall inequality fell over the period (Figure 1). While it comes as no surprise that the more detailed the occupational distinctions the greater the variance ‘explained’, the standout feature of this graph is that they are rather trendless: inequalities in occupational wages seem to have been broadly maintained, irrespective of the level of detail. Overall, Figure 4 quite clearly demonstrates that occupations are not becoming less relevant in describing the structure of wage stratification, no matter whether occupations are defined in terms of detailed unit groups, micro-classes or NS-SEC categories. In sum, within-occupation inequality, however defined, has not been increasing.
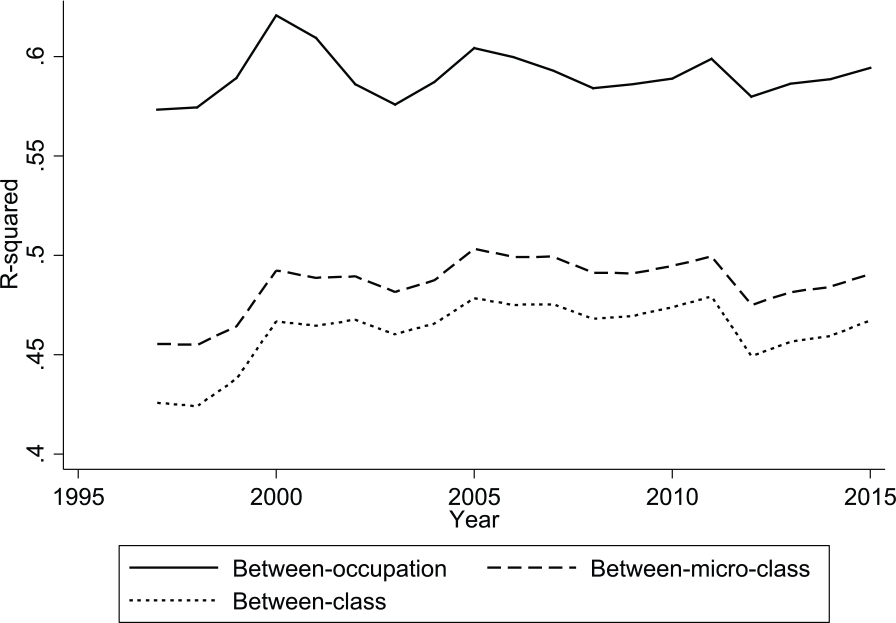
Proportion of variance in log wages between occupations and occupational classes.
The Changing Structure of Occupational Stratification?
While revealing, the analysis thus far has not addressed whether there has been important fragmentation between occupations within conventionally defined NS-SEC categories that may be obscured by the overall patterns presented in Figure 4. To address this issue, a simple variance decomposition is employed. While the variance is a composite measure of wage inequality, it has the advantage that it can be decomposed into within-group as well as between-group components which are central to understanding the structure of occupational inequalities. Furthermore, within-group components can be further decomposed into within- and between-group components of lower-level units to assess the implications of the fall in inequality into a component accounted for by inequality within NS-SEC categories between occupations within parent NS-SEC categories. This allows for an assessment as to whether there has been a fragmenting of ‘big class’ inequalities, in particular whether possible exceptional occupations may have particularly benefited or suffered over the period covered in this study.
The variance decomposition follows the approach by Weeden et al. (2007) whereby the overall variance in (log) wages is decomposed into a component that is between classes (BC), a component that is within classes but between occupations (WCBO) and a final component that is within occupations (WO). The amount of the variance within classes is the variance of the residuals obtained from an ordinary least squares (OLS) wage regression with NS-SEC categories as the only predictor, while the BC component is obtained by subtracting the WO component from the overall variance in log wages. The amount of the variance within occupations (WO) is the variance of the residuals obtained from an OLS wage regression with four-digit occupational categories as the only predictor. The WCBO component is obtained by subtracting the within classes (WC) component from the WO component. This calculation is performed on each year during the period 1997 to 2015. The results are plotted in Figure 5.
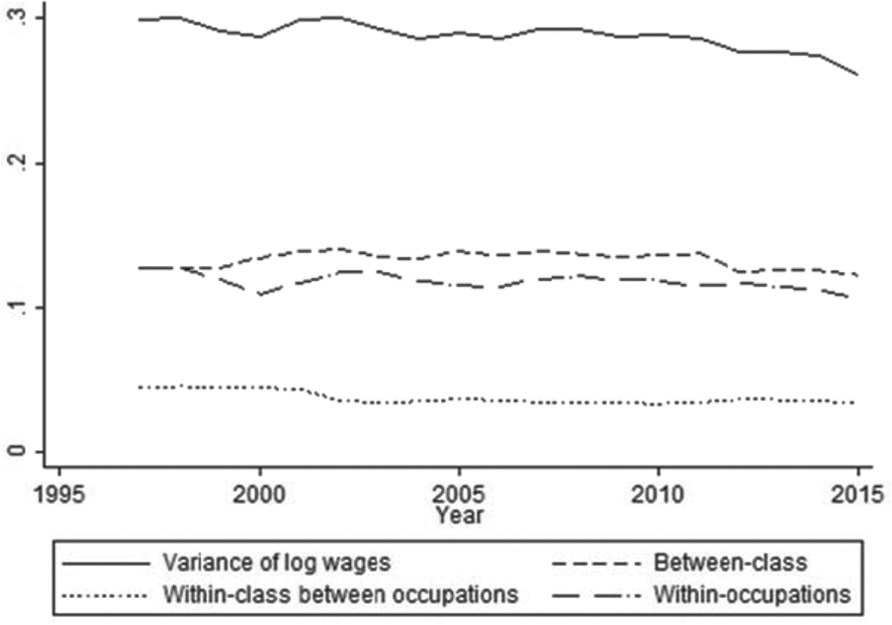
Between-class and within-class/between-occupation wage inequality.
What does falling wage inequality imply for cross-sectional big class inequalities? Figure 5 reveals that between-class inequality accounts for the largest share of wage inequality in every year examined. The proportion of variance within occupations appears to be next in importance. The proportion of overall wage inequality attributable to the variance within classes between occupations appears to be least important. Moreover, trends in this latter component were flat – and actually fell in proportionate terms as overall inequality fell. Overall, then, there seems to have been no real change in between-class inequalities, supporting the general finding in Figure 4 that occupational and class wage inequalities show no signs of weakening. Indeed, inequalities between big classes appear to be the most important of these factors in accounting for the overall variance. Importantly, Figure 5 reveals that adding in detailed occupational distinctions within big classes appears to add little extra to this story. In other words, the results reveal that occupational distinctions within classes are variations on a class theme. Analysis focusing on adding in distinctions between 26 micro-classes instead of 300+ four-digit occupations results in very similar findings (available on request). In other words, the vast majority of between-occupation wage inequality – which has shown no signs of declining – is inequality between NS-SEC categories.
Finally, the last part of the analysis decomposes within-class inequality trends further by examining each NS-SEC category separately since there could still be important differences within classes that are obscured in the analysis in Figure 5 which merely presents an aggregated summary with all classes lumped together. Figure 6 presents the results of an analysis decomposing within-class inequality (i.e. the variance of wages within NS-SEC categories) into components attributable to wage inequality within occupations and a component attributable to wage inequality between occupations within each ‘parent’ NS-SEC category. While within-class inequality is greater for the higher managerial and professional and lower managerial and professional classes than other classes, all classes but one (lower technical) show a general trend to broadly stable or falling within-class inequality. Moreover, detailed occupational distinctions within NS-SEC categories account for very little of the inequality within each of them, mirroring the more aggregated picture in Figure 5. Thus, most within-class inequality is actually attributable to inequality within the detailed occupations that compose classes and this has remained broadly stable. Importantly, the component attributable to inequality between occupations within classes appears to be falling. In summary, there appears to be a broad maintenance in big class inequalities and there is no evidence of a rise or fragmentation in inequalities between occupations within them. Overall, no compelling evidence is found for a fragmentation in class-based wage inequalities in contemporary Britain.
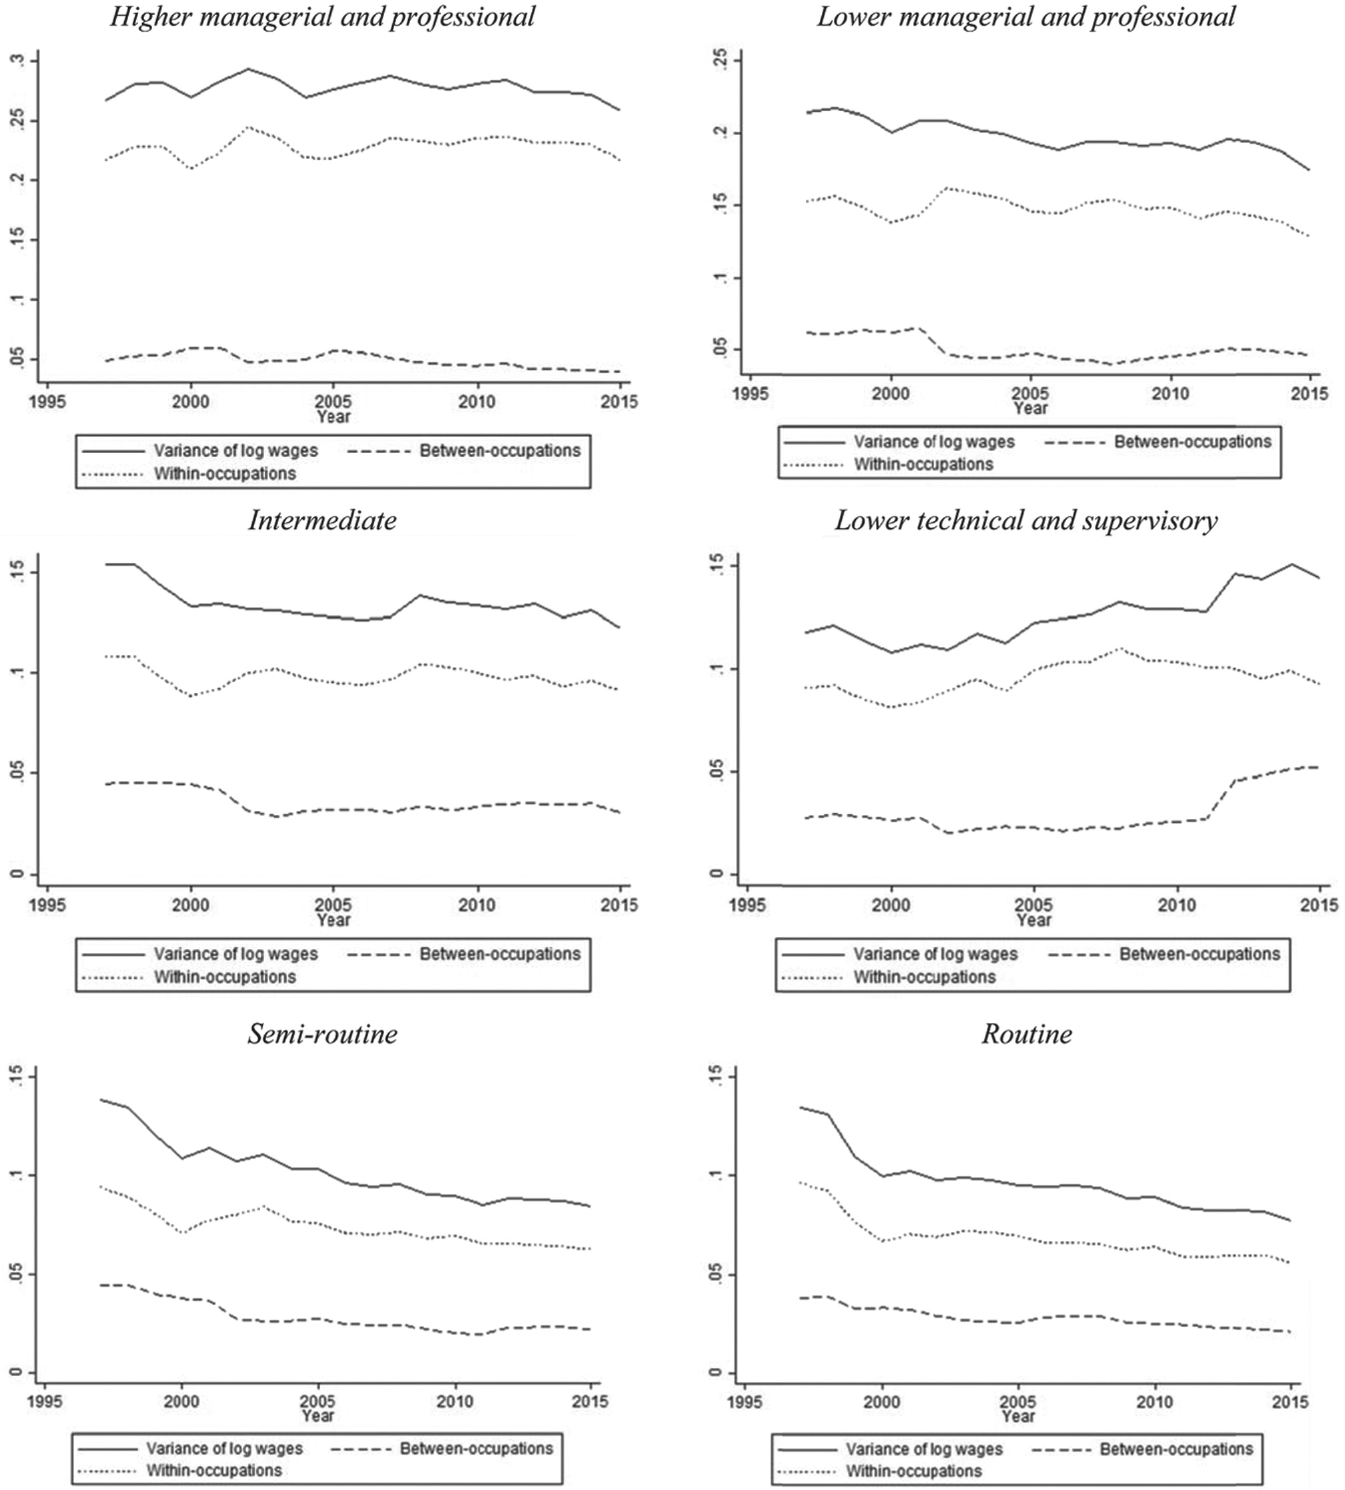
Decomposing wage inequality within classes into between- and within-occupation components.
Discussion and Conclusions
There has been a renewed interest in the theory and empirical analysis of the class structure and the possible occupational basis to this in the wake of the Great Recession. This article has explored two issues: whether wage inequality within classes and occupations has been increasing and whether there has been any fragmentation in class inequalities defined by the NS-SEC schema. With respect to the first, this article has shown that wage inequality within occupations has not been increasing. This implies occupation-based inequalities are still something to continue to be investigated, at least with respect to the key dimension of economic stratification examined here, that of earnings from employment. Even though wage growth is slowing and wage inequality has fallen slightly, the ‘explanatory power’ of occupations in explaining the variation in wages does not appear to be declining, whether occupations are defined in terms of detailed unit groups, micro-classes or NS-SEC categories. Or to put it another way, as wages have been declining in real terms, the positions of advantage and disadvantage in the labour market delineated by occupations and occupational classes has been maintained. 2
With respect to the second issue of possible fragmenting of stratification within classes, this article has shown that detailed occupational distinctions within NS-SEC categories appear to add little to the stratification story. Even when examining wage inequalities within individual NS-SEC categories, there is no compelling evidence for fragmentation in wage inequalities between detailed occupations within NS-SEC categories or within NS-SEC categories more generally. Overall, the vast majority of between-occupation inequality is found to be between-class inequality. This finding underlines the continued utility of the NS-SEC grouping of occupations in understanding the structure of stratification in contemporary Britain. Nonetheless, inequalities within detailed occupations remain substantial even though inequalities between occupations within NS-SEC categories are not. This not only highlights that within-group inequality should remain an important area for future research, but that it should really focus on inequality within detailed occupations rather than inequality within occupational classes.
One key caveat to the findings in this article – that wage stratification in Britain is still very much structured by occupations and the NS-SEC grouping of occupations – is the growth in self-employment. ASHE is a survey of employees and so excludes the self-employed by design. One in seven workers are now self-employed (Resolution Foundation, 2016). How their inclusion would alter the findings here is an open question, not least the conceptual and methodological difficulties in measuring ‘earnings’ for this group, although the available evidence suggests the trends have been somewhat similar to the employees (ONS, 2016b). While the Goldthorpe model upon which the NS-SEC grouping of occupations is based is primarily about the differentiation in employment contracts among employees, growing self-employment is a significant trend. How the self-employed fit into models of employment relations from a theoretical perspective has no straightforward answer, but occupational inequality among the self-employed is something we would highlight as a fruitful area for further theorising and applied work.
While the utility of occupations and occupational classes in describing the structure of stratification has come under renewed scrutiny in recent years, this article suggests that rather than abandoning occupations and meaningful aggregations of them in the form of NS-SEC categories, sociology would benefit from using a less ambiguous term such as ‘socio-economic classes’ or more simply ‘occupational classes’ when referring to them (Savage, 2016). While occupational class inequalities may well have ‘social’ implications, the theoretical basis is ultimately rooted in economic stratification of employees (Goldthorpe, 2007), and its utility therefore lies primarily in understanding the structure of work-related stratification. As this article has shown, occupations continue to provide the bedrock of the stratification among employees and age-old definitional arguments should not get in the way of substantive and technical advances in this area, in particular with respect to work-related stratification. In this article only one dimension of work-related stratification was looked at. There are myriad other relevant dimensions, such as hours insecurity, employment insecurity and earnings insecurity. Recent research on the emergence of zero-hour contracts, for instance, indicates they too are strongly associated with those categories delineated by the NS-SEC schema (Koumenta and Williams, 2016). But changing technology and significant demographic trends, not least further crises like the one witnessed in 2007/2008, may change this in the future and this is partly why occupation-based inequalities are a powerful area of research and one which sociologists have built much expertise to contribute towards. Sociologists should not abandon their theory and tools on occupational-based inequalities. Indeed, sociological work in this area provides a promising offering to parallel social sciences concerned with the structure and processes of work-related stratification.
Footnotes
Appendix
Sample sizes in the Annual Survey of Hours and Earnings.
| Year | Total | Not on adult rate | Earnings affected by absence (adult rate) | Analytical sample |
|---|---|---|---|---|
| 1997 | 153,950 | 2782 | 12,039 | 139,129 |
| 1998 | 161,378 | 2805 | 13,631 | 144,942 |
| 1999 | 161,750 | 2867 | 14,166 | 144,717 |
| 2000 | 158,965 | 3022 | 13,861 | 142,082 |
| 2001 | 161,358 | 3089 | 14,952 | 143,317 |
| 2002 | 163,821 | 3903 | 14,262 | 145,656 |
| 2003 | 166,431 | 4348 | 13,187 | 148,896 |
| 2004 | 163,640 | 4533 | 14,458 | 144,650 |
| 2005 | 168,343 | 2176 | 8073 | 158,094 |
| 2006 | 169,931 | 1649 | 8641 | 159,641 |
| 2007 | 140,936 | 1624 | 6062 | 133,250 |
| 2008 | 140,703 | 1517 | 6965 | 132,221 |
| 2009 | 171,891 | 1508 | 8039 | 162,344 |
| 2010 | 175,131 | 1575 | 7970 | 165,586 |
| 2011 | 184,501 | 1953 | 8369 | 174,179 |
| 2012 | 177,464 | 2323 | 8197 | 166,944 |
| 2013 | 180,082 | 1643 | 9504 | 168,965 |
| 2014 | 185,753 | 1920 | 9278 | 174,564 |
| 2015 | 181,052 | 1967 | 8945 | 170,140 |
| Total | 3,167,080 | 47,204 | 200,599 | 2,919,317 |
Source: Annual Survey of Hours and Earnings.
Funding
This research received no specific grant from any funding agency in the public, commercial or not-for-profit sectors.
Notes
References
Supplementary Material
Please find the following supplemental material available below.
For Open Access articles published under a Creative Commons License, all supplemental material carries the same license as the article it is associated with.
For non-Open Access articles published, all supplemental material carries a non-exclusive license, and permission requests for re-use of supplemental material or any part of supplemental material shall be sent directly to the copyright owner as specified in the copyright notice associated with the article.
