



Abstract
Students in the United States change schools often, and frequent changes are associated with poor outcomes along numerous dimensions. These moves occur for many reasons, including both promotional transitions between educational levels and nonpromotional moves. Promotional student mobility is less likely than nonpromotional mobility to suffer from confounding due to unobserved factors. Using panel data from students enrolled in grades 3 to 8 in the Metropolitan Nashville Public Schools during the implementation of a major change in school attendance policies, this article investigates the potential influence of four types of school changes—including promotional student mobility—on test score growth in reading and mathematics. All types of changes are associated with lower achievement growth during the year the enrollment change occurred, representing approximately 6 percent of expected annual growth, or 10 days of instruction. This incremental deficit is particularly concerning for disadvantaged students since they change schools more frequently. The results suggest that being new to a school does influence student achievement net of other factors; they also imply that important social ties are ruptured when students change schools.
Keywords
Students in the United States frequently change schools (Burkam, Lee, and Dwyer 2009; Pribesh and Downey 1999; Rumberger 2003; South and Haynie 2004), and disadvantaged students change schools more frequently than advantaged students (Alexander, Entwisle, and Dauber 1996; Hanushek, Kain, and Rivkin 2004; Kerbow 1996; U.S. General Accounting Office [GAO] 1994, 2010). These changes may harm students (GAO 2010; Mehana and Reynolds 2004; Reynolds, Chen, and Herbers 2009; Rumberger 2003), and school policies and programs may influence how often students change schools (Kerbow 1996; Kerbow, Azcoitia, and Buell 2003; Reynolds et al. 2009). Educational initiatives make contrasting assumptions, however, about the consequences of changing schools. For example, school choice advocates minimize the impact of changing schools whereas others think the middle transition is harmful enough to propose restructuring schools into a K-8 configuration (e.g., Rockoff and Lockwood 2010). Since student mobility is frequently bound up with family circumstances, the evidence that being new to a school has an effect on students is mixed.
Consider two hypothetical students who change schools at the beginning of the academic year: The first student changes residence after a long period of parental unemployment; the second is admitted to a magnet school after a long period of parental advocacy. The first student may appear to have been harmed by the change, and observers may interpret the harm as evidence of the importance of tacit student-development resources, such as social ties and information exchange, that are disrupted by the change in schools. The second student, on the other hand, may appear to benefit from the change, and observers may interpret the benefit as evidence of an improved match between student and school. Estimating the consequences of changing schools in these hypothetical examples will be biased— negatively in the first case by prolonged parental unemployment and positively in the second case by parental advocacy—so long as each estimate includes both the reason for the school change and the change itself.
Previous research on student mobility has focused primarily on midyear nonpromotional student mobility—changes in school enrollment not due to the transition from one level of schooling to another (Rumberger 2003:6). Mehana and Reynolds (2004) and Rumberger and Larson (1998) found that this type of mobility clearly predicts student hardship. However, as with the first hypothetical student, the relation between midyear nonpromotional mobility and student performance is likely to be entangled with family circumstances that students experience inequitably, such as family discord or parental job loss. Other dimensions of student mobility, including promotional and nonpromotional mobility and during-the-year versus between-years mobility, have long been acknowledged in the literature but have seldom been estimated together. Focusing on the ways in which students change schools rather than the reasons they change schools offers a new way to evaluate whether changes affect student outcomes.
In this article, I present a conceptual framework of student mobility that explicitly includes promotional student mobility, which with a few exceptions (e.g., Temple and Reynolds 1999) has been left by sociologists to those who investigate school configurations (e.g., Byrnes and Ruby 2007; Rockoff and Lockwood 2010; Rubenstein et al. 2009). Including promotional student mobility in the definition of student mobility reveals confounding influences that differ in type and degree, doubles the estimated number of times that students change schools, and suggests that nearly all students experience being new to a school at least once. This universality, however, poses its own estimation challenges since under most conditions there is little variation in how students experience these transitions.
Using a distinctive longitudinal data set from the Metropolitan Nashville Public Schools (MNPS), I provide and compare estimates of four types of student mobility. Panel data allow me to compare students to themselves to account for time-invariant student characteristics, and the MNPS data were collected during a period of enrollment transition, which offers an additional identification strategy for estimating the impact of promotional mobility. These estimates allow me to test multiple hypotheses about mobility, including whether being new to a school influences student achievement. The results suggest that changing school enrollment has measurable disruptive effects regardless of whether the move is nonpromotional or promotional and that the magnitude of the disruption is similar across most types of mobility.
Student Mobility Framework
Student mobility is not limited to midyear nonpromotional school changes, as is shown in the framework in Table 1. The columns of the table show that school changes can be either compulsory or noncompulsory. These changes consist primarily of promotional—also known as “structural” or “normative”—transitions that students experience when they are obliged to attend new schools because they have reached the maximum grade level at their current schools. In addition to promotional transitions, students are compelled to change schools when they are expelled from schools. 1
Framework of School Enrollment Changes

Source: Examples from National Research Council and Institute of Medicine (2010:4-5).
The framework also accommodates the underlying reasons for noncompulsory school moves, such as those elaborated in a workshop report by the National Research Council and Institute of Medicine (2010:4-5). Noncompulsory school changes are caused by family circumstances, including residential, displacement, school quality, or special education situations. Residential student mobility is prompted by a change in residence and includes a subtype called displacement in which a residential move occurs because of neighborhood safety concerns or in response to a natural disaster. School quality student mobility is prompted by a family’s search for a better educational fit, including a subtype in which the change is motivated by a search for specific services. Although noncompulsory school changes occur without respect to the academic calendar, some families may have the means to postpone changing schools. Prior research has found that school changes that occur during the academic year may have a greater impact on individual students than those that occur between academic years (Hanushek et al. 2004; National Research Council and Institute of Medicine 2010:31). This may be because the experience of being new is different during the school year or because students who change schools during the year do so under adverse conditions that yield more negative estimates.
These four types of school changes represent diverse student experiences and pose distinct estimation challenges, but they all include the experience of being new to a school, or the “new-to-school effect” shown in Table 1. The new-to-school effect is the influence on a student of leaving one educational context and entering another. The four types of enrollment changes and their associated effects are as follows:
Between-compulsory school moves consist of promotional transitions that take place regardless of the circumstances in a child’s life, such as the transition from elementary to middle school. Since students generally experience these changes along with a peer cohort, and since schools and families anticipate the change, the new-to-school effect associated with between-compulsory moves is presumably the least disruptive type of school change that students experience.
Between-noncompulsory moves occur when a child changes enrollment according to the traditional academic calendar but is not obliged to. They are associated with the new-to-school effect and with the myriad reasons for such a move, which are here designated as “other circumstances.”
During-noncompulsory moves consist of elective enrollment changes made during the school year. They include the new-to-school effect, a potential “timing effect,” and other circumstances, which may differ from the other circumstances in a between-noncompulsory move. For example, residential mobility between school years could represent a better match being made between student and school or an improvement in family circumstances. On the other hand, residential mobility during the school year could be a result of eviction.
During-compulsory moves take place when a student is expelled from one school and must enroll in another. They include the new-to-school effect, the timing effect, and the other circumstances associated with expulsion.
The Potential Effects of Changing Schools
Prior research has suggested three possible effects of changing schools—spurious, negative, and positive—and four testable hypotheses—spurious, timing, transition cost, and utility—that can be examined using the framework presented in the previous section.
Spurious Effects
It is possible that changing schools in and of itself has little or no effect—that there is a spurious association between student mobility and student outcomes. Estimates of the effect of noncompulsory moves are vulnerable to this critique because they are bound up with their circumstances. The magnitude of noncompulsory student mobility coefficients on student outcomes is substantially reduced, sometimes to the point of statistical insignificance, once other covariates are accounted for (Alexander et al. 1996; Gasper, DeLuca, and Estacion 2010; Pribesh and Downey 1999; Rumberger and Thomas 2000; Strand 2002; Strand and Demie 2006; Temple and Reynolds 1999). If an unobserved factor such as school disengagement (Rumberger and Larson 1998), family instability (Astone and McLanahan 1994), or poverty (Wright 1999) influences both the change in school enrollment and the outcome, then estimates of the effect of student mobility will be biased. Moreover, students who change schools on their own accord differ in a number of respects from those who do not change schools, including in measures of academic performance (GAO 2010). Because this study compares students over time and considers both compulsory and noncompulsory school changes, it should improve attempts to test the spurious association hypothesis.
Negative Effects
Two perspectives predict that the transition to a new school will be costly to a student, at least in the short term: a social capital perspective and an organizational perspective. In “Social Capital in the Creation of Human Capital,” James Coleman (1988) offered as a “proximate” indicator of intergenerational closure the number of school changes a child has made because his or her family has relocated. He explained, “For families that have moved often, the social relations that constitute social capital are broken at each move” (Coleman 1988:S113). Although Coleman focused on students who change residences and schools simultaneously, the dynamic applies to all types of school moves because students form social capital–building relationships in school with both peers and adults. Changing schools—with or without an accompanying change in residence—breaks those relationships as well as the students’ parents’ relationships with fellow parents. Even when students change schools as a cohort, they and their parents need to establish ties with school staff. If a student’s existing relationships were beneficial (i.e., the child was not bullied by his or her peers), breaking and reforming these relationships create at least a short-term deficit; repeating the process in multiple moves may create a lasting disadvantage. Indeed, data from the National Educational Longitudinal Study suggest that students who changed schools experienced a loss in school-related social ties (Pribesh and Downey 1999). Social network analyses using the National Longitudinal Study of Adolescent Health observed that mobile students assume peripheral locations in smaller peer-friendship networks, in contrast to their nonmobile peers (South, Haynie, and Bose 2007). These findings suggest that the cost of changing schools is paid in social relations and social capital. The magnitude of these estimates can be consequential; in a recent meta-analysis of well-controlled student mobility studies, Reynolds et al. (2009) found that the marginal effect of an additional school move was approximately one tenth of a standard deviation in reading or mathematics achievement, comparable to about one month of performance.
The organizational perspective focuses on opportunities that mobile students have to learn and the curricula to which they are exposed. All teachers get acquainted with their students at the beginning of the year, but new students during the year pose challenges to teachers’ ability to maintain instruction (Kerbow 1996; Lash and Kirkpatrick 1990). To teachers, mobile students represent unknown quantities who require evaluation that might take away from instructional time. Contrasting results in reading and mathematics may yield some insight into this phenomenon. Since there is some evidence that mathematics is more sensitive to curricular sequencing than literacy instruction (Kerbow 1996), students who change schools are more likely to experience gaps or repetitions in their mathematics exposure. This may cause them to progress more slowly. The flexibility of literacy instruction may allow new students to integrate more readily into a curricular program. In either case, curricular issues are more likely to arise when students experience noncompulsory school changes and/or changes during the academic year.
For reviews of the potential negative effect of student mobility on student outcomes, see Rumberger (2003) or Mehana and Reynolds (2004).
Positive Effects
Mobility also can represent opportunity. Examples of noncompulsory student mobility in which changing schools can benefit students include circumstances in which the quality of the previous school was poor or the student’s need for special education is great. As Hanushek et al. (2004) found, the change in and of itself may be disruptive, but a favorable match of student to school can ultimately be positive. Similarly, Swanson and Schneider (1999) found that students who changed schools early in high school could recover benefits later, but moves that took place later were not beneficial. This expectation of positive effects generally assumes that families make a single change to maximize their utility and that the change is followed by a long period of enrollment stability—students who move frequently would not be expected to benefit from changing schools. This positive view of mobility does not suggest that changing schools benefits students inherently but rather that the experience of changing schools, together with additional causes and potential benefits associated with the change, may yield a positive net effect.
Summary of Predictions
The three potential effects of changing schools indicated by prior research suggest four hypotheses about the relation between student outcomes and changes in school enrollment. First, the spurious association hypothesis suggests that being new to a school has little or no effect on student outcomes because other factors confound the relationship. This hypothesis will be tested by all four mobility estimates. The between-compulsory school enrollment changes will likely offer the least biased estimate because district policies rather than family circumstances prompt the change. Indeed, this estimate may well turn out to be zero (BC = 0). After all, schools and families anticipate these promotional transitions as a normal part of the education process, students generally undertake them with peer cohorts, and schools and teachers spend time at the beginning of the year integrating all students into the class. 2
If the estimate of the effect of being new to a school is not zero, the value of the estimate could be positive or negative. The transition cost hypothesis suggests that being new to a school negatively affects students. As with the spurious association hypothesis, all four types of student mobility will inform the evaluation of this hypothesis, and the between-compulsory estimate will be granted the most weight. If the between-compulsory estimate is negative and differs significantly from zero (BC < 0), then I will infer that mobility incurs a short-term cost, as a result either of the student’s loss of social ties or of the school’s organizational response to new students (or some combination of the two).
The timing hypothesis suggests that school changes during the academic year are more deleterious than those between academic years. This hypothesis will be evaluated by comparing the during-noncompulsory to the between-noncompulsory estimate. Neither the during-noncompulsory nor the between-noncompulsory moves are required by the district. If school changes during a year are worse than those between years, then the during-noncompulsory estimate will be less than the between-noncompulsory estimate (DN < BN). This test requires the strong assumption that the components of these estimates are linear and additive. This hypothesis will be further evaluated by comparing different model specifications.
Finally, the utility hypothesis addresses conditions for which changing schools could produce a positive outcome, such as when families effectively place their children in more appropriate educational settings. To the extent that beneficial school changes do occur, they are most likely to be observed in between-noncompulsory changes since families making school quality decisions have some control over the timing of their choices. Since trying family circumstances occur without regard to the school calendar, between-noncompulsory changes will take place for reasons other than school quality. The utility hypothesis has a strong form that suggests that changing schools for family reasons is positive or that the between-noncompulsory estimate would be greater than zero (0 < BN). The hypothesis also has a weaker form that suggests that family-initiated school changes are on average better than compulsory school changes since families benefit from a better match or the better match offsets the cost associated with changing schools. In this case, the between-noncompulsory estimate may not be greater than zero, but it would be greater than the between-compulsory estimate (BC < BN). Again, this test assumes that the relationship is linear and additive. Note, however, that this hypothesis is less about the effect of changing schools than the direction and magnitude of additional family circumstances that coincide with a change in school enrollment.
Accounting for the different ways students change schools and estimating the impact of each type allows this study to evaluate which situations are better or worse for student achievement growth. This addresses multiple hypotheses, including but not limited to whether the relationship is spurious.
Data
MNPS
Several features make Nashville, Tennessee, from 1998 to 2003 an opportune place and time to investigate student mobility. MNPS is the 49th-largest school district (of more than 14,000) in the United States. Serving Davidson County, Tennessee, the district is a consolidated city–county district that includes Nashville and its surrounding suburbs, covers approximately 525 square miles, and enrolls nearly 75,000 students overall, with more than 51,000 students in its 74 elementary schools and 35 middle schools (MNPS 2009). The broad geographic area and diversity of residential contexts keep many students in the study sample even as they migrate between the city and its suburbs.
MNPS had been placed under a federal desegregation order since the city and county established the consolidated school district in 1964. Attendance policies and busing constituted a substantial portion of the desegregation efforts. Students older than kindergarten age were subject to countywide busing, with city students bused to suburban areas for elementary school (up to fourth grade), suburban students bused to city schools for fifth and sixth grade, and city students again bused to suburban schools in seventh and eighth grade (Goldring et al. 2006). This plan imposed frequent compulsory school enrollment changes on students; students commonly left their schools in favor of new ones at the end of fourth, sixth, and eighth grades; and many students changed schools at the end of kindergarten and second grade as well.
After the Supreme Court decided the cases Board of Education of Oklahoma City Public Schools v. Dowell (498 U.S. 237 [1991]) and Freeman v. Pitts (503 U.S. 467 [1992]), school districts could appeal to federal courts to be declared “unitary” and have their mandatory desegregation efforts relaxed. MNPS achieved unitary status in September 1998 and adopted a new school attendance plan to be phased in over a number of years. This plan endorsed two “immutable factors” that emphasized enrollment continuity for students (MNPS 1998, quoted in Goldring et al. 2006:342). First, the board adopted a three-tiered design with promotional transitions after fourth and eighth grades so that students would be compelled to attend no more than three schools from kindergarten through high school. Second, the district defined 11 school attendance clusters, or zones, to encourage students from similar geographic areas to stay together during their schooling. 3 Critically for this analysis, the first immutable factor reshuffled the compulsory school changes students would experience as the new policy was adopted.
Implementation of the unitary status plan commenced at the beginning of the 1999-2000 academic year and was to be completed by the 2003-2004 academic year; by 2001–2002, 85 percent of MNPS students attended a rezoned school as part of the new assignment plan (Goldring et al. 2006). As Figure 1 shows, the plan resulted in the gradual elimination of the promotional transition between sixth and seventh grade and a corresponding adoption of a universal compulsory school change between fourth and fifth grade. In 1999-2000, 44 percent of all fifth-grade students and 54 percent of all seventh-grade students had been promoted; in 2002-2003, 91 percent of all fifth-grade students and 14 percent of all seventh-grade students had been promoted. Figure 1 shows that the overall number of times promotional transitions were observed for these grades remained steady, but the timing of the changes varied. 4 In the early years of this period, some students experienced two between-compulsory school changes (between fourth and fifth grade and again between sixth and seventh grade), whereas in the later years, students experienced only one between-compulsory change (between fourth and fifth grade). Whether a student experienced a between-compulsory school change depended on the child’s cohort and the school he or she attended during the period.
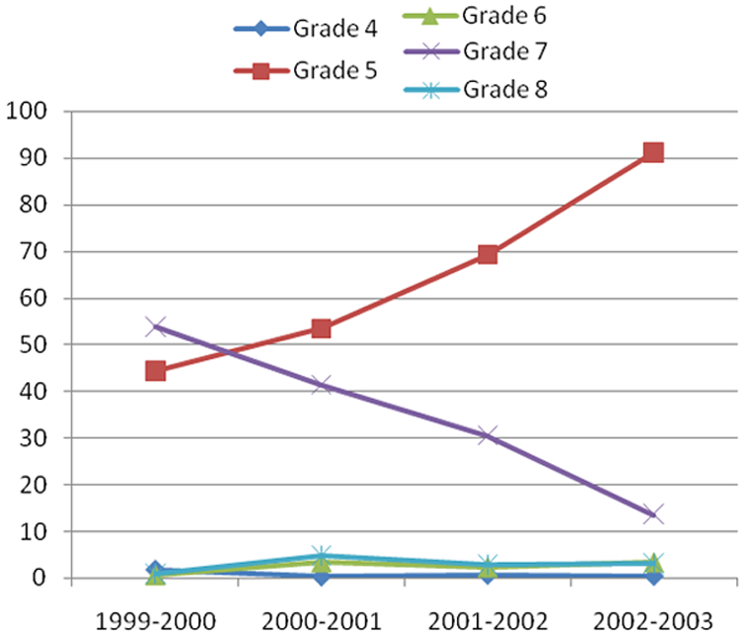
Between-compulsory school enrollment changes, by grade level and academic year
The adoption of the unitary status plan by MNPS presents an unusual opportunity to observe variation in compulsory changes. One of the identification strategies employed in this article exploits this policy change: As the between-compulsory transitions changed, they were decoupled from routine grade transition effects. 5 However, because students were not randomly assigned to new schools and the staggered implementation was not conducted randomly, the causal inferences one may make with these data are limited.
Sample and Descriptive Statistics
Data for this analysis were compiled from the following MNPS administrative files for the academic years 1998-1999 through 2002-2003: achievement test scores in mathematics and reading in third through eighth grade, limited demographic information, daily attendance records, and disciplinary reports. The panel begins the year before the school rezoning began and ends one year before the process was complete (rescaling of the dependent variable in 2003-2004 eliminates that academic year of data from the analysis). The complete panel data set for analysis includes 152,271 observations of 61,362 students during the five-year period. For the regression analysis, the data set includes 150,848 observations of 61,084 students for reading and 151,323 observations of 61,182 students for mathematics. (The analytical samples for the regression analysis are smaller because some students lacked data for mathematics and/or reading in a given year.) Six cohorts of students have at least three observations, and two cohorts (those who were in third and fourth grade in 1998-1999) were observed in five consecutive years. Because the regression results are robust to using the entire sample or limiting the analysis to cohorts with four or five observations, I will report descriptive statistics and findings using the complete sample. Students who were retained in grade (2 percent of the observations) are included in the analytical sample, but I do not present models with retention included since the school change estimates were robust to whether grade retention was included as a time-varying covariate.
The analytical sample includes all possible observations of students. The more restrictive alternative—to include only those students who were observed at the first possible occasion (e.g., grade 4 in 1999)—would result in an unnecessarily high and selective amount of attrition. Students with single observations are included in the descriptive statistics but do not contribute to the analysis because they cannot be compared with themselves over time.
Students’ basic demographic characteristics are shown in Table 2. These data are from student enrollment files and have been matched to available testing data. The student population was for the most part either African American (44 percent) or Caucasian (47 percent), with the remaining 9 percent consisting of Latino and Asian students. 6 Approximately half of the students were female. Of the students, 55 percent were eligible for free/reduced-price lunch, 5 percent had limited proficiency in English, and 17 percent were entitled to some form of special education. (Due to some instability over time, the statistics reported here indicate whether a student was ever eligible for these programs or services.) Unfortunately, information about student residence, which might be used to identify school changes that coincide with residence changes, and time-varying data that pertain to noncompulsory school changes such as school dissatisfaction or parental divorce are not available.
Student Characteristics
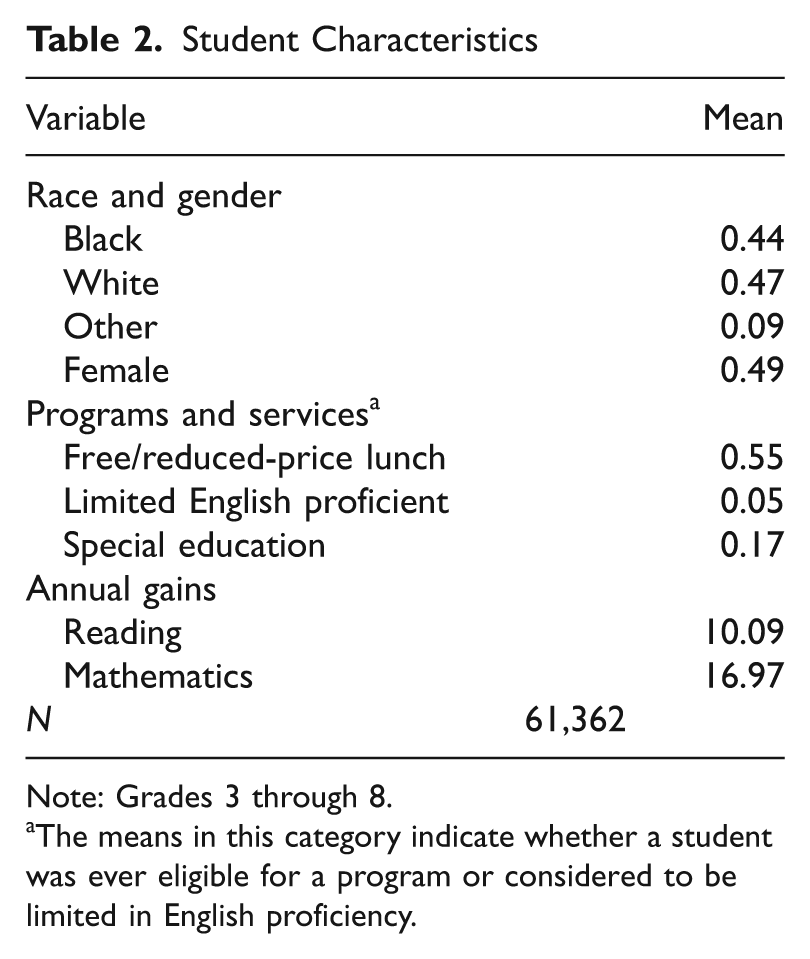
Note: Grades 3 through 8.
The means in this category indicate whether a student was ever eligible for a program or considered to be limited in English proficiency.
Dependent Variables
The outcomes are reading and mathematics scores on the Tennessee Comprehensive Assessment Program, which is an assessment administered annually to all students in third through eighth grades. The tests are vertically scaled so that student scores can be compared across grades and years. In practice, the equivalence is not perfect; the means and standard deviations of the scores for each grade (not shown) vary slightly from one year to the next. Moreover, the variance of the mathematics outcome increases with grade level (i.e., the mathematics outcome is heteroscedastic). On average in these data, students gained 10.09 points each year in reading and 16.79 points each year in mathematics.
Explanatory Variables
Students in MNPS changed schools frequently during this five-year period, as shown in Table 3. Indicators of the four types of student mobility are derived from daily attendance records, student enrollment files, and disciplinary records. The daily attendance file is a complete record of all of the schools a student attended in a given year. If, during an academic year, the last school attended differs from the first, then the student is understood to have changed schools during that academic year. Comparing this information to the disciplinary file reveals that less than 1 percent of these during-year changes were associated with expulsion (during-compulsory). The remaining school changes are therefore designated during-noncompulsory. Between 8 and 15 percent of students experienced noncompulsory school changes in any given year, with 13 percent experiencing during-noncompulsory school moves on average across the years. This annual rate of noncompulsory student mobility is consistent with those found in other administrative data sets, including Texas (Hanushek et al. 2004), Louisiana (Engec 2006), Chicago (Kerbow 1996), Philadelphia (Offenberg 2004), Pittsburgh (Dunn, Kadane, and Garrow 2003), Minneapolis (Hinz, Kapp, and Snapp 2003), and an unidentified school district in the Pacific Northwest (Gruman et al. 2008).
School Enrollment Changes by Student and Year, Grades 3 through 8
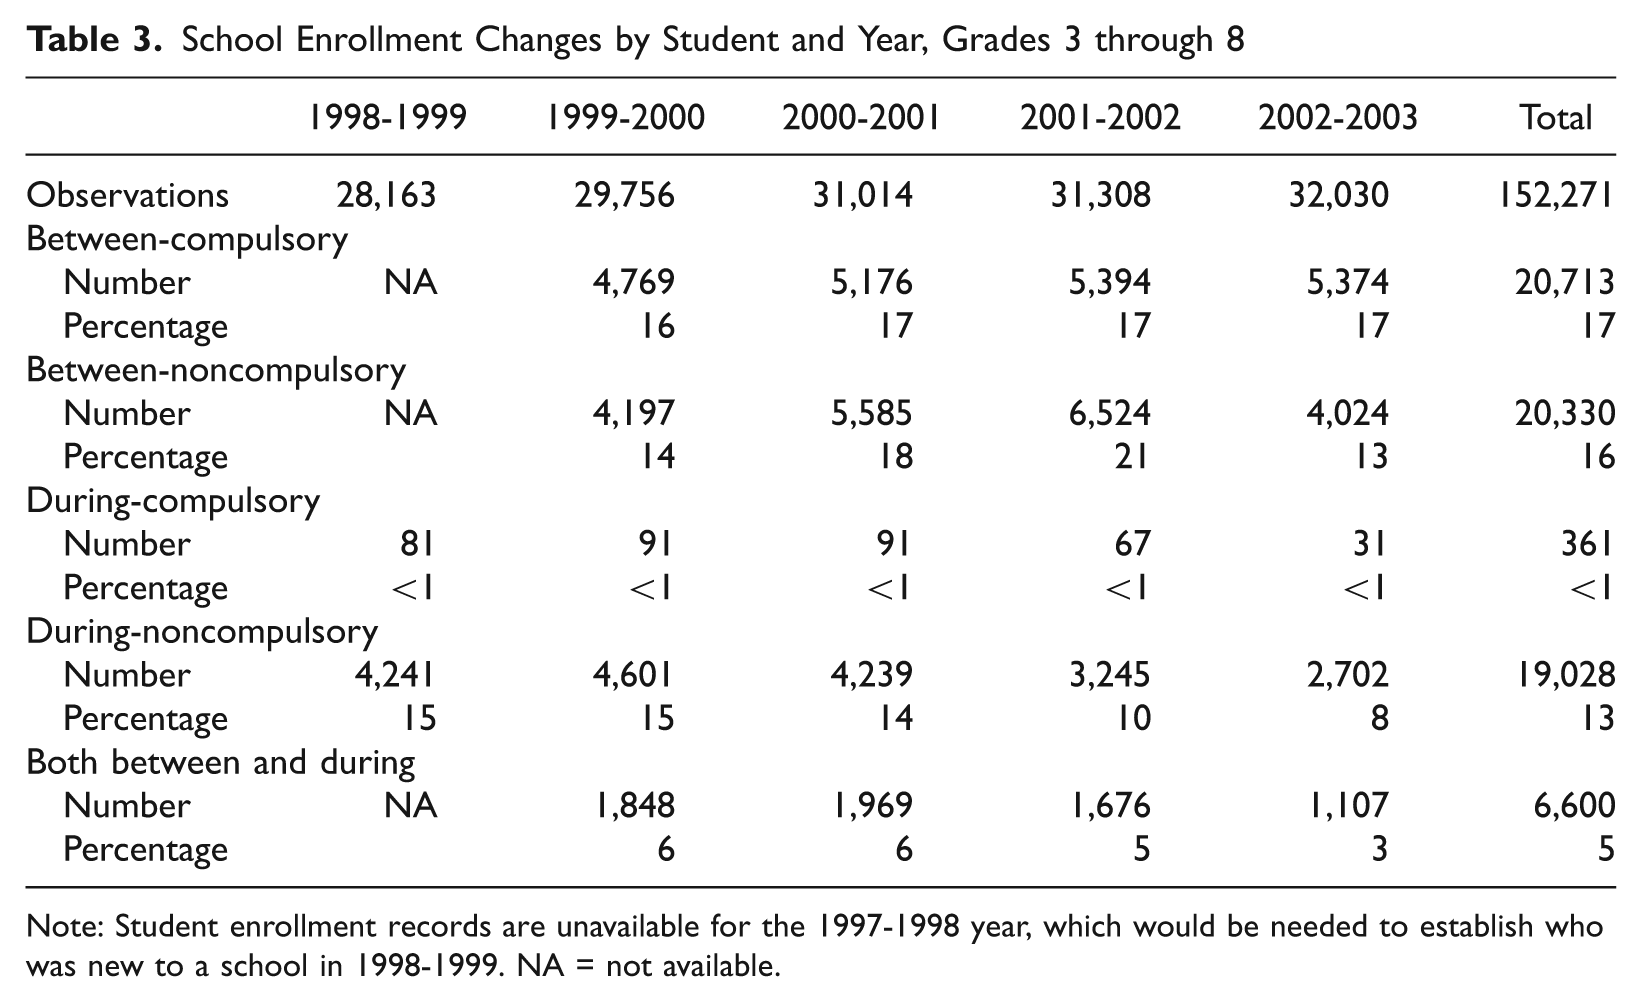
Note: Student enrollment records are unavailable for the 1997-1998 year, which would be needed to establish who was new to a school in 1998-1999. NA = not available.
If the first school a student attended in a year does not match the last school the student attended in the prior academic year, then the student is understood to have changed schools between academic years. 7 Because these statistics can be produced only if a student’s attendance is recorded in two consecutive years, they likely underestimate the rate at which students change schools between academic years.
If a student was enrolled in the highest grade offered at his or her previous school in the prior year, then the transition to a new school in the next year was designated a between-compulsory change; the remaining enrollment changes were designated between-noncompulsory changes. Of course, some of the school enrollment changes that are observed as between-compulsory changes may have occurred in the absence of compulsion, but these moves are generally anticipated and unavoidable and therefore often have the characteristics of compulsory school moves.
Counting promotional transitions as a type of student mobility reveals how commonplace mobility is. On average, 16 percent of students experience between-noncompulsory school changes each year, but an additional 17 percent of students experience a between-compulsory school change due to a promotional transition. That is, students encounter a new educational setting at the beginning of each school year twice as often as between-noncompulsory or between-compulsory changes alone would suggest. On average, 13 percent of students experienced a during-noncompulsory school change each year. A total of 5 percent of students started the academic year at new schools and then changed schools again during the year. Even when the students who moved both between years and during the year are counted only once, on average in these data, 35 percent of students annually experienced some kind of mobility.
Although mobility is prevalent, it is still disproportionate. As has been found elsewhere (cf. GAO 2010:5), students who change schools are disproportionately nonwhite, and they are frequently eligible for free/reduced-price lunch. African American students represent 47 percent of the student-by-year observations but 57 percent of during-noncompulsory, 72 percent of during-compulsory, 56 percent of between-noncompulsory, and 49 percent of between-compulsory school moves. 8 Similarly, 51 percent of the student-by-year observations had ever been identified as eligible for free/reduced-price lunch, but these students represent 67 percent of during-noncompulsory, 75 percent of during-compulsory, 59 percent of between-noncompulsory, and 52 percent of between-compulsory school moves. As one would expect, disadvantage predicts mobility, but students who experience between-compulsory school moves more closely resemble the overall student population.
Analysis
Taking advantage of the longitudinal nature of the data, the analysis compares students with themselves from one year to the next; in this case a student’s growth in a year in which he or she changed schools is compared with his or her growth in a year he or she did not change schools. Because individuals are compared with themselves, fixed-effects models control for time-invariant unobserved individual characteristics (Wooldridge 2002). Fixed-effects models identify the coefficients in the model based on individuals who changed status; students who never changed schools (or who always changed schools in the same way) contribute no information. Fortunately, in these data, nearly all of the students changed schools in one way or another, which mitigates this limitation. Fixed-effects models also assume that students had a steady trajectory over time; students who experienced a dip in achievement before changing schools violate this assumption since the observed gain in the subsequent year would overestimate the effect of the change (Ashenfelter 1978). Such a dip introduces positive bias to the estimation and is presumably most problematic for between-noncompulsory, during-noncompulsory, and during-compulsory school changes.
Formally, the fixed-effects model represents an individual student’s test score in a given year with the following equation:
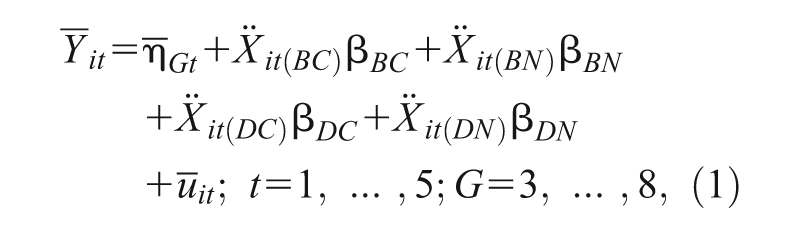
where
Two additional model specifications deserve elaboration. First, the vector of grade-by-year fixed effects controls for variations in the test scale across years and grades without assuming that the means and standard deviations of the grade-level tests are equivalent across the panels (which they are not). 9 In addition, a robust variance matrix estimator corrects for panel imbalance (i.e., students enter and leave the panel at different times), heteroscedasticity, and—most important—serially correlated errors since the data are repeated measures of the same students (Wooldridge 2002:275-76).
The strength of the model is that it removes the influence of time-invariant unobserved factors such as parental education and motivation (fixed characteristics such as race or gender also wash out). These time-invariant and unobserved characteristics are allowed to be correlated with the explanatory variables without biasing the estimates of the association between the explanatory variables and the outcome. The model is vulnerable to confounding from time-varying factors such as family dissolution or parental job loss. These factors fall under other circumstances in the student mobility typology represented in Table 1 and may bias the estimates of noncompulsory school moves. On the other hand, the estimate for between-compulsory school moves should be robust to these factors.
Results
The regression results for reading and mathematics are presented in Figure 2 (the results are also presented in the online supplement as Table A.1). Each estimate of the effect of changing schools on the subsequent gain in achievement is presented with its 95 percent confidence interval; intervals that include zero are not significantly different from zero. Coefficients with nonoverlapping confidence intervals represent statistically significant differences from one another.
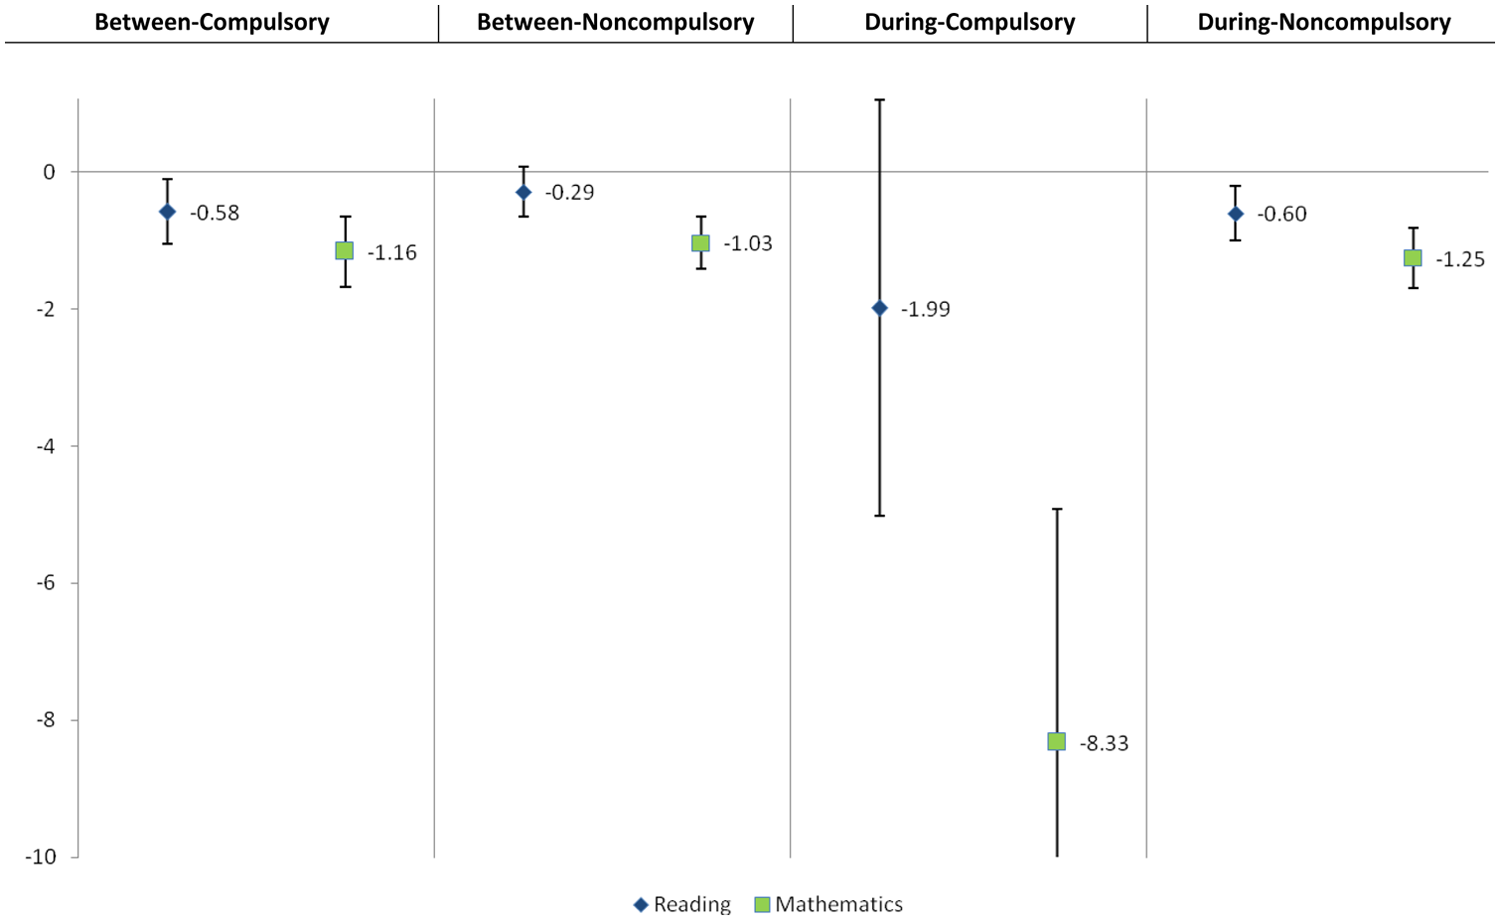
Estimated impact of changing schools on annual gains in reading and mathematics
Reading
All school enrollment changes are associated with a lower rate of growth in reading during the year the change occurred, but not all of the differences are significantly different from zero. The results reveal systematic variation by type of school enrollment change. Between-compulsory school changes yield a negative estimate that is significantly different from zero (–0.58). Between-noncompulsory school changes produce a less negative estimate (–0.29) that is not significantly different from zero. If this estimate represents the effect of changing schools plus other circumstances that caused the move, this fixed-effects result may suggest that the unobserved causes—at least in reading—partially offset the effect of the disruption even in the short term; however, it could also be bias introduced by a performance dip prior to the change.
The estimates for school enrollment changes during the academic year differ from one another as well. The expulsions that constitute the during-compulsory changes fare considerably worse than any other type (–1.99), but these rare events are not estimated precisely. The during-noncompulsory estimate is negative and significantly different from zero (–0.60).
In reading, the four confidence intervals all overlap substantially with one another, and two (between-compulsory and during-noncompulsory) do not include zero. Excepting during-compulsory moves (expulsions), the coefficients fall within the range of −0.29 to −0.60.
Mathematics
In mathematics, the results are more consistently negative than the results for reading, suggesting that students improved less in a year they were new to a school than in years of continuous enrollment. Between-compulsory school moves produce an estimate of −1.16, and between-noncompulsory school moves produce an estimate of −1.03; both estimates are significantly different from zero. The coefficient for during-compulsory moves is sufficiently large and negative (–8.32) that even an imprecise estimate is significantly different from both zero and the estimates for the other three coefficients. Finally, during-noncompulsory moves yield an estimate of −1.25, which, as with reading, is slightly more negative than the between-year estimates, but their confidence intervals overlap. Again excepting during-compulsory moves, the three remaining types of school enrollment changes produce estimates within a narrow range, from −1.03 to −1.25.
Interpreting Coefficient Sizes
On average, students gained 10.09 and 16.07 points each year in reading and mathematics, respectively. The between-compulsory school change estimates of −0.58 and −1.16 and the during-noncompulsory estimates of −0.60 and −1.25 both represent 6 percent of the expected gain in both reading and mathematics. The between-noncompulsory estimates (–0.29 and −1.03) correspond to 3 percent of the expected gain in reading and 6 percent of the expected gain in mathematics. The estimates for during-compulsory moves represent 20 percent and 50 percent of the average annual gain in reading and mathematics, respectively. If one assumes that this mean annual grade-to-grade growth rate is achieved during the 180-day academic calendar, then 6 percent of the mean grade-to-grade growth rate is equivalent to a setback of more than 10 instructional days, or approximately two weeks of instruction. The cost of a single school change appears to be somewhat less than the one month of performance loss associated with an additional school change reported by Reynolds et al. (2009).
Discussion
Summary of Findings
This article offered four hypotheses with respect to the relation between school enrollment changes and student achievement. The spurious association hypothesis—that changing schools does not in and of itself have an effect on annual student growth or that student mobility is wholly confounded—is consistently rejected. All estimates are negative, most are statistically significant, and the between-compulsory estimate used to evaluate the hypothesis is statistically and substantively significant in both reading and mathematics. Although much of the uncontrolled association between mobility and student outcomes is confounded by other factors, as other research has found, the results presented here suggest that there is a small but real cost associated with changing schools.
The negative direction of the results, even in the case of anticipated compulsory moves, supports the transition cost hypothesis. The finding in prior research that changing schools during the academic year is more detrimental than changing schools between years—the timing hypothesis—is not supported in these data. The estimates for during-compulsory cases are indeed more negative than for between-year estimates, but during-noncompulsory estimates are not significantly different from between-year estimates. This finding suggests that expulsion cases are systematically different from other forms of student mobility and should be estimated separately when possible. Generalized least squares models yield more negative results for during-noncompulsory school changes (see online supplement, Table A.2), which further suggests that the more negative estimate is due to time-invariant unobserved differences between students who experienced during-noncompulsory school changes and those who did not rather than to a distinctive feature of during-noncompulsory mobility.
There is little evidence—at least in the time span covered by these data—supporting the utility hypothesis. The between-noncompulsory estimate is negative for both outcomes and is statistically significant in mathematics, rejecting the strong form of the hypothesis. The between-noncompulsory and between-compulsory estimates are very similar in mathematics, and although in reading the estimate of the between-noncompulsory estimate is less negative than the between-compulsory estimate, the confidence intervals suggest that the estimates are equivalent to one another. Consequently, there is little evidence of a relative average benefit to changing schools when the family—rather than the school district—initiates the change. Additional analyses of nonwhite and free/reduced-price lunch–eligible students (see online supplement, Tables A.3 and A.4) do not provide evidence of systematic differences by student subgroup. The during-compulsory estimates in reading for the subgroups are substantively but not statistically more negative, and all of the estimates for the subgroups fall within the bounds of the estimates for the overall population. 10
Overall, the similarity of the estimates for three of the four types of student mobility is striking. With the exception of expulsion, the estimates within reading and mathematics fall in a narrow range, and they mostly represent a decrease of approximately 6 percent of expected annual growth.
Limitations
This study has five principal limitations. First, even though these data are well suited for disentangling school changes from family circumstances, they remain observational and do not control for all potential confounders. Second, any generalizing of these results to other places and times should be done with caution. The advantage these data offer for producing a valid estimate of the effect of changing schools comes at the cost of external validity, even to other eras in MNPS. The complex transition to unitary status may have singularly influenced both student mobility and student achievement during this time period. For example, the change in enrollment policy to reduce transitions and keep students closer to home may have upset some families in a way that implicated the performance of particular students; however, it is unclear how reducing travel time and promotional transitions would discourage student effort. Fewer urban students attended suburban schools as a result of this policy change, but the between-compulsory estimates suggest that students fared worse in the years they changed schools, further suggesting that attending suburban schools was not necessarily beneficial to students, at least in the short term. Third, consistent evidence of a short-term negative effect does not preclude a long-term benefit to changing schools. The high prevalence of school changes, however, challenges whether one can safely assume that students will maintain the steady enrollment necessary to enjoy any potential benefits of their new educational contexts. Fourth, test scores are only one outcome about which we might be concerned, and they may not be the most important. Changing school contexts might positively influence students in ways that are more difficult to observe, such as educational aspirations or attainment. (Current evidence on this point is limited to private school analyses; see Hoffer 2009 for a review.)
Finally, although these data allow for a precise specification of student mobility in terms of timing and context, the analysis would be improved by knowing whether a school change was concurrent with a change in residence and by observing time-varying influences such as parental separation or job loss. The between-compulsory school changes, however, should have few such confounders. Moreover, the consistency of the fixed-effects results—with the exception of the expulsion cases—suggests that time-varying confounders in each type of school move either play a minimal role or bias the results in the same fashion, which is unlikely.
Implications
This article investigated the extent to which an identifiable and potentially alterable event—a change in school enrollment—is associated with changes in students’ annual test scores. The findings suggest that school changes of all types—including those that students are obliged to make—are detrimental to student achievement in the short term. These findings are consistent with both the social capital and the organizational perspectives. Being new to a school attenuates a student’s expected gain in both reading and mathematics; future research will need to disentangle whether this is a result of ruptured social ties or reduced opportunity to learn. In either case, continuous attendance at a school presumably allows students to establish relationships and adopt norms that help them learn. It also helps teachers diagnose students’ abilities and maintain curricular continuity. These ties and forms of tacit and explicit information can be understood as resources for student learning that need to be replenished when students change schools. The cost students pay for mobility—for any reason, including district fiat—reveals the importance of these resources. That cost is a social one, and the results are consistent with the sociological prediction of a negative effect of being new to a school.
Changes in school enrollment by no means explain the entire gap in achievement between advantaged and disadvantaged students. In these data, the average black-white achievement gap was 26 points in reading and 23 points in mathematics; the coefficients for between-compulsory school changes represent only 2 to 4 percent of this gap. That being said, the disruption associated with changing schools may play a role in diverting the learning experience of all students, at least in the short term. Disadvantaged students are more likely to experience such disruptions, thus raising the possibility of accumulating deficits. At the same time, there is suggestive evidence in this study—as in others (e.g., Swanson and Schneider 1999)—that families can in some cases change a child’s school enrollment to his or her benefit. In families that are already advantaged, school choice and other enrollment policies may maintain status inequalities. Goldring et al. (2006), for example, found that the neighborhood schooling movement in MNPS sorted black children into schools in high-risk neighborhoods.
The findings of this study also have implications for educational policy. Although many considerations beyond test scores guide grade-span decisions, perhaps school districts should more seriously consider reducing the number of compulsory school changes they impose on students, such as by moving to a K-8 grade span rather than a middle school model (see Byrnes and Ruby 2007 or Rockoff and Lockwood 2010). These findings also have implications for competitive models of school reform, particularly as a potential remedy for students in failing schools. If transferring to other schools is to benefit children more than staying put, two assumptions must hold: Families must have good information about the quality of alternative schools, and the benefits of the transition to a new school should outweigh the costs—not only must the experience at the new school be better than that at the original school, but it must outweigh the additional cost associated with the change. Middle-class parents may choose schools based on their presumed quality (Lareau 2003), but when poor families choose schools, recent research suggests that a host of other considerations crowd out issues of quality or effectiveness (DeLuca and Rosenblatt 2010). Moreover, it is not clear that families have good information about successful or failing schools even if they wish to choose a new school on that basis (Downey, von Hippel, and Hughes 2008). The findings from this article suggest that the second assumption deserves greater scrutiny as well.
Conclusion
This article expands the definition of student mobility to encompass all situations in which a student finds himself or herself in a new school. It finds not only that these experiences are more prevalent than most estimates of mobility would suggest but also that in all cases the changes in school enrollment were detrimental to the student’s achievement growth as measured by test scores. The change in MNPS enrollment policies as it achieved unitary status induced variation in compulsory school changes that allowed for a robust estimate of the effect of changing schools. Although the phenomena are not strictly uniform, the results were remarkably consistent in both reading and mathematics and across all types of mobility except expulsion, suggesting that school changes disrupt a child’s educational development at least in the short term. Disadvantaged students experience these disruptions more frequently during the course of their education, which may lead to an accumulating deficit.
Unlike many factors associated with poor performance, student mobility can be manipulated, as the Nashville case demonstrates. The findings presented in this article call for two forms of attention to student mobility. First, we should further inquire how being new to a school is detrimental. We should also investigate the converse: how continuity can be an asset for student learning. Second, we should attend to how often students are actually changing schools and be sensitive to how current policies encourage or discourage this mobility.
Footnotes
Acknowledgements
I thank Adam Gamoran, Bob Hauser, Ruth Lopez Turley, Sarah Bruch, Paul Hanselman, Anna Haskins, Elizabeth Wrigley-Field, and three anonymous reviewers for feedback on earlier versions of this article. I also thank Brian An and Russell Dimond for technical assistance and Greg Bales for editorial assistance. Any remaining errors are my own.
Author’s Note
A prior version of this article was presented at the 2009 annual meeting of the American Sociological Association.
Funding
The author(s) disclosed receipt of the following financial support for the research, authorship, and/or publication of this article: The research reported here was supported by the Institute of Education Sciences, U.S. Department of Education, through award number R305C050055 to the University of Wisconsin-Madison. The opinions expressed are those of the author and do not represent views of the U.S. Department of Education.
Notes
Bio
References
Supplementary Material
Please find the following supplemental material available below.
For Open Access articles published under a Creative Commons License, all supplemental material carries the same license as the article it is associated with.
For non-Open Access articles published, all supplemental material carries a non-exclusive license, and permission requests for re-use of supplemental material or any part of supplemental material shall be sent directly to the copyright owner as specified in the copyright notice associated with the article.
