
Abstract
Research shows that exposure to local neighborhood violence is associated with students’ behavior and engagement in the classroom. Given the social nature of schooling, these symptoms not only affect individual students but have the potential to spill over and influence their classmates’ learning, as well. In this study, I use detailed administrative data from five complete cohorts of students in the Chicago Public Schools (2002 to 2010), crime data from the Chicago Police Department, and school-level surveys conducted by the University of Chicago Consortium on Chicago School Research to assess the strength of this peer effect. The estimated negative relationship between peer exposure to neighborhood violent crime and individual achievement is substantial and remains after adjusting for other peer characteristics and student fixed effects. Surveys suggest these results are related to trust, discipline, and safety concerns in cohorts with larger proportions of students from violent neighborhoods.
Schools function best when all students arrive ready to learn and are able to concentrate on instruction (Sørenson and Hallinan 1977); however, many students, especially in urban areas, are exposed to environments outside of schools that make it difficult to be fully engaged. Exposure to local neighborhood violence is associated with reductions in test scores and increases in stress, depression, and aggression, all of which can lead to disruptive and distracting behavior in the classroom (Aizer 2007; Bell and Jenkins 1993; Bingenheimer, Brennan, and Earls 2005; Bowen and Van Dorn 2002; Guerra, Huesmann, and Spidler 2003; Sharkey 2010).
Given the social nature of schooling, these symptoms not only affect individual students but have the potential to spill over and influence their classmates’ learning, as well. Even a few disruptive or disengaged students have the potential to derail instruction for the entire class (Cohen, Lotan, and Leechor 1989; McFarland 2001). In this study, I use detailed administrative data from five complete cohorts of students in the Chicago Public Schools (CPS; 2002 to 2010), crime data from the Chicago Police Department (CPD), and school-level surveys conducted by the University of Chicago Consortium on Chicago School Research (CCSR) to assess the strength of this peer effect. The estimated negative relationship between peer exposure to neighborhood violence and individual achievement is substantial. These estimates are larger than those of peer neighborhood socioeconomic disadvantage and larger for students from safer neighborhoods. Survey data suggest these results are related to increased reports of disciplinary problems and reductions in perceived safety and teacher trust in cohorts with larger proportions of students from violent neighborhoods.
Estimating the true effect of these spillovers presents methodological difficulties due to the possibility of selection and omitted-variable bias. Students living in violent neighborhoods are likely to be distinct from those in safer neighborhoods, and schools that educate different proportions of these students are likely to differ in ways that are associated with achievement. To adjust for the consequences of this selection bias, I compare students to themselves in different calendar years using individual fixed effects. These models compare the subject-specific composition of students’ classrooms to their achievement in different years. They show that when classmates are exposed to higher levels of neighborhood violence, students’ performance on standardized test scores suffers.
Documenting the relationship between peer exposure to neighborhood violence and individual learning is important for two reasons. First, if the composition of students has a causal effect on achievement, then the sorting of students into and within schools becomes a potential source of educational inequality. Grouping students with behavior problems in the same classroom puts those students at a disadvantage by making some classrooms more conducive to learning than others. While formal tracking is on the decline, recent changes in school assignment policies have led to substantial sorting of students across schools according to their middle school achievement, making it more likely that students with behavior problems and other forms of disadvantage are found in the same classrooms (Lutton 2014). Second, if the effects of violence can be felt in schools across the city (see Burdick-Will 2017), then reducing that violence should be important to residents and policy makers in every neighborhood, not just those with the highest crime rates. In fact, reducing violence in the city may benefit a much larger number of students than one might first assume.
Neighborhood Violence, Peer Behavior, and Achievement
Neighborhood-effects research tends to focus on demographic differences between neighborhoods, such as poverty rates, and points toward geographic and cultural isolation, which socializes youth to subcultural, antiacademic norms and deprives them of the material and institutional resources needed for academic achievement (for reviews, see Johnson 2012; Sampson, Morenoff, and Gannon-Rowley 2002). Recently, neighborhood research has moved beyond poverty measures to examine the relationship between local exposure to violent crime and educational outcomes. For example, Sharkey (2010) shows that local homicides are associated with short-term reductions in performance on standardized tests. Harding (2009) shows that violent-crime rates explain much of the association between neighborhood socioeconomic disadvantage and high school graduation. Burdick-Will (2016) shows that early exposure to neighborhood violence is associated with slower test score growth through high school. Finally, Schwartz and colleagues (2016) show that repeated exposure to local violence leads to increasingly large reductions in test scores.
The primary mechanisms linking local violence and educational outcomes in existing studies are driven by psychological stress and behavioral adaptations intended to provide protection in dangerous streets. Research shows that growing up in a violent neighborhood leads to higher rates of aggression and depression (Aizer 2007; Bell and Jenkins 1993; Bingenheimer et al. 2005; Bowen and Van Dorn 2002; Guerra et al. 2003). This behavior may be the result of a feeling of hypervigilance when it comes to threats and a tendency to interpret others’ actions with a bias toward hostile intent (Margolin and Gordis 2000) or due to neurological responses to stress and fear (LeDoux 2000). Sharkey and colleagues (2012), for example, show that the stress experienced after a local homicide limits attention spans and decreases impulse control.
Adolescents may also use aggressive behavior as a form of protection, to keep others in their neighborhood from bothering them (Anderson 1999; Jones 2004; Harding 2010). However, even if students are just acting tough and are not inclined to engage in disruptive or violent behavior, their fellow students and teachers can misinterpret their demeanor and attitude. This form of cultural misunderstanding has the potential to make everyone in the classroom feel less safe and to undermine the relationships between students and teachers that are necessary to create a productive learning environment (Dance 2002; Devine 1996).
Some students who experience stress and trauma through neighborhood violence may not react in an aggressive manner. Instead, they may withdraw and exhibit internalizing behavioral problems, such as depression, anxiety, and distraction (Phillips and Shonkoff 2000). These behaviors also have the potential to slow the pace of instruction for the entire classroom. Moreover, students dealing with emotional trauma require extra attention from teachers and school counselors, which can detract from the time and resources available for other students (Walkley and Cox 2013).
Neighborhood violence may also influence students’ academic engagement and emotional connections to their school community. A long history of urban ethnographic research suggests that living in a high-crime neighborhood can have a negative impact on interpersonal and institutional trust (Anderson 1999; Bourgois 1995; Goffman 2009; Harding 2010; Sánchez-Jankowski 2008; Venkatesh 2000; Wacquant 2008; see also Kirk and Papachristos 2011; Sampson and Bartusch 1998). In general, these studies describe how residents in high-crime and violent neighborhoods do not trust the police to prevent crime, nor do they trust that individual police officers have their best interests in mind when on patrol (Carr, Napolitano, and Keating 2007). This mistrust appears to extend to teachers and school administrators, as well (Harding 2010). Successful teaching and instruction requires trust and social bonding between students and teachers. When students come to the classroom wary and suspicious, they are more likely to rebel and disrupt the functioning of the classroom (Bidwell 1965; Sørenson and Hallinan 1977; Waller 1932).
The literature on the effects of school composition and peer effects bears much in common with that on neighborhood effects. Both deal with whether and how the characteristics of those around a given area (either as neighbors or classmates) influence an individual’s outcomes. Moreover, traditional discussions of school composition effects tend to focus on relatively similar theoretical mechanisms as those of neighborhood poverty: collective socialization, relative deprivation, and lack of institutional resources. The classic review of neighborhood effects research by Jencks and Mayer (1990:138) is quite explicit about this connection: “Even if neighborhood and school mix were not strongly correlated, we would expect them to have somewhat similar effects because most of the same social processes should be at work in both contexts.” The measures used to assess these effects have equally focused on demographic markers, using the racial composition of the school and the percentage of students receiving free or reduced lunch or living in poverty (Johnson 2012); however, the empirical evidence for the effects of high-poverty schools is as mixed and inconclusive as that of neighborhood poverty. Despite strong cross-sectional correlations between high-poverty schools and achievement (Chaplin 2002; Coleman et al. 1966; Gamoran 1996; Hauser, Sewell, and Alwin 1976; Lee and Smith, 1997), individual-level studies that track student growth show no real effect on learning (Lauen and Gaddis 2013).
Nevertheless, there is growing evidence that stressed, distracted, disengaged, and poorly behaved students, regardless of their socioeconomic background, disrupt instruction and drain resources in ways that make schools less functional. Behavior problems can range from simple lack of attention that slows instruction to violent disruptions that bring all instruction to a halt (Cohen et al. 1989; McFarland 2001).
Because it is difficult to measure classroom environments on a large scale, many quantitative studies of behavioral peer effects rely on clever proxies. For example, Figlio (2007) uses the number of boys with typically female first names as an instrument for disruptive behavior, based on the logic that these boys are more likely to be picked on. Aizer (2009) exploits the plausibly exogenous timing of Attention Deficit Disorder diagnoses and treatment to show that not-yet-diagnosed students are disruptive in the classroom. Carrell and Hoekstra (2010) and Bryk and colleagues (2010) use the concentration of students living in homes with reported domestic violence cases and students in the foster care system, respectively, as proxies for students likely experiencing stressful home situations. Finally, Nomi and Allensworth (2013) exploit policy changes that altered the composition of freshmen math classes and sorted larger numbers of students with disciplinary problems into particular classrooms. These studies all show that students with stressful family lives and discipline problems put a strain on school and classroom resources. Despite the indirect measures of behavior, the range of proxies and methods and the consistency of these relationships suggest that distracted, disruptive, and disengaged students do have a negative effect on their peers’ achievement. Given the documented relationship between neighborhood violence, stress, and behavior, the same added strain on school resources is likely to occur when students live in dangerous neighborhoods.
Data and Measures
The research on neighborhood violence and peer behavior suggests one should expect the influence of neighborhood violence to spread from individual students to peers in the classroom. Stressed, disruptive, antsy, and disengaged students from dangerous neighborhoods can undermine the learning process for the entire classroom. Therefore, this study will attempt to answer the following question: Are there negative spillover effects of neighborhood violence on achievement within a classroom? In other words, to what extent is the average level of neighborhood violence of one’s classroom peers related to reductions in student achievement? To test this spillover hypothesis, it is necessary to bring together data from multiple sources. Specifically, this study uses detailed crime data from CPD, complete administrative files from CPS, and biannual school-level surveys from CCSR. The analytic data set includes the five cohorts of students who were first-time freshmen between the fall of 2002 and 2006. Every student is followed for the four years it should take to complete high school, regardless of actual progress toward graduation.
Student Data
Basic student information, such as gender, race, age, grade, special education designation, census block group ID, and school ID, comes from the CPS administrative files. Everything except race and gender can change over time, including where a student lives and attends school. Changes in school and neighborhood IDs are used to generate indicators for school and residential mobility. Scale scores from annual standardized tests are also recorded in these administrative files. Scale scores on the eighth-grade Illinois Test of Basic Skills are used to measure achievement prior to entering high school. These scale scores are designed to be equivalent for different calendar years, and unlike percentile scores they have no floor or ceiling. During high school, CPS students take three tests: EXPLORE, PLAN, and Prairie State Achievement Examination (PSAE). These tests are designed to be taken in sequence and are scored on a common scale (1 to 36); one year’s gain is supposed to be approximately four points. EXPLORE and PLAN are given to 9th and 10th graders, respectively, a few weeks after the start of the school year each fall. Eleventh graders may take PLAN in the fall, but they are also required to take the PSAE near the end of the school year. A subset of the PSAE contains the ACT used for college admission. These tests have a variety of sections, but this study focuses only on the main sections: reading and math. 1
Crime Data
The crime data come from eight years of location-specific CPD incident reports (September 2001 through August 2009). Counts of violent crime include all homicides, sexual assaults, aggregated and simple batteries, aggravated and simple assaults, and robberies. Census block-group-level crime counts include all violent crimes during one year prior to the start of school in the fall. I use counts rather than rates for two reasons. First, the literature on neighborhood violence focuses on geographic exposure rather than direct victimization or witnessing, and a homicide in front of one’s home will be stressful regardless of how many other people live in the neighborhood. Second, determining the exact population of census block groups on an annual basis is difficult. Linear extrapolation of population counts between the 2000 Census and the 2010 Census will likely be inaccurate, given the dramatic and often sudden population changes in tracts where public housing was closed during this period.
The exact location of a crime may also contain errors, especially when determining on which side of the street a crime took place. Given the small size of Chicago’s block groups (.09 square miles, seven city blocks on average), students likely have some knowledge of and exposure to crimes that take place in adjacent block groups. Therefore, I created a spatially smoothed average of the crime count in each block group and its contiguous block groups. This allows crimes located on either side of the street to count toward the focal block group’s crime count. I then logged this contiguous block group measure. Together, the spatial smoothing and logging reduce the microvariation and skewness of the distributions while leaving quite a bit of variability in crime rates across the city (Figure 1). It also means that a relatively small number of the most extreme values of block-group violent crime are given less weight in the calculation of peer exposure. Measures of peer exposure to neighborhood violence without the transformations, with different timing of violence exposure, and with different neighborhood sizes are all correlated at least at .9 and yield substantively similar results.

Log violent crime in contiguous block groups and peer neighborhood violence in Chicago (September 2006 to August 2007).
Neighborhood Data
I use block-group-level data from the 2000 Census to capture other aspects of students’ neighborhoods and to provide a proxy for students’ socioeconomic background. I created an index of social and economic disadvantage using unemployment and poverty rates, and an index of social status using the average level of adult education and the proportion of adults working in managerial or professional jobs. These measures were standardized to the citywide distribution with a mean of zero and a standard deviation of one, such that neighborhoods with negative values are more disadvantaged. Because these measures come from a single point in time, the only way a student’s neighborhood demographics can change during the study period is by moving to a new neighborhood.
Peer Composition
The analysis defines peers as all other students in each student’s English and math classes. Specifically, peer neighborhood violence is defined by the average neighborhood violence level that all students in the focal student’s classroom experienced that year, excluding themselves:

where i is the focal student, V tgsk is the average violent crime count in neighborhood k and its surrounding block groups in the 12 months leading up to academic year t for students in classroom g and school s, and n is the number of students in that classroom.
As described in more detail in the Methods section, the estimation requires that this peer composition measure vary for students over time. This variation comes from three sources. First, the block-group violent crime count changes from year to year. Even if peers come from the same neighborhoods every year, changes in the local crime rate would lead to annual differences in violence exposure. Violent crime declined substantially throughout Chicago during this period. In 2002 to 2003, the average count of violent crimes in a block group was 83; in 2009 to 2010, it was 59. However, specific neighborhoods rarely experienced steady, monotonic declines. Crime counts bounced up and down quite a bit from year to year within specific block groups and even increased in some parts of the city. Second, students move during high school at different rates every calendar year. Students change schools and homes during the four-year period in ways that change not only an individual student’s exposure to peers but the neighborhood exposure and composition of the peers themselves. Around 4 percent of students change schools each year, and 5 percent change census block groups; 82 percent of students never change schools. Restricting the sample to students who never change schools yields somewhat larger coefficients for peer neighborhood violent crime exposure. Finally, students are sorted into different sections of math and English every year, resulting in somewhat different peer exposure each year. It is possible that students already on a downward trajectory are sorted into classrooms with progressively higher peer neighborhood violence exposure; however, classroom-level peer measures are strongly correlated with neighborhood violence exposure for the whole grade in a school (reading, r = .94; math, r = .89), suggesting that sorting into classrooms by neighborhood violence exposure is not particularly strong. Using a grade-level measure yields almost identical results to those presented here.
In addition to exposure to peer neighborhood violence, I calculated other measures of peer characteristics using the same formulas. These include peer average eighth-grade test scores, neighborhood socioeconomic disadvantage, neighborhood social status, school mobility, and residential mobility. I also included school size to ensure that the composition measures are not just a reflection of larger schools that attract a more diverse student body.
School Climate
School-level measures of school climate are available from surveys that CCSR conducts every other year. Perceived safety at school comes from four survey questions: How safe do you feel (1) outside around the school, (2) traveling to and from school, (3) in the hallways or bathrooms of the school, and (4) in your classroom? A measure that captures peer support asks if students’ classmates treat each other with respect, work together well, and help each other learn; and if other students disrupt class, like to put others down, and do not care about each other. Finally, students report how often during the school year they have gotten into trouble, been sent to the office for getting into trouble, been suspended, or had their parents contacted because they got into trouble. In addition to conducting the in-school surveys, CCSR also uses multilevel Rasch models to convert the measures to a 10-point scale and generate reliable school-level measures that are adjusted for school composition and student-level missing data. CCSR uses the Bigsteps program created by MESA Press at the University of Chicago to develop these measures. 2
Because these surveys are conducted only every other year, including these measures in the main model would severely limit the number of observations per student; however, cross-sectional correlations and school-level analysis over time with these measures provide a rough picture of the relationship between school climate and students’ exposure to neighborhood violence. More detail on these survey measures and how they change over time can be found in Steinberg, Allensworth, and Johnson (2011) and Burdick-Will (2013).
Missing Data
Because this analysis is based on administrative records, only students who remain enrolled in any school in the district, including charter schools, will show up in the annual files. This means the number of students in the data decreases as each cohort advances in grade and students drop out or leave the public school system. By 11th grade, each cohort of students is around 78 percent of its original size. Estimating the models with only students who remain in CPS for all four years yields similar results, and exposure to individual- or grade-level neighborhood violence in a given year does not appear related to the probability that a student leaves the district (Appendix Table A1 in the online version of the article). This may come as a surprise, given prior research on neighborhood violence and high school graduation (Harding 2010). However, it is important to note that leaving, in the administrative data, is not the same as dropping out of school: many students who transfer to another public or private school go on to graduate from high school.
The only individual variables with any nontrivial amount of missingness for years when students are enrolled in the district are the test scores, both as outcomes and as middle school covariates. Approximately 8.4 percent of first-time freshmen in these cohorts are missing eighth-grade test scores. These are largely students who were not enrolled in CPS in that grade, and they are excluded from the analysis. I also excluded observations if the outcome variable was missing. On average, there are approximately 2.5 tests per student. The final analytic data set includes 117,678 students, 291,398 reading scores, and 291,619 math scores. Students who are missing an outcome were somewhat lower achieving in middle school and more likely to be in special education or have repeated a grade, but there is no evidence that the probability of missing a test score or grade is significantly related to the level of peer neighborhood violence.
Methods
Testing for the causal effect of any type of environmental influence is difficult using observational data. Any correlation between school composition and individual achievement may be due to the selection of otherwise similar students into the same school. To account for as much of that selection as possible, I take advantage of the data’s longitudinal nature to adjust for unobserved time-invariant differences between students with an individual fixed-effects model. The model compares the peer exposure and test scores of students in one year to their exposure and achievement in a different year, thereby adjusting for bias from student characteristics that do not change over time, including race, gender, prior achievement, and innate ability:

where Y ti is the achievement outcome (either reading or math test scores) for student i in academic year t; P ti is the average level of log violent crime experienced by the focal student’s peers during the 12 months prior to that academic year (see Equation 1); N ti is the spatially smoothed and logged violent crime count for the prior year in the neighborhood where the student lives; W ti are time-varying student covariates, including age, grade repetition, special education status, school and residential mobility, and neighborhood demographics; E ts is a time-varying measure of the number of students in each school, because school size may be correlated with school attendance patterns, classroom sorting, and achievement; T t is the fixed effects for the calendar year; and S i is student fixed effects. Standard errors are robust and clustered at the student level. 3
School Attendance in Chicago
These fixed-effects models rely on variation over time in the neighborhood composition of Chicago’s high school classrooms. In addition, the theoretical argument that the effects of neighborhood violence spill over among classmates requires that school and neighborhood composition are not interchangeable or entirely overlapping. Across the country, and especially in Chicago, within-district choice policies are breaking down the geographic link between neighborhood and school. Nationally, in 2007, half of all students had some level of choice in their public school (Grady, Bielick, and Aud 2010). In Chicago, an examination of the attendance patterns of a single cohort of eighth graders reveals that only 32 percent of students attended the high school predicted by their residential location, and students from violent neighborhoods were most likely to abandon their neighborhood school in search of alternative educational options. These students attend not only open-enrollment schools, such as charters, magnets, and vocational schools, but also underenrolled traditional neighborhood schools in other parts of the city (Burdick-Will 2017).
In one high-minority, high-poverty, and low-achieving school in the heart of the violent South Side with no magnet programs, nearly one third of the first-time freshman cohort in 2008 came from outside the attendance boundary area. Students traveled up to 15 miles across the city to attend the school, and they came from neighborhoods at all levels of the violent crime distribution. Schools with more formal open enrollment or special programming attract a much higher proportion of students from outside their attendance boundaries. On average, in Chicago, schools educate students from 80 different census tracts in a single cohort. Even traditional neighborhood high schools bring in students from 70 different tracts, on average. Therefore, when considering the joint effects of neighborhood violence and school composition, it is important to understand that these models are not based on small variations in crime rates in the relatively small geographic area of schools’ attendance boundaries. Instead, students are mixing in schools with peers from across the city; many of their peers are from neighborhoods very different from their own in terms of geography and social organization. Figure 1 shows the school-level average peer neighborhood violence measure for one year. Many schools in violent areas draw students from more violent neighborhoods, but there is quite a bit of spatial variability. Crime rates of students’ neighborhoods do not always correspond to the crime rate surrounding a school, and some high-peer-neighborhood-violence schools are right next to low-peer-neighborhood-violence schools.
Furthermore, the mix of students changes from year to year. In Chicago, students may apply to any school in the district, even “neighborhood” schools with stated attendance boundaries. Empty seats in attendance-boundary schools are filled by lottery (CPS 2016). Students frequently apply to multiple schools and do not know where they will enroll until the last minute (Pattillo, Delale-O’Connor, and Butts 2014). This leads to meaningful variation over time in the average neighborhood violence levels across years in the same school. Figure 2 shows the change in students’ exposure to violent crime over time in 15 randomly selected high schools. School composition varies over time, with some schools fluctuating quite a bit from year to year. Even schools without dramatic changes exhibit a decline over time that reflects overall decreasing violent crime rates in Chicago.
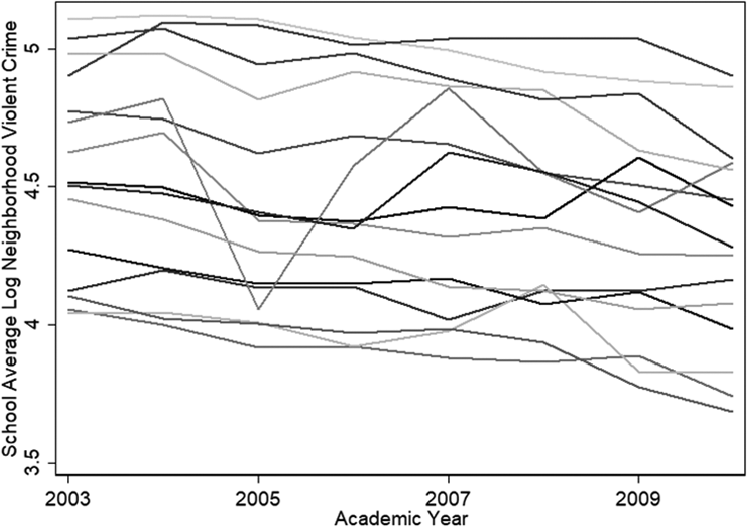
School average log neighborhood violent crime over time.
Results
Descriptive Summary
Table 1 shows a descriptive summary of the analytic data. Each column shows the means and standard deviations for each year in which a student has a test score. Column 1 describes the characteristics of all students included in the analysis, and columns 2 through 4 describe the characteristics of students in schools with high, medium, and low levels of average peer neighborhood violent crime. Cutoffs are determined by the thirds of the school-level neighborhood violence measure. Peer measures of eighth-grade achievement, neighborhood disadvantage, and neighborhood violence are not included because, on average, they mirror the averages of the individual measures.
Student Characteristics by Thirds of Grade, Average Neighborhood Violence.

Source: Author’s calculation based on data from the Chicago Police Department and the Chicago Public Schools, stored at the Consortium on Chicago School Research.
Note: Standard errors in parenthesis.
Overall, approximately half the students are African American and about one third are Hispanic; however, these proportions mask dramatically different ethnic compositions of schools with different levels of average neighborhood violence. Low-neighborhood-violence schools are only around 30 percent African American and 48 percent Hispanic, whereas schools with high levels of average neighborhood violence are, on average, over 94 percent African American and only 5 percent Hispanic. Given the high correlation between violent crime rates and neighborhood disadvantage, it is not surprising that schools with high levels of average neighborhood violent crime serve students from some of the most socially and economically disadvantaged neighborhoods. All achievement measures are higher in low-peer-neighborhood-violence schools.
This relationship between school composition and achievement is confirmed by examining the correlations between the average level of neighborhood violence of students’ peers and their academic outcomes (Appendix Table A2 in the online version of the article). Exposure through peers and where one lives are correlated at about .64, but the measure of peer exposure to neighborhood violence has a stronger relationship with achievement than does the neighborhood where an individual student lives (–.32 vs. –.23 for reading test scores; –.35 vs. –.26 for math test scores). This shows that students’ test scores drop in classrooms with large numbers of students from violent neighborhoods. However, the relationship with tests taken in eighth grade, before students enter high school, is approximately the same size (–.36), which indicates selection of already low-achieving students into schools with high average neighborhood violent crime rates.
Fixed-effects Models
Tables 2 and 3 show the results of the fixed-effects models for each outcome. All coefficients for continuous variables represent standardized effect sizes. The first column for each outcome shows the relationship between having classmates with high levels of neighborhood violence and the achievement outcome, adjusting for time-varying student characteristics and school size. The models show a negative relationship between peer exposure to neighborhood violence and achievement for both subjects, although it is somewhat stronger for math than for reading. One standard-deviation increase in classroom average neighborhood violence predicts a decline of –.024 standard deviations in reading and a –.035 decline in math.
Individual Fixed-effects Results for Reading Standardized Test Scores.

Source: Author’s calculation based on data from the Chicago Police Department and the Chicago Public Schools, stored at the Consortium on Chicago School Research.
Note: All models include individual fixed-effects, calendar-year dummies. All continuous variables are standardized, including the outcome. Standard errors in parentheses are robust and clustered within student.
p < .05. **p < .01. ***p < .001.
Individual Fixed-effects Results for Math Standardized Test Scores.

Source: Author’s calculation based on data from the Chicago Police Department and the Chicago Public Schools, stored at the Consortium on Chicago School Research.
Note: All models include individual fixed-effects, calendar-year dummies. All continuous variables are standardized, including the outcome. Standard errors in parentheses are robust and clustered within student.
p < .05. **p < .01. ***p < .001.
The coefficient for living in a violent neighborhood is substantially smaller than that of peer exposure, although it is comparable in size to other research using in-school standardized test scores (e.g., Sharkey et al. 2014). Note, however, that the timing and crime exposure in this study are designed to measure stress and behavior problems associated with a generally violent area, not the acute trauma of local homicides, which is large but fades relatively quickly (Sharkey 2010). The annual measure of crime with individual fixed effects also fails to capture any lagged effects of earlier exposure (Burdick-Will 2016). Therefore, these estimates may not capture the full effect on achievement of living in a violent neighborhood.
School Climate
School surveys conducted by CCSR every other year provide some insight into the social organization of Chicago’s high schools. Unfortunately, results of these surveys are available only at the school level, and because these surveys are collected only in odd-numbered years, it is impossible to include them in the main models without cutting the sample size in half and severely limiting the number of observations per student. However, this section will examine the relationship between these school-level measures and student composition across schools and within the same school over time. The results provide insight into the ways student exposure to neighborhood violence is related to classroom management and student learning.
Across schools, the average level of student exposure to neighborhood violence is associated with decreases in perceived safety in and around school (r = –.30), increased numbers of students with disciplinary problems (r = .53), and decreased peer support for academic behavior (r = –.45), but it is not strongly related to trust in teachers (r = .02) (Appendix Table A3 in the online version of the article). Table A3 also includes a count of violent crimes reported on school grounds during that academic year. In all cases except reported safety, students’ exposure to neighborhood violence has a stronger relationship with the climate measures than does the reported number of crimes at school. Surprisingly, the number of crimes committed on school grounds and the violence rate in students’ neighborhoods are not strongly correlated (r = .05). This is likely due to a combination of the high variability in crime rates on school grounds from year to year and the scattering of students from violent neighborhoods to a wide range of high schools, including schools with very low campus crime rates.
The longitudinal survey data also allow for comparison of schools to themselves over time. Table 4 reports results of fixed-effects regressions that compare the survey results at a given school in one year to results in the same school in different years. Given the odd-year-only survey collection and the opening and closing of schools during this period, each school has an average of three observations. Despite a strong cross-sectional association, students’ exposure to neighborhood violence is not consistently related to changes in peer support in classroom behavior within the same school over time (β = .11, SE = .24). Changes in students’ exposure to violent neighborhoods is also not related to changes in the violent crime rate on school grounds (β = –.16, SE = .22).
Within-school Relationship between Students’ Neighborhood Violence Exposure and School Surveys.

Source: Author’s calculation based on data from the Chicago Police Department and the Chicago Public Schools, stored at the Consortium on Chicago School Research.
Note: All models include school fixed effects. All variables are standardized, including the outcome. Standard errors in parentheses are robust and clustered within school.
p < .05. **p < .01. ***p < .001.
In contrast, when exposure to violent neighborhoods is higher, students are substantially more likely to report being involved in disciplinary action (β = .28, SE = .12) and are less likely to report feeling safe (β = –.36, SE = .14). Despite no cross-sectional relationship, increases in student exposure to neighborhood violence are related to lower levels of trust that their teachers have their best interests at heart (β = –.40, SE = .23), although this coefficient is only marginally significant. The bottom rows in Table 4 reverse the timing of the survey and student composition. In other words, the survey results in a given year are used to predict the composition of students in the following year. All of these coefficients are substantially smaller than the top rows and imprecisely estimated. This suggests that the composition of students in a year is directly related to changes in the survey measures, and not that students from unsafe neighborhoods are more likely to attend schools with generally higher discipline rates, lower safety ratings, and lower teacher trust. This school-level analysis gives only a rough picture of what is going on inside classrooms. Nevertheless, it does suggest that discipline, safety, and trust are a larger problem in cohorts with larger numbers of students from violent neighborhoods.
Alternative Explanations
Neighborhood or school factors may be related to the concentration of students from violent neighborhoods and may influence peer achievement in other indirect ways. First, classrooms and schools with large numbers of students from violent neighborhoods are likely to have lower levels of student achievement. Research on tracking suggests that being in a classroom with higher-achieving peers has a positive association with individual learning (e.g., Gamoran 1987). Perhaps, rather than violence-induced behavioral problems, all that matters is having high-achieving, academically oriented peers (see Hanushek et al. 2003; Hoxby 2002). Similarly, schools with students from violent neighborhoods likely have much more mobile populations than do other schools. Large proportions of newcomers during the school year can be bad for everyone’s learning (Raudenbush, Jean, and Art 2011). Again, the need to adjust the curriculum to new students could be the problem, rather than exposure to local violence. Some of this peer-achievement and peer-mobility effect could be considered an indirect effect of neighborhood violence (because students from violent neighborhoods tend to be both lower achieving and more mobile), but Model 2 rules out these explanations as the key mechanism linking peer exposure to neighborhood violence and achievement by adjusting for average peer test scores as well as the percentage of students who entered during the school year and who changed neighborhoods during the prior calendar year. Mobile peers are independently associated with small reductions in achievement. Attending a school with high-achieving peers does predict higher math scores but not reading scores.
Much of the research on neighborhood effects argues that isolation in poor neighborhoods collectively socializes youth to subcultural, anti-academic norms and deprives them of the material and institutional resources needed for academic achievement (Jencks and Mayer 1990). Therefore, Model 2 includes adjustments for peer exposure to neighborhood socioeconomic disadvantage and social status. The coefficient for the peer average socioeconomic index is around half the size of the neighborhood violence coefficients: –.018 for reading and –.012 for math.
Another possibility is that the effect on achievement is driven by students bringing their neighborhood fights onto school grounds (Mateu-Gelabert and Lune 2003). Model 2 thus adjusts for the number of violent incidents on school grounds in the year. The coefficients are somewhat smaller than those of peer neighborhood violence and comparable to those reported in previous research (Burdick-Will 2013).
Despite all these adjustments, the coefficient for peer neighborhood violence exposure remains relatively similar. In fact, the coefficient for reading is somewhat larger after introducing the covariates (–.033). This suggests that the behavioral problems related to exposure to neighborhood violence are directly related to classroom learning, and they are not driven by the association with achievement, mobility, material disadvantage, or reported crimes on campus.
Interactions
Model 3 for each outcome adds the interaction term between living in a violent neighborhood and exposure through peers. This interaction can shed light on whether the effect of neighborhood violence spills over within schools and disrupts actual learning, or if it is a form of cumulative disadvantage in which students who are themselves exposed are concentrated in the same schools. The results indicate that the effect of attending a school with many students from violent neighborhoods is larger for students from safer neighborhoods. As the level of neighborhood violence increases, the effect of peer violence decreases. Figure 3 shows the marginal effect of peer neighborhood violence at various levels of individual exposure to neighborhood violence. For students from very safe neighborhoods, one standard-deviation increase in peer neighborhood violence predicts a reduction in test scores of approximately .05 standard deviations for math and .09 standard deviations for reading. The strength of the interaction means that peers from violent neighborhoods have no significant effect on students from high violence neighborhoods. Although there is substantially less variation within schools in eighth-grade achievement (i.e., high-achieving students do not go to low-achieving schools), similar interactions exist with prior achievement (not shown in tables). Higher-achieving students show the largest decreases in test scores when exposed to peers from violent neighborhoods. This is what one would expect if concentrations of students from violent neighborhoods were derailing instruction for everyone. In a counterfactual sense, students who already have trouble concentrating, completing their assignments, and behaving in the classroom are not as likely to be affected by the lack of opportunity to learn. Higher-achieving students and students from safe neighborhoods, on the other hand, have more to lose from exposure to disruptive peers.

Marginal effect of peer neighborhood violence by individual neighborhood violence.
The final model exploits the variation in test timing in different grades to show that longer exposure leads to larger effects. In other words, the longer students are in a classroom with lower-achieving peers, the larger the effect on their learning. This can be evaluated using an interaction between classroom-level neighborhood violence and an indicator for a fall test. Remember, 9th- and 10th-grade tests are taken in the fall, but 11th-grade tests are taken in the spring. Model 4 shows that, indeed, the relationship between peer neighborhood violence and test scores is much stronger for 11th-grade tests taken in the spring than for 9th- and 10th-grade tests taken in the fall. This timing effect seems strongest with respect to reading scores. The coefficient for spring tests is –.11 standard deviations for reading and –.03 standard deviations for math scores. The effects on fall tests are substantially smaller, only around –.01 standard deviations for math and reading. 4 There is no evidence that the influence of peer exposure to neighborhood violence varies by other characteristics, such as race, gender, or neighborhood demographics.
Discussion and Conclusions
Violent crime rates in major U.S. cities have declined substantially over the past two decades (Sharkey 2018), but this decline has spread unevenly across and within cities. Some cities, neighborhoods, and demographic groups continue to face extremely high rates of violence (Friedson and Sharkey 2015). In fact, the national downward trend in violent crime seems to be reversing in some places in recent years. In 2017, for example, Baltimore set a record for its homicide rate (Rector 2017). At the same time, students in urban districts across the country are increasingly offered options to attend schools outside their neighborhoods. These choice programs range from citywide enrollments in charter and magnet schools to out-of-zone admissions to neighborhood schools and boundary-free ranking systems (Grady et al. 2010; Whitehurst 2017).
The findings reported here contribute to the understanding of how these trends in urban violence and school choice interact to produce widespread collateral damage on a scale much larger than a few schools with high crime rates or a few students from the most violent neighborhoods. Specifically, this study documents the extent to which students from a range of neighborhoods come together in schools, and it shows that when students experience higher levels of neighborhood violence, the whole school reports feeling less safe, having more disciplinary problems, and feeling less trust in their teachers. These survey measures help explain the robust relationship between classmates’ exposure to neighborhood violence and the achievement of individual students. One standard deviation increase in classmates’ exposure to neighborhood violence is related to an approximately .03-standard-deviation decline in standardized test scores. This may seem like a small change, but students tend to grow only around .3 standard deviations in reading and .2 standard deviations in math per year. Therefore, these relatively small standardized coefficients represent a reduction of at least one 10th of a year’s growth. The relationship is even stronger for tests taken later in the year (.1 standard deviations), suggesting that longer exposure to peers from violent neighborhoods could lead to even larger cumulative effects. These effects are largest for students who come from the safest neighborhoods.
This study is not without its limitations. Administrative records and official crime statistics provide insight into population-level patterns, but they lack detailed information on students’ backgrounds or direct experiences with violent crime. The school-level surveys provide only a rough picture of what might be going on inside classrooms. More detailed survey or interview data are needed to understand the precise mechanisms linking classmates’ exposure to neighborhood violence, instruction, and achievement. In addition, despite the rigorous adjustments for other measures of peer characteristics and constant differences between students, the methods used here cannot completely rule out dynamic selection processes at work. Unobserved changes in students’ circumstances might be related to both their achievement and their sorting across and within schools in ways that bias the results.
This study also takes place in just one city: Chicago. The levels of violence in Chicago during this period are high, but they are far from unique. According to the 2013 Federal Bureau of Investigation (FBI) Uniform Crime Reports, Chicago’s violent crime rate per capita was comparable to Philadelphia, Miami, and Houston (FBI 2015). Moreover, Chicago’s open-enrollment policies and sorting of students from different neighborhoods into the same schools are not unique: Denver, Boston, and New York all receive higher rankings than Chicago in school choice and competition from the Brookings Institution (Whitehurst 2017). Although it is impossible to know for sure whether the relationships documented here would apply to other cities, the effects of neighborhood violence or disruptive behavior and disengagement might be similar in other locations. In fact, Sharkey (2018) describes how academic performance improved substantially over two decades in a wide range of states that had large declines in crime. The scale of these changes is unlikely to be explained by individual reductions in stress alone.
Despite these limitations, the results presented here show that peer exposure to neighborhood violence is an important predictor of student learning. This study adds to the growing body of evidence that disruptive behavior and peer engagement are more important predictors of school effects than is peer socioeconomic background. Recent studies show that the proportion of students receiving free or reduced lunch in a school is not related to student achievement. Other scholars have interpreted these findings to mean that school composition does not matter (Lauen and Gaddis 2012; Wodtke and Parbst 2017); however, free-lunch status is a poor proxy for the kinds of social and emotional development that are important for classroom learning. When a poor student and a nonpoor student are in a class together, the nonpoor student does not necessarily learn less, but when a disruptive or disengaged student is in the classroom, instruction is likely to be derailed in a way that influences both students’ learning. Developing better indicators for peer background and behavior, and understanding their influence on learning, is especially important in an era of accountability, where students, teachers, and schools face potentially severe consequences for low standardized test scores.
Finally, these results show that reducing violent crime in the city of Chicago has the potential to improve the achievement of all students, not just those who are directly exposed to violence. The spillover effects of neighborhood violence make increased spending to improve safety in the most dangerous neighborhoods a cost-effective proposal with regard to academic achievement. Not only would it help the students who live in these neighborhoods, but it would also help their classmates who live elsewhere. This study shows that violent crime in a city may be spatially concentrated, but the effects of that violence are not. Social problems in one area cannot be easily contained; they influence the educational opportunities of students across the city. Addressing these problems should thus be everyone’s concern. Urban violence is not just a policing problem that exists in a vacuum; its consequences spread to many other social spheres, including education.
Supplemental Material
SoE779063_Online_appendices_CLN – Supplemental material for Neighborhood Violence, Peer Effects, and Academic Achievement in Chicago
Supplemental material, SoE779063_Online_appendices_CLN for Neighborhood Violence, Peer Effects, and Academic Achievement in Chicago by Julia Burdick-Will in Sociology of Education
Footnotes
Acknowledgements
I thank Stephen Raudenbush, Mario Small, Jens Ludwig, Stephen Morgan, Ann Golladay, the participants in the New York University Institute of Education Sciences–funded Predoctoral Interdisciplinary Research Training Seminar, and the University of Chicago Consortium on Chicago School Research for invaluable feedback on this project.
Funding
The author disclosed receipt of the following financial support for the research, authorship, and/or publication of this article: This research was funded indirectly by a predoctoral fellowship from the Institute for Educational Sciences, the Population Studies and Training Center at Brown University, and the Hopkins Population Center. The contents of this manuscript do not reflect the views or policies of the Consortium on Chicago School Research, Chicago Public Schools, or the Chicago Police Department. All errors and opinions are my own.
Notes
Supplemental Material
The appendices are available in the online version of the article.
Author Biography
References
Supplementary Material
Please find the following supplemental material available below.
For Open Access articles published under a Creative Commons License, all supplemental material carries the same license as the article it is associated with.
For non-Open Access articles published, all supplemental material carries a non-exclusive license, and permission requests for re-use of supplemental material or any part of supplemental material shall be sent directly to the copyright owner as specified in the copyright notice associated with the article.