



Abstract
Research on college admissions shows that all students tend to benefit from overmatching, but high-status students are most likely to be overmatched, and low-status students are most likely to be undermatched. This study examines whether mismatching takes place when students are sorted into classrooms in middle school. Given prior research on effectively maintained inequality, we theorize that classroom sorting acts as an opportunity for privileged parents to obtain a qualitative advantage for their children. Our research uses administrative data from Indiana and hierarchical linear models to analyze classroom mismatch in sixth through eighth grades. We find that privileged students are more likely to be overmatched in both math and English language arts (ELA) classrooms but that overmatching is beneficial in math but detrimental in ELA. This suggests that inequality can be effectively maintained only if parents have an accurate understanding of what constitutes an advantage.
Keywords
Privileged families, or families whose race and socioeconomic status (SES) are associated with historical and current social and economic advantage, frequently attempt to subvert seemingly meritocratic education structures to gain advantages for their children, and those structures tend to accommodate this maneuvering (Alon 2009; Gamoran 2001; Mare 1981). This can range from leveraging network connections to gain access to a prestigious pre-K center to committing criminal fraud to secure a seat at a selective university. Effectively maintained inequality (EMI) is a useful theoretical model that emphasizes the need to examine qualitative differences in educational opportunity (i.e., the prestige of a degree-granting institution) that provide alternative methods of achieving educational advantage when quantitative advantages (i.e., years of schooling or degree level) are unavailable (Lucas 2001; Lucas and Byrne 2017). This is certainly true in the case of college admission, where the increasing prevalence of bachelor’s degrees has magnified differences in institution quality. Research on students’ access to selective colleges and universities often focuses on “overmatching,” that is, students attending a college or university more rigorous than their grades or test scores indicate they should. Recent research shows that all students, no matter their SES, benefit from overmatching at the college level (Alon and Tienda 2005; Fischer and Massey 2007; Kurlaender and Grodsky 2013), but high-status students are most likely to be overmatched (Brand and Xie 2010). Is the same true for grade school students?
Given that the process whereby students are sorted into classrooms within a school represents an opportunity to gain a qualitative educational advantage (Gamoran and Mare 1989; Kalogrides and Loeb 2013; Lucas and Berends 2002), EMI applied at the grade school level would predict that privileged students are more likely than their less privileged peers to be placed in classrooms that provide the greatest benefit. If classroom matching and mismatching run parallel to postsecondary overmatching, classrooms with more advanced peers would provide benefits to any student, but more privileged students would be more likely to be overmatched. This outcome would provide evidence that, despite differences in access, mechanisms, outcomes, and life stage, institution sorting at the college level and the grade school level neatly parallel one another, thereby showing that EMI operates consistently across distinct instances of student sorting. If differences by context lead to divergent trends, those differences would provide insight into how inequality maintenance in schools differs depending on the schooling context, which might entail adjusting EMI as a theoretical framework.
To examine this, we use statewide census data on middle school students and a two-stage analysis to determine the effect of classroom mismatching as well as who is likely to be mismatched. We focus on middle school because it is the earliest schooling stage where classrooms are specialized, so student achievement in a specific subject can be connected with a classroom dedicated to that subject. Our first analysis uses a multilevel model of student achievement growth as a function of classroom placement. Our use of mean-centered treatment variables allows us to identify the distinct effect of being overmatched, undermatched, and appropriately matched to a middle school classroom on student achievement by comparing students to themselves over time. We then model the relationship between student demographic characteristics and classroom placement net of previous-year test score.
In both math and English language arts (ELA), privileged students are more likely to be in a more advanced classroom than one would expect given previous performance, and the inverse is true for less privileged students. In terms of the benefits of being overmatched, we find significant variation by subject matter. In math, our findings align closely with work on postsecondary mismatch: Students tend to learn more when overmatched and less when undermatched relative to their own performance when appropriately matched. In ELA, students perform best in classrooms that match their previously demonstrated ability, and they underperform when they are both over- and undermatched. Our findings indicate that more privileged students have greater access to advanced classrooms, but the benefit of advanced classrooms is not uniform. Inequality is effectively maintained only insofar as privileged families have an accurate conception of what constitutes an advantage.
Background
Education Structure and Effectively Maintained Inequality
Effectively maintained inequality views education systems as a series of structurally advantaged or disadvantaged positions that enable the maintenance of social inequality (Lucas 2001). This perspective is supported by evidence that the inequality embedded in the contemporary education system is both a cause and a result of increasing economic inequality in the United States (Reardon 2011). Yet education as a mechanism for inequality has proven far more complex than the simple notion that privileged students receive better instruction, and scholars continue to debate how effectively and in what contexts educational inequalities are maintained (Boliver 2011; Downey and Condron 2016; Hamilton, Roska, and Nielsen 2018; Marks 2013; Thomsen 2015).
The nonrandom sorting of students across schools is possibly the most common phenomenon to be examined as a site for the maintenance of social stratification. The seminal Coleman Report (Coleman et al. 1966) attributed one third of the variation in test scores to school-level clustering; however, in an important trend for research in the stratification of education, the authors identify peer composition, not educator or instruction quality, as the primary reason for the differential effect of school placement. The results of the Coleman Report have generally held up to scrutiny, with some scholars claiming that, if anything, Coleman understates the role of schools and student composition (Borman and Dowling 2010; Konstantopoulos and Borman 2011). Similarly, scholarship has examined private schooling as a route for privileged families to preserve their position, although once again, researchers emphasize the role of peers and fail to identify measurable differences in the quality of instruction as a key mechanism for the advantage of private schooling (Gamoran 1996). A similar pattern has arisen in postsecondary education research: Researchers cite the competition for undergraduate admissions as an avenue for privileged families to maintain their position (Golden 2007; Massey et al. 2003), but evidence points to peer composition, not instruction quality, as the source of stratification of college outcomes (Dale and Krueger 2011).
A serious flaw in previous work on inequality maintenance is that it often assumes families, or at least privileged families, have perfect information about which structural positions represent an advantage for their children. In some cases this is entirely reasonable: Privileged families attempt to maintain inequality when they leverage their resources to gain an advantage in admissions at elite universities (Golden 2007). This attempt at inequality maintenance is effective not only because the admissions process allows for the leveraging of these resources but also because the outcome in question, schooling and a degree from an elite school, benefits students (Dale and Krueger 2011). Education scholars, however, rarely have perfect information about what is most beneficial for students, so it is unlikely privileged families have such information. The imperfect link between perceived advantage and actual advantage brings us to the original example of inequality used to develop EMI: the sorting of students into classrooms (Lucas 2001).
Student Assignment to Classrooms
The process by which students are assigned to classrooms and teachers is often opaque, and it can vary substantially depending on the school in question. School administrators often view classroom assignment as driven by the desire to reduce classroom heterogeneity in order to match hierarchical curriculum structures, although researchers are often skeptical of this claim (Brantlinger 2003; Kao and Thompson 2003; Oakes and Guiton 1995). Research on the cause and effect of student placement into classrooms often focuses on the context of formal tracking regimes, and track assignment is one of the original examples used by Lucas (2001) in the introduction of EMI. Formal tracking explicitly designates certain classrooms within a school as more advanced than others, usually with the assumption that students in those classes are capable of learning at a faster rate than their peers.
Evidence suggests that student ability, engagement, and effort are the best predictors of track assignment (Archbald, Glutting, and Qian 2009; Carbonaro 2005) and that reducing classroom-level heterogeneity can have an independent overall benefit for classroom instruction (Lavy, Paserman, and Schlosser 2012; Slavin 1990). That said, research aimed at identifying the effects of tracking policies tends to view tracking as reinforcing existing inequality among students (Gamoran and Mare 1989; Oakes 2005; Rosenbaum 1975). Ample evidence shows that students’ nonacademic characteristics play a role in track placement, especially student race and SES (Lucas 2001; Lucas and Berends 2002) as well as parent involvement in school (Useem 1992). These findings provide evidence that formal tracking acts as a structural mechanism for the reproduction of inequality.
In the absence of formal tracking, the effect of class placement on student outcomes is less clear. Even when formal tracking is not present, there is evidence that systematic sorting of students into classrooms takes place. This de facto tracking is similar to formal tracking in that academic aptitude is the primary reason for sorting, but family background and resources are also significant predictors of sorting into classrooms (Lucas and Berends 2002). One driver of this trend seems to be variation in teacher qualifications: More advanced and advantaged students are more likely to be placed with more qualified teachers (Kalogrides and Loeb 2013; Kalogrides, Loeb, and Béteille 2013).
Scholars mainly cite peer composition (Dar and Resh 1986; Leiter 1983), as well as the nonrandom sorting of teachers to classrooms (Kalogrides et al. 2013; Kalogrides and Loeb 2013), as a mechanism for why classroom assignment affects student achievement. More recent work goes into greater detail, with some research showing that placement with lower-achieving peers results in lower teacher expectations (Kelly and Carbonaro 2012). Other work finds track placement has an independent effect on students’ academic self-concept (Chiu et al. 2008), which then alters student engagement and, ultimately, achievement.
Given the mechanisms through which formal tracking affects student achievement, it is unclear whether peer effects in the absence of formal tracking affect student achievement. There is some evidence that classroom peers can have a marked effect on a student’s learning in the absence of formal tracking (Burke and Sass 2013). Additionally, research using administrative data from North Carolina has identified the increased involvement of peers’ parents in students’ lives as another mechanism between class placement and student achievement (Fruehwirth 2016). This work must be weighed against research showing a frog pond effect: Without the signaling effect of track placement, having close peers who are higher achievers can actually reduce a student’s academic self-concept, with a resulting decrease in engagement and achievement (Goldsmith 2011). Although typically applied to student sorting into schools, there is some evidence that high-achieving classrooms can negatively affect the self-concept of students who compare unfavorably to their peers (Marsh, Köller, and Baumert 2001). Due to a lack of work on the effect of classroom assignment in the absence of formal tracks, it is unclear whether and how peer achievement affects student achievement, making it difficult to identify the sort of classroom placement that constitutes an advantage.
Mismatching in Higher Education
Questions abound about the outcomes related to sorting and inequality in secondary schooling, so we turn to the literature on between-institution sorting in postsecondary schooling to inform this study. Mismatch theory, a much-discussed aspect of college admissions, is intimately connected to inequality maintenance; it primarily denotes students who attend colleges or universities whose quantitative measures do not match the students’ cognitive ability. Some scholars argue that overmatched students, or students attending universities where course work might be too rigorous for them, are more likely to drop out (Light and Strayer 2000). More recent research disputes such claims and shows that students tend to earn higher grades and are more likely to graduate from the most rigorous college or university available to them (Alon and Tienda 2005; Fischer and Massey 2007; Kurlaender and Grodsky 2013). Furthermore, studies show that less privileged students, who are least likely to receive an elite education, are the most likely to benefit from it (Brand and Xie 2010).
Despite some public assertions that college overmatching is typically a phenomenon experienced by underrepresented minorities, it is actually privileged students who are more likely to be overmatched. Dillon and Smith (2017) find that students who face financial, geographic, and informational constraints are more likely to be undermatched, or to attend a less selective college or university, than quantitative measures of their academic ability would suggest. Far from a rare phenomenon, research on college undermatching estimates that 41 percent of college-bound students, most of whom come from low-SES backgrounds, undermatch in their college placement (Smith, Pender, and Howell 2013). Economically advantaged students, however, are more likely to be overmatched (Smith and Dillon 2017). One source of differential access to overmatched universities is legacy admissions. Massey and Mooney (2007), who test the mismatch hypothesis in light of preferential admissions for underrepresented minorities, legacies, and athletes at elite schools, find that only preference for legacy applicants drives acceptance of underperforming students. Because legacy students are disproportionately white and from high-SES backgrounds (Massey and Mooney 2007), this research provides further evidence that college overmatching acts as a structural opportunity that disproportionally benefits individuals who are already advantaged, thereby perpetuating inequality.
Consistent with EMI, this previous work on mismatching in colleges and universities finds that privileged families use every tool at their disposal to ensure their children are most likely to be overmatched. Low-SES and minority students, who are less likely to understand or be able to navigate the complex system of college admissions, end up undermatched. Privileged students thus gain differential access to a qualitative educational advantage: a more selective bachelor’s degree. This system relies on privileged families being able to influence the college application process, viewing acceptance to a selective school as a benefit, and being correct in that view. For EMI to hold, all three must be true. This is the case with college admissions, but it remains to be seen whether the three conditions hold when middle-grade students are assigned to classrooms.
Student–Classroom Mismatch as Inequality Maintenance
The sorting of middle-grade students into classrooms and the sorting of students into colleges and universities have a number of parallels. Both processes present as meritocracies but rely on an ambiguous system that is not made explicitly clear to those involved and is not consistent across institutions. Also, both have a profound effect on students’ schooling experiences and engender a great deal of parent involvement. Traditionally, EMI would predict that privileged families leverage their cultural, social, and economic capital to expand their access to whichever setting provides the greatest benefit to their children.
Yet the two sorting processes are far from identical. The onus for applying to colleges and universities falls almost entirely on students and parents, with a substantial portion of families not taking part in the process at all. Also, there are easily identifiable ways to convert economic capital to an advantage in postsecondary admissions, ranging from test preparation courses to donating money to universities (Golden 2007). In classroom sorting in secondary schools, school administrators are the primary actors, and there is no clear equivalent to an expensive SAT preparation course that provides students a near guaranteed but costly advantage. It is possible that the greater involvement of school administrators inhibits resourced parents’ efforts to gain access to advanced classrooms.
Related to differences in the selection process, the outcomes parents hope to gain from favorable classroom assignments are distinct from those gained from selective college attendance. Scholars tend to view student achievement, sometimes by way of higher motivation or greater academic self-concept, as the main stakes in assignment to secondary classrooms. Work on mismatching in college and university admissions generally uses graduation rates, postgraduation employment, and postgraduation income as the outcomes of interest, but it is questionable whether mismatch in grade school confers parallel benefits. Trends that counteract the benefit of academic rigor, like frog pond effects, might have a greater effect on achievement than on college graduation or postgraduation economic status.
If the two sorting processes operate in a similar fashion, we would expect poor and underrepresented minority students to be systematically sorted into classrooms with lower average test scores than would be expected if sorting took place based solely on previously established achievement. Conversely, white, Asian, and nonpoor students would be sorted into higher-achieving classrooms than we would expect if achievement was the sole criterion for classroom placement. Thus, the first stage of our analysis tests whether classroom mismatch has an independent effect on student learning, regardless of who is mismatched. The second stage focuses on whether, net of previous achievement differences, privileged students are more likely to be overmatched and disadvantaged students are more likely to be undermatched.
Data
To address these questions, we use administrative data from the Indiana Department of Education (IDOE), which includes information on schools and students. These data are collected in concert with the administration of the Indiana Statewide Testing for Educational Progress (ISTEP+) testing regimen, which is a No Child Left Behind–mandated standardized test taken by third- through eighth-grade students near the end of each school year, though we restrict our analysis to grades six through eight. Relevant data for this project were collected annually from the 2010 academic year (AY) until the 2016 AY. Student data are linked to the math and ELA classrooms in which they participated. The IDOE provided each school’s National Center for Education Statistics identification number, so these data were linked to the Common Core of Data with its school-level variables. A key advantage of this data set is its nested design, with years within students within classrooms within schools within districts. An additional advantage is that Indiana’s student population is relatively similar to the United States as a whole. Black and Latino students make up 11 and 10 percent of Indiana’s student population, respectively, and 47 percent of Indiana’s students qualify for free or reduced lunch (FRL). This compares relatively well to the U.S. student population, which is 14 percent black, 25 percent Latino, and 52 percent FRL (National Center for Education Statistics 2018). Indiana has a blend of rural areas, “rust belt” towns, and one major urban area (Indianapolis), and a sizable part of the Chicago metropolitan area spills over in the northwest part of the state.
Measures
The dependent variable used to predict the effect of classroom mismatch is spring ISTEP+ ELA and math scores. These scores range from 140 to 830 and are vertically equated, so students can expect their scores to increase each year. Classroom mismatch is measured using student test scores from the previous spring, before any effect of being in a given class can take effect. To identify students’ pretreatment position relative to the classroom average, we take their previous score and subtract it from the classroom median previous score. 1 Median score is used here to avoid any systematic outlier effect on classroom average achievement. The resulting variable indicates students’ distance from their classroom’s average pretreatment achievement, with a positive value indicating a student is undermatched and a negative value indicating a student is overmatched. This variable acts as the dependent variable in the second stage. To estimate the first stage of our analysis, we demean this student-distance variable at the student level. In other words, for each student, we calculate the mean of the mismatch measure across the student’s three cases, then subtract that mean from each case value. Figure 1 displays the distribution of this key variable, in both its raw and demeaned forms. To illustrate, a student with a raw value of 50, an uncommon but not unheard-of occurrence, scored 50 points higher on the ISTEP+ in the previous fall than the classroom median lagged ISTEP+ score. This indicates the student demonstrated a level of achievement far above classroom peers, meaning the student is undermatched. The distribution of demeaned values indicates that although students do vary in their own classroom placement situation over the course of middle school, this variation is substantially lower than the variation across students.

Proportion of cases by classroom placement.
In the second stage, we measure how student characteristics predict student mismatch. These characteristics include student sex and race-ethnicity; the categories for these variables match standard federal guidelines. Also included are indicators of special education status (SPED), limited English proficiency status (LEP), and whether a student qualifies for FRL, which entails having a household income below 185 percent of the poverty line. The FRL cutoff was $46,435 annually for a family of four in the 48 contiguous U.S. states in the 2018 AY. Of these student characteristics, only those that vary over time are included as controls in the first stage of our analysis due to the nature of our model; this excludes student race-ethnicity and sex.
Analytic Sample
This data set includes all cases of students who took the ISTEP+ in Indiana between AY 2010 and AY 2016. Students who did not take the ISTEP+ due to severe special education needs or parents opting their student out of the test are excluded. The 2010 AY is used as the starting point because this was the first year to involve collection of classroom placement. Students who moved across classrooms over the course of the year are dropped from the sample, as the presence of multiple classroom distributions and medians makes it difficult to identify what value to assign these students for the student placement variable. Data from private, alternative, and charter schools are excluded from the analysis for simplicity and due to concern that the process being analyzed varies depending on school sector. At this stage, we have 996,270 year-specific cases representing 376,433 students eligible for inclusion in our analytic sample.
A number of classrooms have fewer than 10 students, and a much smaller number have more than 40 students (with a maximum of 325); these make up 7.8 and 0.3 percent of classrooms, respectively. To restrict our analysis to traditional classrooms, we drop students in such classrooms. We also remove students whose race-ethnicity and sex change over time (0.6 and 0.1 percent of cases, respectively), due to concern that these changes represent data filing errors and not changes in student identity. Given our focus on the middle school level, where most classrooms are specialized by subject, we also drop the 1.9 percent of classrooms classified as general education, with all subjects taught by a single teacher. We then run listwise deletion on all independent variables, which eliminates 1,864 cases (0.3 percent of cases). Finally, to estimate growth trajectories, we identify and keep only students who are in the same school in sixth, seventh, and eighth grades; take those grades sequentially over three years (i.e., are not retained); are in only one math class and one ELA class each year; have complete data for each year; and have fifth-grade test score data so we can calculate their sixth-grade class placement. The resulting analytic sample includes 442,784 cases for 140,928 students. Students in our analytic sample are more likely to be white, less likely to be poor, and less likely to be designated as special education than we would expect, given the overall population of Indiana schools (see Table 1).
Means and Standard Deviations for Student Characteristics.
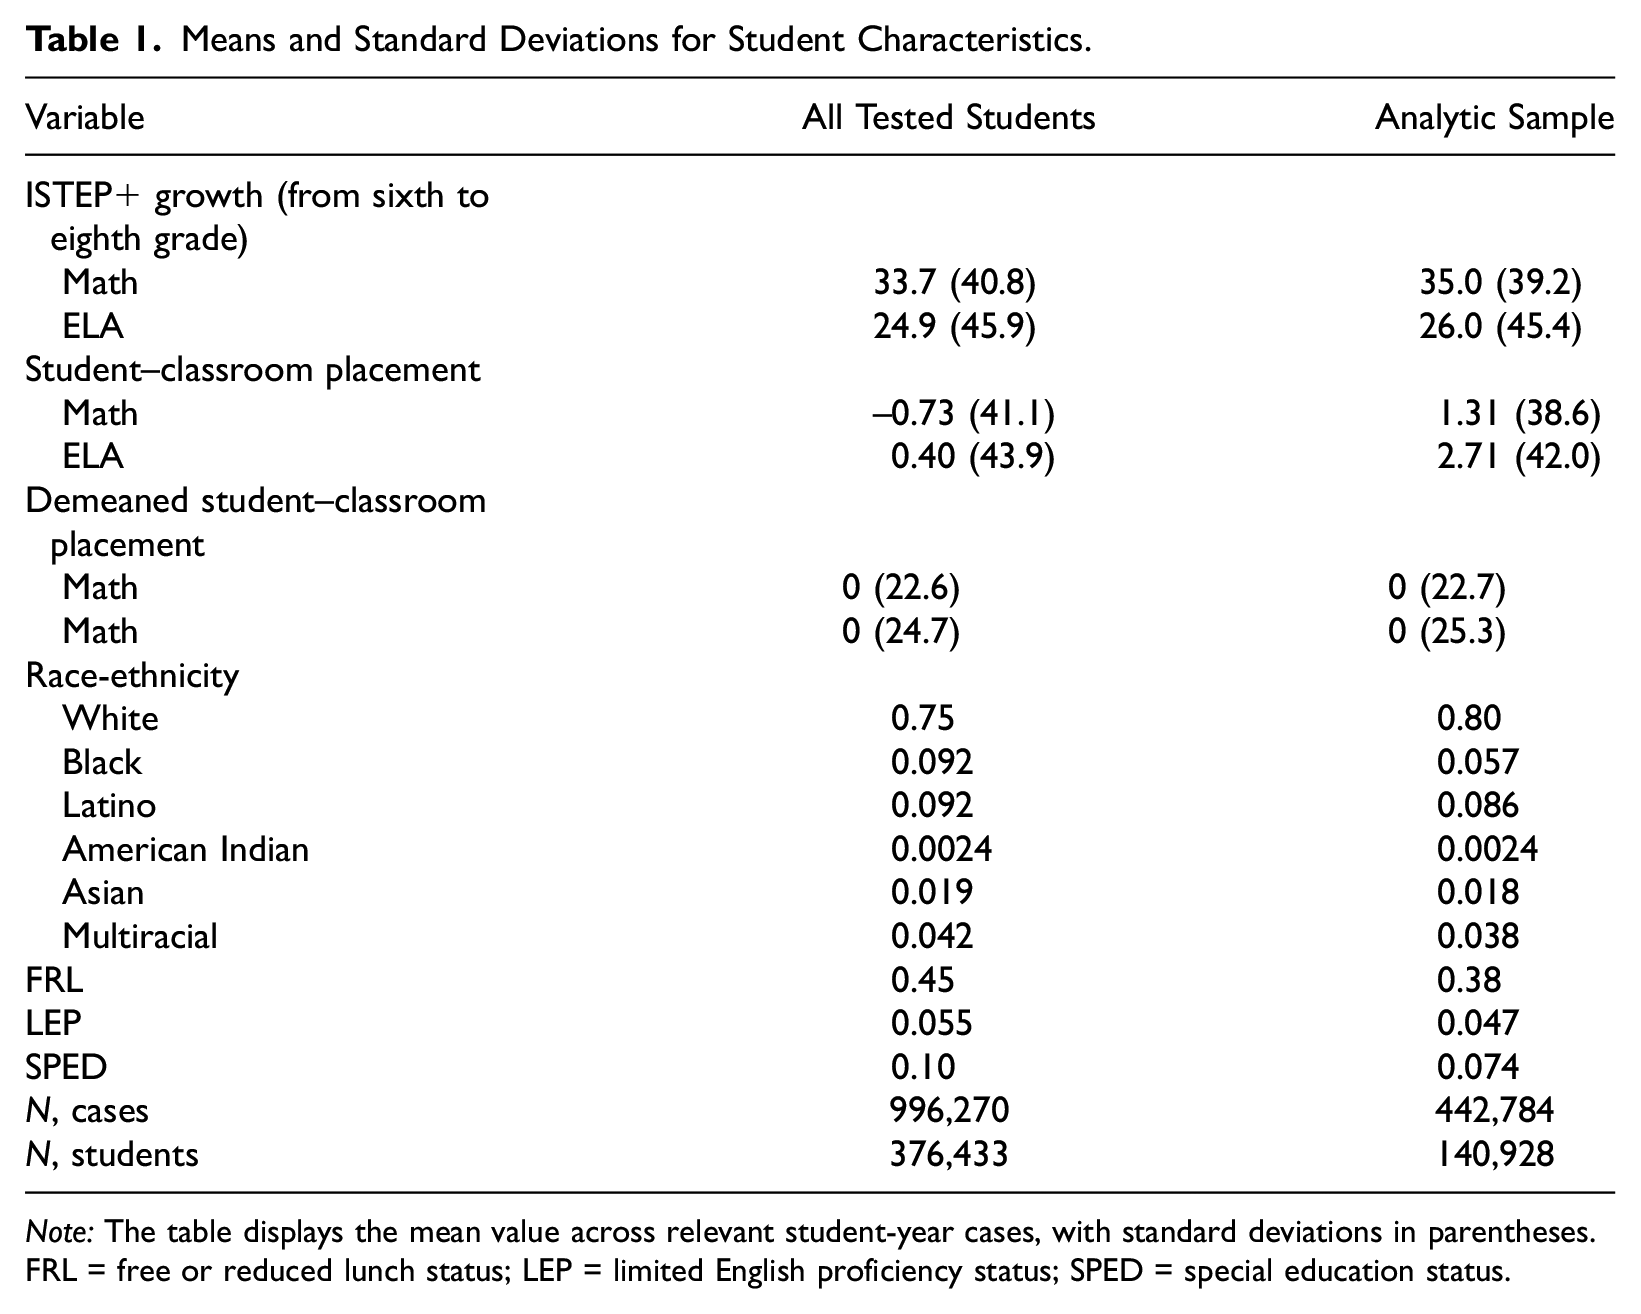
Note: The table displays the mean value across relevant student-year cases, with standard deviations in parentheses. FRL = free or reduced lunch status; LEP = limited English proficiency status; SPED = special education status.
There are two key benefits to such a reduction in data. First, it allows for an increase in internal validity. The process of students being sorted into classrooms necessarily comes after a process that sorts students into schools, and the school sorting process likely has profound implications for whether students have the opportunity to be over- or undermatched. Further examination of school sorting is worthwhile, but here we focus on identifying the effect of classroom mismatch net of the school sorting process. Excluding students who change schools means students are perfectly nested within schools over time. This allows student demeaning to also exclude all between-school differences in opportunities to be over- or undermatched, which helps correct for our lack of information on whether schools utilize formal tracking. The process of classroom mismatching probably has differing causes and effects in schools with formal tracking mechanisms, but the state of Indiana does not collect data on the presence of formal tracking. Although we are unable to analyze heterogeneity based on whether or not schools track, the removal of between-school differences removes differences in tracking across schools as a confounding variable.
Our second reason for using a cohort data set with complete data is the amount of student-level data required to estimate a hierarchical linear model (HLM) with four levels. Four-level HLMs like the one used here are unusual in social science research, partially owing to the complicated data required to estimate such complex variance parameters. In a supplementary analysis where we included students who change schools or repeat a grade, the number of cases rose to 1,100,943. 2 Paradoxically, this resulted in a reduced amount of information in the calculation of the variance parameters, as the mean number of cases per student cluster decreased from 3 to 1.9. As such, the models would not converge, although the resulting estimates matched those presented here, with the significance and direction of key findings remaining the same. To work around these convergence issues, we estimated models without adjusting for classroom or school-level clustering, taking into account only clustering at the student level. The results presented here are robust to this model specification; this was the case for the analytic sample and the larger supplementary sample (not shown; available upon request).
Analysis
Classroom Assignment and Student Achievement
The first stage of our analysis uses an HLM with a growth curve framework (Raudenbush and Bryk 2002; Singer and Willett 2003). The longitudinal nature of our data, where time points are nested within students, classrooms, and schools, allows us to model learning trajectories over time. We conceptualize schooling inputs as altering a student’s learning trajectory, and we use within-student variation in classroom placement to estimate the effect of classroom placement. To identify the effect of class placement and student achievement net of time-invariant student characteristics, we demean, or group-mean center, our measure of class placement. By subtracting a student’s value for this variable from the student’s own mean value over three time points, we are able to model how within-student change in class placement alters a student’s learning trajectory (Ready 2010).
Use of a demeaned key independent variable has benefits and drawbacks. The main benefit is the increase in internal validity. Demeaning classroom placement focuses the analysis on how changes in classroom placement over the course of students’ time in middle school affects their learning trajectories. As a result of this and our removal of students who change schools, both measured and unmeasured time-invariant variables are entirely removed from the model. The most important confounders removed are student SES and all other time-invariant family traits. Demeaning comes at a cost: We present evidence that students are systematically under- and overmatched, but demeaning removes this systematic variation and leaves only variation in classroom placement that is endogenous to student background characteristics. In effect, students who are consistently over- or undermatched are removed from the model. If consistent under or overmatching has distinct effects from the effect of a student shift in class placement from one year to the next, it will not be evident in our model. We cannot discount this possibility, but the increased internal validity gained is well worth the cost; in a series of supplemental analyses, we find that unmeasured confounders undermine analyses that do not include such adjustment for selection into classrooms (see Appendix A in the online supplement for more details).
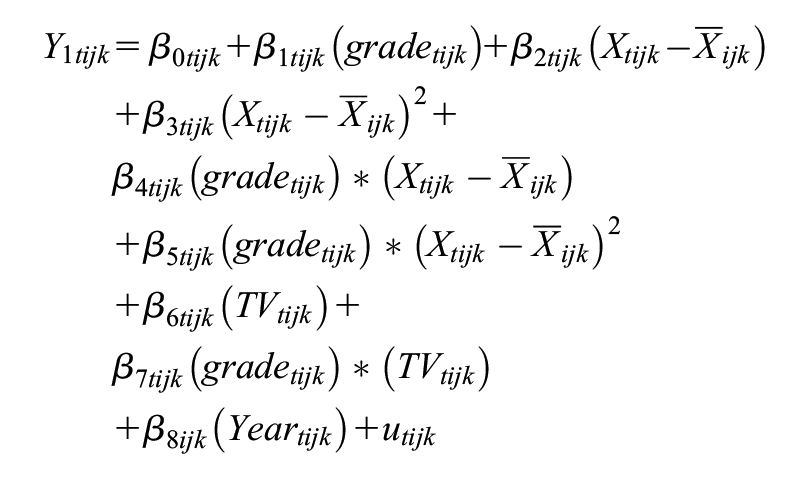
The following model predicts each student’s achievement trajectory as the student moves across classrooms within middle school:
Level 1:
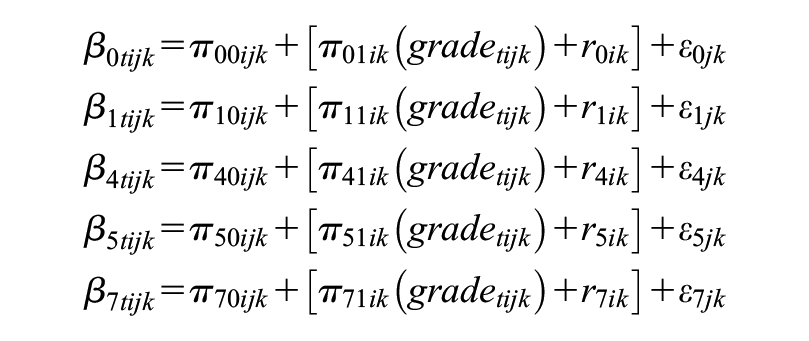
Level 2:
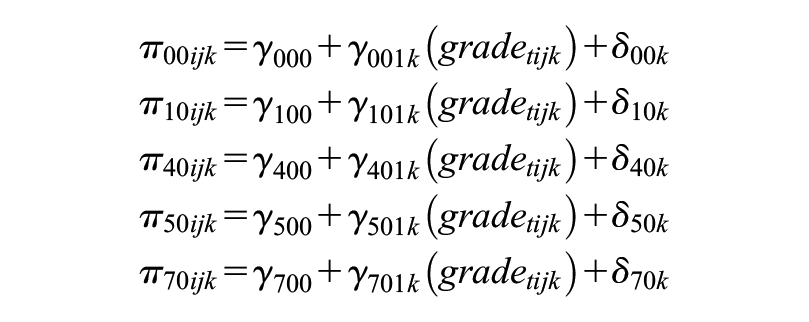
Level 3:
where the test scores (Y1tijk) of students (i) across time points (t), classrooms (j), and schools (k) are a function of students’ distance from their current-year classroom median test score (Xtijk) subtracted from their mean overall value for the same variable across a student’s three cases (
To account for multilevel clustering, and to allow for our estimation of classroom placement effects to vary across students’ time in school, we allow for the case-specific constant (β0tijk) and all grade-dependent coefficients to vary by student, classroom, and school. Our Level 2 equations account for the clustering of cases within students and within classrooms. A relatively unique aspect of the data is the crossed nature of our student and classroom clusters: The classroom ID in these data identifies a combination of students unique to any given year. So classrooms, meaning organizational unit instead of the physical room, exist for only one year. Thus, our first Level 2 equation allows the Level 1 constant (β0tijk) to vary based on the unique effect of grade for each student (π01ik). This function also partitions the error term, attributing unique proportions to the student (r0ik) and classroom (ε0jk) cluster. This process is repeated for each relevant Level 1 coefficient.
To adjust for cases, students, and classrooms being perfectly clustered within schools, we allow all Level 2 constant terms to vary. The first Level 2 constant (π00ijk) is a function of the school-level average test score (γ000), the unique effect of grade placement in a given school (γ001k), and the portion of the error term that can be attributed to clustering within schools (δ00k). All Level 2 constants are allowed to vary using a similar method.
Effect of Classroom Mismatch
The second stage of analysis predicts students’ class placement net of their previously demonstrated ability. To estimate which student characteristics predict mismatching net of school differences in class placement, we estimate an ordinary least squares (OLS) regression with school and year-grade fixed effects:

where Y2tijk is classroom placement in time t for student i in classroom j in school k. Class placement is regressed on a vector of time-varying student characteristics (TV tijk ), a vector of time-invariant student characteristics (TI ijk ), and a student’s test score from the previous year (Score(t–1)ijk); θ tijk represents year-by-grade fixed effects, τ k represents school fixed effects, and utijk is the error term, which is adjusted for the clustering of cases within students.
Results
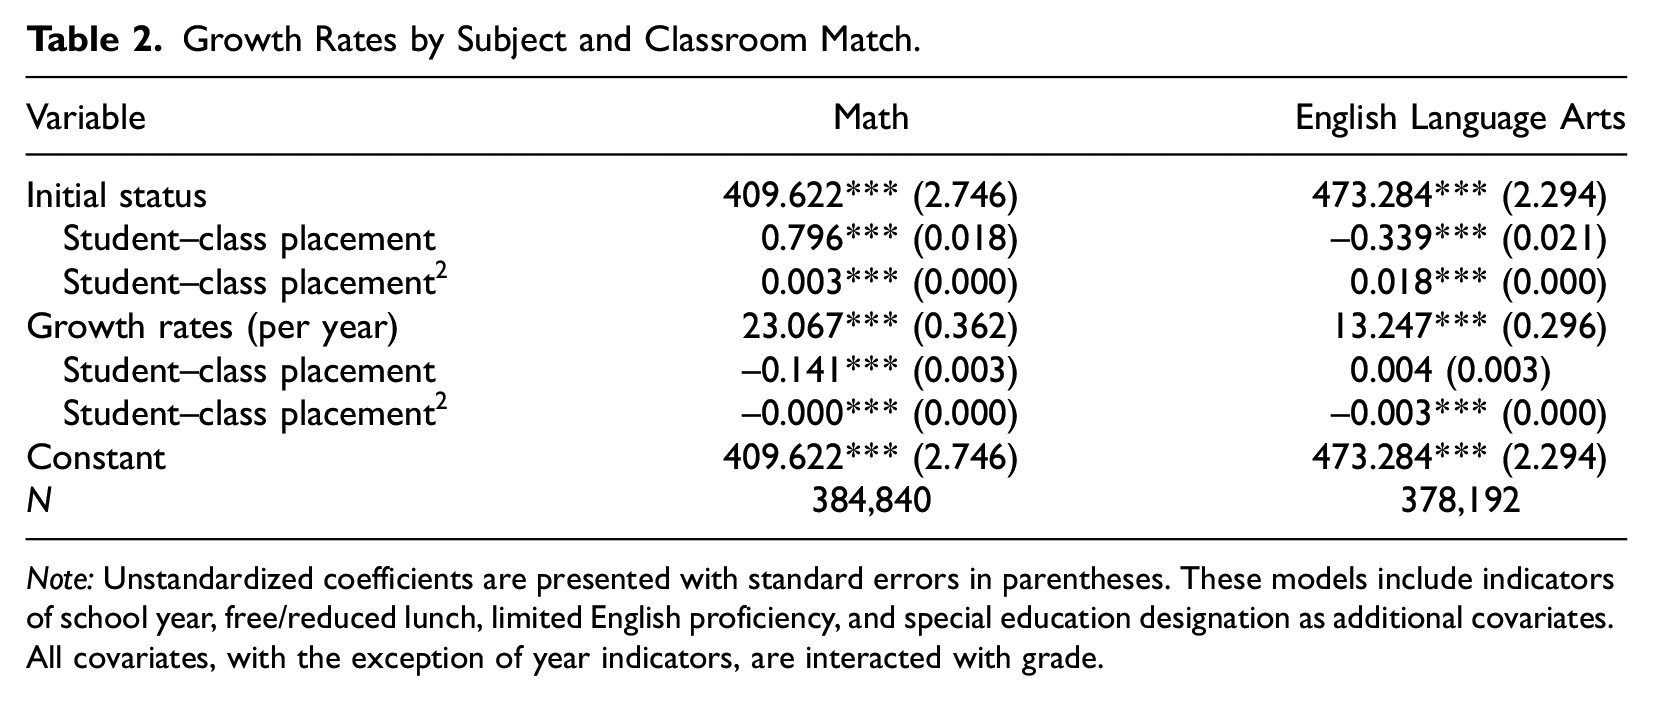
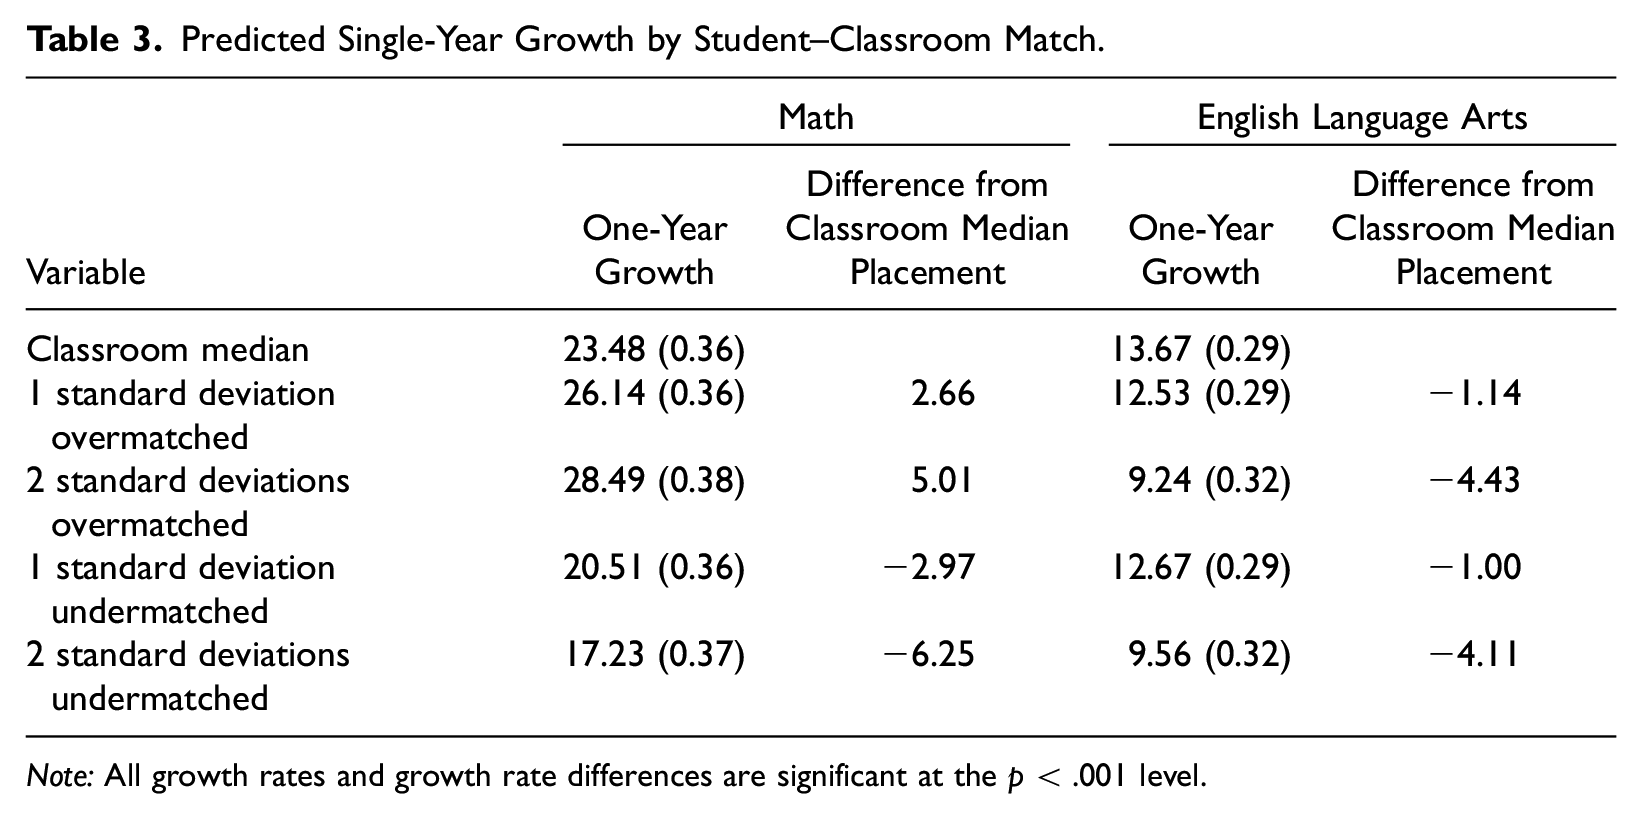
Our analysis of student–classroom mismatch in mathematics runs parallel to the recent work on mismatch at the undergraduate level: Students consistently tend to learn more in the highest-achieving math classroom available to them. Figures 2 and 3 display the results of our analysis of student math and ELA score trajectories, respectively. Table 2 displays select coefficients from the growth model, and Table 3 shows that slope differences, compared to classroom median students, are significant (p < .001). Table 3 and Figures 2 and 3 present the average marginal effect (AME) of class placement over time, with the AMEs calculated at five distinct values of the class placement variable across grades 6, 7, and 8.
Growth Rates by Subject and Classroom Match.
Note: Unstandardized coefficients are presented with standard errors in parentheses. These models include indicators of school year, free/reduced lunch, limited English proficiency, and special education designation as additional covariates. All covariates, with the exception of year indicators, are interacted with grade.
Predicted Single-Year Growth by Student–Classroom Match.
Note: All growth rates and growth rate differences are significant at the p < .001 level.

Math learning trajectory by mismatch status.

English language arts learning trajectory by mismatch status.
A “classroom median” student indicates the predicted learning trajectory of a student whose test score from the previous fall also represents the median classroom test score from the previous fall. A student who is 2 standard deviations overmatched is defined as having a previous-year test score 40 points lower than the classroom median previous-year test score, and 1 standard deviation overmatched corresponds with 20 points. 3 The graph displays students’ test score growth from sixth to eighth grade; after estimating the AMEs, we set all intercepts to zero for ease of interpretation. In math, overmatched students tend to do better, and undermatched students worse, than students who are appropriately matched. Students 2 standard deviations overmatched learn at a rate 5.01 points more per year than when placed in a classroom where they represent the median of prior achievement, which is equivalent to 30 percent of an average year’s growth in math. For reference, 5 points corresponds to a 0.08-standard-deviation magnitude of effect. 4 Students who are undermatched by 2 standard deviations tend to learn at an annual rate 6.25 below what they otherwise would, which is equivalent to 37 percent of an average year’s learning or 0.10 standard deviations. On the other hand, students who were overmatched or undermatched in ELA learned less than they otherwise would. The effect sizes of −4.43 in math and −4.11 in ELA for students 40 points below the classroom median both correspond to about a third of a year. These results indicate that the effect of mismatching in middle school math classrooms closely mirrors mismatching at the undergraduate level, but this is not the case for ELA classrooms.
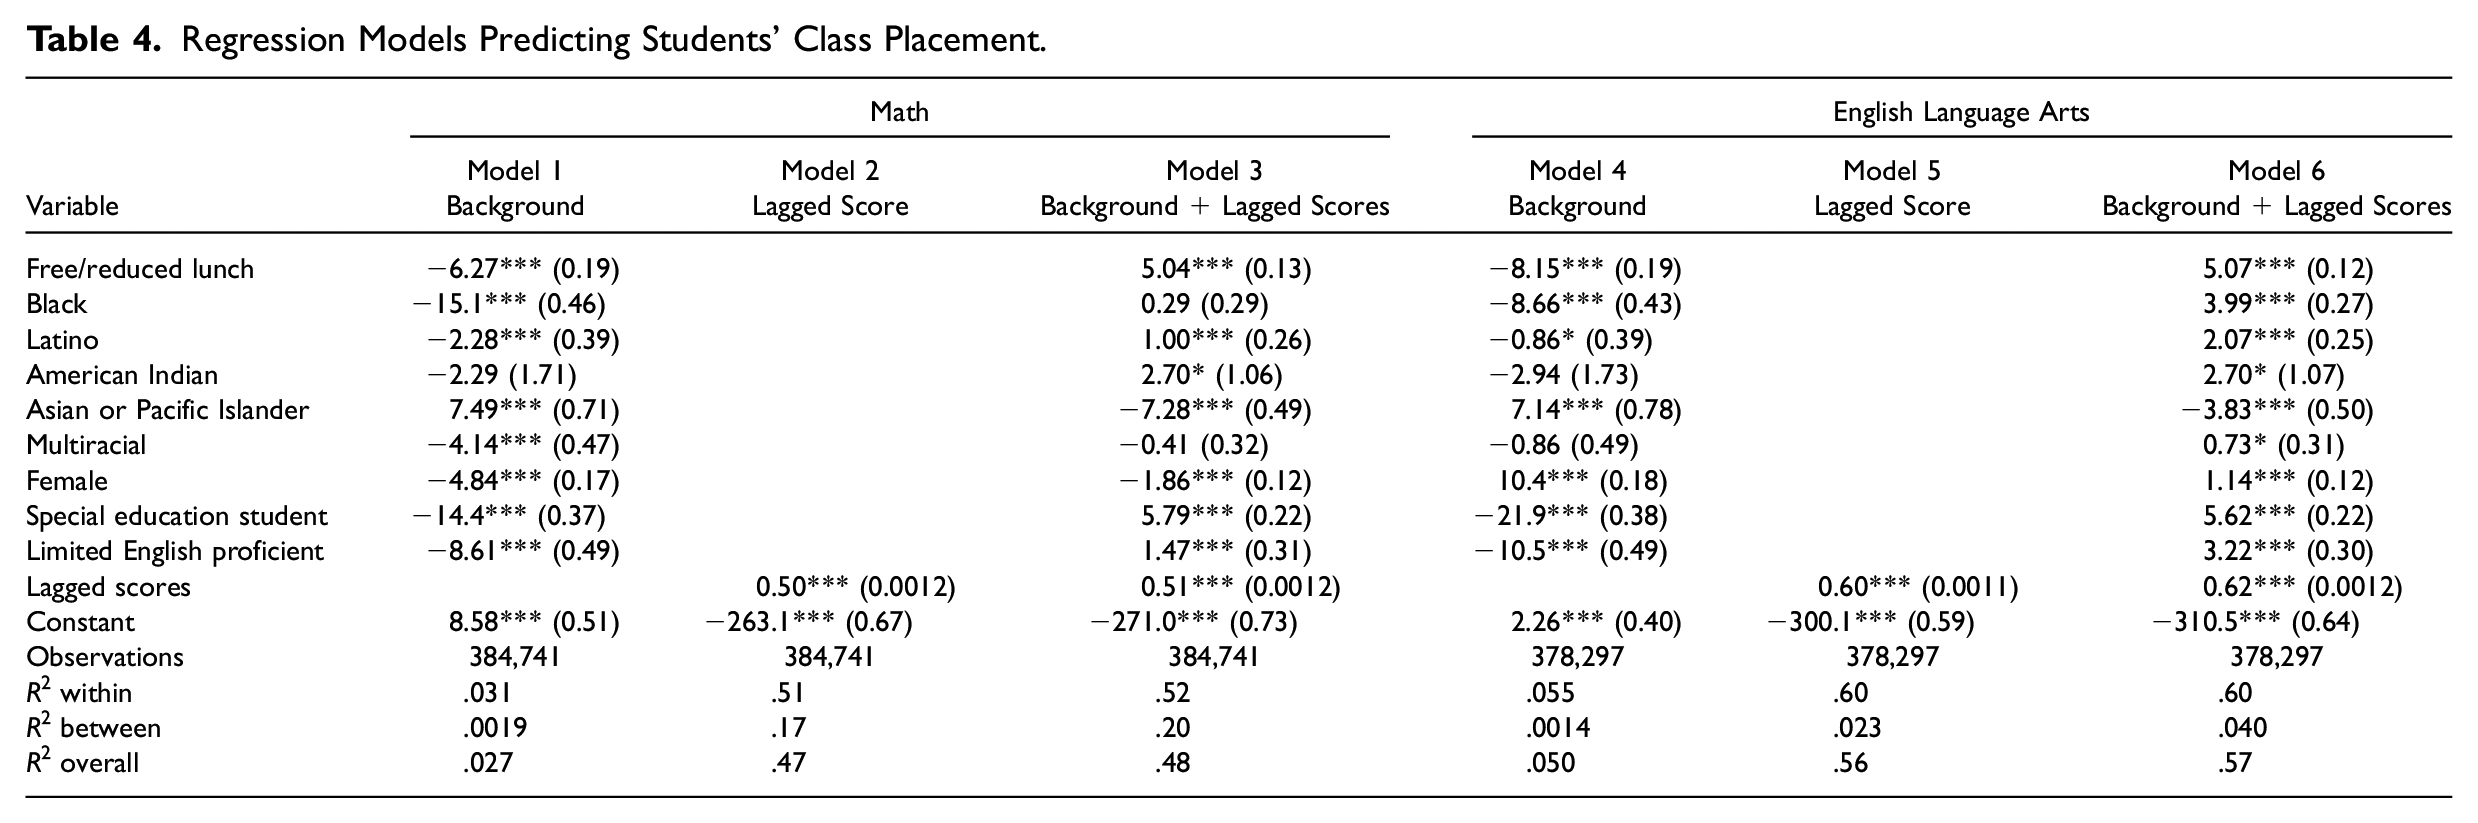
Given that, for math, overmatching represents an advantaged structural position, and undermatching a disadvantaged structural position, we next investigate who is more or less likely to occupy one of these positions. Models 1 and 4 in Table 4 show that, when not controlling for a student’s previous achievement level, students who tend to have lower test scores also tend to be lower in their classroom distribution. Once we control for previous achievement in Models 3 and 6, many student background characteristics reverse direction; Model 3 is depicted in Figure 4, and Model 6 is depicted in Figure 5.
Regression Models Predicting Students’ Class Placement.

Relationship between student characteristics and math class placement.

Relationship between student characteristics and English language arts class placement.
Net of previous student achievement, poor students tend to be undermatched by 5 points on the ISTEP+, for math and ELA, which represents 30 percent of the average one-year growth rate in math and 40 percent of an average year in ELA, which corresponds to a 0.08-standard-deviation effect size in both subjects. We see a similar effect of 5.8 in math and 5.6 in ELA for students designated as special education. There is significant evidence that Latino, American Indian, and LEP students tend to be undermatched in both subjects, and black and multiracial students tend to be undermatched in ELA but not math. Asian/Pacific Islander students tend to be overmatched in ELA and math, although the effect size in math (7.3) is almost double the effect size for ELA (3.8). Female students have a small but significant tendency to overmatch in math but undermatch in ELA, although we are hesitant to interpret this finding. Given that female students tend to do slightly better on the ELA portion of the ISTEP+ then the math portion, we suspect their class placement is simply a function of their overall performance.
Conclusion
Classroom Effects
The relationship between a student’s prior knowledge relative to classmates and how much that student learns in a year varies profoundly depending on the subject. Similar to recent findings concerning undergraduate institutions, the benefit gained from placement in a mathematics classroom is directly tied to the average skill of students in that classroom. Conversely, ELA classroom placement aligns with what mismatch theory would suspect: Students do best when placed in a setting that matches their previously demonstrated ability. Given the nature of our data, we can only speculate as to the mechanisms responsible for these findings.
One possibility is that teacher quality acts as the driver of the relationship between classroom placement and student learning. Researchers have found that variation in teacher quality has a larger effect in math than in ELA (Clotfelter, Ladd, and Vigdor 2007), especially in a middle school context (Harris and Sass 2011). This alone is insufficient to explain our findings. For teacher quality to account for our relationship of interest, the differential sorting of higher-quality teachers to more advanced classrooms would have to be more profound in math than in ELA. There is ample evidence for teacher sorting (Kalogrides et ;al. 2013; Lankford, Loeb, and Wyckoff 2002), but there is no evidence that this sorting is more prevalent in math than in ELA. We recommend further research into whether teacher–classroom sorting varies by subject.
A second possible mechanism for our findings is peer effects. Researchers tend to characterize peer effects as composed of two offsetting phenomena: the frog pond and normative models. The normative model states that peers tend to become more like one another. This mechanism relies on high achievement becoming normative in a classroom where the majority of students are used to high achievement. In contrast, classrooms filled with low-performing students can foster a normative atmosphere that is ambivalent, or even antagonistic, toward schooling. Normative peer effects would indicate that students benefit from overmatching and are hurt by undermatching. The frog pond model predicts that, because students evaluate their ability and develop their self-concept in comparison to their immediate peers, students who outperform their peers benefit from a favorable comparison, whereas students who underperform are negatively affected by an unfavorable comparison. The frog pond model would predict a positive effect for undermatching and a negative effect for overmatching (Goldsmith 2011). For peer effects to explain our findings, a frog pond effect would have to operate in middle school ELA classrooms and a normative model in math classrooms, which is unlikely. Alternatively, some aspect of peer effects could be at play but is offset by differences in instructional rigor or some other aspect of the classrooms in question. Both options are certainly possible, but additional research is needed to investigate the mechanisms and the difference between school subjects.
One final possible explanation for why our findings differ by subject is that math testing is more sensitive to whether a student has covered advanced topics, at least compared to ELA testing. Perhaps advanced math classrooms simply cover more topics, or the amount of topics covered matters more in math than in ELA. It seems possible that answering an advanced algebra question is dependent on simply having covered it in class, whereas this may not be the case for an advanced reading comprehension question. By this explanation, it is not the quality of math instruction driving the advantage gleaned from overmatching in math but the quantity of curriculum covered. More research is needed concerning the relationship between class instruction and test score outcomes. Data restrictions prevent us from expanding our analysis beyond math and ELA.
Classroom Placement and Inequality Maintenance
The incongruity between the effects of classroom mismatch and who tends to be over- and undermatched has profound implications for how we conceptualize inequality maintenance within schools. We find that students’ optimal class placement in math is the most advanced classroom available, whereas optimal placement in ELA is the classroom that most closely matches their current status. However, privileged students are more likely to be overmatched than their peers, less privileged students are likely to be undermatched, and this trend is nearly identical for math and ELA. This second trend supports previous work showing that privileged parents prefer that their children enroll in advanced classes (Brantlinger 2003; Oakes and Guiton 1995; Useem 1992). This preference does not vary by subject, despite the divergent outcomes.
Our ability to unpack how students are placed in classrooms is limited, so we cannot clearly determine whether it is the actions of students, parents, teachers, or administrators that drives the relationship between family background and classroom placement. Also, we do not know whether a school practices formal tracking. We present robust estimates of the average effect of classroom mismatching, but it is possible that mismatching has a heterogeneous effect depending on tracking policy. This is especially relevant for future work examining different stages of schooling, as formal tracking is far more common in high school than in earlier grades. In any case, the estimates of classroom placement presented here must be viewed as driven by some combination of peers, instruction, and track.
We would encourage future research into the exact nature of this process, but for the purposes of this study, the exact nature of the process is irrelevant. School structures consistently result in privileged students being placed in more advanced classrooms, resulting in unequal access. However, we can conclude that this inequality of access translates only to unequal results in math, and it could very well hurt privileged students who are consistently overmatched in ELA. In other words, the education system effectively maintains inequality of access to classrooms, but this does not represent the maintenance of inequality writ large. To take this a step further, inequality can be effectively maintained only if those with power and influence have an accurate sense of what actually benefits themselves and their families.
Our findings also raise a number of questions related to classroom sorting that are not necessarily related to effective inequality maintenance. One is the consistent pattern whereby students designated as SPED are consistently undermatched when one considers their classroom placement net of previous achievement; the effect size for this trend is similar to FRL status. Perhaps this is a predictable consequence of the assignment of SPED students to special education classrooms, but it suggests classroom undermatching could be an unintended consequence of a SPED designation. A second point of interest is the trend where Asian/Pacific Islander students are more likely to be overmatched than their white peers. Economic differences seem an unlikely culprit: Asian and white students in Indiana have nearly identical FRL rates, 35.5 compared to 36.1 percent, respectively, although there could be economic differences not captured by poverty rates. Asian families might have greater social or cultural capital that is not captured by the available control variables. An alternative explanation is the role of model-minority stereotypes, where Asian students are subject to “relative valorization” by comparison to black students (Ng, Lee, and Pak 2007). This could also explain why the overmatch tendency for Asian students is stronger in math than in ELA, as racialized stereotypes about Asian students’ academic performance are particularly salient in math. We view this as an interesting topic for future research.
The current study extends the theoretical basis of EMI literature by adding a level of conceptual complexity to the reality of inequality maintenance. Lucas (2001:1652), in his original definition, states that “[e]ffectively maintained inequality posits that socioeconomically advantaged actors secure for themselves and their children some degree of advantage wherever advantages are commonly possible.” This research provides evidence that inequality maintenance is not necessarily effective: No matter the resources available to privileged individuals, their understanding of what represents an advantage can be incorrect. This does not invalidate EMI—effectiveness might vary, but we expect inequality maintenance is effective on average. In essence, the current study reframes EMI as a probabilistic process, rather than a deterministic process. This alteration to EMI as a theory brings it into alignment with the messy reality of social life.
Supplemental Material
SoE918857_Online_Appendix_Mismatch_v2 – Supplemental material for The Right Fit? Classroom Mismatch in Middle School and Its Inconsistent Effect on Student Learning
Supplemental material, SoE918857_Online_Appendix_Mismatch_v2 for The Right Fit? Classroom Mismatch in Middle School and Its Inconsistent Effect on Student Learning by Brian R. Fitzpatrick and Sarah Mustillo in Sociology of Education
Footnotes
Acknowledgements
This work was supported by Notre Dame’s Center for Research on Educational Opportunity and the Institute of Educational Initiatives. We are grateful to the Indiana Department of Education for providing access to the state administrative records and for supporting independent analyses. We are also grateful for the substantial feedback we received from numerous colleagues, including William Carbonaro, Mark Berends, Amy Langenkamp, Roberto Penaloza, and Patrick Graff. All opinions expressed in this article represent those of the authors and not necessarily the institutions with which they are affiliated. All errors are solely the responsibility of the authors.
Research Ethics
The data used here are in compliance with a data-sharing agreement with the Indiana Department of Education. Data collection and storage followed all National Institute of Health guidelines. The current study received institutional review board approval under protocol ID 18-06-4731 of the researchers’ institutional review board. The data-sharing agreement arranged by Indiana’s Department of Education dictates that all data are anonymous upon delivery to researchers. As a result, at no point in the research process are students in these data identifiable.

Supplemental Material
Supplemental material is available in the online version of this journal.
Notes
Author Biographies
References
Supplementary Material
Please find the following supplemental material available below.
For Open Access articles published under a Creative Commons License, all supplemental material carries the same license as the article it is associated with.
For non-Open Access articles published, all supplemental material carries a non-exclusive license, and permission requests for re-use of supplemental material or any part of supplemental material shall be sent directly to the copyright owner as specified in the copyright notice associated with the article.
