



Abstract
Woven fabric permeability is relevant to many applications, such as airbags, textile composites processing, paper making and air and water filtration. This paper proposes an analytical model to predict through-thickness fabric permeability based on viscous and incompressible Hagen–Poiseuille flow. The flow is modeled through a unit cell of fabric with a smooth fluid channel at the center with slowly varying cross-section. The channel geometry is determined by yarn spacing, yarn cross-section and fabric thickness. The shape of the channel is approximated by a parabolic function. Volumetric flow rate (Q) is formulated as a function of pressure drop and flow channel geometry for woven fabric. The permeability (K) is calculated thereafter according to Darcy’s law. The air permeability of nine different fabrics has been measured to verify the analytical model. A sensitivity study was carried out to understand how geometric parameters influence the fabric permeability. The analytical model shows very close agreement with the experimental data: within 5% for most fabrics. The sensitivity study on permeability indicates the importance of flow channel geometry in obtaining accurate predictions.
Permeability is a measure of the ability of a porous material to transmit fluids. It is one of the primary properties for technical textiles used in fluid-related applications, such as airbags, textile composite processing, paper making and air and water filtration. The regular interwoven structure of woven fabric gives rise to arrays of fluid channels. These channels are in theory identical and repetitive. The geometry of each individual channel depends mainly on weave density, yarn shape and weave style. Fabric permeability is governed by these geometric parameters. A predictive model of permeability as a function of fabric structure is a desirable tool for optimum material design. 1
Research on the air permeability of textile materials began at the end of the 19th century when experimental methods for estimating the hygienic properties of materials for clothing began to be used.2 As a result of studying flow through porous media, Darcy3 established the linear dependence of velocity on pressure drop. The first studies of the air permeability for fabrics conducted by Rubner4 were based on this theory. Darcy's law is presented in the following equation:

Kozeny and Carman 6 found a similar relation between pressure drop and fluid flow as in Darcy’s law separately, suggesting that the permeability is independently determined by material variables, that is, porosity (Ф) and specific surface area (S):
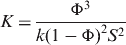
Gebart
11
developed an analytical model for predicting the permeability of fiber bundles, which simulated the two-dimensional (2D) flow of a Newtonian fluid perpendicular to and parallel with unidirectional filaments. It can be considered analogous to flow within yarns in a fabric structure. Gebart
11
looked at two types of packing, array-quadratic and hexagonal, as follows:

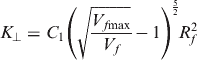
Phelan and Wise
14
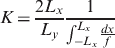
studied transverse Stokes flow through an array of elliptical cylinders to determine the macroscopic permeability of unidirectional fabric. Each cylinder represents one yarn, which can be treated as a solid or porous material. From first principles a semi-analytical model based on lubrication analysis
11
was developed:
Kulichenko
16
developed an analytical model for the through-thickness permeability of woven fabric, based on the Poiseuille and Weisbach–Darcy equations, by simplifying the geometry of channels (pores) in a fabric as a system of parallel capillaries, such as the straight tube shown in Figure 1(a). After analysis of the fabric geometry and fitting with experimental data, the permeability is
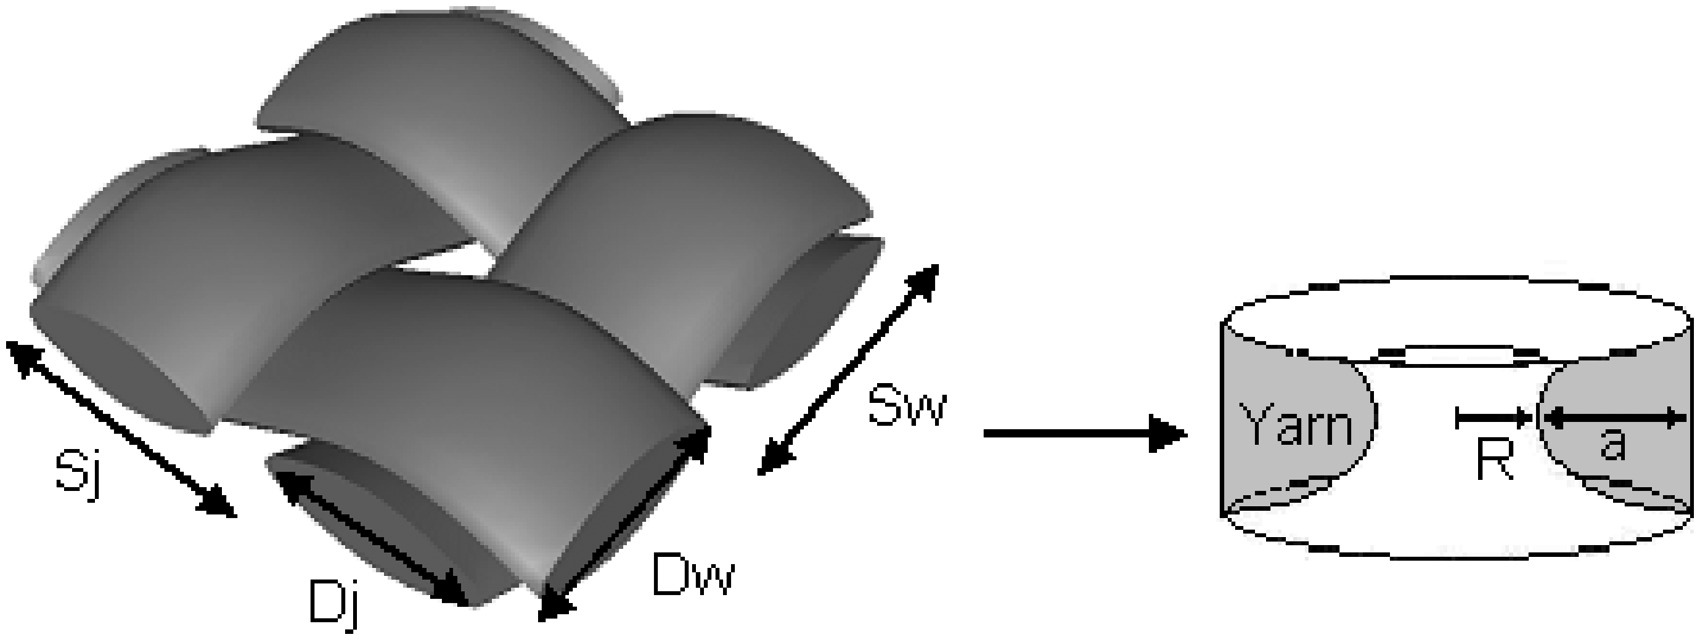
Unit cell of fabric and three-dimensional simplified channel geometry.
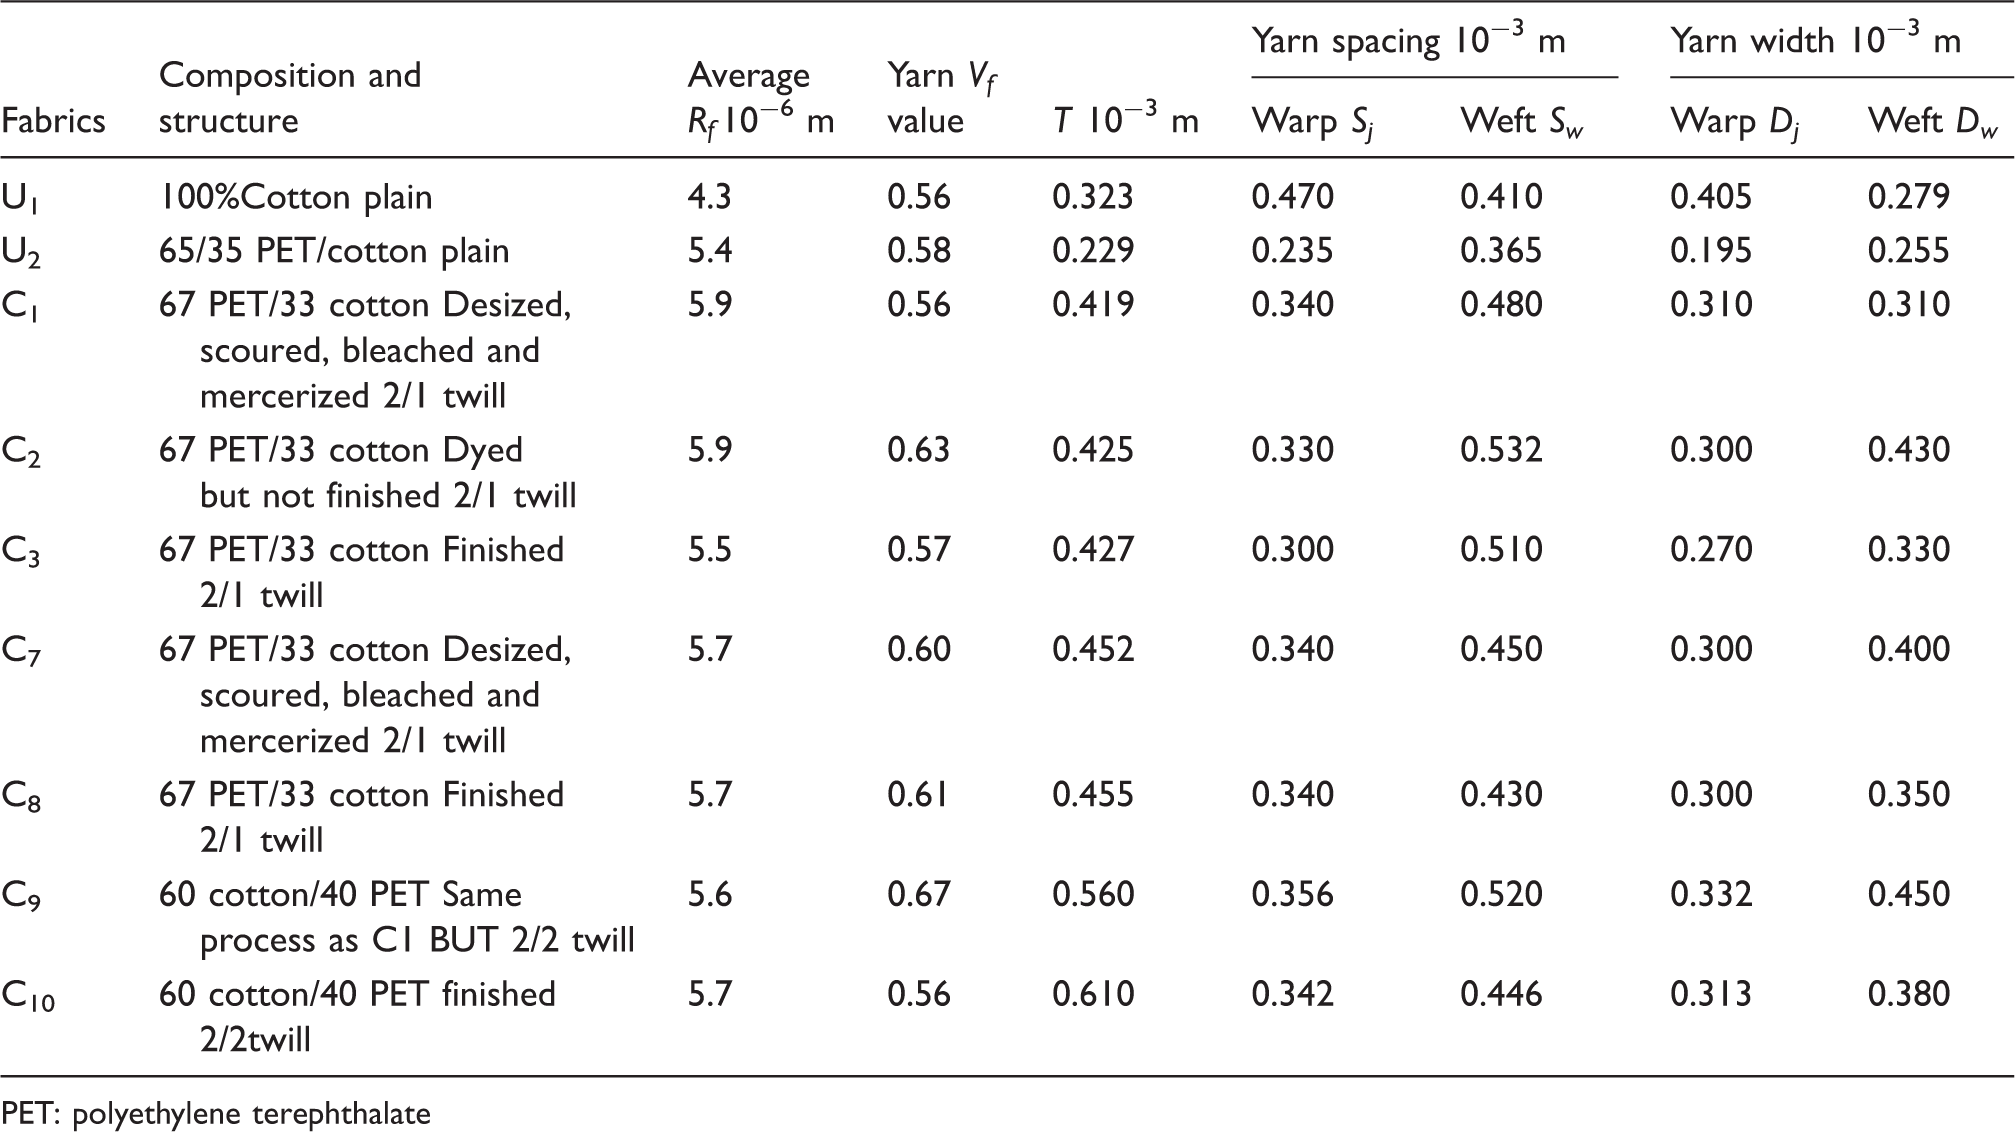
Fabrics specifications
PET: polyethylene terephthalate
Development of the model
Hypothesis
Fluid
The Newtonian fluid (liquid or gas) considered in the model is assumed to be incompressible, with a constant viscosity and density due to the low flow rates.
Flow conditions
At the inlet, fluid is injected at a constant pressure P1. The flow front pressure P2 is ambient. Inertial terms and yarn motion are neglected. The flow is laminar and the flow process is quasi-steady state. The velocity of the fluid at the surface and inside of the yarns is assumed to be zero, while at the center-line of the channel it is maximum. Fluid flow is considered in the direction perpendicular to the fabric. The transverse component of the velocity is negligible, since the highest pressure gradient is near the narrowest region, where the flow is almost parallel to the channel surface.
17
Geometry of the unit cell
Figure 2 describes the unit cell geometry in a plain woven fabric. Dw and Dj are widths of the weft and warp yarns, respectively, while Sw and Sj are the spacings of the weft and warp yarns, respectively. One single flow channel in the unit cell is then simplified as a smooth fluid channel with slowly varying circular cross-sections. The radius of the narrowest cross-section (R) is calculated as half the diameter of the rectangular channel cross-section in the real fabric:
18
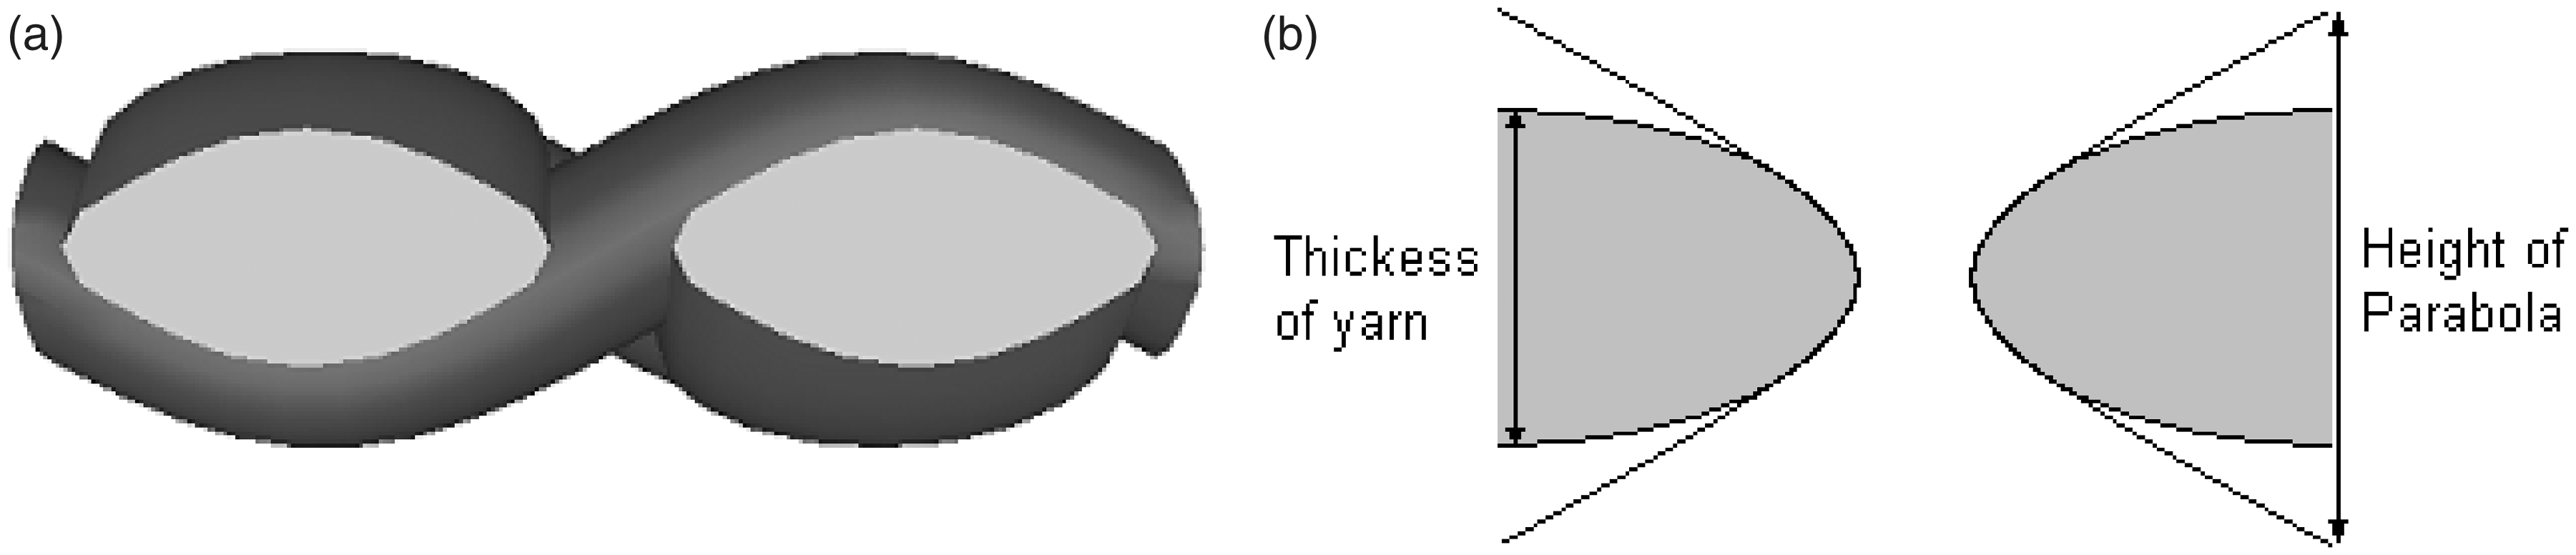
Cross-section of flow channel and curve fitting with parabola.

Description of the yarn cross-section
Figure 3(a) shows a side view of the flow channel formed by the yarns. The channel surface curvature can be represented by a parabolic function, as illustrated by Figure 3(b), where the parabolic function matches well near the narrowest channel cross-section. This is the region most relevant for permeability prediction, since the highest pressure drop occurs at this confined region. The parabolic function for yarn shape is assumed to be
Effect of β on yarn (and hence channel) shape. Laminar flow through (a) straight tube and (b) curved tube.


The parabolic function is chosen, as it is easy to integrate the derived analytical model in the next section. It is noted in Figure 3(b) that the real fabric thickness is smaller than the crossponding height of the parabolic curve formed at the boundary of the unit cell; hence, the porabolic curve is truncated to match the fabric thickness.
Analytical model
According to fluid dynamics theory and the assumptions above, the analytical model is from the Hagen–Poiseuille equation,
19
which describes fluid flow through a long straight tube, as shown in Figure 1(a):
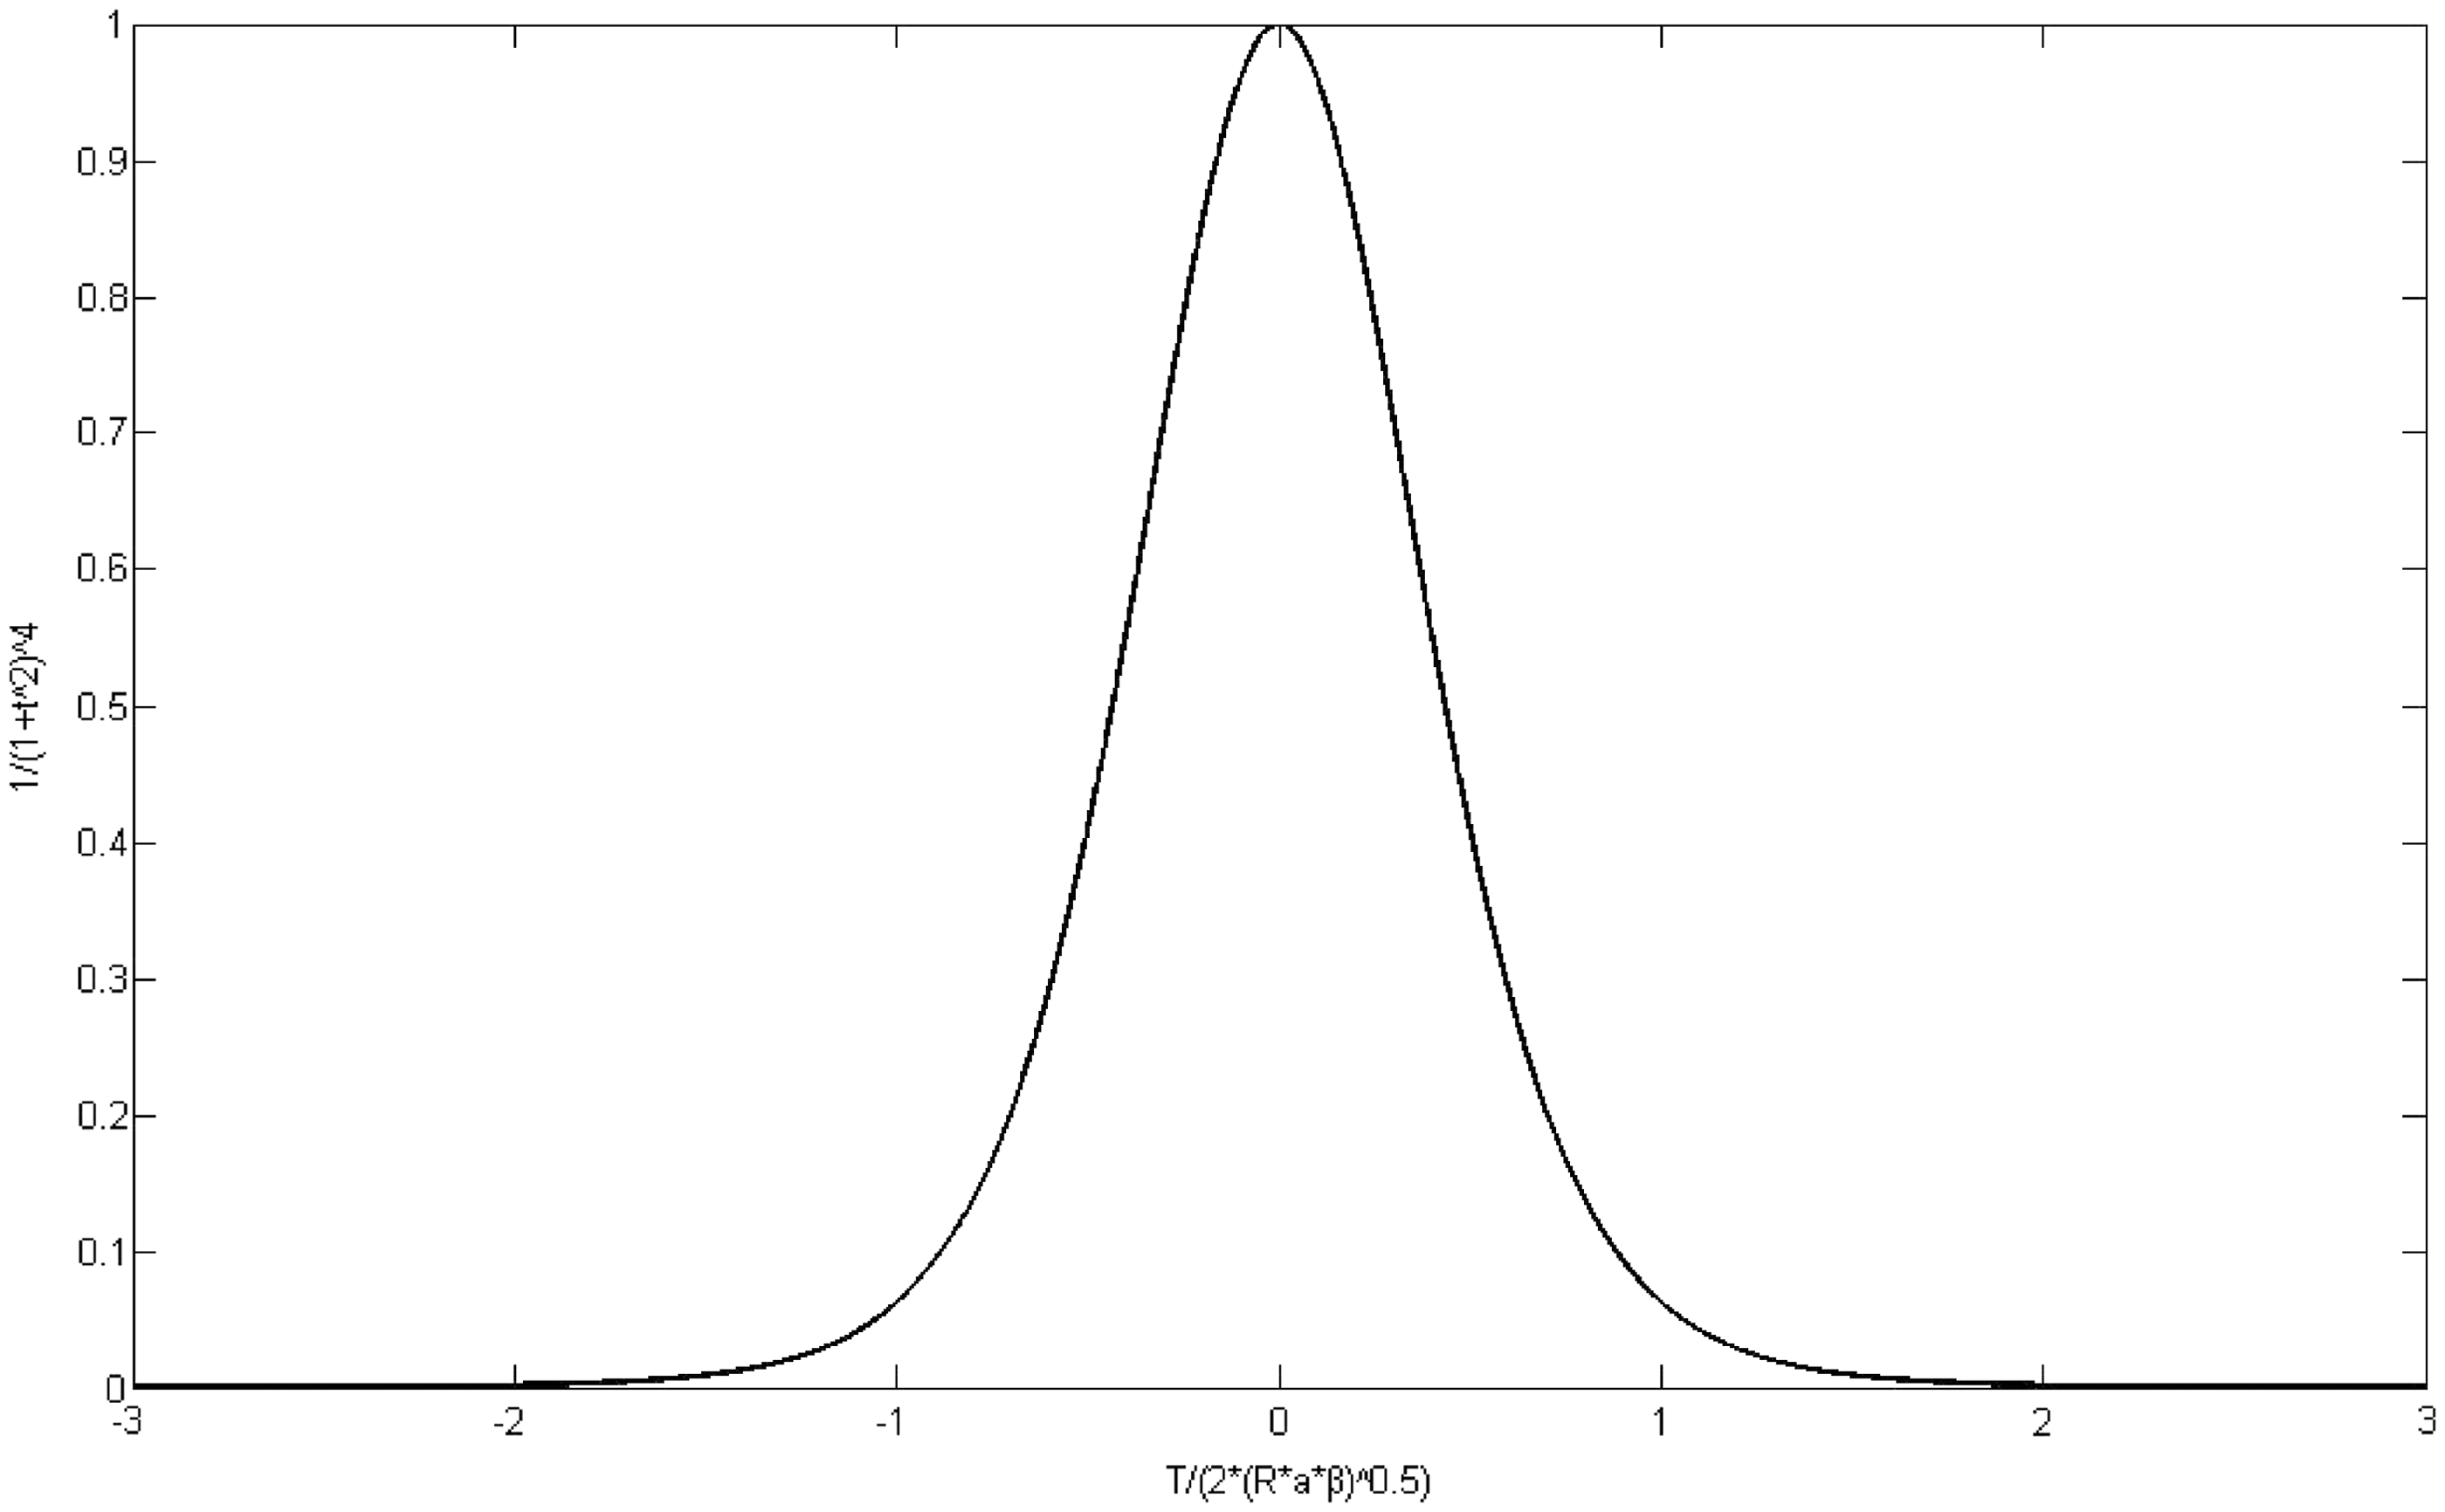
The bounded integral value in Equation (15).


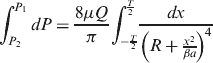
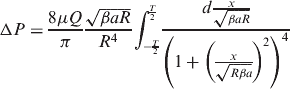


Accordingly, Equation (17) has been simplified significantly:


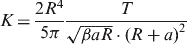
Verification
Experimental approach
Through-thickness air permeability was measured according to BS EN ISO 9237:1995.
20
The apparatus for the experiment is an air permeability tester FX 3300, as shown in Figure 6.
21
The fabric is held by the clamp under a certain pressure. A suction fan forces the air to flow perpendicularly through the fabric and the flow is adjusted gradually until the required pressure drop is achieved across the test region. D is a transducer that can determine the volumetric flow rate (m3/s). This value divided by the specimen area (10 cm2) gives the velocity of air flow. The pressure drop in the experiment for all fabrics is set to 500 Pa, with an accuracy of at least 2%. Using the measured velocity, pressure drop and fabric thickness, permeability is calculated according to Darcy’s law.
Sketch of air permeability tester FX3300.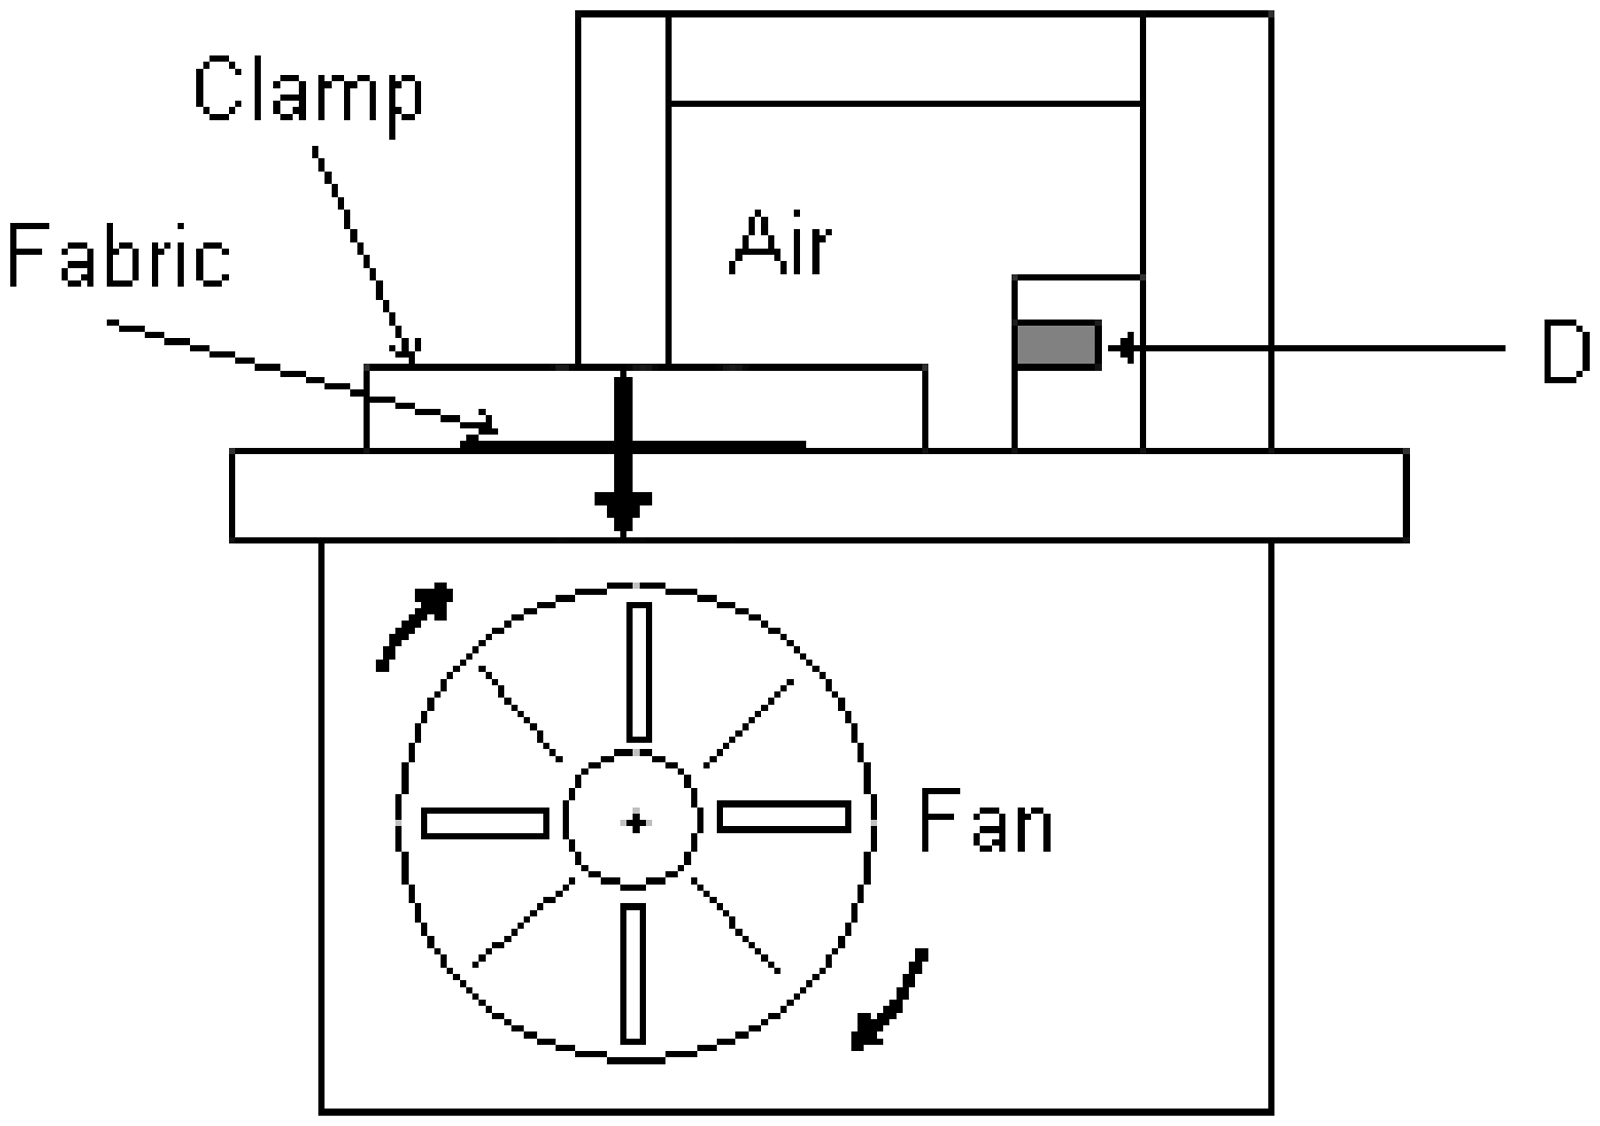
Nine fabrics with different weave styles and materials were investigated, as listed in Table 1. Each test was repeated three times with a fresh sample. Yarn cross-sections were cut using a laser beam razor blade and cross-section images were obtained using a TM – 1000 tabletop microscope. The images were used to measure the yarn spacing and yarn widths, as well as the fiber radius and yarn fiber volume fraction. The fabric thickness was measured using the Kawabata Evaluation System for Fabrics (KES-F) at a pressure of 0.05 kPa. 22
Curve fitting for channel geometry
The exact flow channel geometry in a woven fabric can be obtained by measurement from microscopic images of fabric cross-sections, as shown in Figure 7.
Determination of yarn cross-section. (a) A cross-section of fabric C10. (b) Channel formed by yarns and its mathematical description.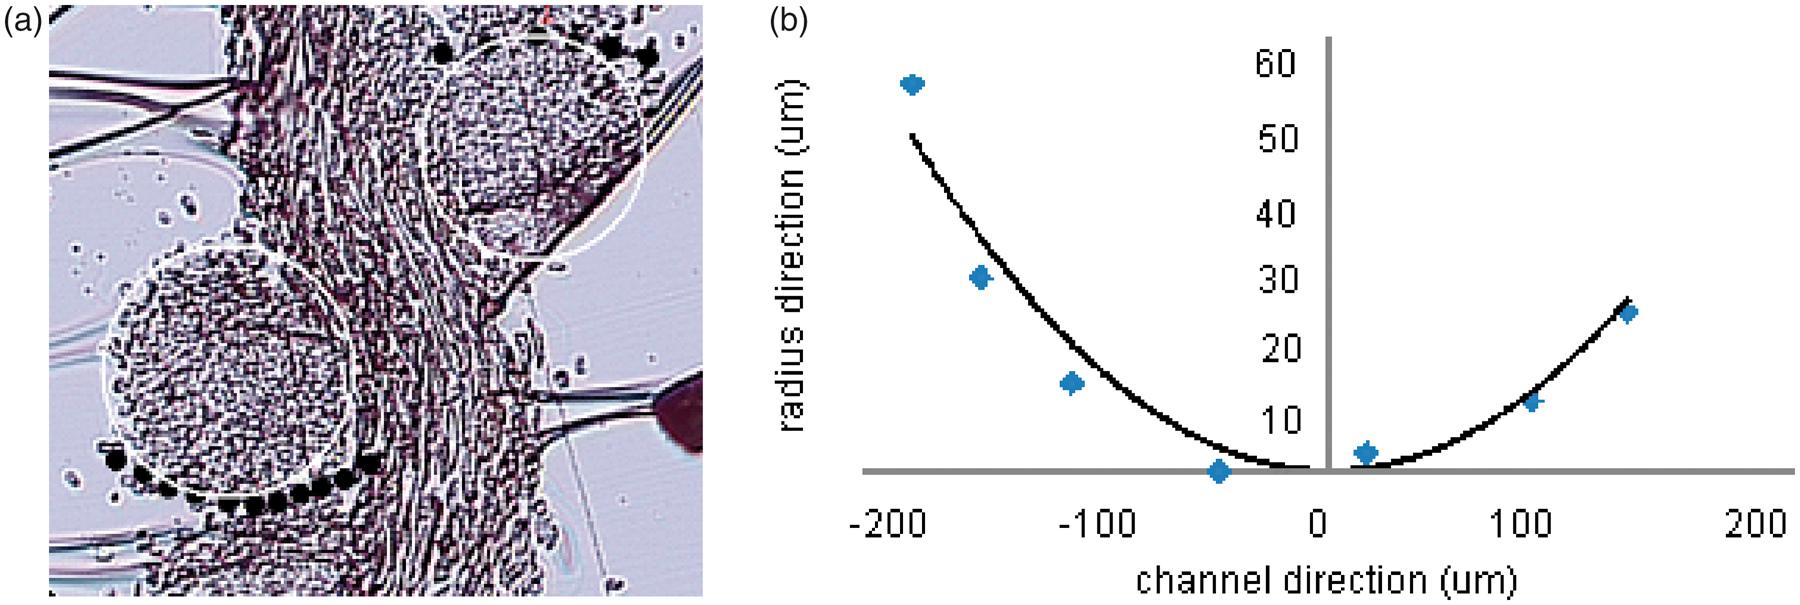
Coordinates of the yarn cross-section were measured using image analysis software, and these were approximated by a second-order polynomial using least-square analysis. This allowed the β value in Equation (9) to be determined directly.
Results and discussion
Comparison of analytical and experimental results
Geometric parameter values of geometries for nine fabrics

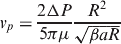
Prediction of permeability (Equation (19)) compared against experimental data and the Kulichenko model

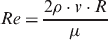
This shows that the Reynolds number for the flow through all fabrics is well below the critical value of 2300, where flow turns from laminar to turbulent. This validates the assumption of laminar flow for the analytical model.
Columns 5 and 6 in Table 3 display this model and the Kulichenko model predictions for the permeability of each fabric. This model, derived from Hagen–Poiseuille flow through the double curvature channel, predicts the fabric permeability very accurately compared with the Kulichenko model. One of the reasons behind the accurate prediction is that the Hagen–Poiseuille flow assumption is generally accurate for flow through woven fabric, where the velocity component of laminar flow is only considered parallel to the channel axis. More importantly, the geometry of the channel has a strong effect on the flow resistance. The model includes this geometric influence by explicit flow integration over the channel geometry, using a parabolic function fitted to each fabric via microscopic analysis. Hence, all parameters in the current analytical model can be determined from the fabric geometry.
The last column in Table 3 shows the error for the Kulichenko model (Equation (6)) in comparison with experimental results. For all sample fabrics, the prediction is more than 50% in error. The Kulichenko model simulates the channels as a series of parallel straight tubes with constant cross-section. A constant correction factor for flow through the real fabric was determined by Kulichenko by data fitting with some experimental permeability measurements. The results shown by our study indicate that fabric permeability is strongly influenced by the shape of the flow channel. It cannot be expressed by an empirical parameter to account for the geometry. Hence the Kulichenko model fails to predict permeability for fabrics in general.
Sensitivity of through-thickness permeability to fabric geometry
The current analytical model helps one to understand how the flow channel geometry influences the fabric permeability. There are four geometric parameters in the Equation (19) that directly relate to the prediction, that is, radius of flow channel (R), radius of yarn (a), shape factor of yarn cross-section (β) and thickness of fabric (T). The effects of each parameter on permeability are shown in Figure 8.
Relationship of permeability to each parameter.
From Equation (19), the relationship between the permeability K value and each parameter should be as follows:

Conclusions
A novel generic analytical model was proposed for predicting the through-thickness permeability of woven fabric. The key feature in the model is that a parabolic function was used within the Hagen–Poiseuille flow integration to capture the geometry of the flow channel formed by interwoven yarns. Different channel shapes in various fabrics can be well represented by this, with the parameter β obtained from microscopic measurement.
For nine different fabrics, the model gives good predictions compared with experimental permeability measurements within 5% errors for most fabrics. The Kulichenko model, where a straight flow channel is assumed, gives over 60% errors in permeability prediction. It is believed that the inclusion of the geometry of the flow channel makes the current analytical model more accurate than existing models. A parametric study shows that there are four independent geometric variables relevant to fabric permeability. The model would assist with understanding the factors affecting permeability and could help to improve fabric design.
Footnotes
Funding
Some of the work reported in this publication was carried out under the Technology Strategy Board's collaborative research and development through Project No: RC 2071 ‘Multi-Scale Integrated Modelling for High Performance Flexible Materials'. The authors would like to thank the Technology Strategy Board for financial support, and acknowledge the participation of the industrial and academic partners involved in this project: Unilever UK Central Resources, OCF PLC, Croda Chemicals Europe Ltd, University of Manchester, Heriot-Watt University, ScotCad Textiles Ltd, Carrington Career and Workwear Ltd, Moxon Ltd, Airbags International and Technitex Faraday Ltd.
Conflict of interest statement
None declared.