



Abstract
Printed fabrics are high value-added artifacts with rich colors and various patterns. Flawed products occur owing to uncertainties during the manufacturing process. Such defects waste not only raw materials and machine operating time, but also large amounts of labor to inspect, sift and sort. Hence, if the detection process for printed fabric defects could be automated, the product quality of printed fabrics could be increased, and industry efficiency could also be improved by reducing the requirement for manpower. So this study aims to develop such a defect detecting system to investigate printed fabrics with repeated patterns, locate flaw sites by the minimum repeated zone of repeated patterns, and finally find out the most common flaw type. The novelty of this technique is the introduction of an image processing technology known as the RGB accumulative average method (RGBAAM) to test and locate flawed zones, then use fuzzy logic to discern the flaw types. The RGBAAM has the merits of compactness and high execution speed, and it is an efficient algorithm for pattern recognition. The subject fabrics are printed fabrics with repeated patterns, and to interpret this kind of image, pure numeric calculations are faster than the widely used genetic algorithm. Experimental results show that this system can analyze and recognize 96.8% of defect types in printed fabrics, and therefore brings substantial benefits to control the product quality and improve current flaw detecting process in the printed fabric industry.
Keywords
Most textiles we use in our daily lives are colored fabrics. There are certain technological difficulties in the automated analysis of color fabric images.1,2 This study employs the creative RGBAAM to inspect and identify flawed areas. The image of the flawed area is then fed into a Fuzzy Classifier (FC) to discern the type of defects. The procedure comprises scanning and acquiring the digital image data from printed fabrics, and obtaining the numeric area of the repeated pattern and the values of the color components in RGB Color Space. Then, the RGB accumulative averages (RGBAAs) of the X and Y directions are calculated and compared to obtain the minimum repeated zone (MRZ). The RGBAAs of the MRZ are used as comparison bases to test input images of the same kind printed fabrics to determine whether they have any defect. When input images have flaws, the MRZs of these flawed images can be used to identify the flawed sites. Finally, images of MRZs and flawed sites are entered into the FC to categorize the type of defects.
The rest of this paper is organized as follows. In the Literature review section, the current state of the art researches are reviewed. In the Research method section, the algorithms of the RGBAAM and FC are described. In the next section, the experimental results are described and discussed. In the final section, we give the conclusions.
Literature review
There have been many methods published to analyze textile defects. Bu et al. 3 compared the auto-regressive spectral estimation model with the detection results of traditional two-dimensional (2D) fast Fourier transform (FFT), and the former showed its efficiency and superiority. For its spatial frequency characteristics, Fourier analysis was massively employed in early research publications. Among them, a novel idea called central spatial frequency spectrum was proposed, 4 which classified defects into four types, and seven characteristic parameters were extracted for defect classification. Tsai and Hu 5 devised a system to extract nine features and input them into a back propagation neural network. The system can detect four kinds of fabric defects. Kim et al. 6 detected wrapping defects by machine vision. Perng and Chen 7 used non-negative matrix factorization to inspect directional textures. Attempts have been made to apply Gabor filter-based methods to texture segmentation, including Gabor modulation and demodulation,8,9 tuned matched Gabor filters 10 and deterministic relaxation after Gabor filtration. 11 Since Gabor filtration is an efficient technology for textured fabrics, some local defect detection algorithms are effectively implemented.12,13 On consideration of on-line real-time defect detection, a neural network system with microcontroller 14 and fractal scanning and fuzzified wavelet transform algorithms 15 have also been developed.
Research method
RGB accumulative average method
Each pixel in a color image has position and RGB color information. This information is stored in a five-dimensional array. The RGBAAM algorithm can transfer this five-dimensional array into two independent one-dimensional arrays, the X array and Y array. Taking a scanned image of 640 × 480 pixels for example, the X array length is 640 and the Y array length is 480. Both X and Y arrays are compared to obtain the minimum repeated lengths (MRLs) in horizontal and vertical directions. Then the two lengths are used to construct the MRZ. The flowchart of searching for the MRZ is shown in Figure 1. The comparison tolerance of X and Y arrays is 1%, or about ± 8 color grades. Then a non-flawed MRZ is further compared to the suspicious image. After using the RGBAAM, the X and Y arrays of the flawed image are obtained. Each element of the X array is a multiple of the Y-directional MRL (denoted MRLY), and each element of the Y array is a multiple of the X-directional MRL (denoted MRLX). Comparing the X and Y arrays and the MRZ of the flawed image with those of the non-flawed image, the flawed zones are located. Finally, the flawed zones are fed into the FC to detect the type of defects. The flowchart of locating flawed zones is shown in Figure 2.
Searching repeated zones flowchart. Locating flawed zones flowchart.

The RGBAAM algorithm
A color image composed of X, Y coordinates and RGB components is intrinsically a five-dimensional array. It can be converted into X and Y arrays by the RGBAAM, as shown in Equations (1) and (2):


X and Y arrays and their minimum repeated lengths

The minimum repeated zone

X and Y arrays of flawed printed fabrics and flawed zones

Comparison between non-flawed MRZ and X, Y arrays of the flawed image

The flawed zones

The defective image

Fuzzy Classifier
The concept of fuzzy theory was conceived by Zadeh. 16 It is a numeric processing method allowing partial membership rather than crisp membership in mathematic set operations, and was anticipated to more pertinently describe natural phenomena. This approach was not applied to real engineering problems until the 1970s due to the lack of sufficient computer power. It was first introduced as a control system for a steam engine. The feedback controllers could be programmed to accept noisy and imprecise inputs. Therefore, they were much more effective and perhaps easier to implement than before. In Europe and Japan, the technique was used in commercial products. Fuzzy theory is now widely applied. A fuzzy set A is a subset of the crisp set X and is characterized by assigning to each element x of X the degree of membership of x in A (e.g. X is a group of people; A is the fuzzy set of old people in X).
Membership function
The architecture of the fuzzy system is decided by fuzzy variables and membership functions. Ordinarily, there are three kinds of membership functions: bell, trapezoidal and triangular. The triangular membership function is adopted for better computation efficiency. The triangular membership function is shown in Figure 3.
Triangular membership function.
μ(x) is dominated by Equation (3):

The basic relations and operations of fuzzy sets are as follows:
1. Subset

2. Equal set

3. Complement set

4. Intersection set

5. Union set

6. Empty set

7. Universal set

Defuzzifier methods
The Defuzzifier methods include weighted average, center of gravity, height and area methods. The center of gravity algorithm is effective and easy to implement. The continuous defuzzification rule of center of gravity is defined as

The discrete defuzzification rule of center of gravity is defined as
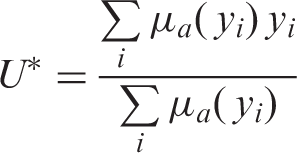
One important step of applying fuzzy theory is defining the membership function. Then the degrees of membership of input elements can be obtained by the defined membership function. This study employs two kinds of elements: the average defect brightness and the defect ratio of projection lengths on the X, Y axes.
17
Figure 4 shows the triangular membership function and the defuzzification process of the center of gravity method. Different defect ratios are designated according to projection lengths on the X and Y axes for the output of the FC. Roughly to say, if one defect has projection length on the X axis longer than that on the Y axis, positive ratios are assigned; on the contrary, if one defect has projection length on the Y axis longer than that on the X axis, negative ratios are assigned.
Triangular membership function and center of gravity defuzzification.
Experimental results
A non-flawed repeated-pattern image is shown in Figure 5. There are five types of flawed images to be identified in this paper: cracks, broken wefts along the X direction, broken warps along the Y direction, dotted oil spots and linear oil spots, as shown in Figures 6–10. The MRZ is shown in Figure 11(a). Twenty-five samples are captured from each flawed image. Flawed zones are shown in Figures 11(b)–(f). Defective images after image processing are shown in Figures 11(g)–(k). Time for searching flawed zones of each defect type is listed in Table 7. For five defect types, their searching speeds for flawed zones are almost the same.
Image with repeated patterns. Cracks. Broken wefts along the X direction. Broken warps along the Y direction. Dotted oil spots. Linear oil spots. (a) The minimum repeated zone. (b)–(f) Flawed zones. (g)–(k) Defective images. Time for searching flawed zones of each defect type (Unit: second)


Samples of cracks and their outputs


Samples of broken wefts and their outputs

Samples of broken warps and their outputs

Samples of dotted oil spots and their outputs


Samples of linear oil spots and their outputs

The success rate for each type of defect

Classification time for different types of defect by the FC (Unit: second)

Conclusions
In this paper, a novel technique for visual defect analysis is provided. The results prove that the defects of repeated-pattern printed fabrics can be effectively detected and classified. Color images are turned to their respective X and Y arrays by a RGBAA algorithm. The two arrays are compared to obtain the MRZs. Then the MRZs of flawed and non-flawed images are computed and compared to position the flawed zones. Finally, the flawed zones and the MRZs are imported into a FC to detect the type of defects. The result shows that such a system can analyze up to 96.8% of the defect types of printed fabrics.
Some limitations from the proposed algorithm are that the focus is on single repeated-pattern printed fabrics, and scanning must be undertaken in exactly vertical and horizontal directions. Nevertheless, the RGBAAM is still a concept and technology worthy of promotion in the fields of digital image processing, pattern recognition and defect recognition of planar fabrics.
Footnotes
Funding
This work was supported by the National Science Council of the Republic of China [grant No. 97-2221-E-011-030-MY3].
Conflict of interest statement
The authors have no conflicts of interest.