
Abstract
In this paper we describe the manufacturing and testing of an intelligent carbon fibre composite based on 3D-woven reinforcement. Piezoresistive fibrous sensors developed and optimized previously have been inserted into the carbon fibre reinforcement in the weft direction on a modified loom. These sensors were integrated at the top and bottom faces. Afterwards the reinforcement with embedded sensors was impregnated in epoxy resin using VARTM technology. The composite specimens thus obtained were tested for bending using the three-point bending test method. The results obtained show that the sensors allow simultaneous mapping of compression and traction at the top and bottom of the reinforcement when it undergoes bending. This is due to the fact that, unlike traditional strain gages, our sensors become integral part of the reinforcement and follow the tow architecture as dictated by the weaving process and interlacement pattern. Moreover, these sensors are compatible with the weaving process as they are flexible and sensitive enough to follow the deformation pattern of the reinforcement. Such sensors can be inserted inside various types of reinforcements during weaving in both warp and weft directions. Their location can be strategically chosen so as to form a network of sensors inside the reinforcement capable of following the deformation patterns of the reinforcement and mapping its stress–strain history.
Keywords
The weaving technique is one of the oldest traits known to mankind. It has been used for a long time in order to obtain technical textile products for industrial applications.1,2 High-tech structures for aerospace, automotive and aeronautical applications are increasingly employing a special class of woven fabrics called 3D interlocks made from high-performance fibres such as carbon, glass, aramid, etc. 2
According to Khokar,
3
the weaving process can be used to produce so-called 2D, 2.5D and 3D fabrics. These three types can be defined as follows:
2D fabrics: In 2D fabrics the constituent yarns are disposed in one plane or two dimensions. A single-layer warp and weft (i.e. two sets of yarns) are used to carry out the weaving process. 2.5D fabrics: In 2.5D or pile fabrics the constituent yarns are supposedly disposed in two mutually perpendicular plane relationships. In order to carry out the weaving process, single-layer ground warp, pile warp and weft (i.e. three sets of yarns) are used. 3D fabrics: In 3D fabrics the constituent yarns are disposed in three mutually perpendicular plane relationships. A multilayer warp and weft (i.e. two sets of yarns) or multilayer ground warp, binder warp and weft (i.e. three sets of yarns) are used.
The following two approaches can be used to classify woven 3D fabrics:
4
Based on the type of weaving process. According to Khokar
3
there are mainly three types of manufacturing systems to produce woven 3D fabrics. Thus, on the basis of the manufacturing method employed, 3D fabrics can be classified as:
- 2D weaving/3D fabrics; - 3D weaving/3D fabrics; and - NOOBing.
Based on the type of 3D structures:
- 3D solid – further classified as warp and weft interlocks depending on whether the warp or weft is used to bind/interlock different layers together; - 3D profiled – further classified as hollow, shell and nodal type.
3D solid structures are integrated woven structures with interlacing yarns in three mutually perpendicular directions. When produced using a 2D weaving process such woven fabrics are termed as 2D woven/3D fabrics. As mentioned above in such 2D woven 3D structures the interlocking yarn may be disposed in the warp or weft directions. Such solid 3D fabrics may be termed as warp interlock or weft interlock, respectively.
However, there are others who differ with Khokar 3 on the definition of 2.5D fabrics. These authors have categorized interlock fabrics as 2.5D fabrics. 5 – 7
The particular advantages of 3D interlocks or 2.5D fabrics, as they are sometimes called, make them the most promising class of reinforcements for composite materials for structural applications. Some of these advantages are as follows:
3D woven reinforcements are characterized by easier and more efficient moulding since, because the textile is already shaped, there are no forces to affect fibre placing during the moulding process, resulting in better surface quality of products.
4
Through-thickness properties can be adjusted by controlling the amount of ‘z’ yarns (in the vertical direction). The variation of properties can also be achieved by hybriding.
4
They form integral structures to near net shape.
8
–
12
In 3D woven fabrics, layers are joined together by filaments. Thus, the reinforcement becomes a solid entirety and it is difficult for the layers to separate. In addition, filaments in 3D-woven structures are arranged in crosswise, lengthwise and thickness directions. This particular fibre architecture provides strength in three directions and 3D textile preforms form fully integrated continuous fibre assemblies having generally orthogonal in-plane and out-of-plane fibre orientations. This has led to their usage in structural applications in aerospace, aircraft and automotive industries.
9
3D reinforcements provide enhanced delamination resistance, resistance to crack propagation, impact/fracture resistance, damage tolerance and dimensional stability.
9
–11,13 In laminated composites, delamination is the main failure mode under impulsive loading or ballistic impact. 3D textile structural composites are much tougher between layers and are characterized by better through-thickness properties as many reinforcing yarns exist in through-thickness direction.
10
This leads to the higher impact damage tolerance of 3D structural composites as compared with 2D laminates.
9
3D composites based on 3D reinforcements also have improved post-impact mechanical properties compared with 2D laminates.
9
3D composites possess high strain to failure in both tension and compression.
9
–
11
3D composites are also characterized by ease of fabrication via near-net-shape design and manufacturing of composite preforms, thus minimizing the need for cutting and joining parts and eventual use of resin transfer moulding of 3D performs.4,9,10 Not only can this reduce cycle times, since in making up composite parts no cutting and manual lay-up of single 2D pieces is required, but will result in better surface quality of the products. That is why 3D-woven fabric reinforced composite materials are very suitable for various engineering applications as they are less expensive and simpler to manufacture.
From technological point of view the greatest convenience offered by the interlock reinforcements is their versatility to address various structural requirements and ability to be produced on conventional weaving looms using traditional textile manufacturing technology with little modifications. Various different types of interlock structures that can be made include solid or profiled structures. Special profiles such as I, T, L, + and π can also be made for special structural applications such as stiffeners and panels for automotive, aerospace, marine and general transportation applications. 14 These high-performance reinforcements are impregnated to form composite materials for various structural applications. When these composite materials are put into use they have to sustain various stresses and deforming forces. It is important to understand the mode of rupture of a textile composite in order to design reinforcements according to the intended application of the composite part and expected stress–strain conditions during its service life.
It has been suggested that a record of stress-strain history prior to damage infliction be maintained in order to understand the cause of irreversible damage. 15 Thus, it goes without saying that in-service health monitoring of the structure can not only help in better understanding the deformation modes but also in keeping the structure operating reliably and safely. This awareness has led to the development of various structural health monitoring (SHM) techniques. Different approaches that can be used for structural health monitoring including ultrasonic scanning, acoustic emission (AE), shearography, stimulated infrared thermography (SIT), fibre brag grating (FBG) sensors, vibration testing etc. have been discussed in detail elsewhere. 16 – 21 Today design engineers lay special emphasis on the integration of sensors during the manufacturing process which enables them to perform in situ health monitoring of the composite parts, reduce cost and improve the accuracy of measurements. The classical NDE techniques hardly address this concern because of difficulties in making in situ implementation. It has been suggested in our previous research work that the use of intelligent textile approach in order to realize fibrous sensors compatible with SHM and composite technology, is a very promising solution for real time in situ health monitoring of composite parts. 22 In the case of high-performance textile composites these intelligent textile materials can be integrated during the manufacturing phase of the reinforcement or during the lay-up process. These materials perform a dual function inside a composite as after integration in the reinforcement they not only act as a part of structural material but also have actuating, sensing and micro-processing capabilities.
Researchers have already used such coatings for design of active components of intelligent textile structures, such as silicon flexible skins with regular textiles,23,24 flexible fibrous transistors 25 – 29 and other smart textile applications to manufacture consumer products and to detect physiological condition of the wearer. 30 – 37 However, their use as embedded sensors for realization of smart reinforcements needs to be further investigated.
Our piezoresistive fibrous sensor has been developed based on previous research studies on carbon black nanoparticles dispersed in polymers to form composites. 38 It has successfully been integrated into composite structural parts. 22 Measurements during tensile loading have shown promising results and it has been concluded that such a sensor may be used as a strain gauge inside composite structural parts for in situ on-line health monitoring applications. However, the theory of percolation indicates that the tensile deformation is not the only mode that contributes to the formation and deformation of percolation networks which have an influence on the global electrical conductivity. The compression of piezoresistive conductive polymer composite used for coating yarns is also supposed to modify its conductivity by modification of internal conductive paths by putting these paths in parallel or serial configuration and therefore altering the resistance locally. These two phenomena, traction (with formation/deformation of conductive paths) and compression (with modification of the configuration of conductive paths), are in competition. In some cases the first phenomenon is predominant, for instance when a sensor is used solely in tensile loading. While in the case of pressure or compression sensing, the second phenomenon is supposed to be predominant.
In this article, this dual sensing nature of our fibrous sensors is used in order to detect two different deformation modes simultaneously in a 3D textile composite. This has been made possible by choosing different sensor locations inside the composite part. For instance, in the case of the three-point bending test, it is possible to place one sensor near the surface in contact with the top bending support where compression is the main mode of deformation, while the other sensor is placed close to the farther end of the composite part (close to the stationary supports), where traction is supposed to be the predominant deformation mode.
In order to perform bending tests, 3D carbon fibre interlock reinforcement based composite specimens were prepared. Two sensors were inserted as weft during weaving of the 13 layer 3D-interlock reinforcement having layer-to-layer binding. These sensors were inserted just under the top and just above the bottom layers so that the sensors were supposed to follow the deformation pattern of two distinctive composite faces, corresponding to compression for the upper sensor and traction for the lower one.
Afterwards, these specimens were tested for bending employing the three-point bending test method. 39 Several different tests were performed in order to characterize the sensor response to various test configurations and fracture events.
Experimental details
Materials
Fibrous piezoresistive sensors were fabricated by coating polyethylene monofilaments with a conductive polymer composite, based on dispersion of carbon black particles (Printex® L6) in polymer (Evoprene® 007) solution, using chloroform as a solvent. 38
Sensor characteristics
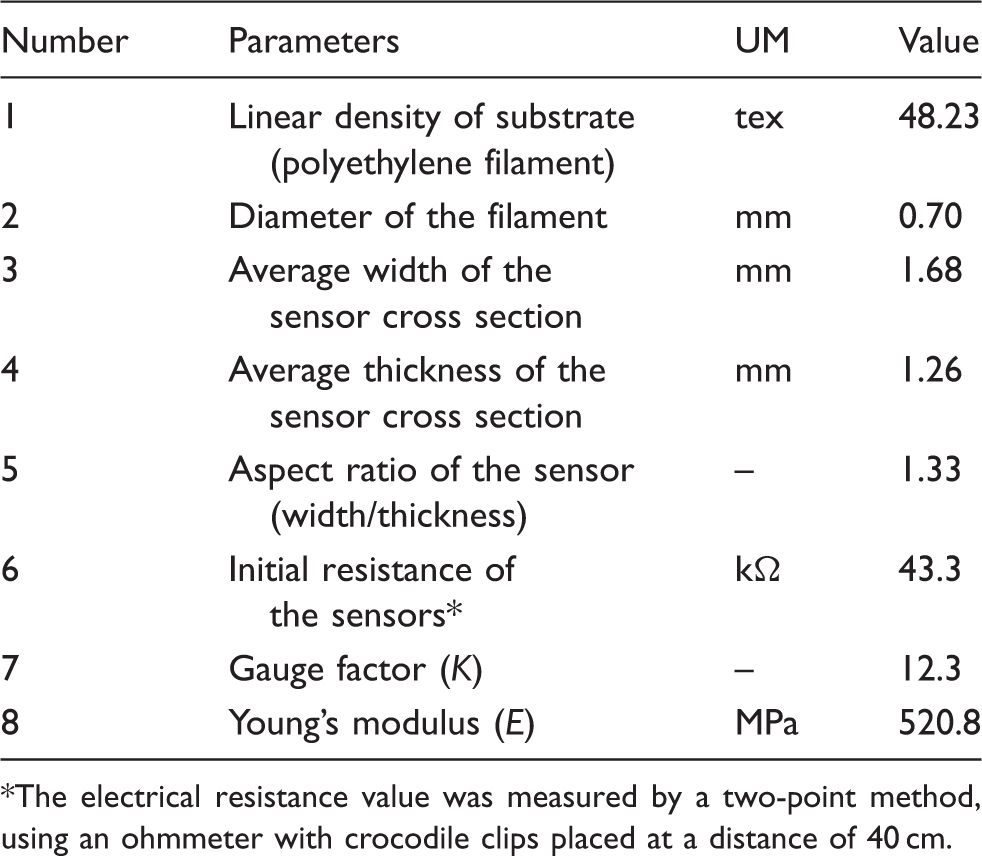
The electrical resistance value was measured by a two-point method, using an ohmmeter with crocodile clips placed at a distance of 40 cm.
The resistance that has been measured between two electrodes (crocodile clips, 40 cm apart) is the total electrical resistance of the conductive layer. It may be calculated from the relationship
Prior to insertion in the reinforcement, the sensor should be coated with an insulating layer. This is because of the fact that the carbon multifilament tows used for weaving of composite reinforcement are conductive and may disturb the functioning of piezoresistive fibrous sensor. Natural rubber-based latex supplied by VossChemie® was chosen as the final coating layer to insulate the sensor from surrounding carbon tows. The liquid latex is prevulcanized with sulfur and contains cross-linking points. Schematic diagram of sensor cross section is given in Figure 1.
Schematic diagram of sensor cross section inside a composite.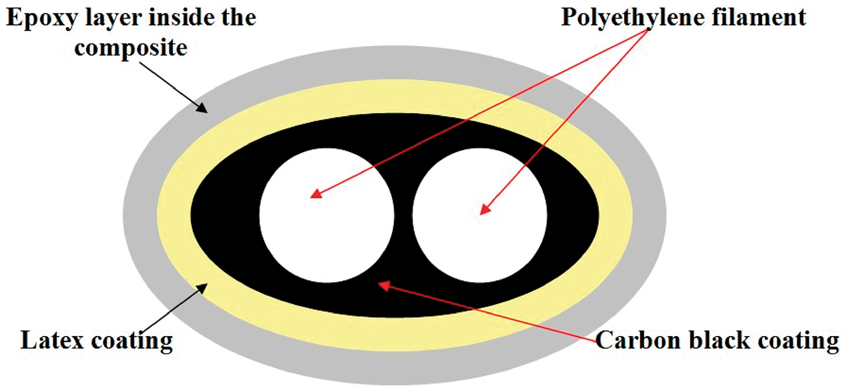
Prepared in this way, the sensor was tested on MTS 1/2 tester, under quasi-static tensile loading at a constant traverse rate of 5 mm/min. Keithley® KUSB-3100 data acquisition module was employed for the purpose of data acquisition and storage during all of the tests.
The resistance variation data thus obtained for different test results was treated for noise reduction using a low pass filter. The resultant stress–strain-normalized resistance relationship curve up to 2.7 % elongation of the out of composite sensor (before insertion into the reinforcement) is shown in Figure 2.
Normalized resistance and stress against strain for sensor outside composite.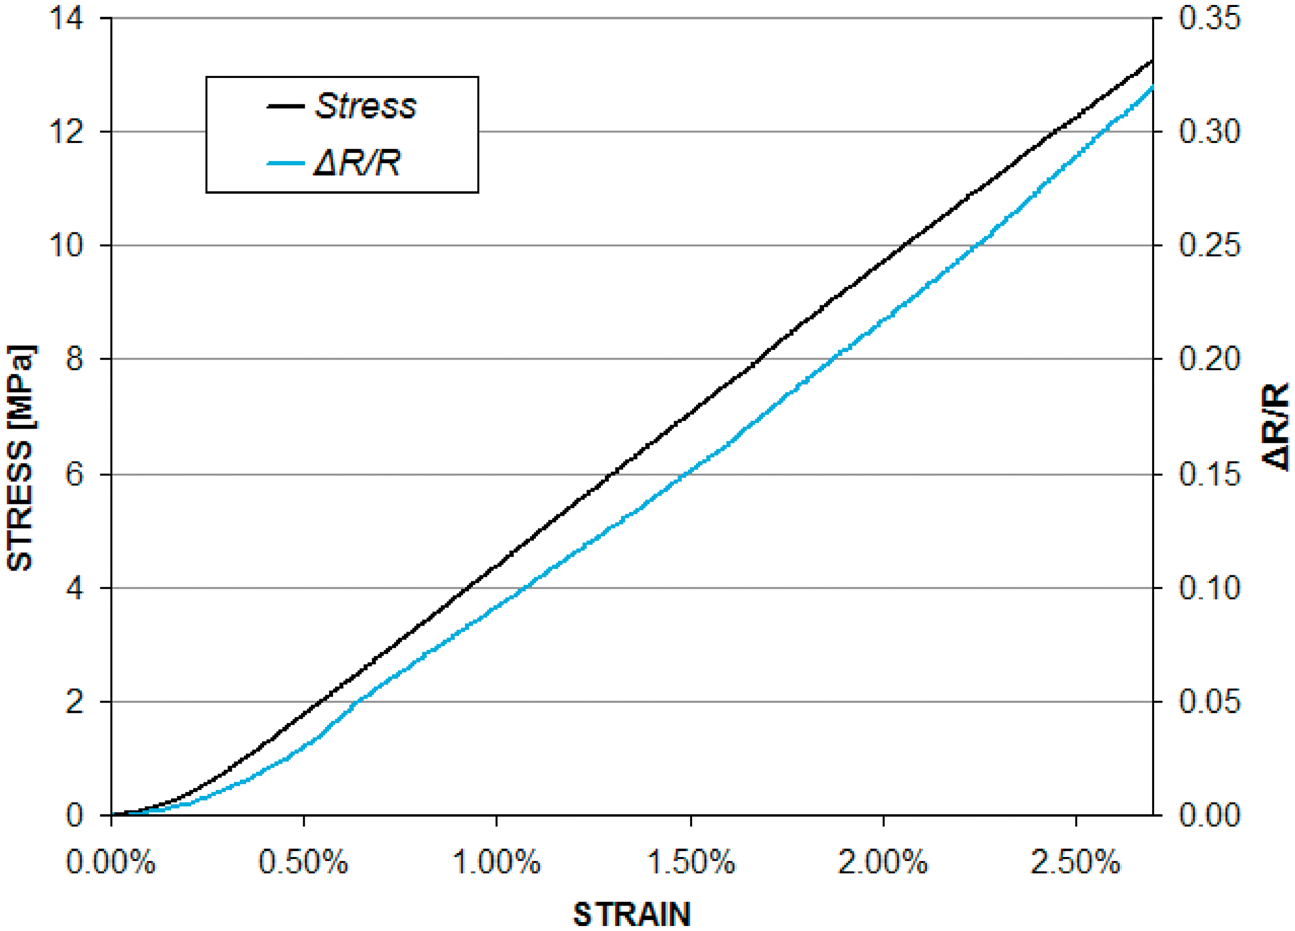
It is obvious in Figure 2 that the stress versus strain curve has the same form as normalized resistance (ΔR/R) versus strain curve. This fact affirms that the sensor could be used as an embedded strain gauge inside a composite.
This test also leads to the calculation of gauge factor and Young modulus values for the sensor. These values are given in Table 1.
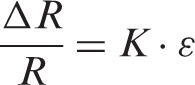
The linear relationship between relative electrical resistance change (ΔR/R) and the strain of the strain gauge can be given as follows:
Within the elastic limit, the stress–strain relationship can be given as follows:

Combining Equations (2) and (1), the following relationship is obtained:
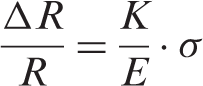
Figure 3 shows the comparison of calculated and measured variation of normalized electrical resistance as a function of applied stress for the sensor before its insertion in the reinforcement.
Calculated and measured variation of normalized electrical resistance with stress.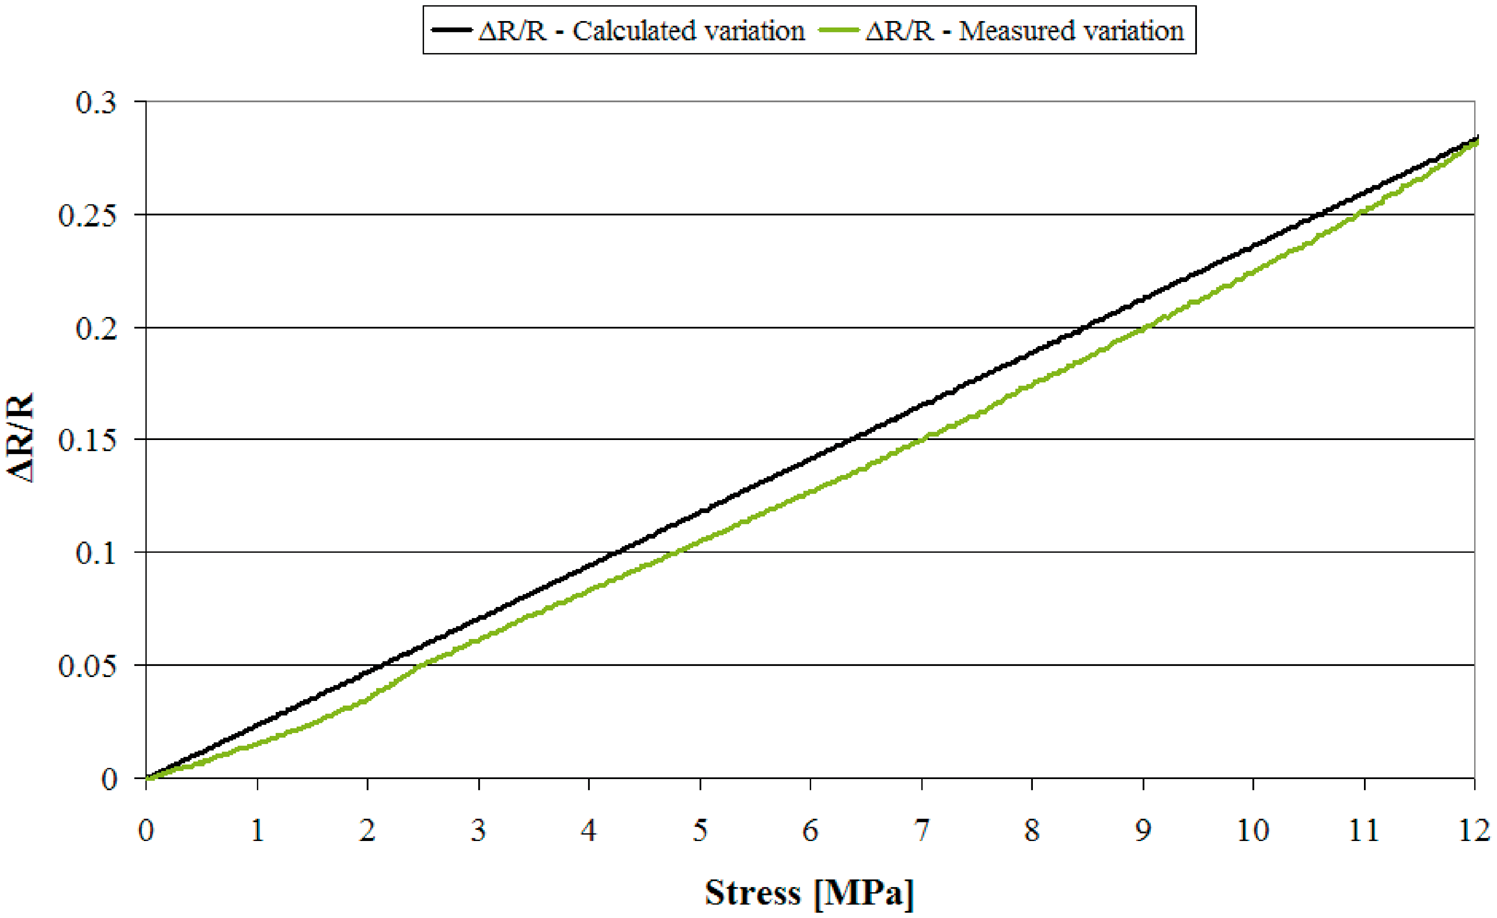
It can be observed in Figure 3 that the behaviour of the sensor is almost linear in the measured range. The calculated and measured plots for normalized resistance variation with the applied stress agree closely with one another. The slight deviation in measured sensor behaviour can be attributed to non-uniform coating at certain locations of the sensor. Although the sensor was coated very carefully using a manual coating technique but due to very volatile nature of the solvent and its short pot life, achieving uniform coatings is difficult and sometimes non-uniformity is caused on the surface in the form of micro-beads and fissures. The coating process needs further optimization.
Nevertheless the fibrous sensor is flexible, lightweight and is capable of adopting the geometry of the reinforcement and becoming its integral part. Figure 4 shows the fibrous sensor. Details of its connections at the two ends can also be observed in Figure 4. As shown in Figure 4, the two ends of the sensor were coated with silver paint and a fine copper wire was attached at the two ends to serve as low resistance contacts.
Carbon black coated sensor with silver coated connections.
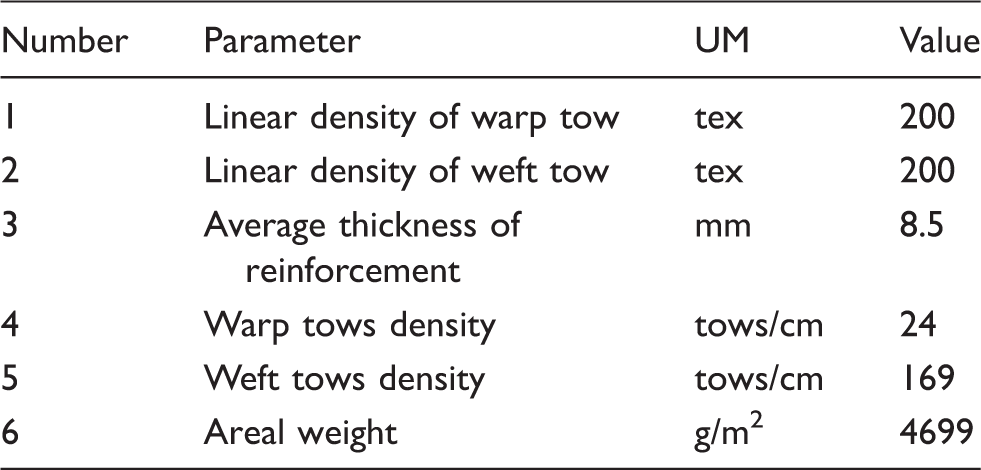
The 3D interlock fabric used as reinforcement was woven using 200 tex carbon tows in warp and weft having 6 K filaments in the cross section. These multifilament tows were provided by Hercules Inc.
The resin employed for impregnation of woven reinforcement was epoxy EPOLAM 5015.
Methods
Fabrication of 3D reinforcement and sensor insertion
As a 3D weave structure, an orthogonal interlock having 13 weft layers and 12 warp layers with layer-to-layer binding was chosen. This architecture was chosen in order to obtain a woven structure with maximum possible thickness on a weaving loom with 24 shafts and with the warp fed from a creel with the capacity of 900 packages. A relatively thick reinforcement allows the placement of sensors at the top and bottom so that during the bending tests, the upper sensor detects compression while the lower sensor undergoes traction. The thickness of the reinforcement depends on the number of warp and weft layers, warp and weft linear density (tex), warp and weft insertion densities (warp/cm and weft/cm) and crimp in undulating warp and weft tows.
Using a weaving loom with 24 shafts, it is possible to obtain an orthogonal structure with 22 warp layers and through-the-thickness binding threads. Such a fabric will have greater number of total layers but reduced tow densities in individual layers of warp (due to restrictions imposed by maximum limit of the creel [900 packages] and the width of the cloth). Reduced tow densities in individual layers would in turn negatively affect the tow stability in vertical columns and thus the overall thickness of the structure.
Therefore, the structure chosen for this study contains 25 layers: 12 layers of warp tows (each with 2 distinct evolutions) and 13 layers of weft tows. Layer-to-layer orthogonal binding with binding depth of 2 layers (the warp binder interlocks two successive layers) results in high crimp of tows which increases the fabric thickness. This particular woven architecture determines ultimate crimp in warp and weft directions in the composite. Crimp in warp and weft is responsible for elongation at break of the composite in two mutually orthogonal directions. 40
Reinforcement specifications
The reinforcement was woven on a modified weaving loom - ARM PATRONIC® (Figure 5).
Weaving of interlock reinforcement on modified loom (ARM PATRONIC®).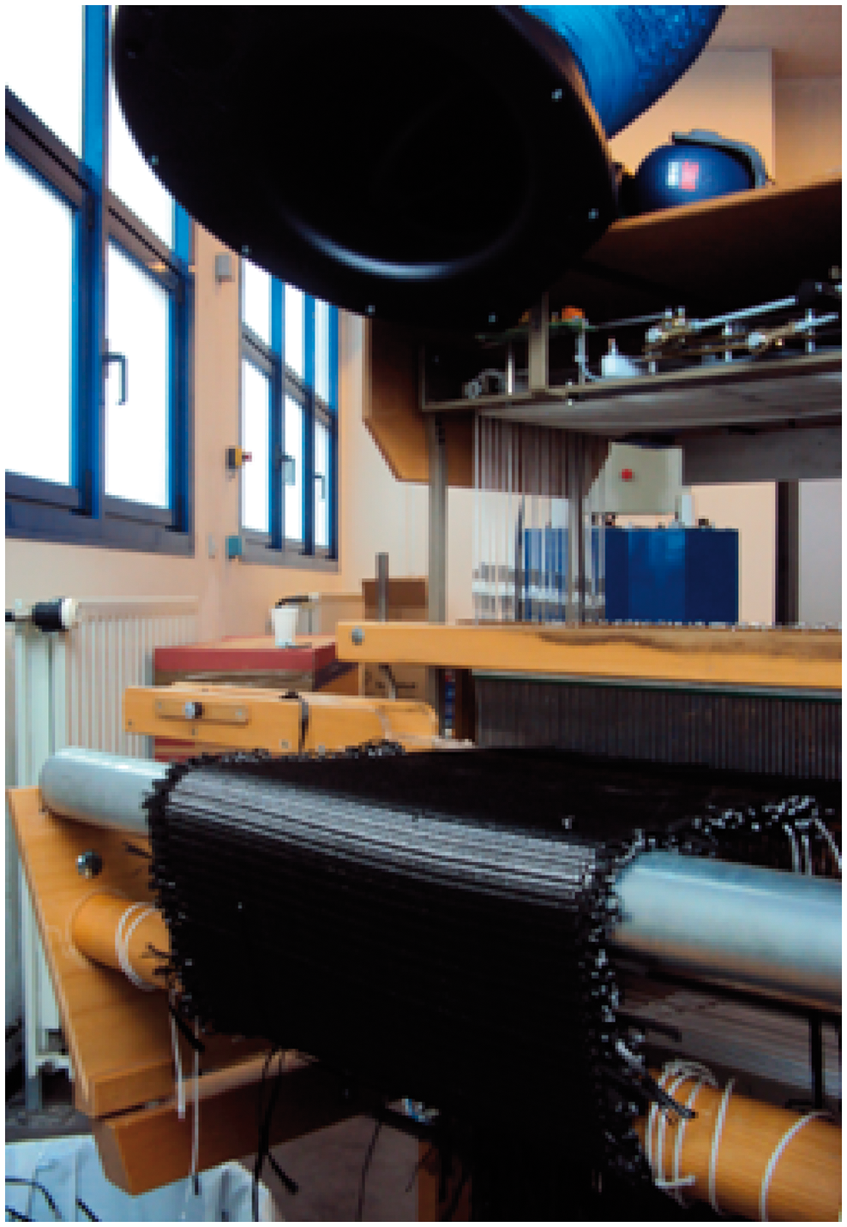
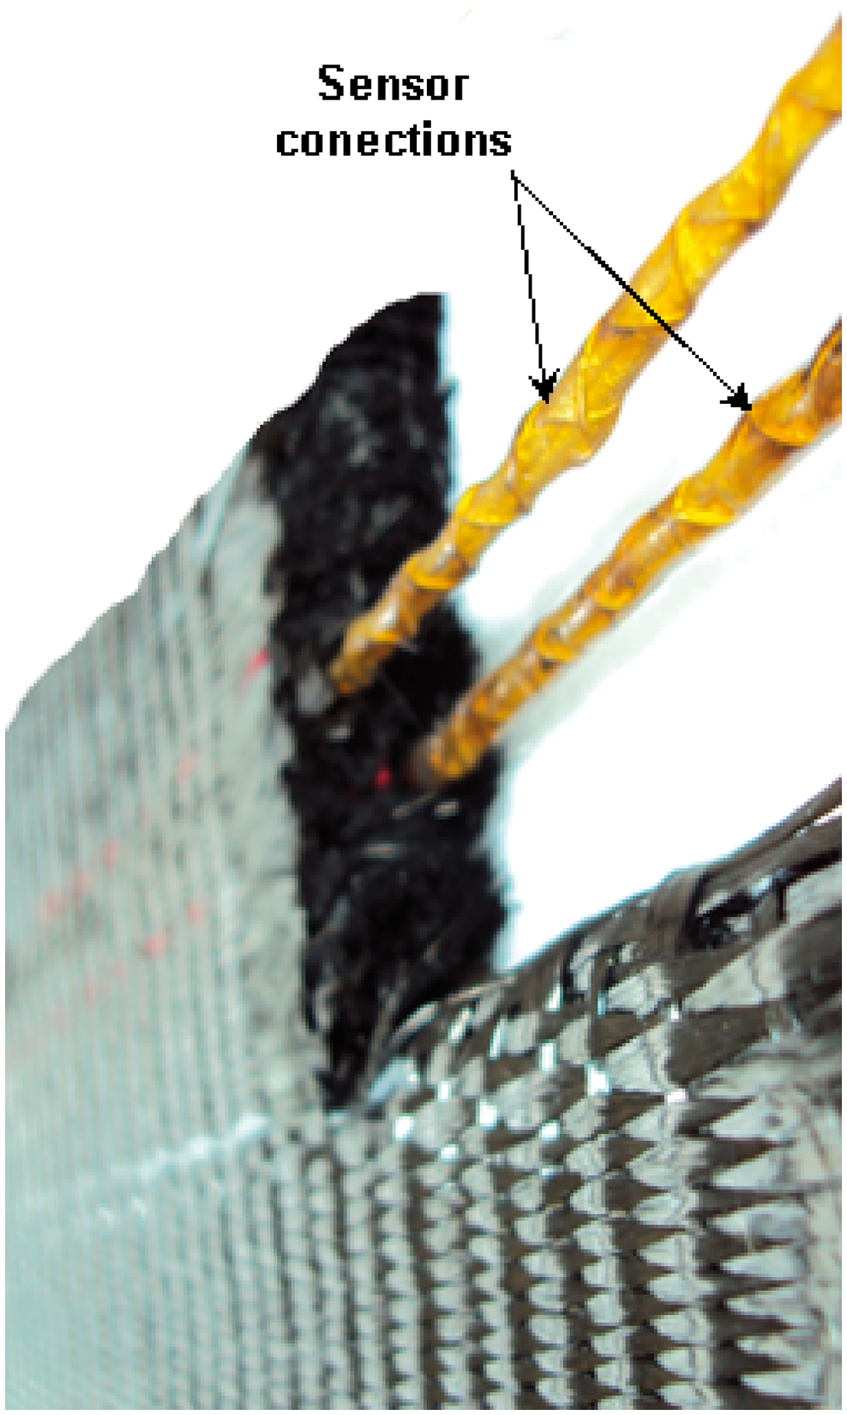
The fibrous sensors were inserted as weft during weaving at the top and bottom of the reinforcement. The TexGen® generated geometry of the reinforcement is shown in Figure 6. It is evident from Figure 6 that the top sensor was inserted in the 2nd layer in the weft column whereas the bottom sensor was inserted in the 12th layer of another weft column. These sensors were inserted in addition to the carbon tows in their respective layers so that the double weft insertion took place in these two layers (2nd and 12th). The sensors are flexible and follow the trajectory of weft tows inside the reinforcement, as can be observed in Figure 6. The surface photograph of this reinforcement with protruding sensor connections is shown in Figure 7. It can also be observed from Figures 6 and that the two sensors were not placed in the same vertical plane. In fact the distance between the columns containing sensors is 0.5 mm.
TexGen® generated geometry of a 13-layer interlock weave structure used as reinforcement: (a) the weave repeat; (b) the path of sensors inserted as weft tows in the woven reinforcement. Carbon fibre reinforcement with protruding sensor connections.
Intelligent textile composite manufacturing
After weaving, the reinforcement was carefully removed from the loom. The 13-layer reinforcement with integrated sensors was directly impregnated in resin using VARTM technology. The four connections of top and bottom sensors which remain outside the reinforcement at the two ends were carefully isolated from the rest of the mould so as to protect them and to prevent their resin impregnation. This was achieved by creating two vacuum sub-moulds inside the larger mould. The surface photograph of the reinforcement with protruding sensor connections protected by vacuum sub-moulds is shown in Figure 8.
Surface photograph of 13 layer interlock reinforcement with protruding sensor connections, prepared for resin impregnation.
After impregnation the average thickness of carbon composite was measured to be 8.4 mm. The length of the composite specimens for bending tests was calculated as a function of thickness value, according to the norm.
39
The composite was then cut into slabs of calculated dimensions of 16.5 cm × 1.5 cm. In this way, each of the three carbon composite specimens had two sensors for compression and traction detection, as shown in Figure 9.
Carbon composite specimen with protruding sensor connections.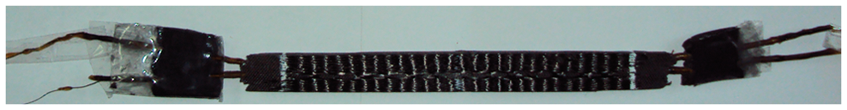
Electrical resistance measurement
The top and bottom sensors were connected in Wheatstone bridge configuration to a data acquisition module in order to record resistance variation. A commercially available data acquisition module Keithley® KUSB-3100 was employed for the purpose of data acquisition during bending tests. Special data amplification and linearization modules were attached to the data acquisition module in order to reduce noise and to amplify the sensor signal. Schematic representation of the data acquisition set up is shown in Figure 10.
Schematic diagram of instrumentation amplifier and data acquisition module connected to sensors in Wheatstone bridge configuration.
Bending tests
The three-point bending tests on composite samples were carried out on Instron 1185 tester, according to the same norm.
39
In Figure 11, the composite specimen is seen loaded on an Instron tester during the three-point bending test.
Carbon composite specimen is seen loaded on an Instron 1185 Tester.
Two initial tests were carried out on 3D carbon interlock-based composite sample prior to its loading until complete fracture. At first the specimen was tested at constant displacement rate of 3.5 mm/min until maximum displacement of 3 mm was achieved. Afterwards the composite sample was tested at a higher constant displacement rate of 250 mm/min until maximum displacement of 3 mm. A final bending test was then performed during which the specimen was loaded until fracture. For all the tests, the normalized resistance outputs of the sensors were plotted against the force–displacement curves.
Results and discussion
Figure 12 shows the force–displacement plot against variation in normalized resistance of the two sensors inside composite specimen at a constant displacement rate of 3.5 mm/min (for maximum displacement of 3 mm) whereas the force–displacement plot against variation in the normalized resistance of the two sensors inside composite specimen at a constant displacement rate of 250 mm/min (for maximum displacement of 3 mm) can be observed in Figure 13.
Force–displacement plots against normalized resistance variation for the two sensors inside composite specimen at a constant displacement rate of 3.5 mm/min. Force–displacement plots against normalized resistance variation for the two sensors inside composite specimen at a constant displacement rate of 250 mm/min.
It is evident from these initial tests that the upper sensor resistance decreases as it undergoes compression while the lower sensor resistance increases as it is subjected to tensile loading during the three-point bending tests. Moreover, a comparison of normalized resistance curves for respective sensors at two different loading rates shown in Figures 12 and 13 reveal that the sensor signal has more noise at higher loading speed. This noise can be attributed to micro-cracks appearing at the sensor–resin interface at higher displacement rate. Formation of these cracks at the sensor–resin interface may result in momentary arrest and then release of sensor in its socket. Moreover, forming and breaking of percolation networks inside the sensor also appear as noise in the plots.
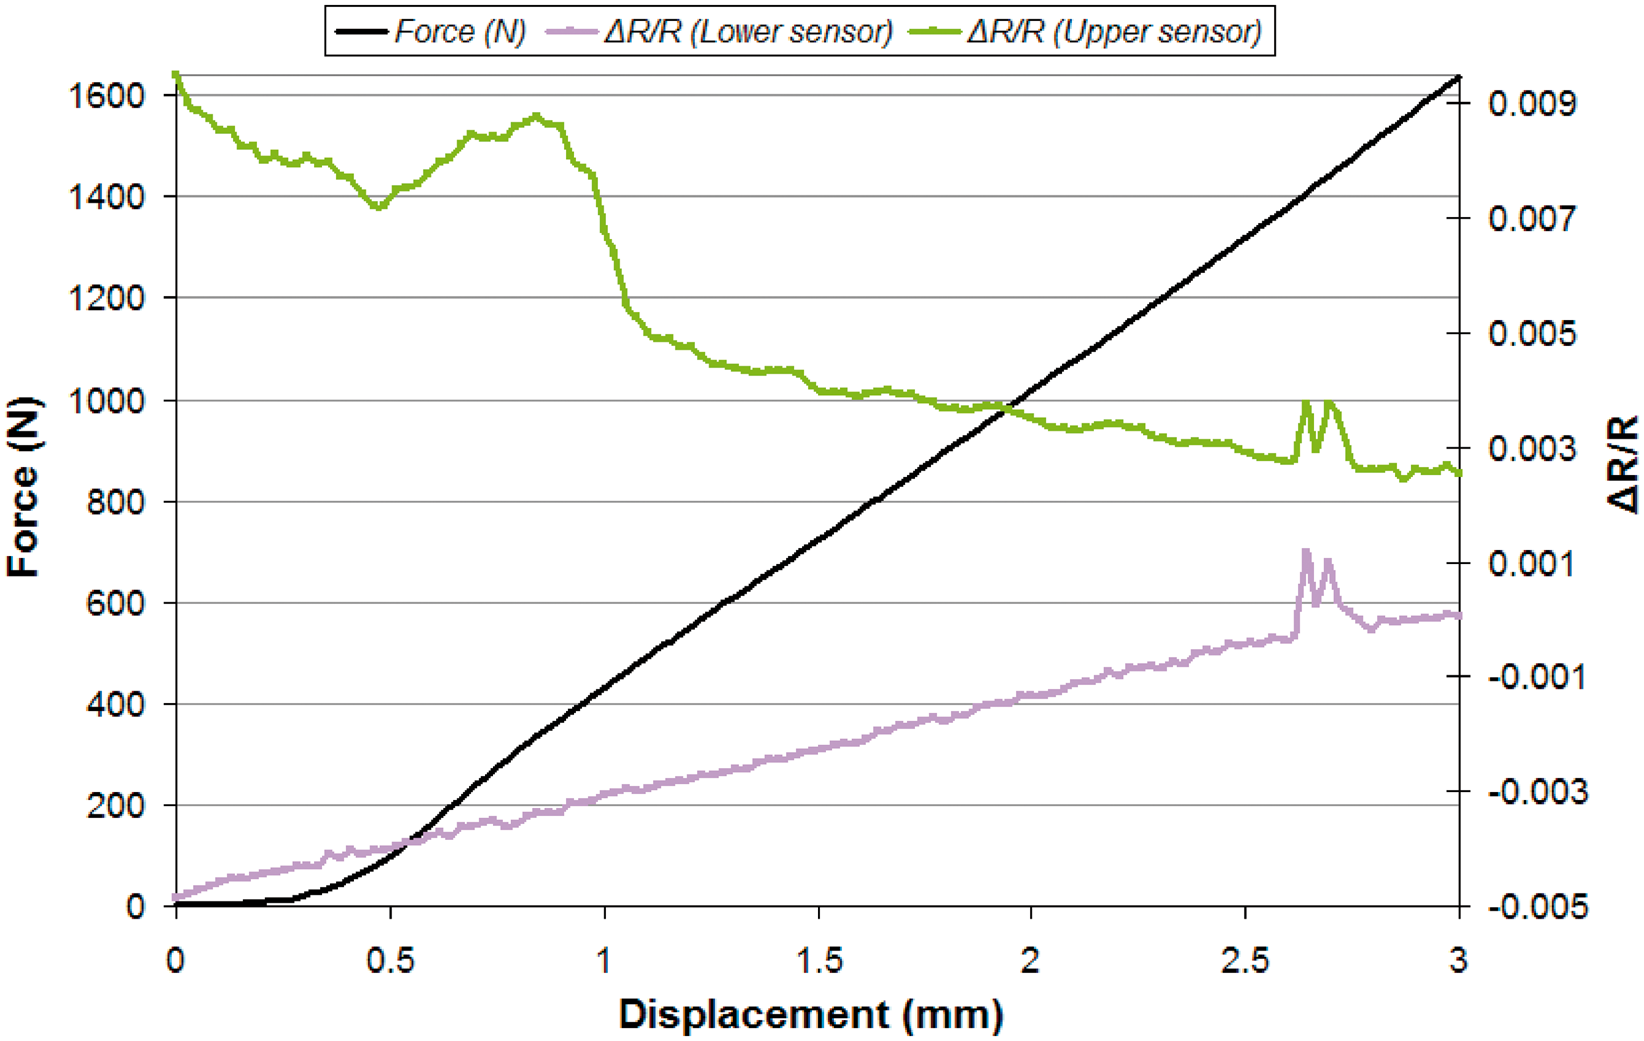
After the initial tests performed until maximum displacement of 3 mm, a final three-point bending test was performed until complete fracture of the specimen, at a constant displacement rate of 3.5 mm/min. The resultant force–displacement curve plotted against variation in normalized resistance for the two sensors is shown in Figure 14.
Force–displacement plot against normalized resistance variation for the two sensors inside a 3D carbon composite specimen tested until fracture at a constant displacement rate of 3.5 mm/min.
The analysis of test results plotted in Figure 14 shows that the sensors are capable of following the loading and onset of damage in the composite. A small peak in the upper sensor plot is followed by the maximum load in the force–displacement plot. This load coincides with a bend in the lower sensor plot. This might be because the maximum force does not necessarily correspond with rupture in all of the composite layers. The maximum compression loading may have been achieved before the maximum tensile loading. The slope of the upper and lower sensor plots generally changes after the rupture of the composite. The upper sensor plot soon afterwards saturates whereas the lower sensor plot continues to follow the tensile loading of the lower composite part. Each load drop in the force–displacement curve coincides with sharp vertical rise in lower sensor curve until the composite sample fails completely and the saturation point of upper sensor output is achieved as well.
Observation of transversal sections of tested composite specimens given in Figure 15(a) and (b) show that the main mode of fracture is the onset of compression and tensile cracks. These cracks appear under the bending arm due to quasi-static compression loading and just above the bottom stationary supports due to tensile loading which then propagate transversally along the thickness of the composite specimen. Since the carbon composite is reinforced with 3D-layer-to-layer interlock reinforcement, the transversal cracks are unable to cause considerable delamination in the composite specimen. This is obvious from the absence of inter-layer slippage which is usually caused by inter-laminar shearing. In general, delamination cracks are hindered by the presence of binding z-tows in 3D composites. These binders limit inter-laminar crack length through crack arrest phenomena. This phenomenon of crack arrest is also responsible for considerably high distribution of micro-cracks in the 3D composite.
41
Some of these cracks can also be observed in Figure 15.
Photographs of transversal sections of tested 3D carbon composite specimen.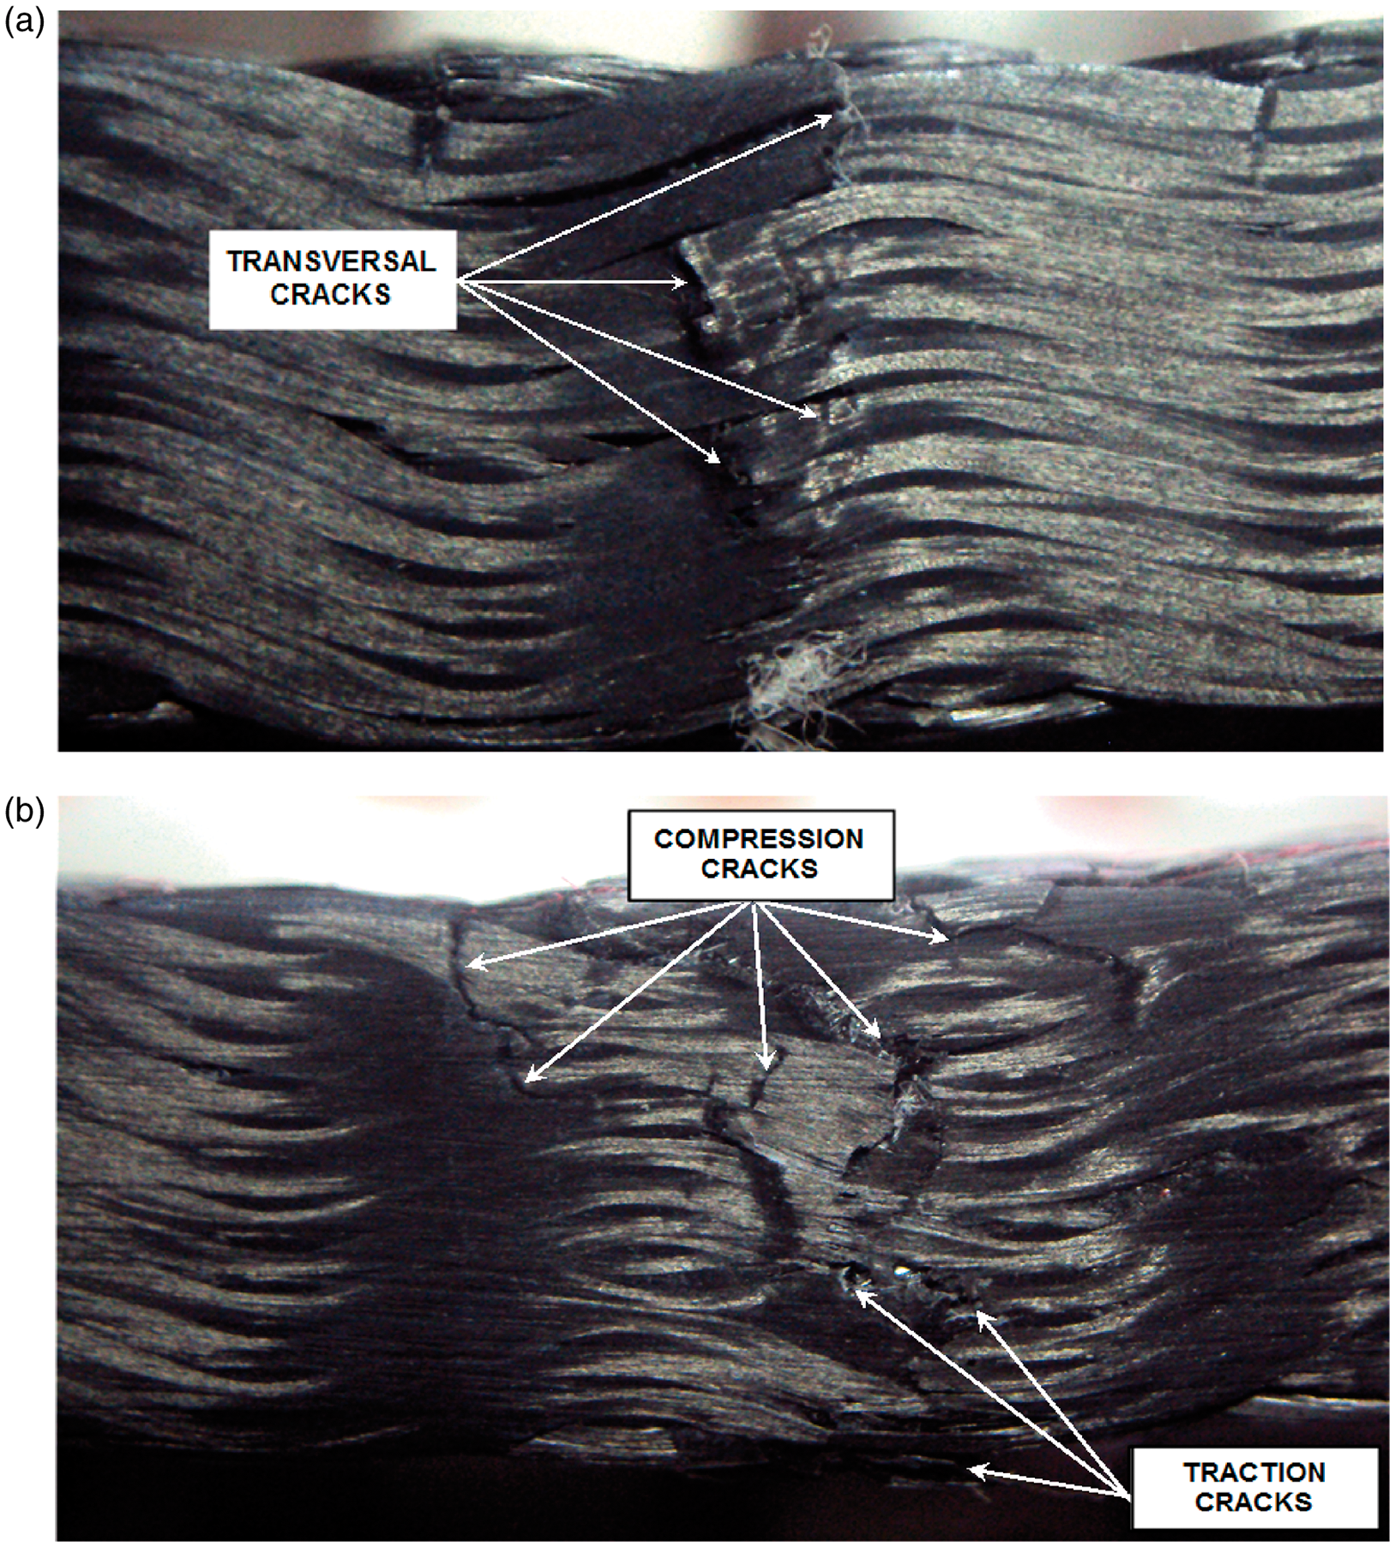
Crimp in the sensor does not have a negative influence over its damage detection capability. This is because of the fact that the sensor is constrained by the tows inside the reinforcement. Moreover, when the resin impregnation takes place, further sensor fixation is affected. Since the sensor adopts the geometry of reinforcement tows, it is expected to deform much like the surrounding tows inside the composite. Therefore, sensor crimp does not adversely affect its sensitivity and damage detection ability. This conjecture is supported by the plots given in Figure 14.
It is a known fact that latex/epoxy and latex/SBS (styrene–butadiene–styrene) have very good adhesion with CB content. However, tensile tests on similar composites with embedded sensors were done in order to verify the adhesion. Figure 16 presents a microtomographical screenshot of fibrous sensor inside a composite in the fracture zone, after the quasi-static tensile test.
Screenshot from a microtomographical video of the fibrous sensor inside the composite after the tensile test (fracture zone).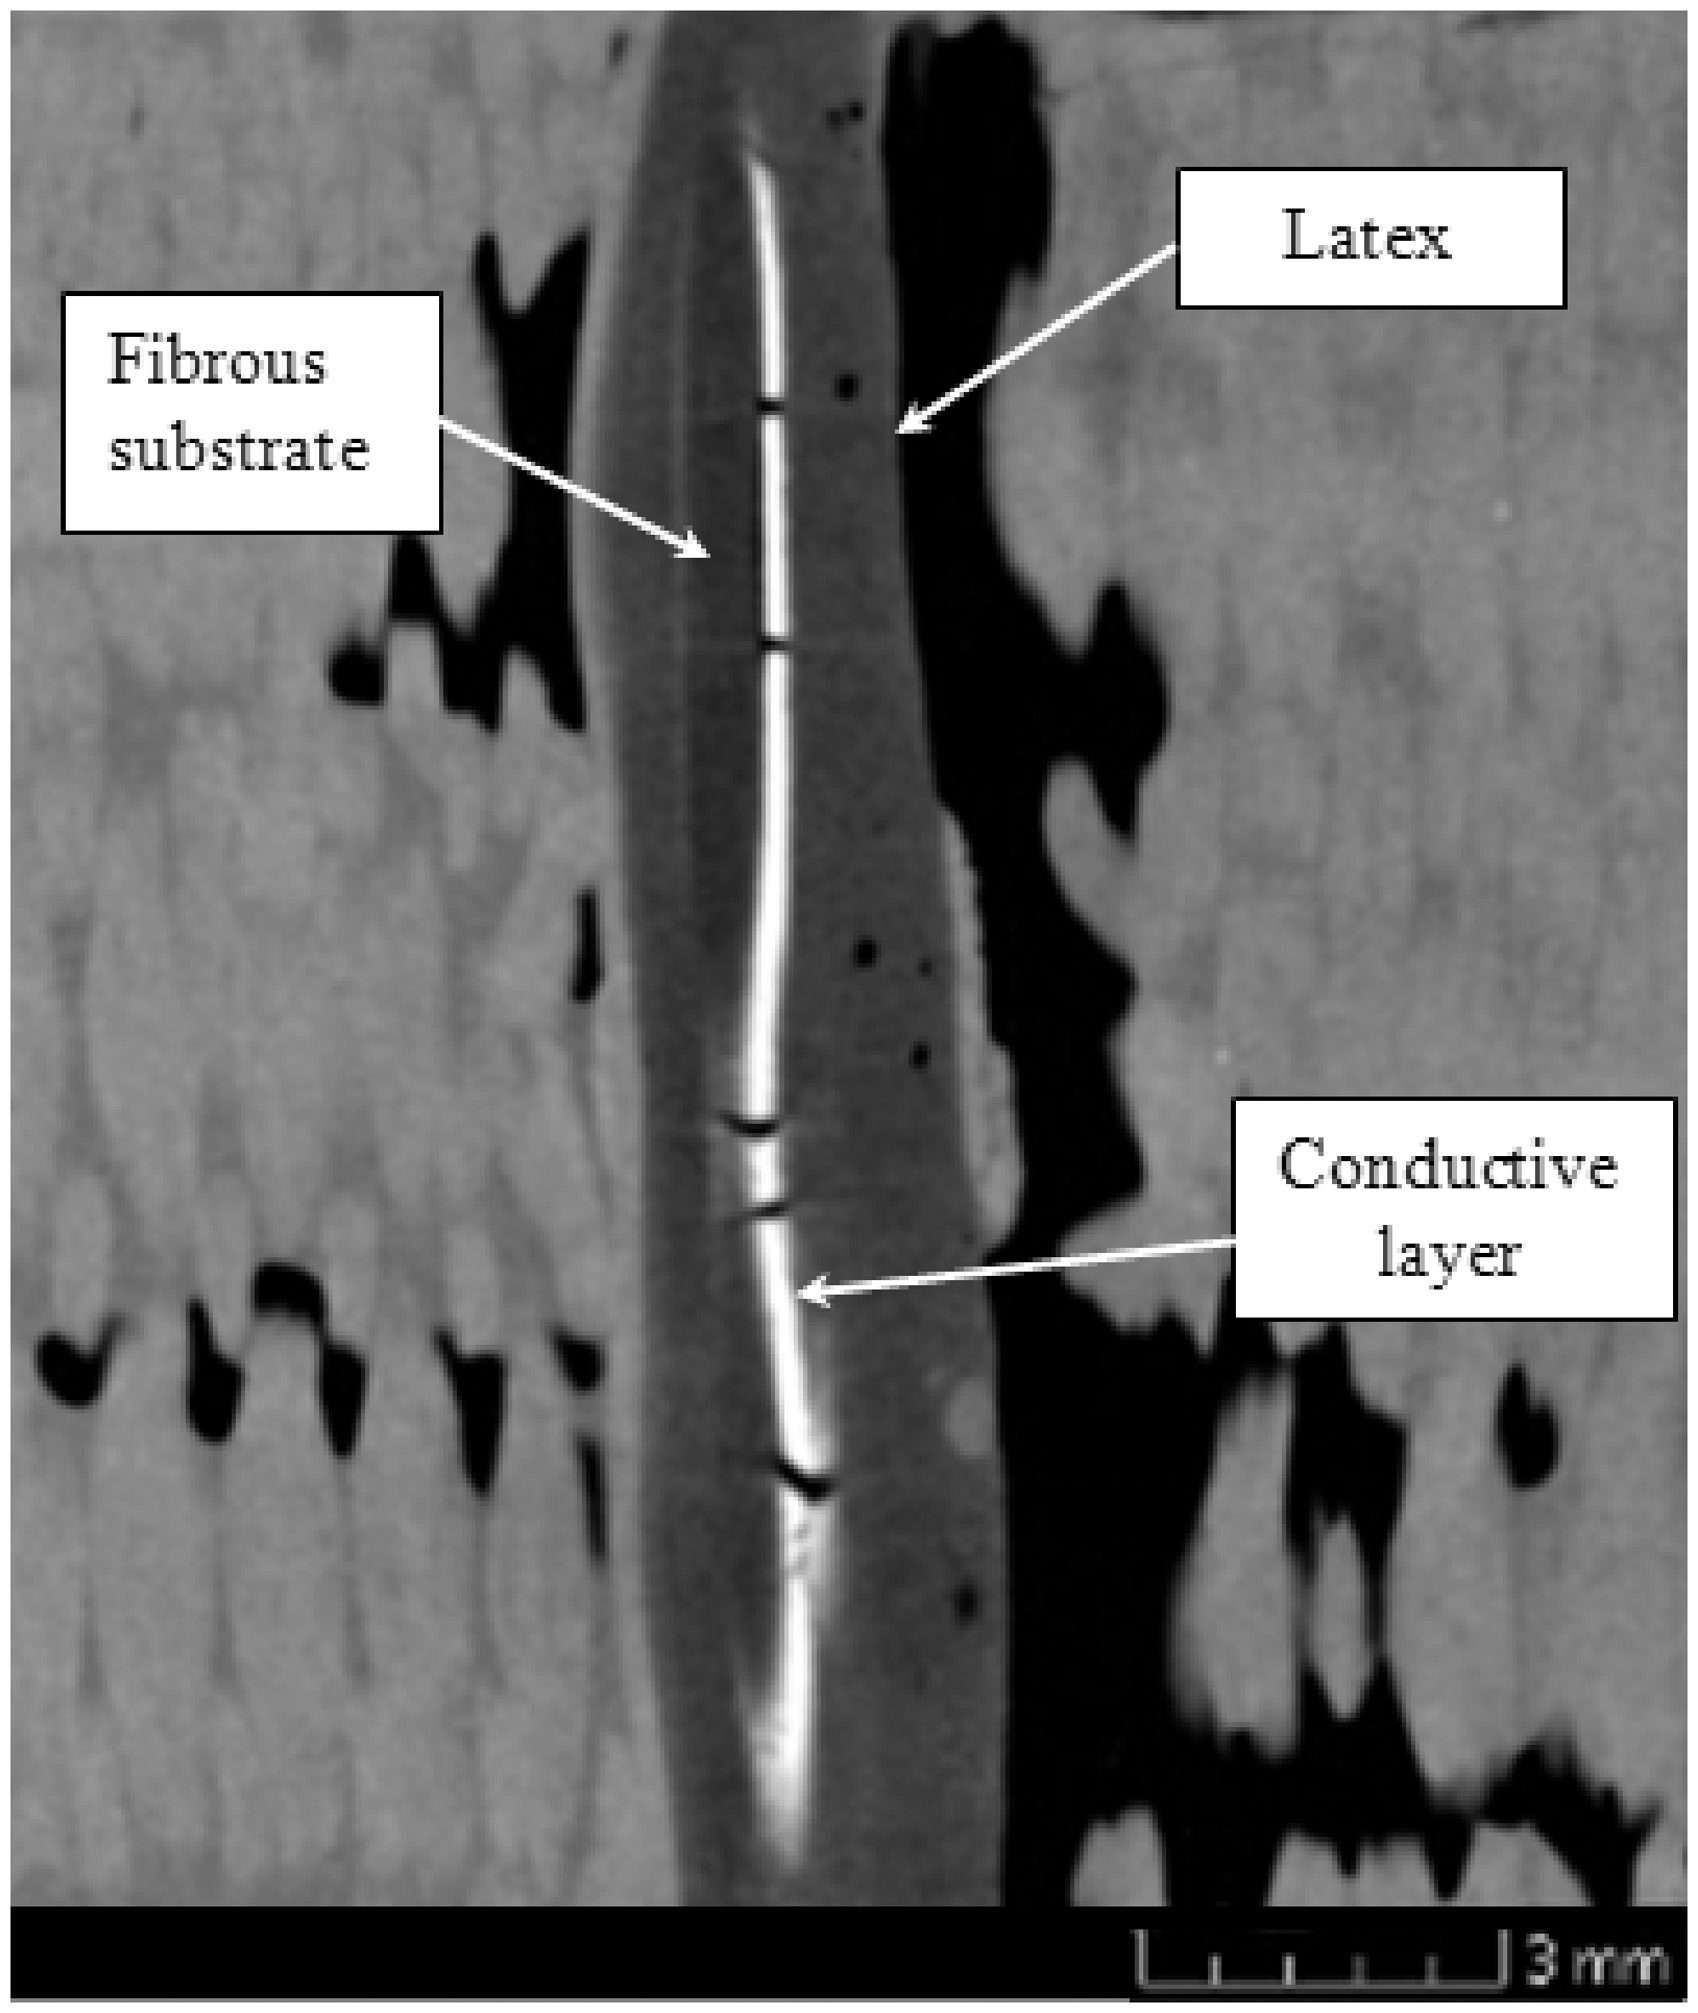
It can be observed that even in the fracture zone, the embedded sensor has not completely debonded from the bulk of the composite. This is a proof of very strong latex–epoxy adhesion. Small cracks do appear in the conductive layer. These cracks can be observed in Figure 16. However, the latex layer which acts as an insulating medium between the bulk of the composite and the conductive carbon layer remains intact.
Conclusion
Fibrous sensors which are able to measure compression and traction have been successfully embedded in a 3D interlock reinforcement so as to map the stress–strain history at different locations of the resulting composite. The sensors are not only flexible, lightweight and low cost, but are also capable of being inserted inside the reinforcement during the production phase. This property allows their integration during weaving. Moreover their strategic location inside the reinforcement and their sensitivity is useful for extracting maximum information related to deforming phenomena occurring during loading. Three-point bending test results given in this paper indicate that very useful data on the deformation mechanisms and stress–strain conditions is obtained. This is made possible by the insertion of sensors inside the 3D reinforcement in two different layers. The results presented in this article show that these sensors can be integrated inside the 3D interlock reinforcement to form an ‘intelligent textile neural network’. However, the interpretation of information gathered from sensor signals needs to be further honed. This would require extensive testing of different reinforcements under different loading conditions. The test results presented in this paper show that the sensor is ideal for integration in the reinforcement during weaving owing to its flexibility and fibrous nature, the study of impact of sensor integration inside the reinforcement on composite strength needs to be carried out. The study should include a comparison of composite mechanical properties prior to integration and after the integration of sensor.
Footnotes
Acknowledgments
The authors would like to commend the help and technical assistance provided by Daniel Zakrewski of Ecole de Mines de Douai, France and Pierre Marie Rogier of IFTH Laboratories, Lille, France.
Funding
This research received no specific grant from any funding agency in the public, commercial, or not-for-profit sectors.