Fabrics manufactured in Italy with 100% Sardinian sheep breed wool, traditionally named ‘Orbace’, and with local Tuscan wool from 50% Sardinian and 50% Comisana sheep breeds wool (Tuscan Cloth), were subjected to sensory evaluation, through descriptive analysis performed by a trained panel, and to an instrumental evaluation method, through FAST – Fabric Assurance by Simple Testing. The correlation between instrumental data and sensory attributes was investigated. Sensory evaluation indicated that Orbace fabrics, originated from 100% Sardinian wool, had higher grittiness, stiffness, force of compression and hand friction and lower softness and tensile stretch, as compared to the fabrics obtained from mixed wool. Principal component analysis (PCA) indicated a high correlation for grittiness, stiffness and force of compression in one direction, tensile stretch, softness, warmth and fullness in the opposite, clearly discriminating in this dimension Orbaces from Tuscan fabrics. This discrimination appears to be an effect of the wool used for the different fabrics. Differences in key sensory traits were also recorded among fabrics derived from the same raw material, but differing in weave. Thickness, as the key attribute of the second PCA dimension, provided discriminations within groups and is reasonably perceived as an effect of different weaves. Canonical Correlation Analysis indicated that measurements performed with FAST were correlated with a number of basic touch traits, including softness, stiffness, force of compression and tensile stretch. Orbace and Tuscan Cloth handle definition, on the basis of sensory and instrumental measures, will be of use to describe and protect original products.
Italy has a historical tradition in wool textile production1,2 and traditional fabrics are still manufactured in some geographical areas, which represent typical products closely connected to the local environment, culture and traditions. To assess the peculiar traits of these fabrics, through sensory and instrumental analysis, is a tool to characterize products and insert them into a production and marketing system, where they can be differentiated and indicated as authentic. Sensory properties of fabrics are appreciated through manipulation, namely ‘handle’, usually performed by textile manufactures (weavers, finishers), vendors and tailors, but also by consumers. The assessment of handle characteristics is an important tool not only for innovative product development,3 but also to investigate, define and safeguard the original quality of traditional fabrics. As assessed by Pan,4 ‘it is hard to imagine a consumer buying a textile product without touching it’. Consumers’ purchase of a textile product usually includes touching the fabric and a comparison of its tactile properties with personal expectations in terms of fabric quality.5,6 Furthermore, product information, such as local identity or the sense of belonging to an area, plays a fundamental role in determining a consumer’s choice;7 this approach can be of major importance for tourists, looking for textile products with traits of typicality and authenticity.8 Sensory profiling can provide the basis for a touch experience that can ease the tourist–vendor relationship.
Handle, despite being addressed as ‘subjective’,9 is a recognized tool for evaluating fabric quality. Sensory evaluation of fabrics has been thoroughly studied to provide descriptors and analytical protocols10,11 and to facilitate consumer–manufacturer communication.12,13 Some authors6 found sensory evaluation time consuming and expensive, and emphasized the need for reliable and practical instrumental methods to accurately predict sensory tactile attributes. The instrumental approach is not expected to simulate the richness of human perception,12 but to provide objective measurements correlated to fabric handle and related quality levels. The topic of measuring the tactile feeling of fabrics according to their physical, mechanical, thermal and surface properties was first proposed by Peirce.14 In the 1970s, Kawabata and Niwa founded the Hand Evaluation and Standardization Committee and developed objective measuring tools based on instrumental technology, creating the KES-F (Kawabata Evaluation System for Fabric).15 In 1990, the Australian Commonwealth Scientific and Industrial Research Organisation (CSIRO) designed and developed the FAST (Fabric Assurance by Simple Testing) set of instruments, providing greater ease and testing speed. Both systems can be used to obtain considerable information about fabric handle.16–19 The KES-F is indispensable for research on fabric mechanical properties at low-stress level loads, but it is too expensive for most small companies/users.4,20 The price, together with its simpler use, makes the FAST system more attractive for the industry21 and, thus, also more appropriate for the present research, aimed at relatively limited productions.
Although the measurement of fabric properties with the FAST instruments is relatively simple, interpretation of data in a form that can be used by industry is more complex. Interpretation of data requires the understanding of the mechanisms by which fabric properties affect their performance in garment manufacture. In addition, this instrumental approach has some limitations, because determining the relationship between instrumental measurements and the consumers’ perception is not simple.22 Therefore, the sensory evaluation method becomes essential to characterize the tactile feeling as a consumer evaluation.
According to Miller,23 the difference between subjective quality and objective quality is that the former is perceived, while the latter can be quantified, in part, by mechanical properties. To link these two aspects can improve overall quality, since irregularities arising from production can be controlled.
Correlation between tactile properties and instrumental approaches has been studied in relation to the effect of structure parameters on the tactile properties of knitted fabrics22 and the effect of processes, such as laundering24 and finishing treatments, on cotton fabrics.22,25,26 Fabric comfort has also been approached through integrated studies of sensory and mechanical measurements.27,28 In addition, several attempts have been made to model the relationship between tactile sensory attributes of fabrics and their instrumental measurements by methods based on intelligent techniques (neural networks, fuzzy logic…).29
FAST measurements have also been studied for their correlations with the tactile feeling of crispness and coolness30 and with softness and warmth of woollen and worsted fabrics of pure wool and wool/other animal hair blends.31 FAST proved useful for the textile factories’ need to control and manage processes aimed at specific handle characteristics using an objective system. Correlations between visual and touch sensory evaluation of fabric and FAST measurements have also been investigated.32
The present study was aimed to provide manufacturers with sensory profiles of the traditional Sardinian fabric, Orbace, and fabrics made with local Tuscan wools. Orbace fabrics are commonly used to tailor the traditional Sardinian folk costumes and by some local dress-makers for local craft garments. Tuscan Cloths tested in these trials have never been used in the textile industry or craft manufacturing for clothing or interior/furnishing textiles. Both types of fabrics could be used to tailor country-style clothing to be promoted and marketed in tourist circuits.
The correlations of sensory data with those provided by FAST instruments are studied for the first time through CCA (Canonical Correlation Analysis), with the aim of orienting traditional fabric production toward a defined handle, possibly supporting consumers in recognizing them as typical regional productions.
Materials and methods
Textile samples
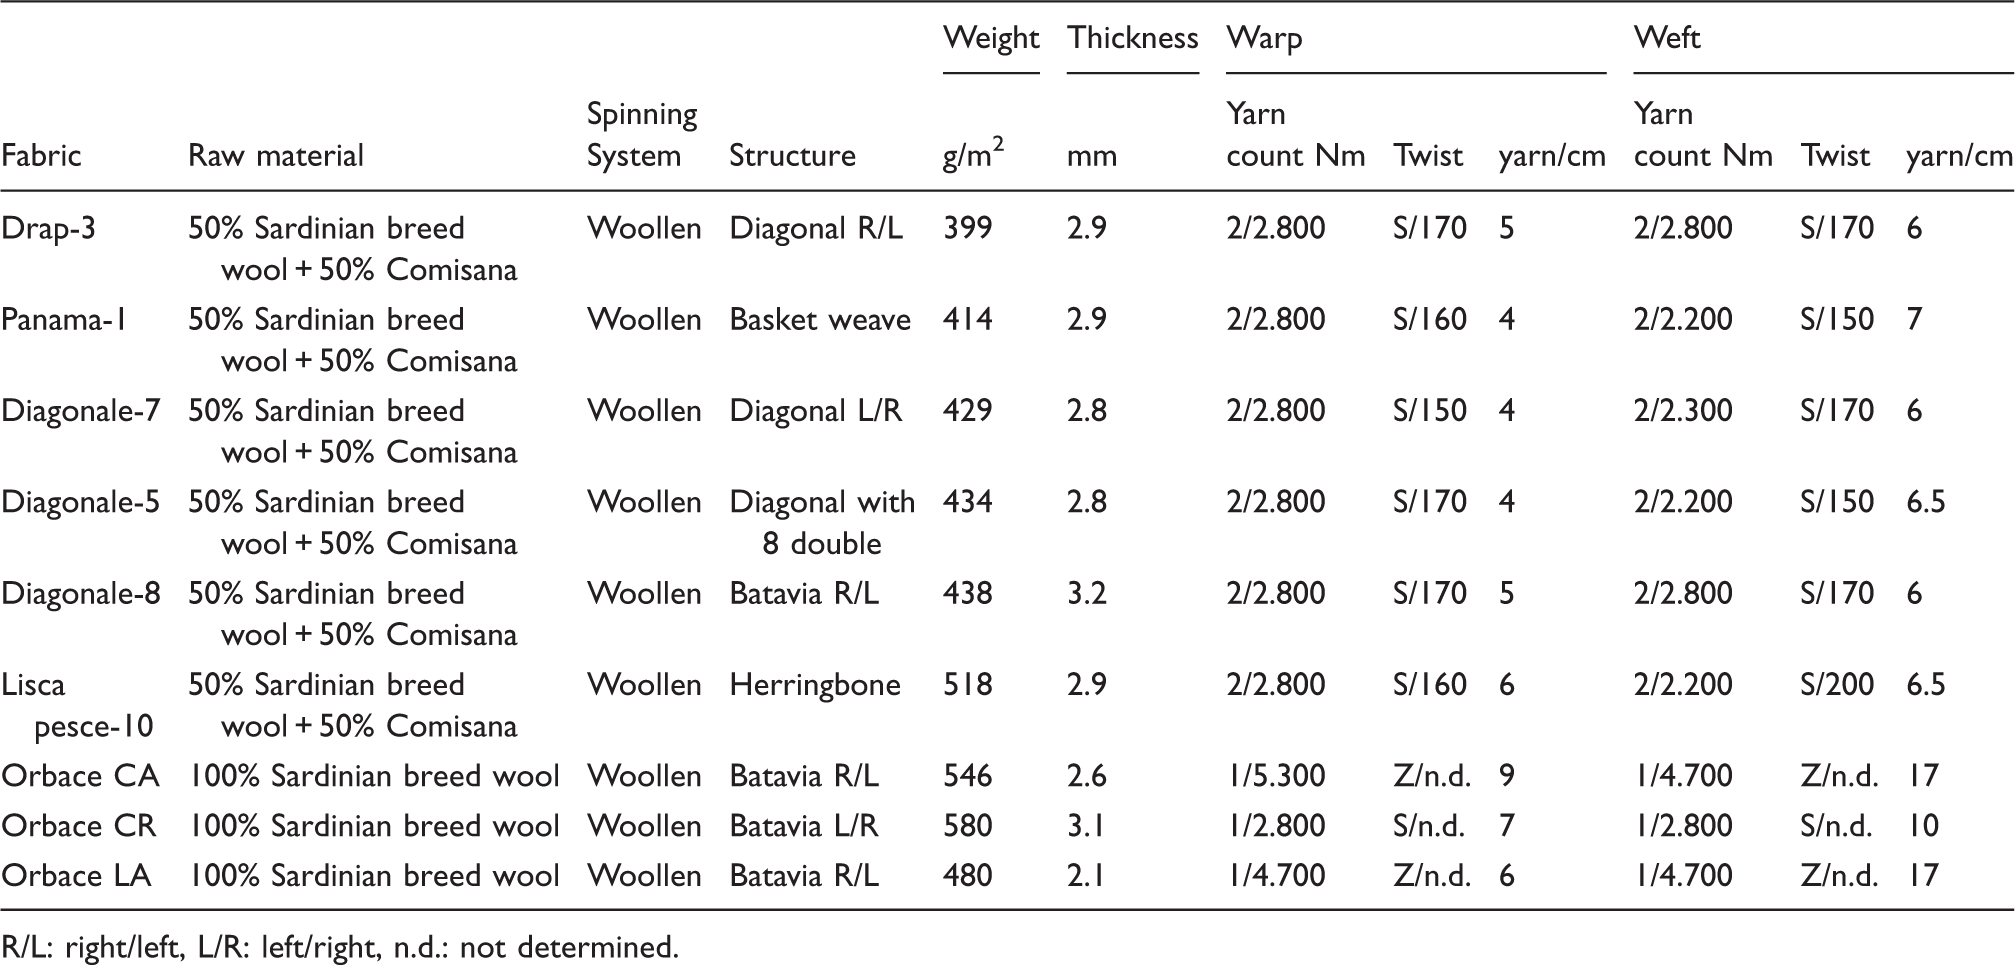
Nine fabrics, made from Italian wool, have been chosen in this study for their similarities in production methods and final use. Three samples (Orbace CA, Orbace CR and Orbace LA) were typical fabrics produced by three different textile manufactures in Sardinia and were made with 100% wool from the Sardinian sheep breed. Six samples, Drap-3 (Drap), Panama-1 (Basket weave), Diagonale-7 (Diagonal), Diagonale-5 (Diagonal), Diagonale-8 (Diagonal) and Lisca pesce-10 (Herringbone), were made by a textile manufacturer in Tuscany using a mixed wool from local Tuscan Comisana and Sardinian sheep breeds. Comisana wool was used in the mixture to improve some handle characteristics of related fabrics, since Comisana is a finer wool than Sardinian. Physical parameters, such as weight and thickness, and technical data on warp and weft were determined (Table 1).
Details of fabric physical properties
Fabric
Raw material
Spinning System
Structure
Weight
Thickness
Warp
Weft
g/m2
mm
Yarn count Nm
Twist
yarn/cm
Yarn count Nm
Twist
yarn/cm
Drap-3
50% Sardinian breed wool + 50% Comisana
Woollen
Diagonal R/L
399
2.9
2/2.800
S/170
5
2/2.800
S/170
6
Panama-1
50% Sardinian breed wool + 50% Comisana
Woollen
Basket weave
414
2.9
2/2.800
S/160
4
2/2.200
S/150
7
Diagonale-7
50% Sardinian breed wool + 50% Comisana
Woollen
Diagonal L/R
429
2.8
2/2.800
S/150
4
2/2.300
S/170
6
Diagonale-5
50% Sardinian breed wool + 50% Comisana
Woollen
Diagonal with 8 double
434
2.8
2/2.800
S/170
4
2/2.200
S/150
6.5
Diagonale-8
50% Sardinian breed wool + 50% Comisana
Woollen
Batavia R/L
438
3.2
2/2.800
S/170
5
2/2.800
S/170
6
Lisca pesce-10
50% Sardinian breed wool + 50% Comisana
Woollen
Herringbone
518
2.9
2/2.800
S/160
6
2/2.200
S/200
6.5
Orbace CA
100% Sardinian breed wool
Woollen
Batavia R/L
546
2.6
1/5.300
Z/n.d.
9
1/4.700
Z/n.d.
17
Orbace CR
100% Sardinian breed wool
Woollen
Batavia L/R
580
3.1
1/2.800
S/n.d.
7
1/2.800
S/n.d.
10
Orbace LA
100% Sardinian breed wool
Woollen
Batavia R/L
480
2.1
1/4.700
Z/n.d.
6
1/4.700
Z/n.d.
17
R/L: right/left, L/R: left/right, n.d.: not determined.
Samples were prepared from the same bolt of fabric for hand manipulation and FAST analysis. Before the tests started, all samples were conditioned for a minimum of 48 h under standard atmospheric conditions (20 ± 2°C temperature, 65 ± 2% relative humidity).
Panel training
Research assistants or graduate students at Florence University, Prato Campus, Faculty of Economics, Course in Marketing and Internationalization of Textile and Wearing, were contacted and trained on sensory evaluation of textiles. Training was conducted on the basis of handle trait definition and assessment protocols described in the scientific literature.11,26,33 Panelists were trained on the intensity of sensory traits with the use of a 0–15 structured scale,34 performing manipulation and comparison of fabric samples providing a wide range of touch feeling for each attribute. On the basis of 21 sensory traits suggested by Civille and Dus,11 12 sensory descriptors were finally chosen for the study: grittiness, roughness, homogeneity (proposed to simplify panelists’ work, as the lack of graininess, lumpiness and fuzziness), warmth, softness, thickness, stiffness, force of compression, fullness, tensile stretch, hand friction and fabric friction. Definitions and manipulation protocols were adapted from the literature on the basis of panel consensus and as related to the fabric to be tested (Table 2). After four 2-hour training sessions, preliminary tests were conducted and Kendall’s coefficient of concordance test was performed to determine whether there was agreement between panelists’ replicates. The performance of each panelist was checked for validity and reproducibility. Results allowed the selection of a panel, consisting of 10 females and 2 males, to run descriptive analysis tests.
List of tactile attributes, indications for performing manipulation, sensation to be appreciated and intensity range
Tactile attributes
Manipulation protocol
Sensation to appreciate
Intensity range
Grittiness
Lay fabric sample on a flat surface and move first the palm and then the back of your hand horizontally across fabric surface.
The presence of small abrasive prickly particles on the surface of the sample.
From ‘Not Gritty’ to ‘Gritty’.
Roughness
Lay fabric sample on a flat surface and move first the palm and then the back of your hand horizontally across fabric surface in the direction perpendicular to weft and warp.
The presence of indentations and ridges systematically on the surface of the sample.
From ‘Smooth’ to ‘Rough’.
Homogeneity
Lay fabric sample on a flat surface and move first the palm and then the back of your hand horizontally across fabric surface.
The uniform presence of particles on the fabric surface.
From ‘Not homogeneous’ to ‘Homogeneous’.
Warmth
Lay fabric sample on a flat surface and move first the palm and then the back of your hand horizontally across fabric surface.
The difference of a thermal nature between fabric and hand.
From ‘Cool’ to ‘Warm’.
Softness
Squeeze the fabric sample between your thumb and index fingertips.
The degree of fabric resistance to thumb and index fingertip approach.
From ‘No soft’ to ‘High soft’.
Thickness
Hold the fabric sample tightly between thumb and index fingertips.
The perceived distance between thumb and index fingertips.
From ‘Thin’ to ‘Thick’.
Stiffness
Lay fabric sample on a flat surface, hold it between the thumb and the other four fingers and move it back and forth.
The degree of fabric resistance to bending.
From ‘Pliable (Bendable)’ to ‘Stiff’.
Force of compression
Place the fabric sample in the palm and close hand to compression (fist).
The amount of force required to compress the gathered sample in the palm.
From ‘Low force’ to ‘High force’.
Fullness
Place the fabric sample in the palm and close hand.
The amount of sample felt in the hand during manipulation.
From ‘Low amount of sample’ to ‘High amount of sample’.
Tensile stretch
Take the fabric sample with both hands and pull.
The degree to which the sample stretches from its original shape.
From ‘No stretch’ to ‘High stretch’.
Hand friction
Lay fabric sample on a flat surface and move your hand horizontally across the surface.
The force required to move the hand across the surface.
From ‘No drag’ to ‘High drag’.
Fabric friction
Rub the fabric sample over itself.
The force required to move the fabric over itself.
From ‘No drag’ to ‘High drag’.
Sensory test
Wool fabric samples (30 cm × 30 cm) were submitted to sensory evaluation through descriptive analysis. Traits to be evaluated and the manipulation protocol are described in Table 2. To avoid interaction with visual perception, samples were placed in boxes (35 cm × 48 cm × 18 cm) to allow panelists to focus only on touch. Boxes were identified by three-digit numbers and presented to panelists in fully randomized order. Four sensory analysis sessions, one a week, were held to provide experimental data.
FAST analyses
Fabric properties measured using the FAST system are detailed in Table 3.
Fabric properties measured using the Fabric Assurance by Simple Testing (FAST) system
Thickness of surface layer: ST = T2 – T100 (where T100 = thickness at 9.81 kPa), bbending rigidity: B = W × C3 × 9.81 × 10–6 (where C = bending length in mm, W = fabric weight in g/m2), cshear rigidity: G = 123/EB5 (bias extension), dformability: F = ((E20 – E5) × B)/14.7 (where E20 = extension to 4.9 N/m; E5 = extension to 19.6 N/m).
Statistical treatment of data
The Statistical Analysis System (SAS) for Windows (version 9.2 TS2M3; SAS Institute, Cary, NC) and R version 2.11.1 with SensoMineR package (version 1.11) were used for statistical analysis. The data analysis consisted in unidimensional (Analysis of Variance (ANOVA)) and multidimensional (Principal Component Analysis (PCA)) analysis of sensory data. Subsequently, the examination of the relationship between sensory attributes and instrumental measurements was performed based on canonical correlation (CCA) and redundancy analysis.35 For the purpose of CCA, sensory attributes were selected among those more connected to instrumental measurements (e.g. hand-evaluated force of compression = FAST-measured compression). The mean value of each attribute and instrumental measurements, respectively, were used as sets of input variables (n = 9). Since variables are not measured with the same units, data are interpreted as standardized coefficients. Canonical redundancy analysis was used to investigate the amount of redundancy (or variance) that the canonical components account for in their ‘own’ and ‘opposite’ set of variables.36
Results and discussion
Sensory evaluation
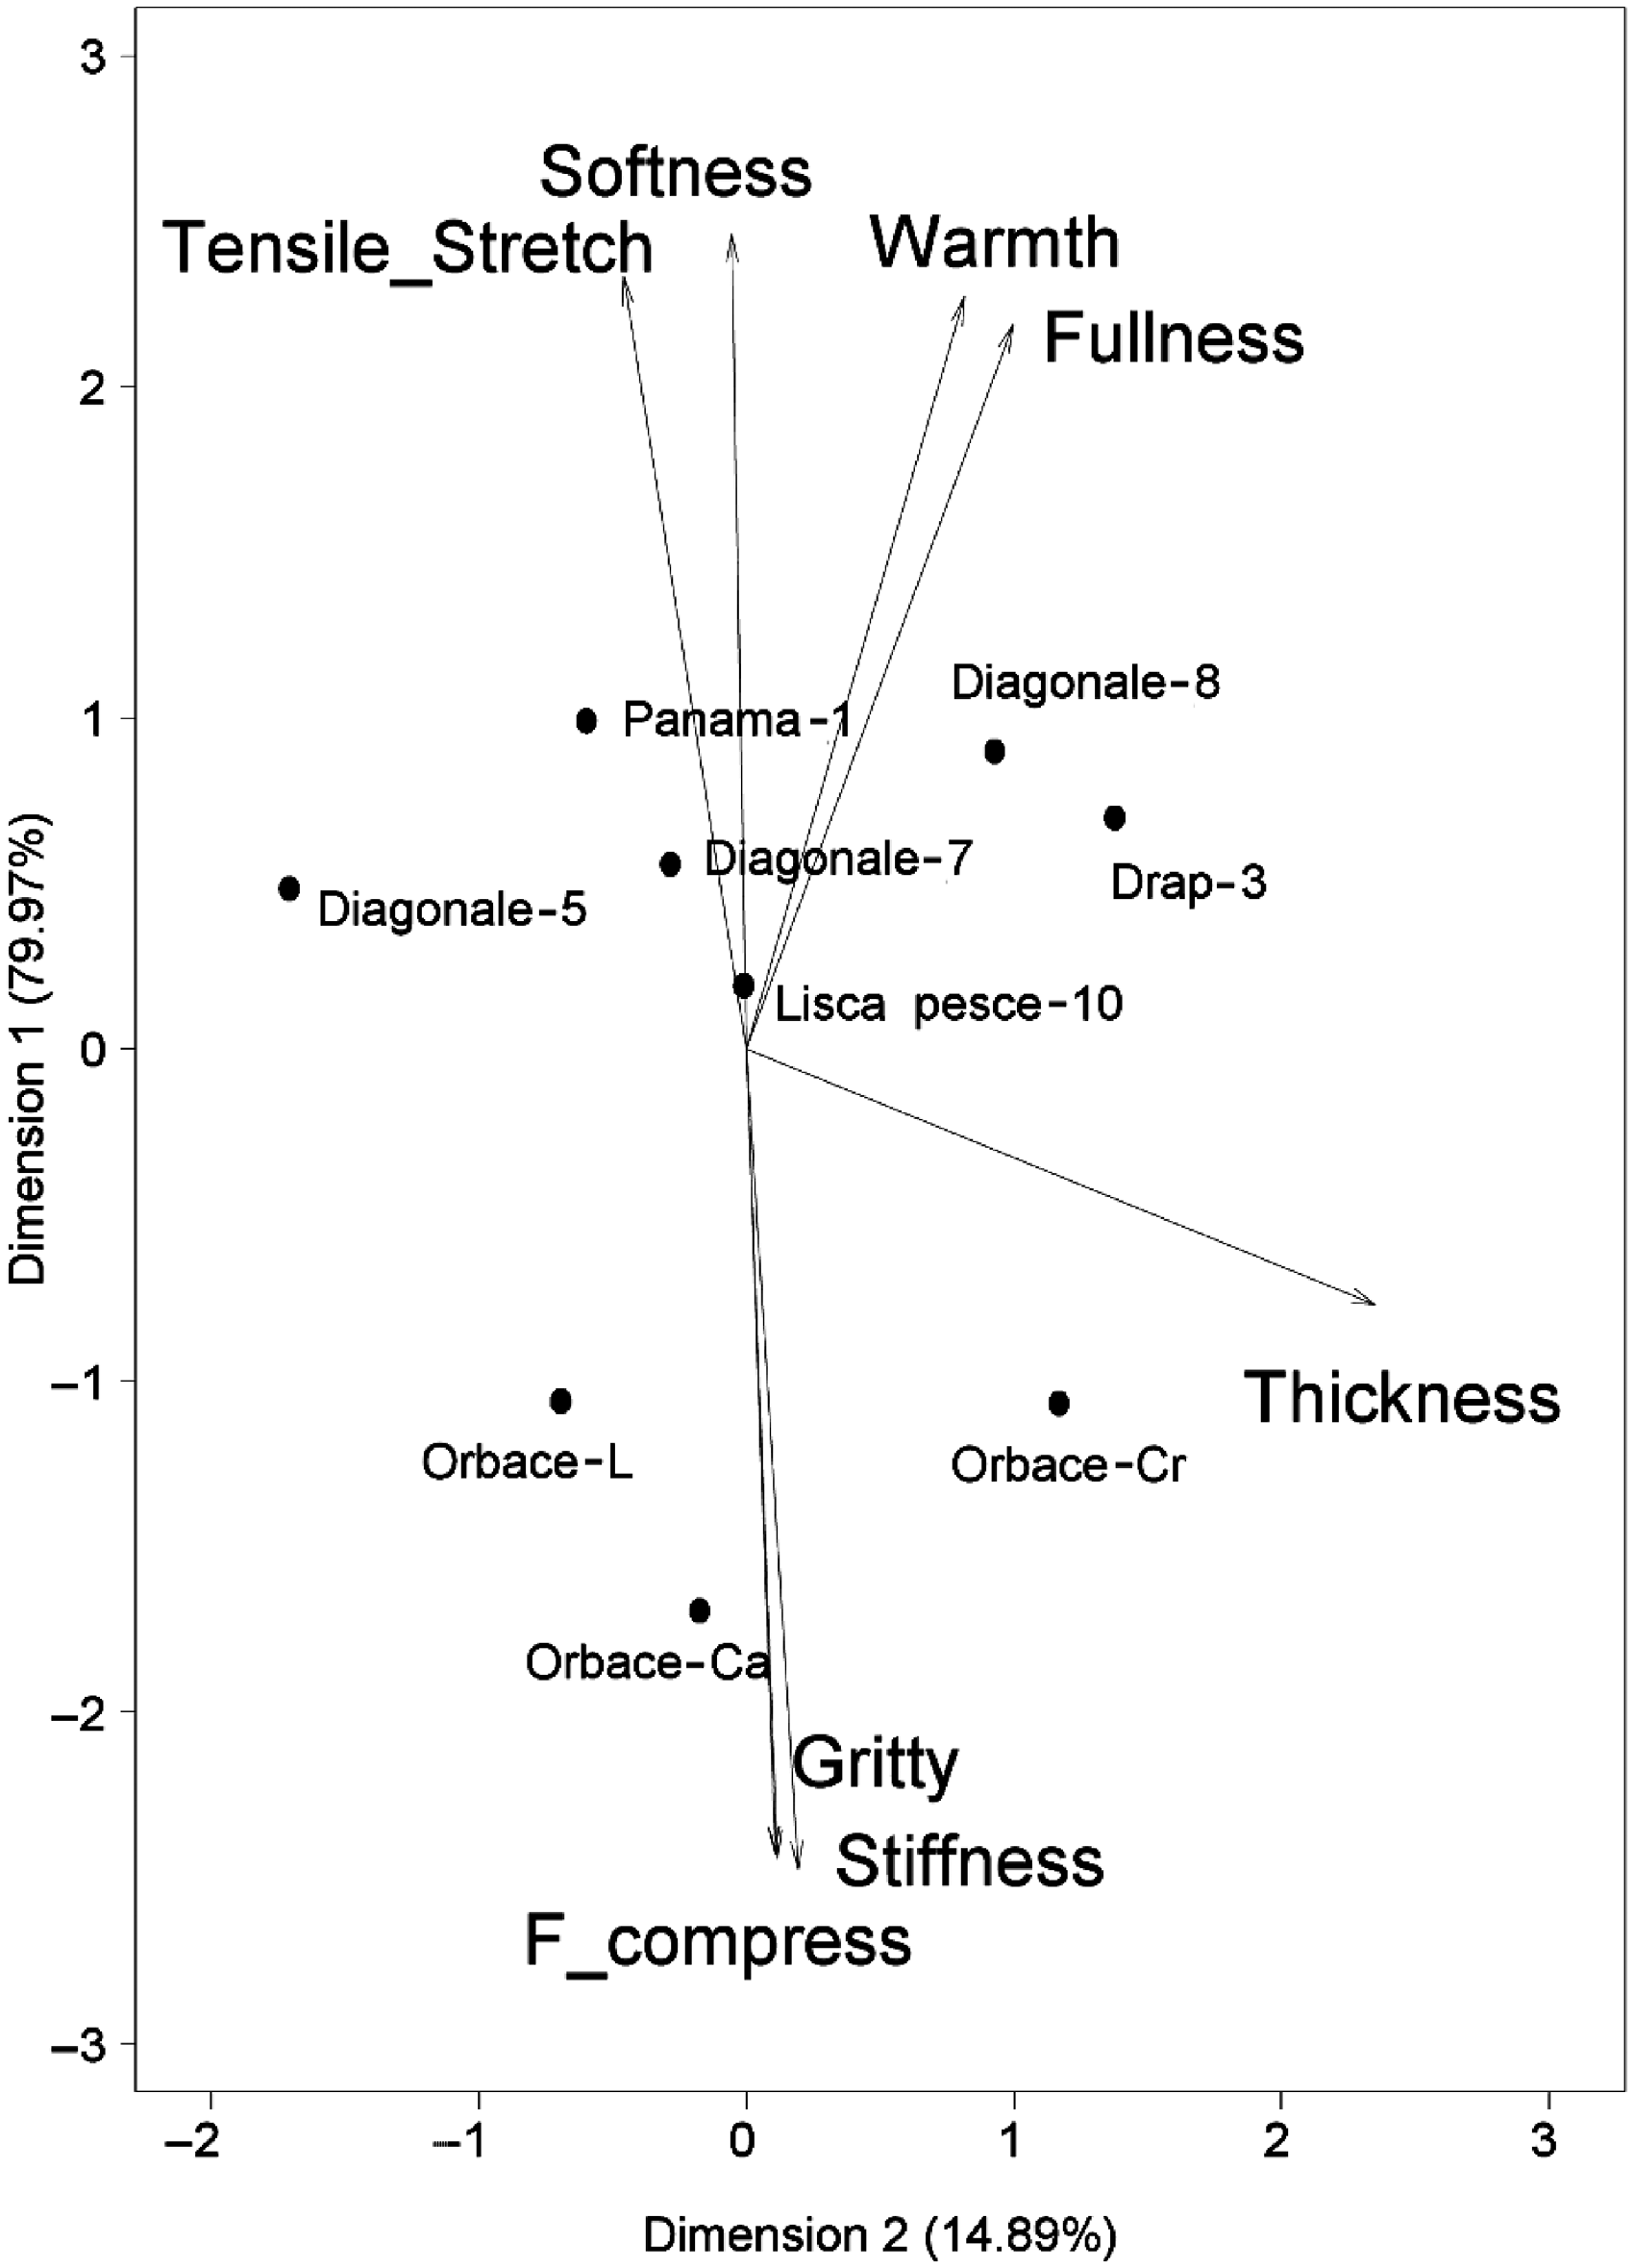
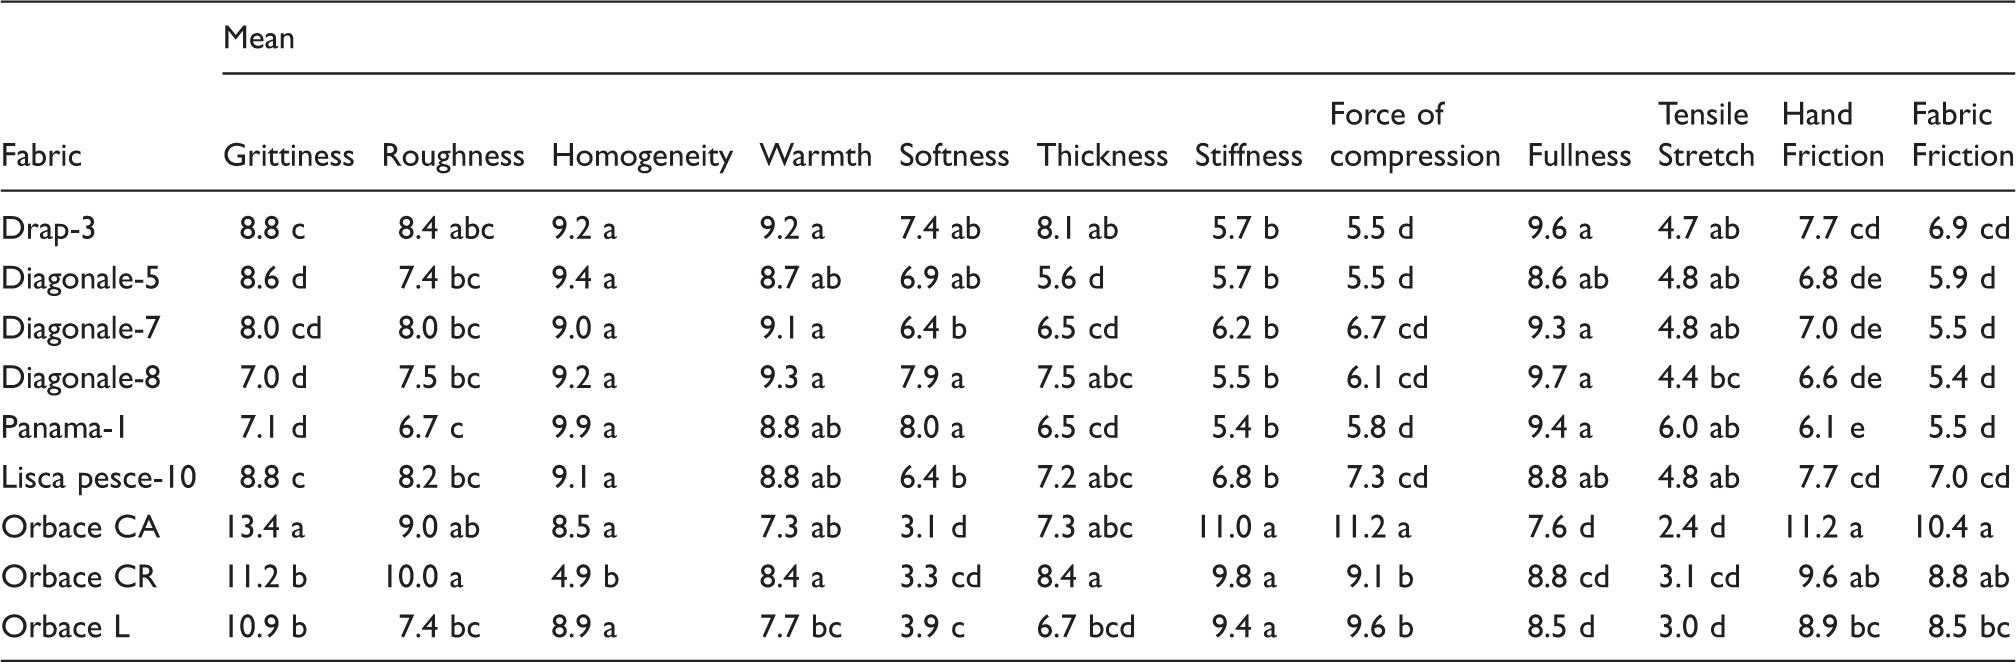
The three Orbace fabrics had statistically significant higher grittiness, stiffness, force of compression and lower softness as compared to the Tuscan Cloth tested. These differences can be mainly attributed to the presence of Comisana wool in the composition of the latter (Figure 1 and Table 4), and also to a different fabric structure.37 Orbace CA was evaluated to be significantly different as it was the grittiest and also had the highest values for force of compression. This is also related to the yarn count difference between warp (1/5300) and weft (1/4700) (Table 1). Sensory analysis has been reported to detect significant differences, as determined by yarn count, yarn torsion and fabric tightness.38 Jeguirim et al.22 pointed out that the more the yarn is coarse, the more the fabric is thick, heavy, rigid and less soft. Among fabrics obtained from Tuscan wools, Panama, Diagonale-8 and Diagonale-5 had a statistically significant lower grittiness as compared to Drap-3 and Lisca pesce-10. Panama and Diagonale-8 also had statistically significant higher values of softness than Lisca pesce-10 and Diagonale-7 (Table 4). Differences in touch feeling determined by fabric pattern construction have been reported, and include softness and slipperiness.37
Characterization of fabrics by Principal Component Analysis (PCA) on tactile sensory attributes.
One-way analysis of variance: mean scores of sensory tactile properties for wool fabrics (means with the same letter are not significantly different)
Fabric
Mean
Grittiness
Roughness
Homogeneity
Warmth
Softness
Thickness
Stiffness
Force of compression
Fullness
Tensile Stretch
Hand Friction
Fabric Friction
Drap-3
8.8 c
8.4 abc
9.2 a
9.2 a
7.4 ab
8.1 ab
5.7 b
5.5 d
9.6 a
4.7 ab
7.7 cd
6.9 cd
Diagonale-5
8.6 d
7.4 bc
9.4 a
8.7 ab
6.9 ab
5.6 d
5.7 b
5.5 d
8.6 ab
4.8 ab
6.8 de
5.9 d
Diagonale-7
8.0 cd
8.0 bc
9.0 a
9.1 a
6.4 b
6.5 cd
6.2 b
6.7 cd
9.3 a
4.8 ab
7.0 de
5.5 d
Diagonale-8
7.0 d
7.5 bc
9.2 a
9.3 a
7.9 a
7.5 abc
5.5 b
6.1 cd
9.7 a
4.4 bc
6.6 de
5.4 d
Panama-1
7.1 d
6.7 c
9.9 a
8.8 ab
8.0 a
6.5 cd
5.4 b
5.8 d
9.4 a
6.0 ab
6.1 e
5.5 d
Lisca pesce-10
8.8 c
8.2 bc
9.1 a
8.8 ab
6.4 b
7.2 abc
6.8 b
7.3 cd
8.8 ab
4.8 ab
7.7 cd
7.0 cd
Orbace CA
13.4 a
9.0 ab
8.5 a
7.3 ab
3.1 d
7.3 abc
11.0 a
11.2 a
7.6 d
2.4 d
11.2 a
10.4 a
Orbace CR
11.2 b
10.0 a
4.9 b
8.4 a
3.3 cd
8.4 a
9.8 a
9.1 b
8.8 cd
3.1 cd
9.6 ab
8.8 ab
Orbace L
10.9 b
7.4 bc
8.9 a
7.7 bc
3.9 c
6.7 bcd
9.4 a
9.6 b
8.5 d
3.0 d
8.9 bc
8.5 bc
PCA has been already applied in studies on textiles.22,25,39 This statistical technique offers a simple and reliable way to examine the correlations between variables. Furthermore, PCA allows a reduction in the dimension number of the representation. PCA shows how component 1 (explaining 80% of observed variance) has, on the one hand, stiffness, grittiness and force of compression, which are highly correlated with Orbace fabrics ( Figure 1). On the other hand, there are sensory attributes, such as fullness, warmth, softness and tensile stretch, which are highly correlated with fabrics derived from Tuscan wool, especially with Panama and Diagonale-8. Component 2 (explaining 15% of observed variance) is correlated to thickness, which separates the three Orbace fabrics and fabrics derived from Tuscan wool, in particular Diagonale-5, from Drap-3 and Diagonale-8 (Figure 1).
FAST analyses
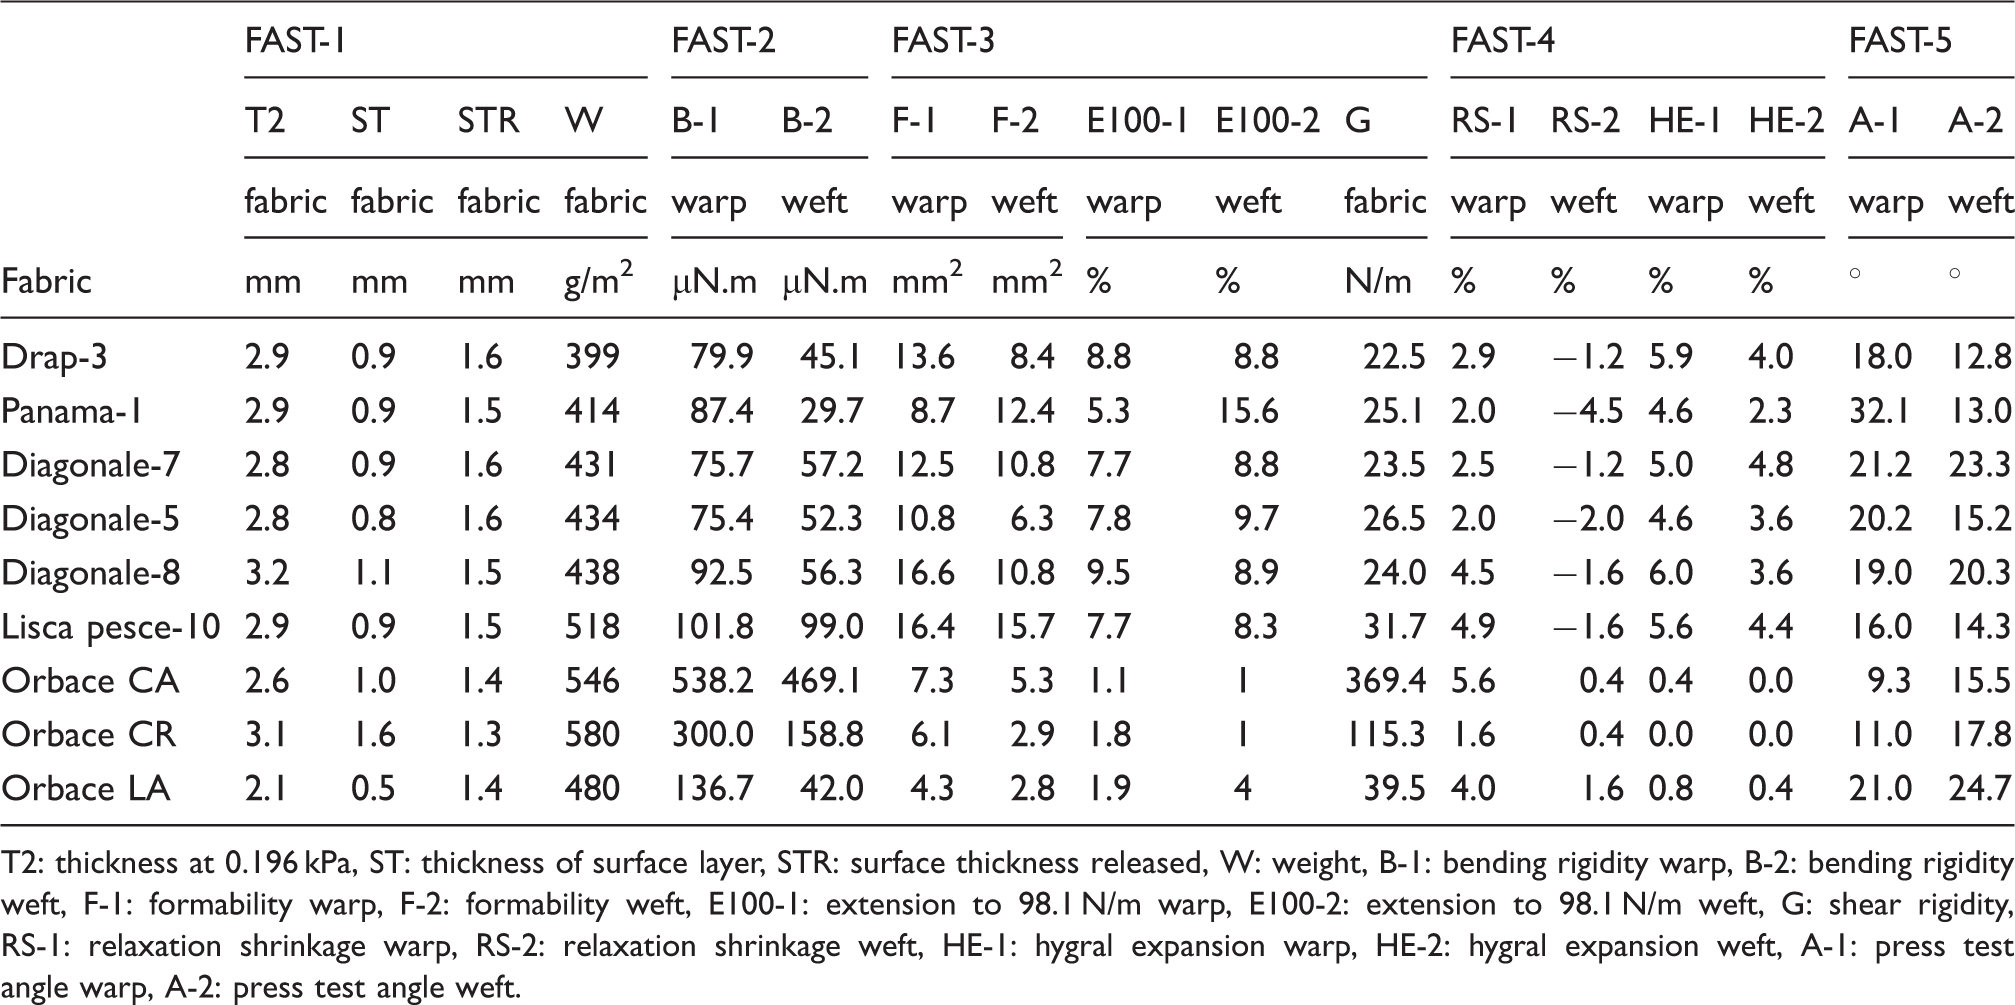
Orbace LA recorded the lowest values of T2 and ST, while Orbace CR had the highest ST and a T2 value of 3.1, inferior only to Diagonale-8. As related to weight, Drap-3 was the lighter fabric with 399 g/m2, while Orbace CR reached 580 g/m2 (Table 5). As regards the bending rigidity of warp and weft, the highest values were measured for Orbace CA with a B-1 about five times higher than that of other fabrics, excluding Orbace CA. Also as regards B-2, values measured for Orbace CR were 3–10 times higher than those measured for the other fabrics. FAST-3 measurements of extensibility gave the highest values for warp (F-1) to Diagonale-8 and Lisca pesce-10, while the three Orbaces had low values, showing a reduced formability. Measurements conducted on weft (F-2) confirmed the low values of Orbaces, but a low value was also recorded on Diagonale-5. Orbaces also showed the lowest values for extensibility of warp (E100-1) and weft (E100-2). Very high values of G were recorded for Orbace CA and Orbace CR. RS-1 ranged from 1.6 to 4.0 among the different fabrics; for RS-2 positive values were measured for Orbaces, while values were negative for all other fabrics. Orbaces recorded values lower than 1 for hygral expansion of warp (HE-1) and weft (HE-2), while values ranged from 3.6 to 6 for the other fabrics. FAST-5 measurements of press test angle evidenced a very high value for Panama-1 (Basket weave) wrap (A-1), while for weft (A-2) the highest values were recorded for Orbace LA and Diagonale 7 (Diagonal 7; Table 5).
Wool fabric properties measured using the Fabric Assurance by Simple Testing (FAST) system
CCA is a multivariate statistical technique used for studying the interrelationship between two sets of variables. It consists of the calculation of a number of independent canonical functions that maximize the correlation between canonical variates. An important feature of canonical correlation is that the canonical variates are derived to maximize their correlation. CCA has been successfully used on food and beverages to correlate sensory and instrumental analyses40–42 and appears to be a feasible tool to investigate the correlation between touch variables and FAST measurements. CCA was performed between instrumental data provided by each FAST instrument and sensory variables (SVs), after the selection, through PCA analysis, of the most correlated sensory traits.
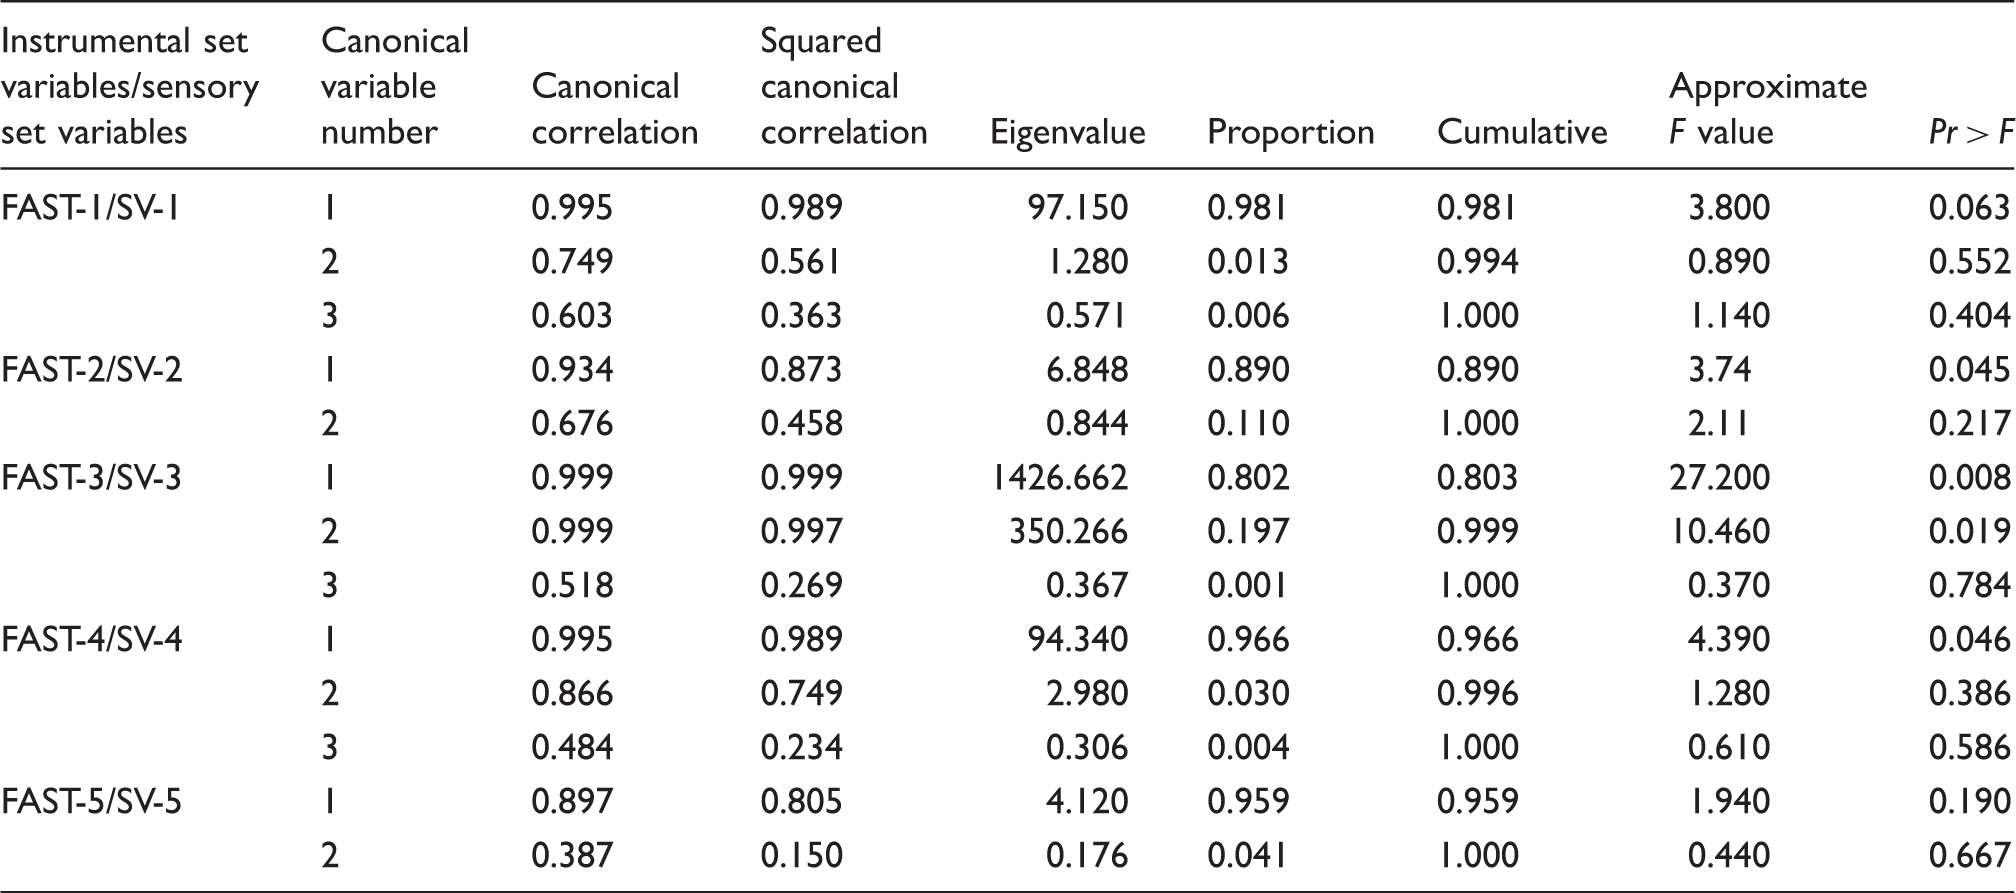
CCA was performed between FAST-1 instrumental measurements (F1-ST, F1-STR, F1-T2 and F1-W) and the set of sensory attributes (SV-1) providing the highest correlations (softness, thickness and force of compression). CCA indicated statistically significant multivariate relationships between the two sets of data. In particular, the first canonical correlation, 0.995, which appears to be substantially higher than any of the between-set correlations, reached statistical significance (p < 0.10) (Table 6). Relationships were investigated also between FAST-2 measurements (F2-B-1 and F2-B-2) and the set of selected sensory attributes (SV-2) (stiffness, fullness and force of compression); FAST-3 instrumental measurements (F3-F-1, F3-F-2, F3-E100-1, F3-E100-2 and F3-G) and the set of selected sensory attributes (SV-3) (force of compression, stiffness and tensile stretch); FAST-4 instrumental measurements (F4-RS-1, F4-RS-2, F4-HE-1 and F4-HE-2) and the set of selected sensory attributes (SV-4) (force of compression, fullness and stiffness); FAST-5 instrumental measurements (F5-A-1 and F5-A-2) and the set of selected sensory attributes (SV-5) (stiffness, force of compression and tensile stretch). The results of CCA indicated statistically significant multivariate relationships between the sets of data. In particular, the first canonical correlation for FAST-2/SV-2 is 0.934, which is higher than the other between-set correlations, and which reached statistical significance (p < 0.05). For FAST-3/SV-3 the first canonical correlation of 0.999, which appears to be substantially higher than any of the between-set correlations, reached statistical significance (p < 0.05). The second canonical correlation also reached statistical significance, but contributed only 19.7%, so we considered only the first canonical pair. For FAST-4/SV-4 the first canonical correlation of 0.995, which appears to be substantially higher than any of the between-set correlations, reached statistical significance (p < 0.05). For FAST-5/SV5 the first canonical correlation is 0.897, which would appear to be substantially higher than the other correlation. The probability level for the null hypothesis that all the canonical correlations are zero in the population is only 0.190, so no firm conclusions can be drawn. The remaining canonical correlations are not worthy of consideration, as can be seen from the probability levels and especially from the low adjusted canonical correlation (Table 6).
Canonical Correlation Analysis
Instrumental set variables/sensory set variables
Canonical variable number
Canonical correlation
Squared canonical correlation
Eigenvalue
Proportion
Cumulative
Approximate F value
Pr > F
FAST-1/SV-1
1
0.995
0.989
97.150
0.981
0.981
3.800
0.063
2
0.749
0.561
1.280
0.013
0.994
0.890
0.552
3
0.603
0.363
0.571
0.006
1.000
1.140
0.404
FAST-2/SV-2
1
0.934
0.873
6.848
0.890
0.890
3.74
0.045
2
0.676
0.458
0.844
0.110
1.000
2.11
0.217
FAST-3/SV-3
1
0.999
0.999
1426.662
0.802
0.803
27.200
0.008
2
0.999
0.997
350.266
0.197
0.999
10.460
0.019
3
0.518
0.269
0.367
0.001
1.000
0.370
0.784
FAST-4/SV-4
1
0.995
0.989
94.340
0.966
0.966
4.390
0.046
2
0.866
0.749
2.980
0.030
0.996
1.280
0.386
3
0.484
0.234
0.306
0.004
1.000
0.610
0.586
FAST-5/SV-5
1
0.897
0.805
4.120
0.959
0.959
1.940
0.190
2
0.387
0.150
0.176
0.041
1.000
0.440
0.667
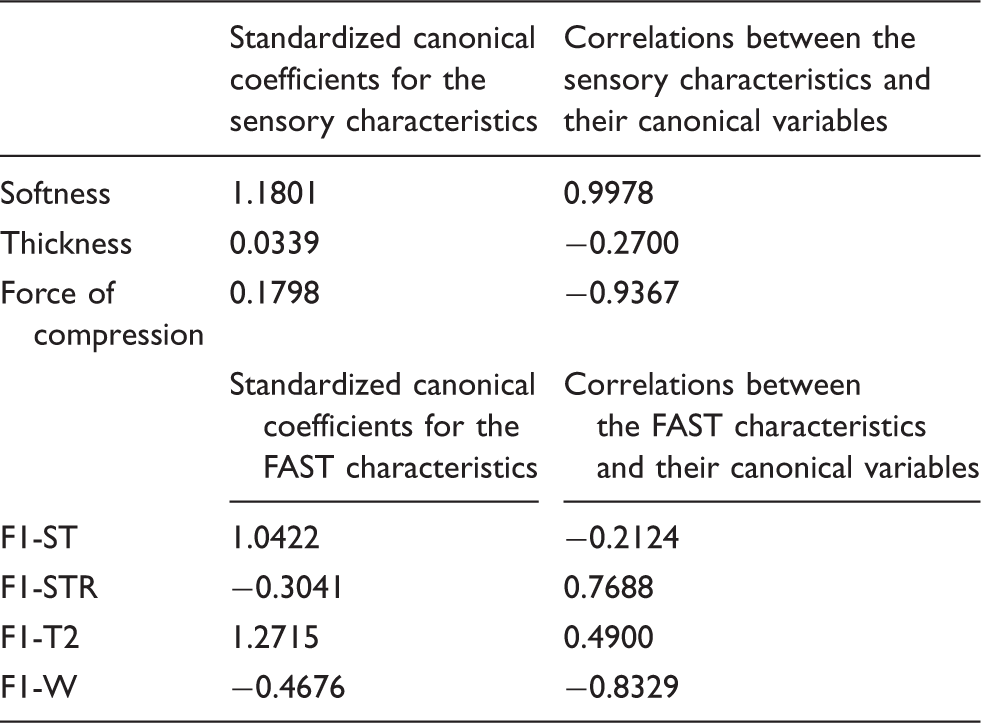
For FAST-1/SV-1, the standardized canonical coefficients (Table 7) show that the first canonical variable representing sensory evaluation is a weighted sum of softness (1.1801) and force of compression (0.1798) attributes, with the emphasis on softness. The coefficient for the attribute thickness is close to 0. The coefficients for the FAST characteristics variables show that F1-T2, F1-ST and F1-W contribute strongly to the FAST canonical variables (1.2715, 1.0422 and −0.4676, respectively). Correlations between the sensory characteristics and their canonical variables show that the softness variable is strongly associated with the sensory canonical variable, with a correlation of 0.9978. The variable force of compression is slightly less influential, which has a correlation with the canonical variable of −0.9367. Considering the opposite sign in the canonical coefficient and the correlation, the variable force of compression is considered a suppressor variable. Correlations between the instrumental measurements and their canonical variables show that F1-T2 is correlated (0.490) and F1-W is negatively correlated (−0.8329). F1-ST and F1-STR are also suppressor variables in the first FAST canonical variable. The canonical redundancy analysis indicates that the first pair of canonical variables is a good overall predictor of the opposite set of variables, the proportions of variance explained being 0.642 and 0.389. In particular, the squared multiple correlations indicate that the first canonical variable of the FAST characteristics has a predictive power for softness (0.985) and force of compression (0.868), but almost none for thickness (0.072). FAST-measured compression was highly correlated to hand-perceived softness.
FAST-1/SV-1: canonical correlation analysis and canonical structure of the first canonical variable
Standardized canonical coefficients for the sensory characteristics
Correlations between the sensory characteristics and their canonical variables
Softness
1.1801
0.9978
Thickness
0.0339
−0.2700
Force of compression
0.1798
−0.9367
Standardized canonical coefficients for the FAST characteristics
Correlations between the FAST characteristics and their canonical variables
F1-ST
1.0422
−0.2124
F1-STR
−0.3041
0.7688
F1-T2
1.2715
0.4900
F1-W
−0.4676
−0.8329
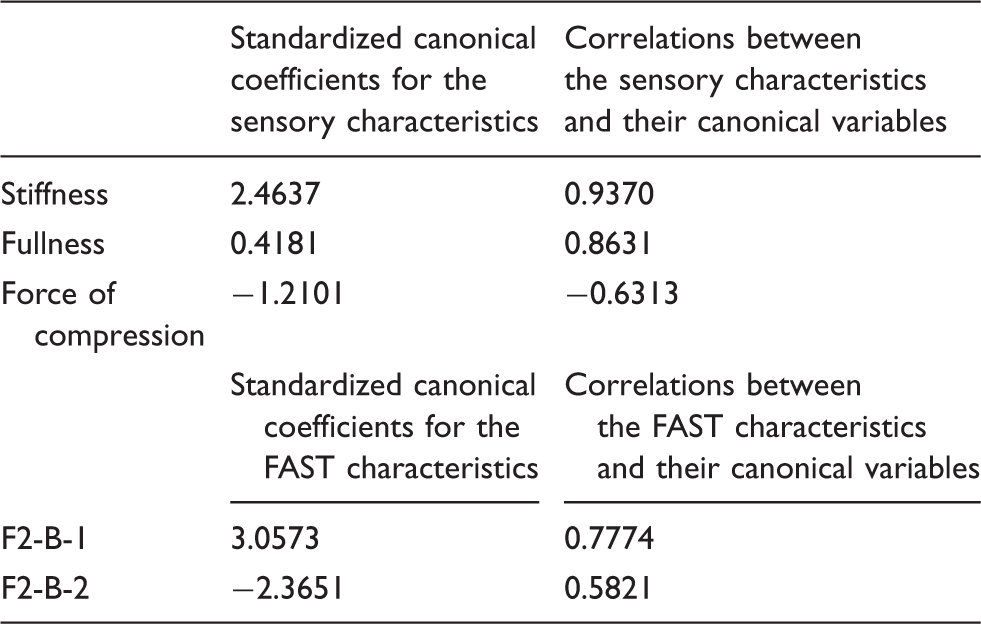
Concerning FAST-2/SV-2, the standardized canonical coefficients (Table 8) show that the first canonical variable representing sensory evaluation is a weighted sum of stiffness (2.4637) and force of compression (−1.2101) attributes, with the emphasis on stiffness. The coefficients for the FAST characteristic variables show that F2-B-1 and F2-B-2 contribute strongly to the FAST canonical variable (3.0573 and −2.3651, respectively). Correlations between the sensory characteristics and their canonical variables show that the stiffness and fullness variables are strongly associated with the sensory canonical variable, with correlations of 0.9370 and 0.8631, respectively. The variable force of compression is slightly less influential, which has a correlation with the canonical variable of −0.6313. Both instrumental measurements F2-B-1 (0.7774) and F2-B-2 (0.5821) are correlated to their canonical variables. Considering the opposite sign in the canonical coefficient and the correlation, the variable F2-B-2 is considered a suppressor variable. The canonical redundancy analysis shows that the first pair of canonical variables is a good overall predictor of the opposite set of variables, the proportions of variance explained being 0.588 and 0.412. In particular the squared multiple correlations indicate that the first canonical variable of the FAST characteristics has some predictive power for stiffness (0.766), force of compression (0.650) and for fullness (0.348). Bending measurements, obtained through FAST-2, showed high correlation with hand-determined stiffness and force of compression.
FAST-2/SV-2: canonical correlation analysis and canonical structure of the first canonical variable
Standardized canonical coefficients for the sensory characteristics
Correlations between the sensory characteristics and their canonical variables
Stiffness
2.4637
0.9370
Fullness
0.4181
0.8631
Force of compression
−1.2101
−0.6313
Standardized canonical coefficients for the FAST characteristics
Correlations between the FAST characteristics and their canonical variables
F2-B-1
3.0573
0.7774
F2-B-2
−2.3651
0.5821
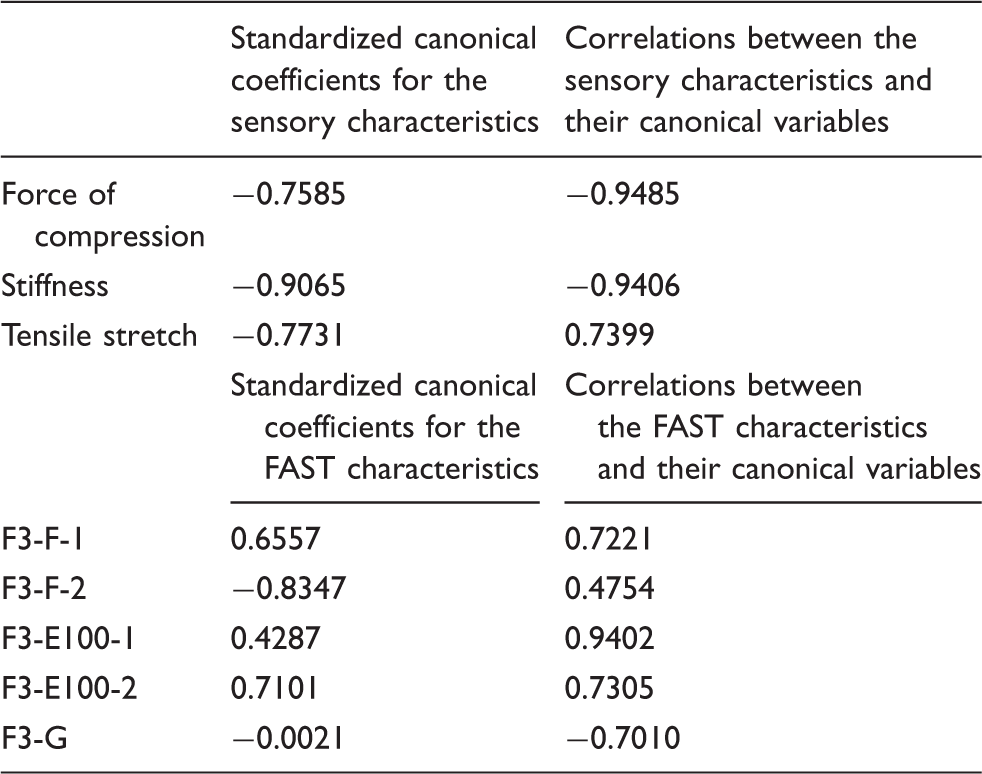
In relation to FAST-3/SV-3, the standardized canonical coefficients (Table 9) show that the first canonical variable representing sensory evaluation is a weighted sum of stiffness and force of compression (−0.9065 and −0.7585). The tensile stretch variable is considered a suppressor variable. The coefficients for the FAST characteristic variables show that F3-E100-2 and F3-F-1 contribute strongly to the FAST canonical variable (0.7101 and 0.6557, respectively). Correlations between the sensory characteristics and their canonical variables show that the forces of compression and stiffness variables are strongly associated with the sensory canonical variable, with correlations of −0.9485 and −0.9406, respectively. Correlations between the instrumental measurements and their canonical variables show that F3-E100-1, F3-E100-2 and F3-F-1 are correlated (0.9402, 0.7305 and 0.7221, respectively). Considering the opposite sign in the canonical coefficient and the correlation, the variable F3-F-2 is considered a suppressor variable. The canonical redundancy analysis shows that the first pair of canonical variables is a good overall predictor of the opposite set of variables, the proportions of variance explained being 0.777 and 0.531. In particular, the squared multiple correlations indicate that the first canonical variable of the FAST characteristics has some predictive power for force of compression (0.899), stiffness (0.884) and tensile stretch (0.547). Extension parameters measured as FAST-3 were expected to be correlated to tensile stretch. This was true only in part, since it was stiffness and force of compression that showed correlations with FAST-3 measurements.
FAST-3/SV-3: canonical correlation analysis and canonical structure of the first canonical variable
Standardized canonical coefficients for the sensory characteristics
Correlations between the sensory characteristics and their canonical variables
Force of compression
−0.7585
−0.9485
Stiffness
−0.9065
−0.9406
Tensile stretch
−0.7731
0.7399
Standardized canonical coefficients for the FAST characteristics
Correlations between the FAST characteristics and their canonical variables
F3-F-1
0.6557
0.7221
F3-F-2
−0.8347
0.4754
F3-E100-1
0.4287
0.9402
F3-E100-2
0.7101
0.7305
F3-G
−0.0021
−0.7010
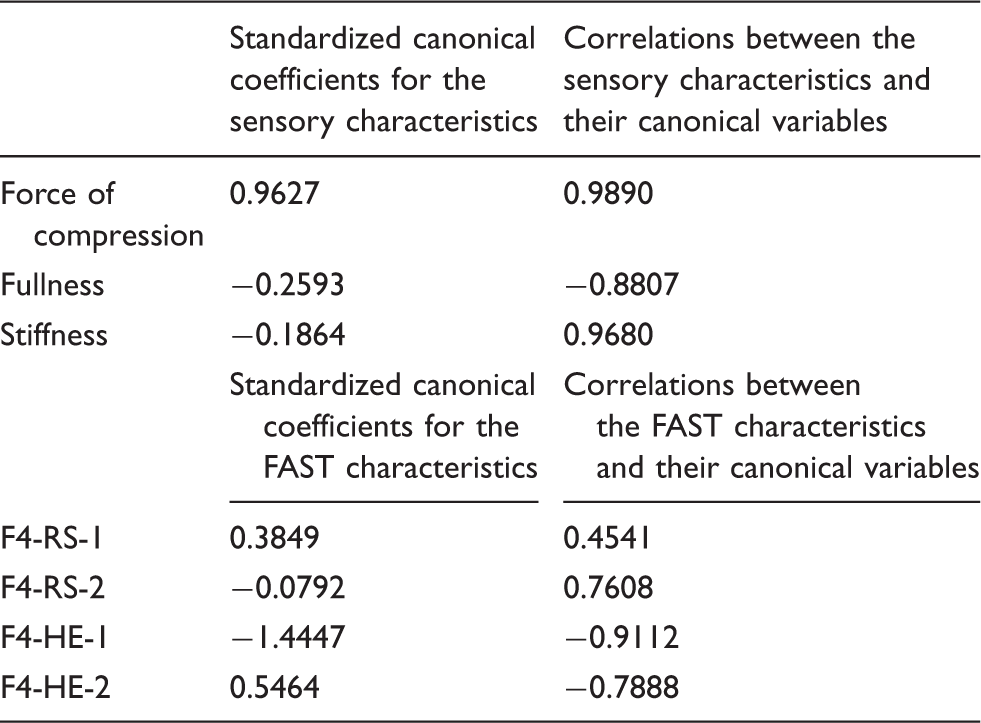
Regarding FAST-4/SV-4, the standardized canonical coefficients (Table 10) show that the first canonical variable representing sensory evaluation is a weighted sum of the force of compression (0.9627). The other variables are close to 0. The coefficients for the FAST characteristics variables show that F4-HE-1 contributes strongly to the FAST canonical variable (−1.4447). Correlations between the sensory characteristics and their canonical variables show that the force of compression is closely associated with the sensory canonical variable, with a correlation of 0.9890. Correlations between the instrumental measurements and their canonical variables show that F4-HE-1 is correlated (−0.9112). Considering the opposite sign in the canonical coefficient and the correlation, the variables F4-RS-2 and F4-HE-2 are considered suppressor variables. The canonical redundancy analysis shows that the first pair of canonical variables is a good overall predictor of the opposite set of variables, the proportions of variance explained being 0.887 and 0.553. In particular, the squared multiple correlations indicate that the first canonical variable of the FAST measurements has some predictive power for force of compression (0.968). As related to stability, measured by FAST-4, the highest correlation was found with force of compression.
FAST-4/SV-4: canonical correlation analysis and canonical structure of the first canonical variable
Standardized canonical coefficients for the sensory characteristics
Correlations between the sensory characteristics and their canonical variables
Force of compression
0.9627
0.9890
Fullness
−0.2593
−0.8807
Stiffness
−0.1864
0.9680
Standardized canonical coefficients for the FAST characteristics
Correlations between the FAST characteristics and their canonical variables
F4-RS-1
0.3849
0.4541
F4-RS-2
−0.0792
0.7608
F4-HE-1
−1.4447
−0.9112
F4-HE-2
0.5464
−0.7888
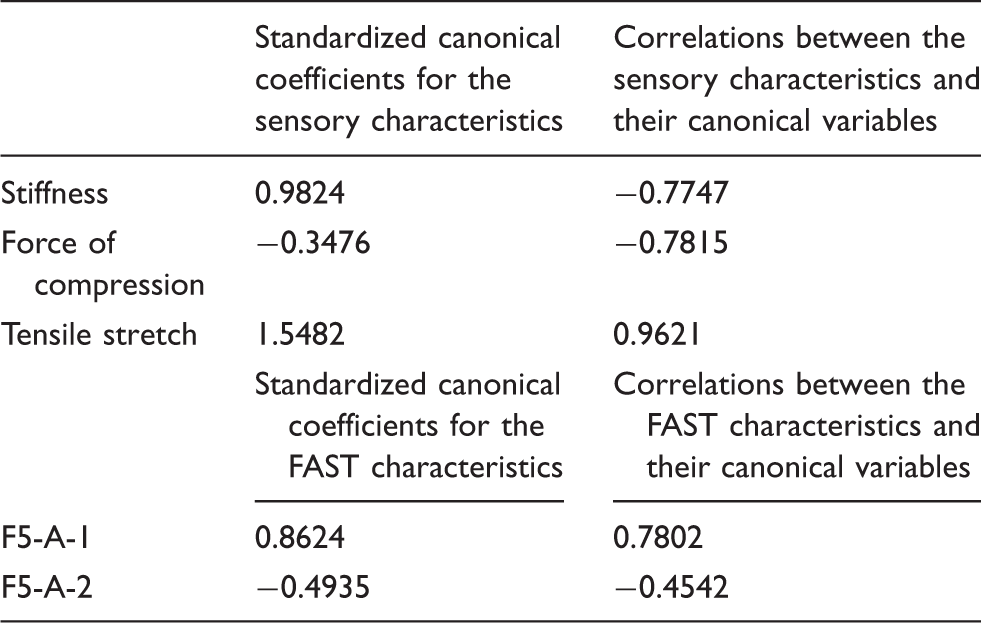
Finally, as regards FAST-5/SV-5, the standardized canonical coefficients (Table 11) show that the first canonical variable representing sensory evaluation is a weighted sum of the tensile stretch (1.5482) and stiffness (0.9824) attributes, with the emphasis on tensile stretch. The coefficients for the FAST characteristic variables show that F5-A-1 contributes strongly to the FAST canonical variable (0.8624). Correlations between the sensory characteristics and their canonical variables show that the tensile stretch variable is strongly associated with the sensory canonical variable, with a correlation of 0.9621. Correlations between the instrumental measurements and their canonical variables show that F5-A-1 is correlated (0.7802). Considering the opposite sign in the canonical coefficient and the correlation, the variable stiffness is considered a suppressor variable. The canonical redundancy analysis shows that the first pair of canonical variables is a good overall predictor of the opposite set of variables, the proportions of variance explained being 0.573 and 0.407. In particular, the squared multiple correlations indicate that the first canonical variable of the FAST characteristics has some predictive power for tensile stretch (0.7448). FAST-5 parameters showed a good correlation with hand-measured tensile stretch.
FAST-5/SV-5: canonical correlation analysis and canonical structure of the first canonical variable
Standardized canonical coefficients for the sensory characteristics
Correlations between the sensory characteristics and their canonical variables
Stiffness
0.9824
−0.7747
Force of compression
−0.3476
−0.7815
Tensile stretch
1.5482
0.9621
Standardized canonical coefficients for the FAST characteristics
Correlations between the FAST characteristics and their canonical variables
F5-A-1
0.8624
0.7802
F5-A-2
−0.4935
−0.4542
Among the sensory attributes measured, FAST was shown to be able to provide a good correlation with softness, stiffness, force of compression and tensile stretch. Mazzuchetti et al.31 found that FAST measurements that were mainly correlated to the tactile feeling called ‘the soft and warm feeling characteristic of pure wool or fabric of wool and other animal hair blends’, were the surface thickness ST, bending rigidity B and shear rigidity G. The FAST instrument ability to rank fabric according to softness, as perceived by the human hand, has also been reported.43
Conclusions
In this study sensory evaluation executed by a trained panel successfully defined touch traits of different wool fabrics. Among tested samples, Orbace, originating from Sardinian wool, had higher grittiness, stiffness, force of compression and hand friction and lower softness and tensile stretch, as compared to the fabrics obtained from Tuscan wools. Clear differences for key sensory traits were also recorded among fabrics of the same origin and raw material, but differing in weave. PCA indicated a high correlation for grittiness, stiffness and force of compression in one direction, tensile stretch, softness, warmth and fullness in the opposite, clearly discriminating in this dimension Orbaces and Tuscan Cloth fabrics. This discrimination mainly appears to be an effect of the wool used for the different fabrics. Thickness, as the key attribute of the second dimension, provided discriminations within groups and is reasonably perceived as an effect of different structures.
Correlations between instrumental and sensory data are commonly studied through CCA. However, this is the first report of an application of this statistical approach to textiles. CCA indicated that measurements performed with FAST were correlated with a number of basic touch traits, including softness, stiffness, force of compression and tensile stretch, which are all very useful parameters in order to control finishing and tailoring of fabrics. Furthermore, sensory analysis can find application in further steps: quantifying sensory traits and setting paths for the development of a language to describe fabrics for the benefit of producers, vendors, tailors and final consumers.
In the case of local wools, the characterization of traditional fabric traits is a contribution to territorial marketing development, aimed at supporting the sustainability of rural territories.
Miller23 asserted that, in order to satisfy the demand for textile goods from a changing marketplace, quality and standardization have been shifting progressively from the skilled hands of an individual, who could select by touch and experience to determine the suitability of the fabric for the desired design. This is also true for traditional fabrics, where the experience and practice of individuals should be replaced by trained sensory panels and specific instrumental measurements. Orbace and Tuscan fabrics’ handle definition will be of use to describe and protect original products. In this respect, sensory profiles can provide descriptors, possibly helping – that is, once they can be set into a code of practices and geographical indication (GI) – to limit attempts at imitation. As the new textile industry develops in terms of globalization and new virtual-environment applications demand for variety and personalization,6 sensory profiles could be of help in textile characterization and quality definition, also in terms of suitability of products for the local tradition. Thus, as an evaluation technique of tactile properties of fabrics, it can be useful for manufacturers in decision making during production, sourcing/buying and design of fabrics.11 In this respect, sensory analysis can also be a means to improve not only their own marketing strategies, but also geographical marketing of the rural areas where the studied fabrics come from (Tuscany and Sardinia). Other rural areas producing traditional wool fabrics, such as loden, casentino and drap, would also benefit from a more detailed characterization of their textile products for quality definition in terms of suitability of products for the local tradition and consumer demand.
Footnotes
Funding
This work was partially supported by the project Medlaine ‘À la recherche des couleurs et des tissus de la Méditerranée’ in the framework of the EU Cross-border IT-FR Maritime Programme (2007–2013) and was conceived in order to promote innovative actions supporting agricultural, craft textile manufacturing and tourism SMEs of some rural areas of Sardinia, Tuscany and Corsica.
References
1.
RielloG. Wool: products and markets, 13th-20th century, Schio, Valdagno, Follina and Biella. Textil Hist2003; 34: 82–83.
2.
FontanaLGRielloG. Seamless industrialization: the Lanificio Rossi and the modernization of the wool textile industry in nineteenth-century Italy. Textil Hist2005; 36: 168–195.
3.
LauTWHuiPCLNgFSF. A new fuzzy approach to improve fashion product development. Comput Ind2006; 57: 82–92.
4.
PanN. Quantification and evaluation of human tactile sense toward fabrics. Int J Des Nat2007; 1: 48–60.
5.
SülarVOkurA. Sensory evaluation methods for tactile properties of fabrics. J Sensory Stud2007; 22: 1–16.
6.
Schacher L, Bensaid S, Jeguirim SEG, et al. Sensory and physiological issues. In: Vassiliadis S (ed.) Advances in modern woven fabrics technology. InTech – Open Access Publisher, Rijeka (Croatia), 2011.
7.
GaravagliaC. Birra, identità locale e legame territoriale. Agriregionieuropa2010; 20: 96–99.
8.
WangN. Rethinking authenticity in tourism experience. Ann Tourism Res1999; 26: 349–370.
9.
YuYHuiCLPChoiTM. A new approach for fabric hand prediction with a nearest neighbor algorithm-based feature selection scheme. Textil Res J2010; 81: 574–584.
CivilleGVDusCA. Development of terminology to describe the handfeel properties of paper and fabrics. J Sensory Stud1990; 5: 19–32.
12.
SouffletICalonnierMDacremontC. A comparison between industrial experts’ and novices’ haptic perceptual organization: a tool to identify descriptors of the handle of fabrics. Food Qual Prefer2004; 15: 689–699.
13.
DacremontCSouffletI. Impact of fabric end-use knowledge on handle perception. Eur Rev Appl Psychol2006; 56: 273–277.
14.
PeirceFT. The ‘handle’ of cloth as a measurable quantity. J Textil Inst1930; 21: 377–416.
15.
KawabataSNiwaM. Clothing engineering based on objective measurement technology. Int J Clothing Sci Technol1998; 10: 263–272.
16.
De BoosA. Concepts and understanding of fabric hand. In: BeheryHM (ed.) Effect of mechanical and physical properties on fabric hand. Cambridge: Woodhead Publishing Limited, 2005, pp. 11–44.
17.
Pan N, Yen KC, Zhao ST, et al. A new approach to the objective evaluation of fabric handle from mechanical properties. Textil Res J, 1988, 58: 565-571.
18.
EL MogahzyYEKilincFSHassanM. Developments in measurement and evaluation of fabric hand. In: BeheryHM (ed.) Effect of mechanical and physical properties on fabric hand. Cambridge: Woodhead Publishing Limited, 2005, pp. 45–65.
19.
AncutieneKStradzieneENesterovaA. The relationship between fabrics bending rigidity parameters defined by KES-F and FAST equipment. Mater Sci (Medziagotyra)2010; 16: 346–352.
20.
LyNGTesterDHBuckenhamP. Simple instruments for quality control by finishers and tailors. Textil Res J1991; 61: 402–406.
21.
StyliosGK. New measurement technologies for textiles and clothing. Int J Clothing Sci Technol2005; 17: 135–149.
22.
JeguirimSEDhouibABSahnounM. Sensory and instrumental techniques evaluating the effect of structure parameters on the tactile properties of knitted fabrics. J Texture Stud2010; 41: 714–735.
23.
MillerJ. In pursuit of quality - the volume control for fabric goods is getting out of hand. J Consum Stud Home Econ1998; 22: 191–198.
24.
MackayCAnandSCBishopDP. Effects of laundering on the sensory and mechanical properties of 1x1 rib knitwear fabrics. Part II: changes in sensory and mechanical properties. Textil Res J1999; 64: 252–260.
25.
JeguirimSEDhouibABSahnounM. The tactile sensory evaluation of knitted fabrics: effect of some finishing treatments. J Sensory Stud2009; 25: 201–215.
26.
PhilippeFSchacherLAdolpheD. Tactile feeling: sensory analysis applied to textile goods. Textil Res J2004; 74: 1066–1072.
27.
CardelloAVSchutzHGWinterhalterCA. Prediction of the handfeel comfort of military clothing fabrics from sensory and instrumental data: development and application of psychophysical methods. Textil Res J2003; 73: 221–237.
28.
Sztandera LM. Predicting tactile fabric comfort from mechanical and handfeel properties using regression analysis. In: proceedings of the 8th WSEAS international conference on applied computer science (ACS'08), pp.217-220.
29.
VassiliadisSRangoussiMCayA. Artificial neural networks and their applications in the engineering of fabrics. In: DubrovskiPD (ed.) Woven fabric engineering. Croatia: Sciyo, 2010, pp. 111–134.
30.
RombaldoniFDemichelisRMazzuchettiG. Prediction of human psychophysical perception of fabric crispness and coolness hand from rapidly measurable low-stress mechanical and thermal parameters. J Sensory Stud2010; 25: 899–916.
31.
MazzuchettiGDemichelisRBianchetto SongiaM. Objective measurement of tactile sensitivity related to a feeling of softness and warmth. Fibres Textil East Eur2008; 16: 67–71.
32.
GriffithsPKulkeT. Clothing movement – visual sensory evaluation and its correlation to fabric properties. J Sensory Stud2002; 17: 229–255.
33.
BishopDP. Fabric sensory and mechanical properties. Textil Prog1996; 26: 5–27.
RencherAC. Interpretation of canonical discriminant functions, canonical variates and principal components. Am Statistician1992; 3: 217–225.
36.
SimonZVigh-SmellerMPeragovicsA. Relating the shape of protein binding sites to binding affinity profiles: is there an association?. BMC Struct Biol2010; 10: 32–32.
37.
BensaidSOsselinJ-FSchacherL. The effect of pattern construction on the tactile feeling evaluated through sensory analysis. J Textil Inst2006; 97: 137–145.
38.
Pense-LheritierAMGuilabertCBuenoMA. Sensory evaluation of the touch of a great number of fabrics. Food Qual Prefer2006; 17: 482–488.
39.
Agraval G, Koehl L and Perwuelw A. Influence of textile parameters and ageing on consumer behaviour. In: KEER 2010, PARIS international conference on kansei engineering and emotion research, 2010, http://pie.kansei.tsukuba.ac.jp/keer2010/Papers/0946.pdf.
40.
DijksterhuisG. Multivariate data analysis in sensory and consumer science: An overview of developments. Trends Food Sci Technol1995; 6: 206–211.
41.
RasonJMartinJ-FDufourE. Diversity of the sensory characteristics of traditional dry sausages from the centre of France: relation with regional manufacturing practice. Food Qual Prefer2007; 18: 517–530.
42.
RudnitskayaAPolshinEKirsanovD. Instrumental measurement of beer taste attributes using an electronic tongue. Anal Chim Acta2009; 646: 111–118.
43.
ZhangPLiuXWangL. An experimental study on fabric softness evaluation. Int J Clothing Sci Technol2006; 18: 83–95.